-
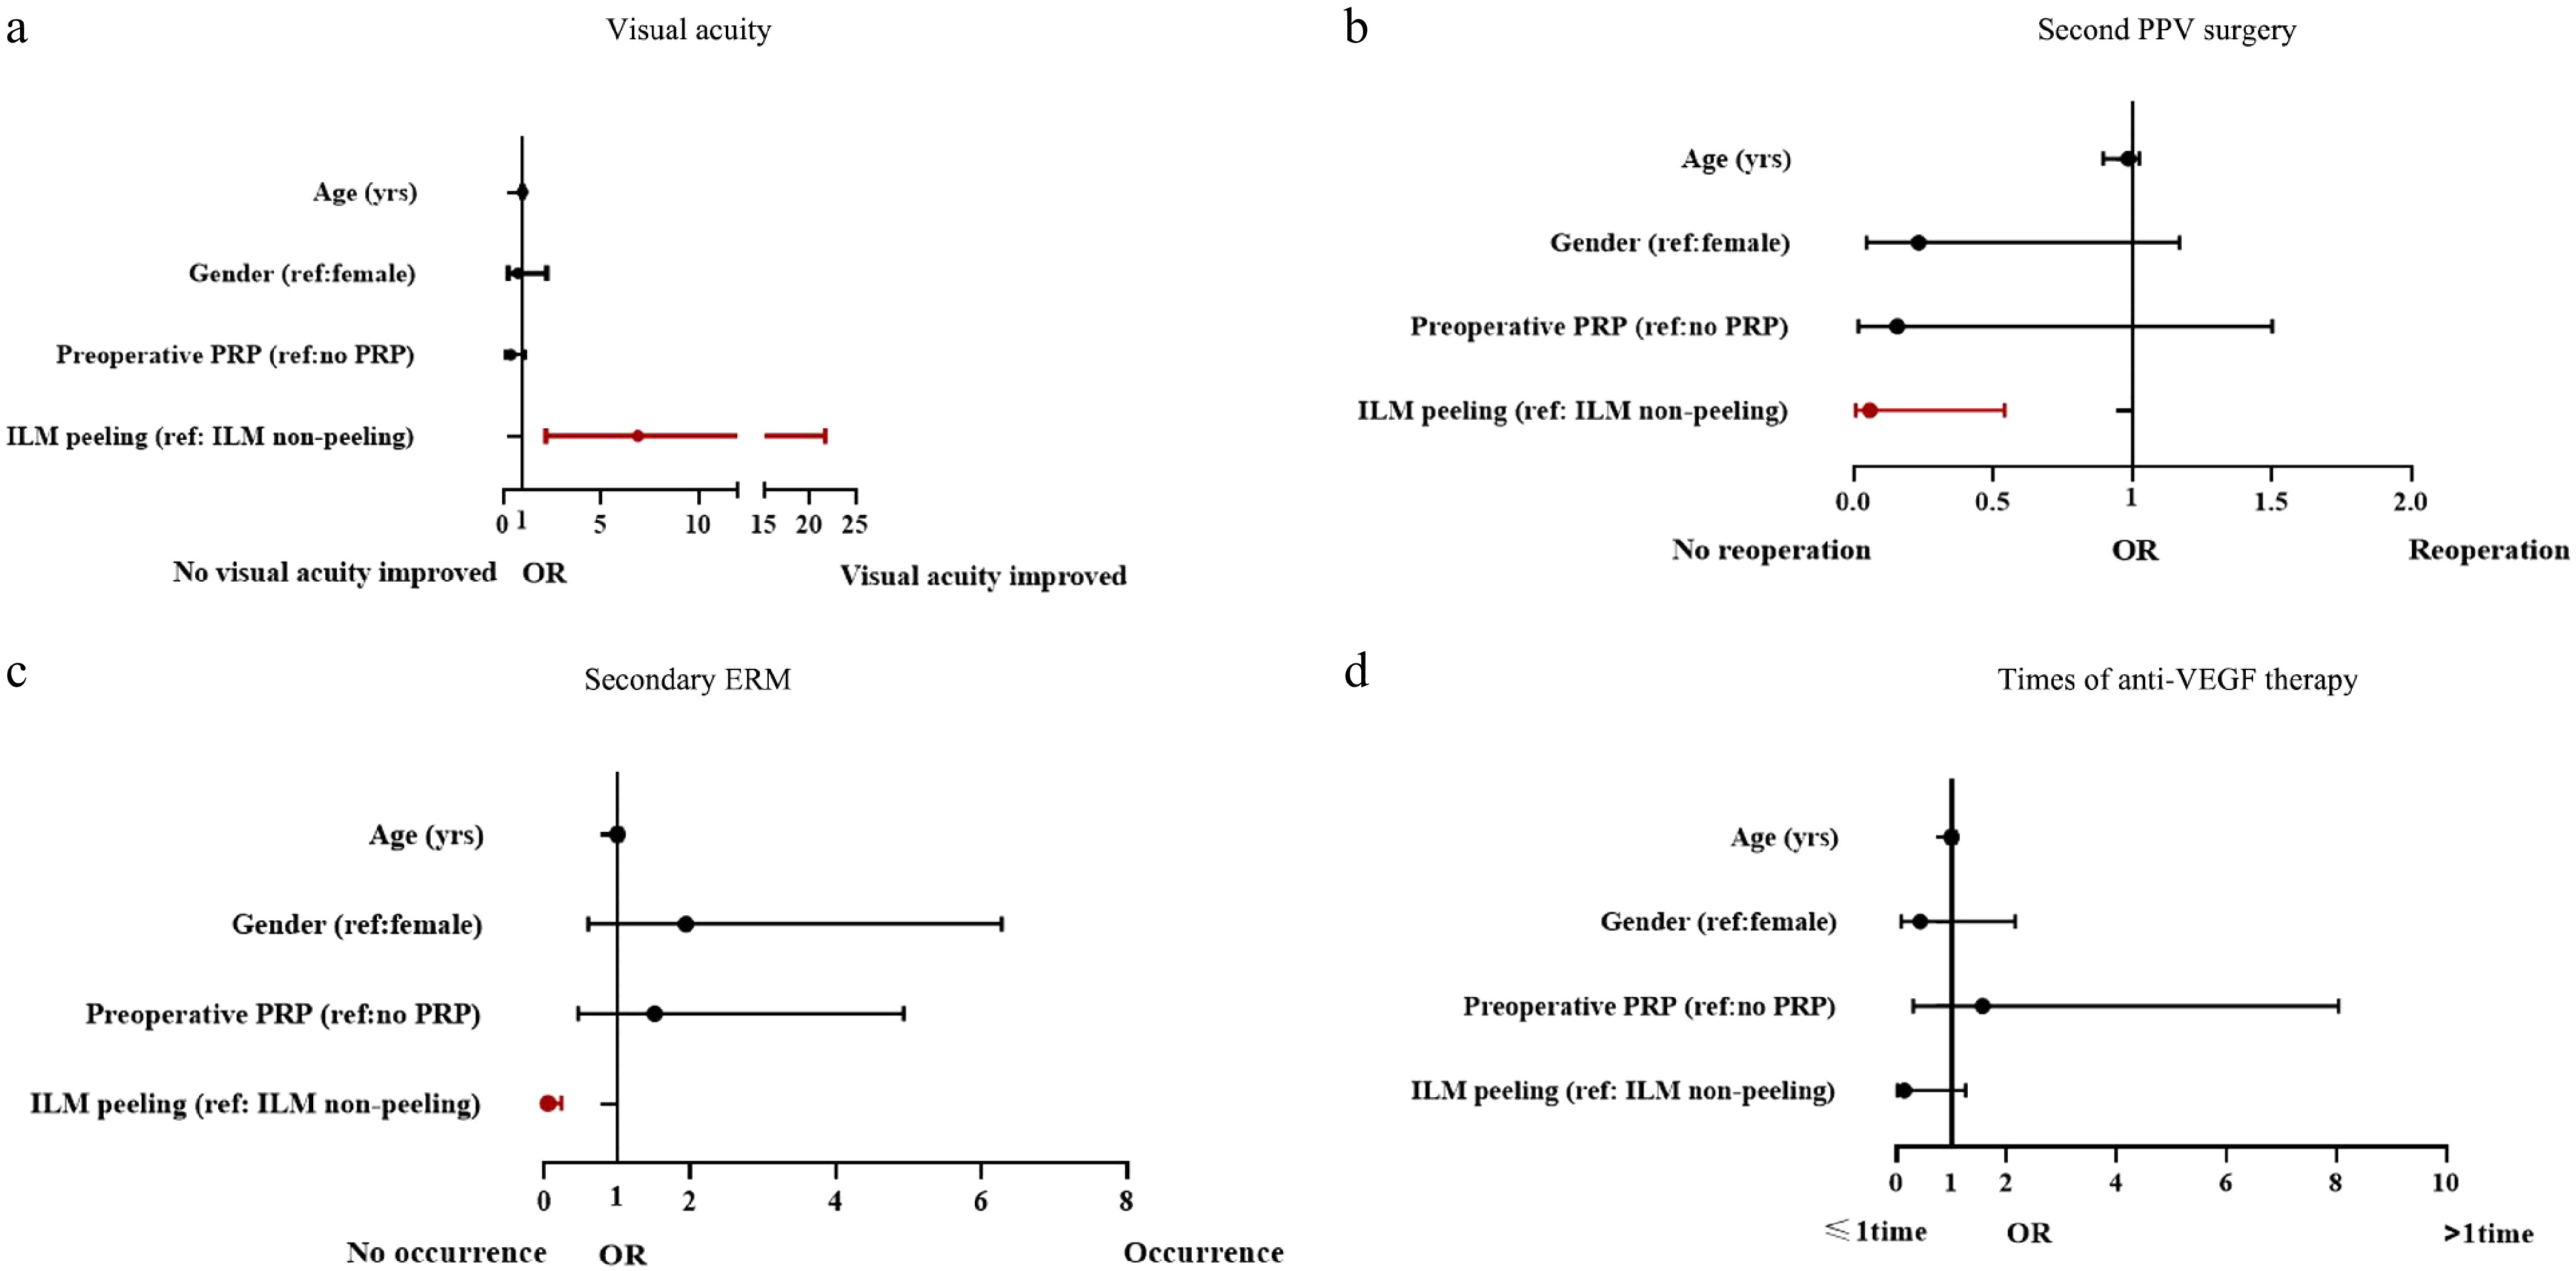
Figure 1.
Multivariable logistic regression model for (a) postoperative parameter visual acuity, (b) second PPV surgery, (c) secondary ERM, and (d) times of anti-VEGF therapy.
-
Group A with
ILM peeling
(n = 44)Group B without ILM peeling
(n = 44)p value Age (years)* 50.66 ± 11.27 52.41 ± 11.12 0.465† Sex (Male: Female) 26:18 27:17 0.828‡ Preoperative logMAR BCVA (Snellen equivalent)# 2.6 (1.2, 2.7), FC 2.6 (1.5, 2.7), FC 0.844§ Preoperative IOP, mmHg# 13.0 (12.0, 16.4) 14.0 (11.5, 18.3) 0.549§ Preoperative PRP (%) 14 (31.82%) 15 (34.09%) 0.821‡ Number and rate of pathologies VH 18 (40.91%) 19 (43.18%) 0.829‡ VH + TRD 19 (43.18%) 25 (56.82%) 0.201‡ VH + ERM 7 (15.91%) 0 0.018& VH + TRD + ERM 0 0 NA * Mean ± SD. # Medians and quartiles. ILM: internal limiting membrane; logMAR: logarithm of the minimal angle of resolution; BCVA: best-corrected visual acuity; IOP: intraocular pressure; PRP: panretinal photocoagulation; VH: vitreous hemorrhage; TRD: tractional retinal detachment; ERM: epiretinal membrane; FC: finger count; NA: not available; SD: standard deviation. † t-test. ‡ Chi-square test. § Mann-Whitney U test. & Fisher's exact test. Table 1.
Demographic and baseline characteristics of the patients.
-
Group A with
ILM peeling
(n = 44)Group B without
ILM peeling
(n = 44)p value Postoperative logMAR BCVA (Snellen equivalent)# 0.8 (0.5, 1.3), 20/400 1.7 (1.0, 2.6), 20/1000 < 0.001§ The improvement of
logMAR BCVA#−1.18 (−1.7, −0.2) −0.1 (−1.3, 0) 0.003§ The improvement of BCVA (%) 37/44 (84.1%) 24/44 (54.5%) < 0.01‡ Postoperative BCVA > 0.52 logMAR (20/67 Snellen equivalents) (%) 9/44 (20.5%) 4/44 (9.1%) 0.133‡ # medians and quartiles. logMAR: logarithm of the minimal angle of resolution; BCVA: best-corrected visual acuity; ‡ Chi-square test. § Mann-Whitney U test. Table 2.
Comparison of visual outcomes at 12 month follow-ups.
-
Group A with
ILM peeling
(n = 44)Group B without
ILM peeling
(n = 44)p value Secondary macular ERM (%) 2 (4.5%) 21 (47.7%) < 0.001‡ Early vitreous hemorrhage (%) 6 (13.6%) 10 (22.7%) 0.269‡ IOP elevation (%) 5 (11.4%) 11 (25.0%) 0.097‡ ERM: epiretinal membrane. IOP: intraocular pressure; ‡ Chi-square test. Table 3.
Postoperative complications of patients.
-
Group A with
ILM peeling
(n = 44)Group B without
ILM peeling
(n = 44)p value Anti-VEGF injection (%) One or more times 10 (22.7%) 16 (36.4%) 0.161‡ One time 9 (20.5%) 10 (22.7%) 0.568‡ Two or more times 1 (2.3%) 6 (13.6%) 0.049‡ Postoperative IOP, mmHg# One week postoperatively 15.5 (11.6, 18.4) 15.0 (13.0, 18.7) 0.726§ One month postoperatively 14.8 (12.0, 16.5) 13.5 (12.0, 16.9) 0.604§ Six months postoperatively 15.5 (13.0, 17.7) 15.3 (13.0, 18.0) 0.805§ Another PPV surgery (%) 1 (2.3%) 9 (20.5%) 0.007‡ # Medians and quartiles. IOP: intraocular pressure. ‡ Chi-square test. § Mann-Whitney U test. Table 4.
Comparison of postoperative characteristics for patients.
-
Postoperative parameters Factor OR, 95%CI p value Second PPV surgery Age 0.96 (0.90–1.03) 0.212 Gender 0.23 (0.05–1.17) 0.077 Preoperative PRP 0.16 (0.02–1.50) 0.108 ILM peeling 0.06 (0.01–0.54) 0.013 Visual acuity Age 0.98 (0.94–1.03) 0.453 Gender 0.76 (0.26–2.23) 0.623 Preoperative PRP 0.39 (0.13–1.14) 0.085 ILM peeling 6.90 (2.20–21.69) < 0.001 Secondary ERM Age 1.00 (0.95–1.06) 0.894 Gender 1.95 (0.60–6.28) 0.266 Preoperative PRP 1.51 (0.46–4.93) 0.493 ILM peeling 0.05 (0.01–0.24) < 0.001 Times of anti-VEGF therapy Age 1.00 (0.93–1.08) 0.979 Gender 0.43 (0.09–2.16) 0.304 Preoperative PRP 1.57 (0.31–8.04) 0.591 ILM peeling 0.14 (0.02–1.26) 0.08 ILM: internal limiting membrane; PPV: pars plana vitrectomy; PRP: panretinal photocoagulation; OR: odds ratio; CI: confidence interval Table 5.
Multivariate logistic regression for postoperative parameters.
Figures
(1)
Tables
(5)