-
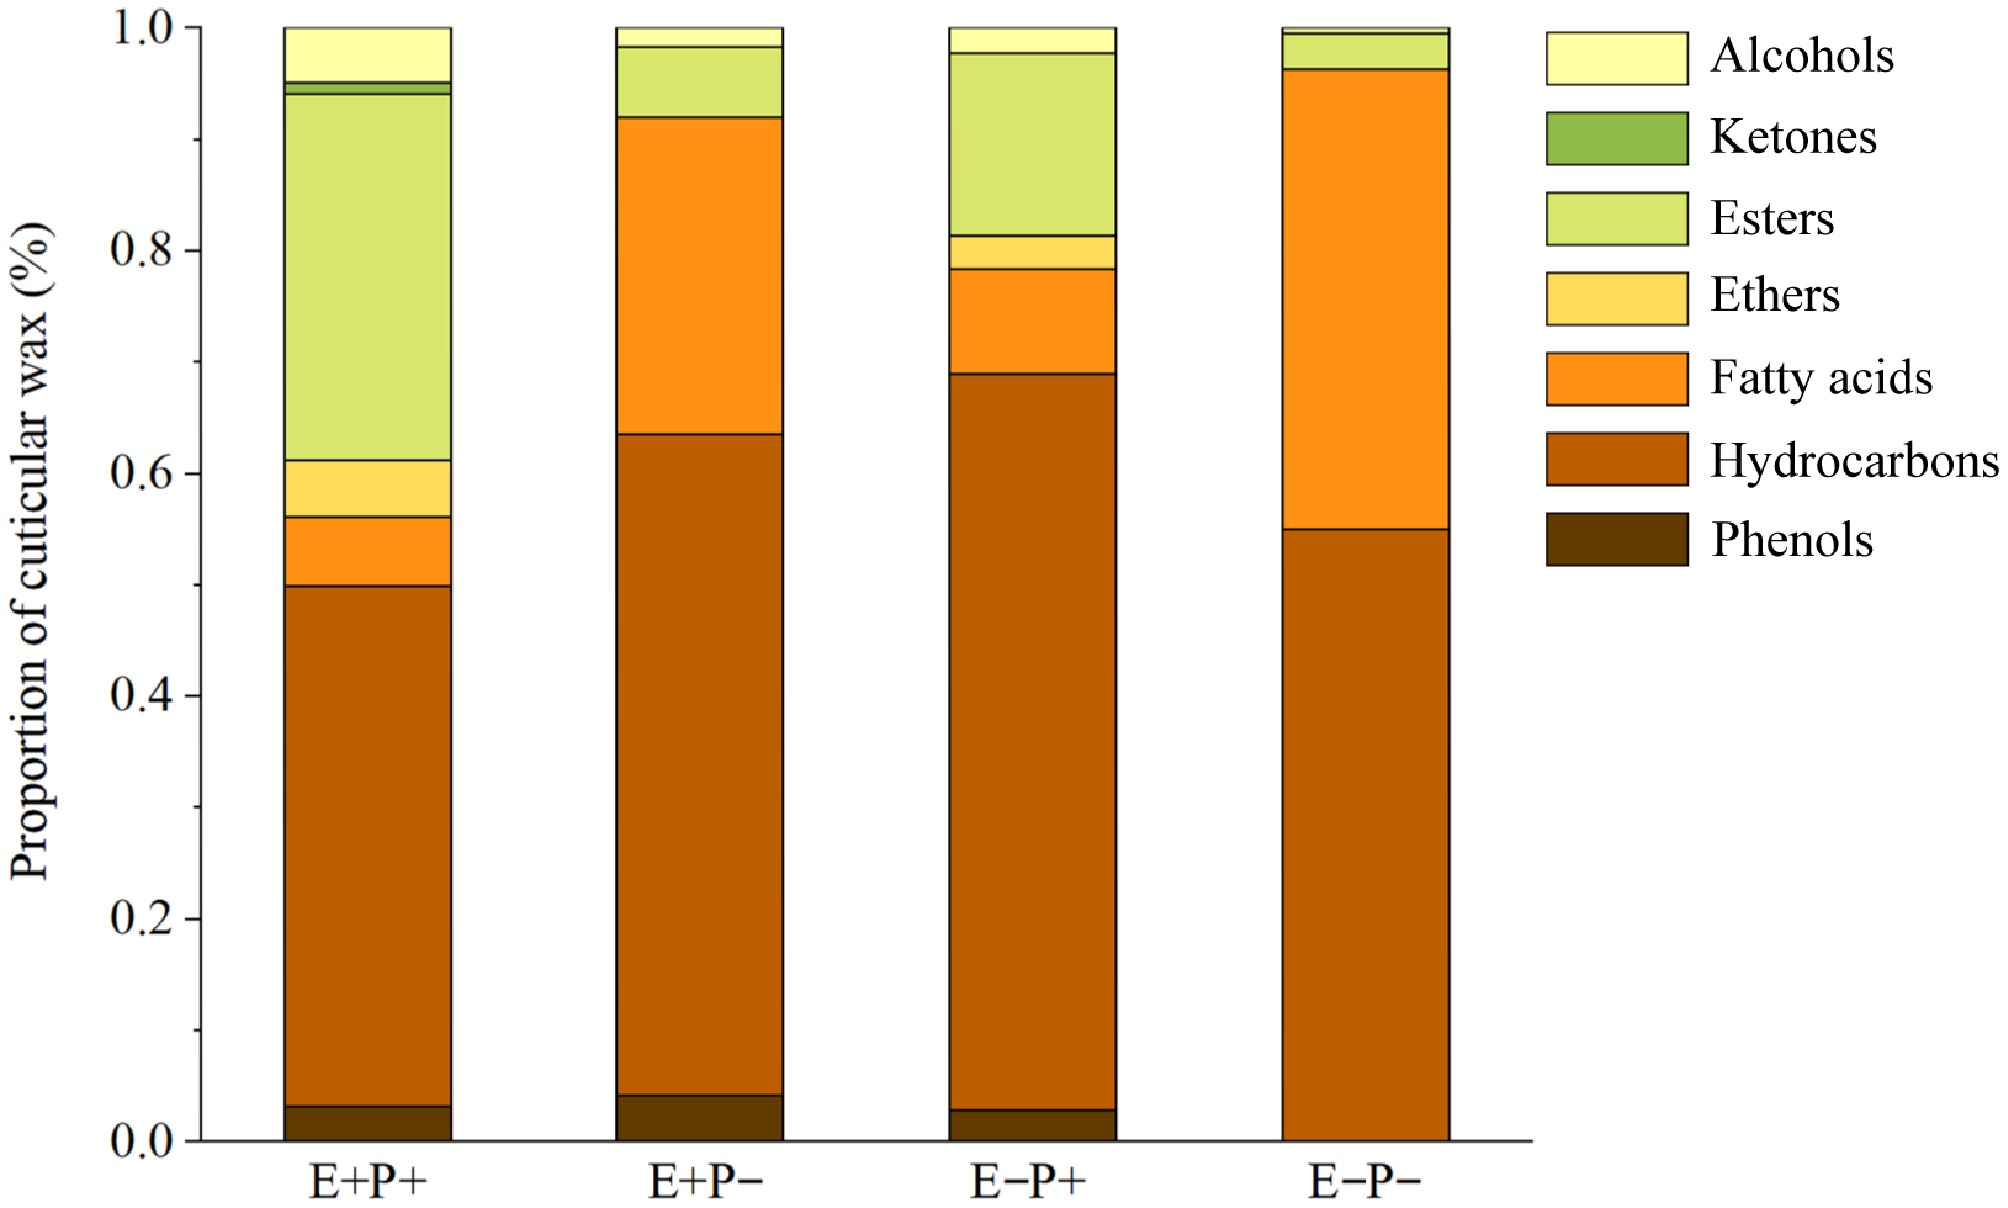
Figure 1.
Effects of Epichloë endophyte and B. graminis treatments on the composition and proportion of cuticular wax of the leaves of A. inebrians. Note: E+: Epichloë endophyte-infected, E−: Epichloë endophyte-free, P+: pathogen-inoculated, P−: non-inoculated.
-
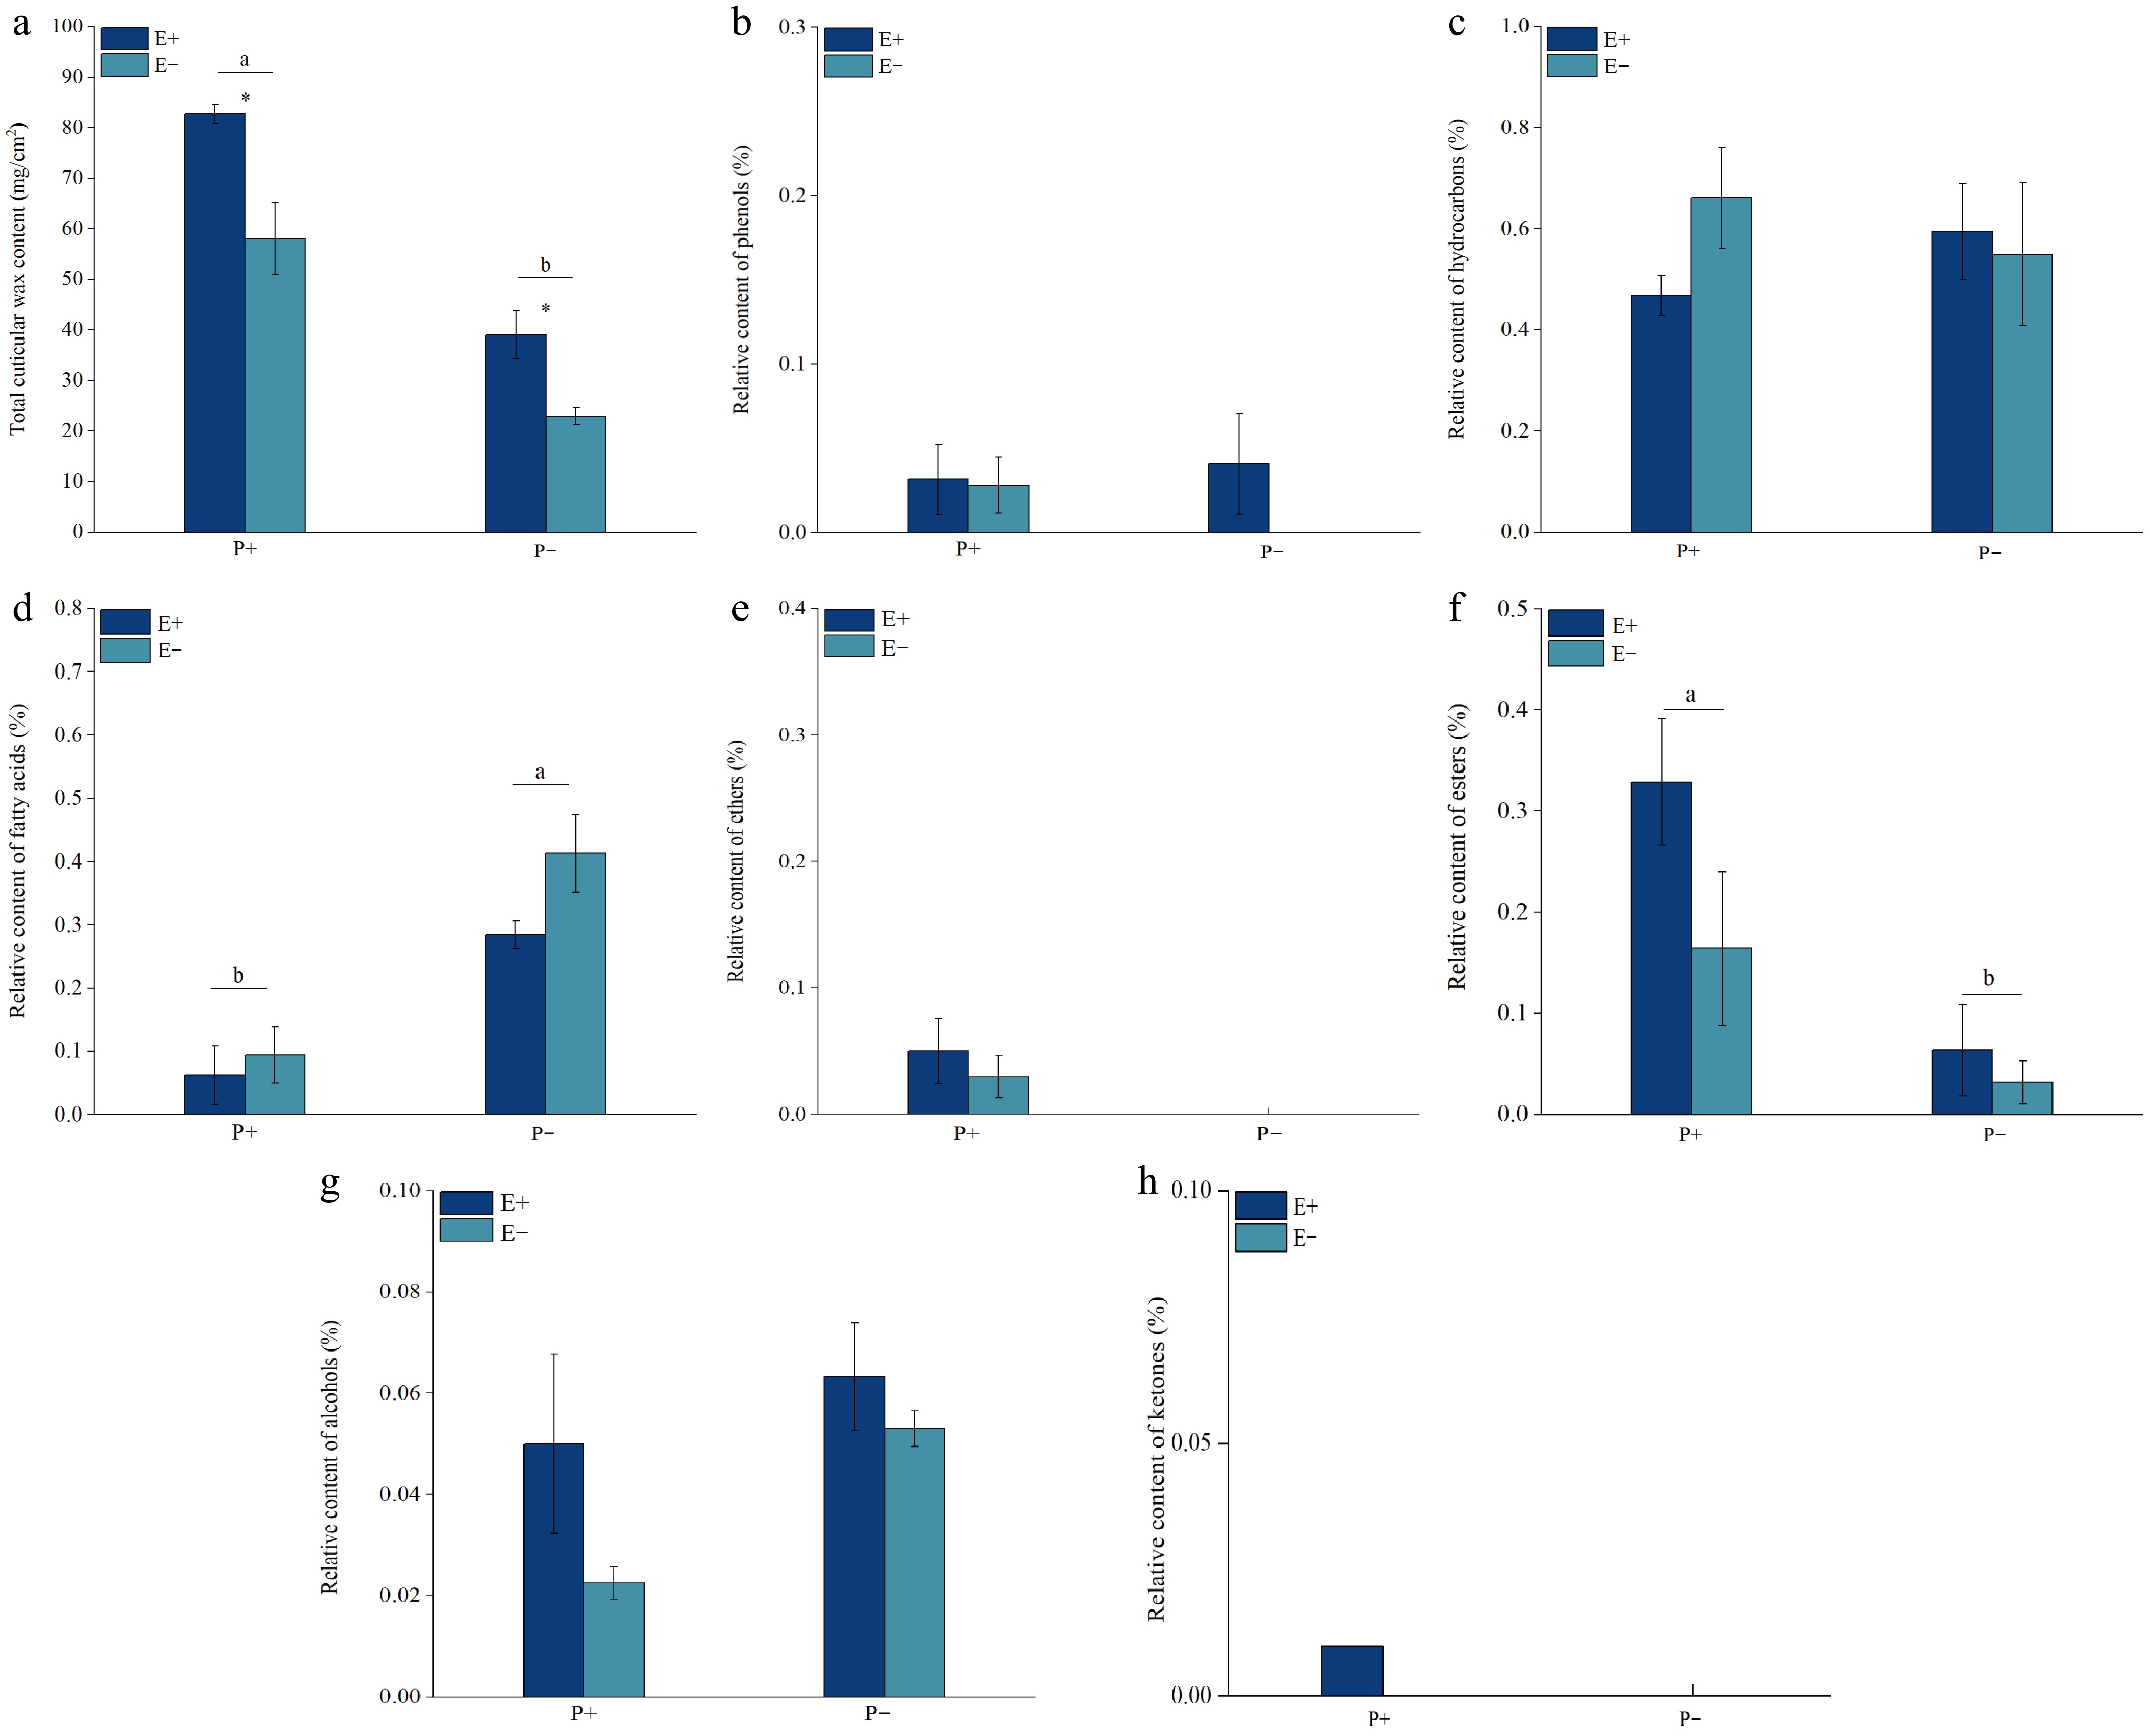
Figure 2.
Effects of Epichloë endophyte and B. graminis treatments on the total content of cuticular wax and the relative content of the wax compositions of the leaves of A. inebrians. Values are mean ± standard error (SE), with bars indicating SE. Columns with non-matching letters indicate a significant difference at p < 0.05.
-
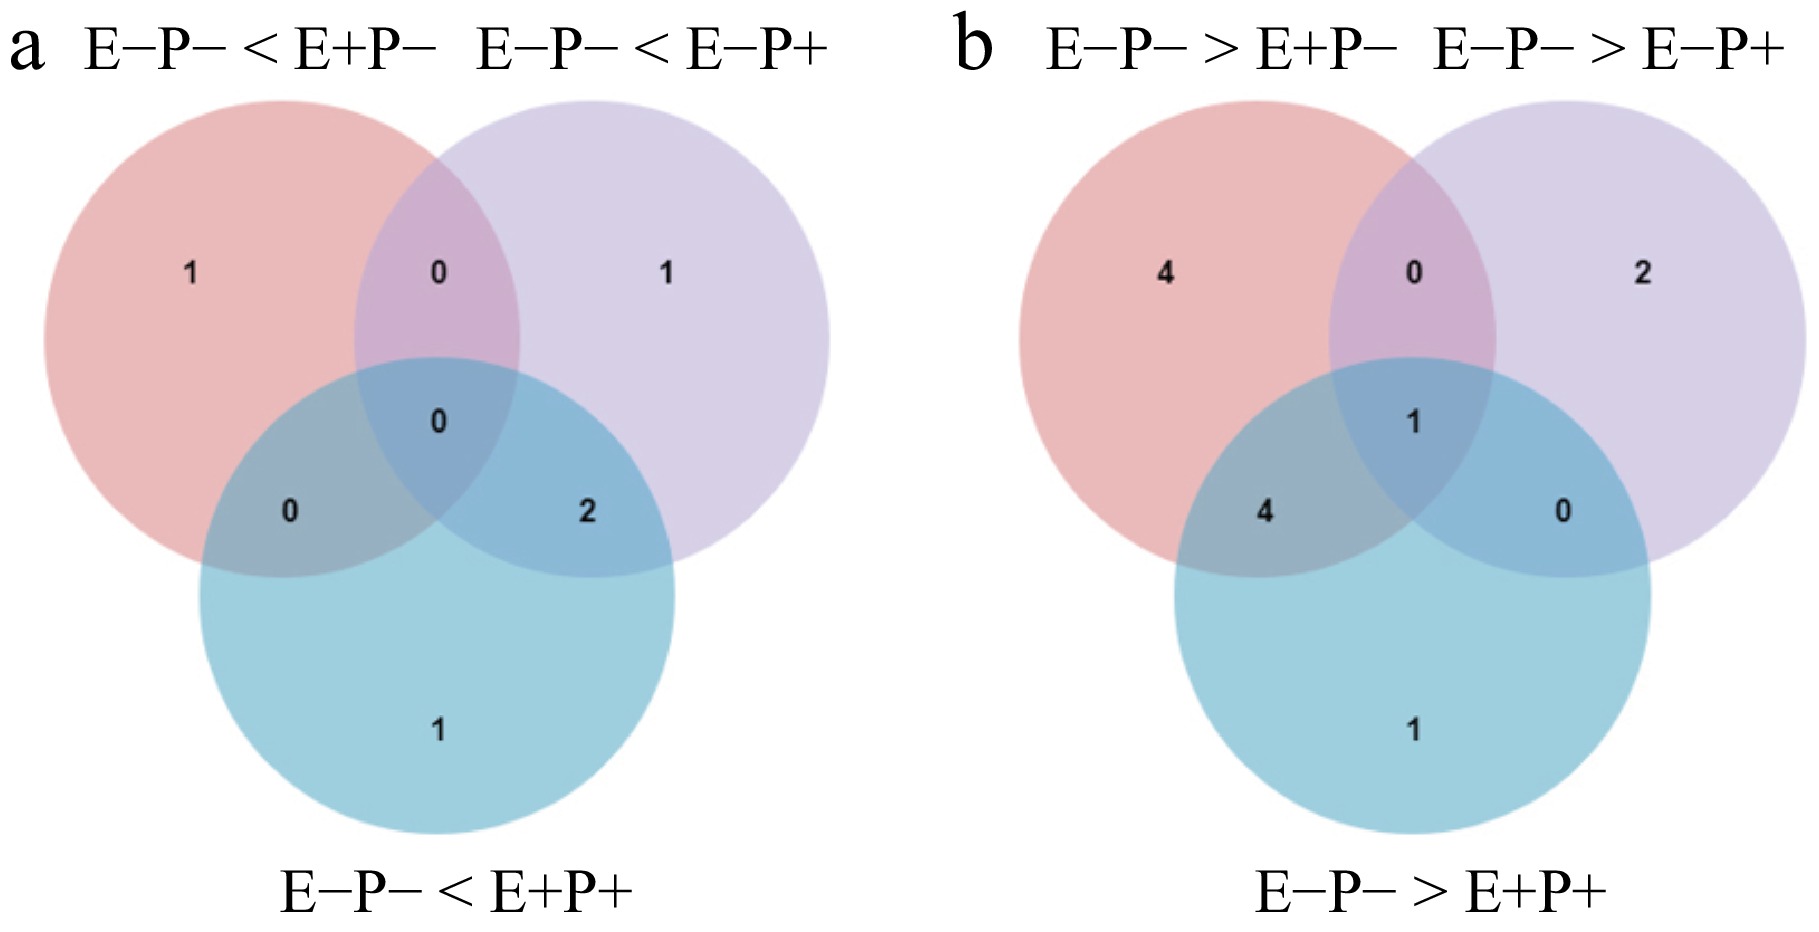
Figure 3.
Venn diagrams of (a) up-regulated, and (b) down-regulated DEGs of the biosynthesis of leaves cuticular wax in A. inebrians under Epichloë endophyte and B. graminis treatments.
-
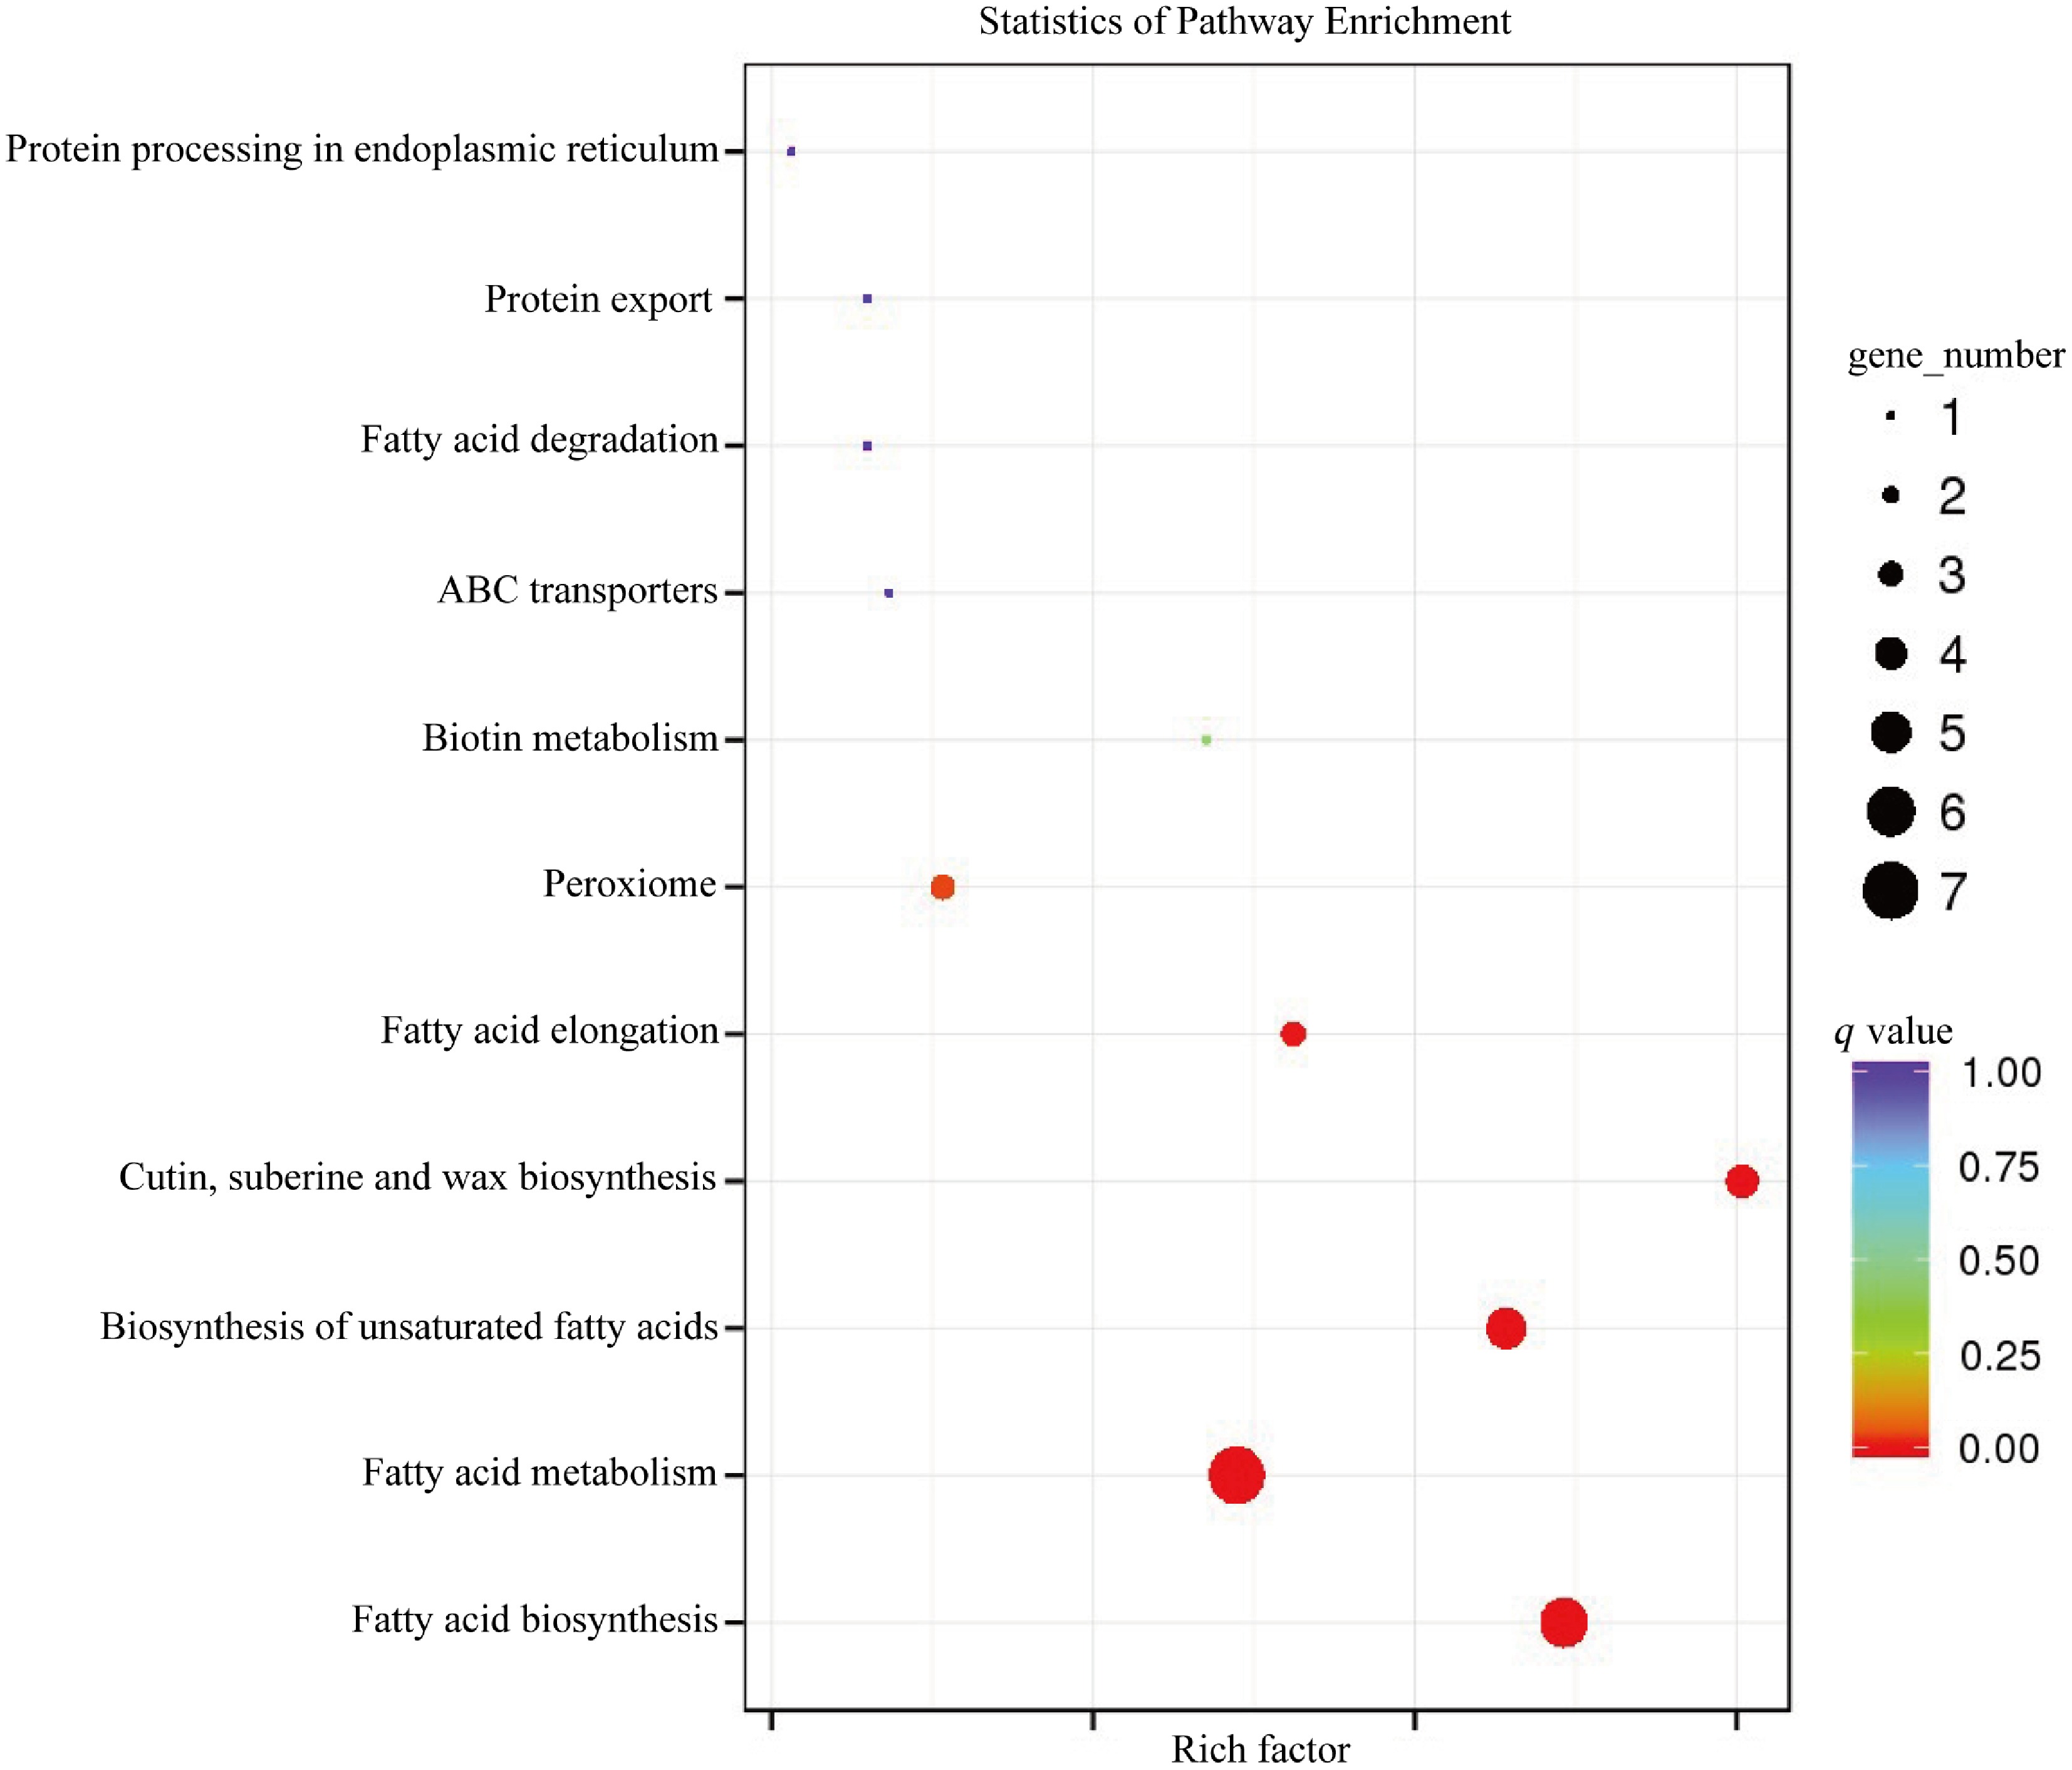
Figure 4.
KEGG pathway enrichment analysis of DEGs associated with cuticular wax biosynthesis in A. inebrians leaves in response to Epichloë endophyte and B. graminis treatments.
-
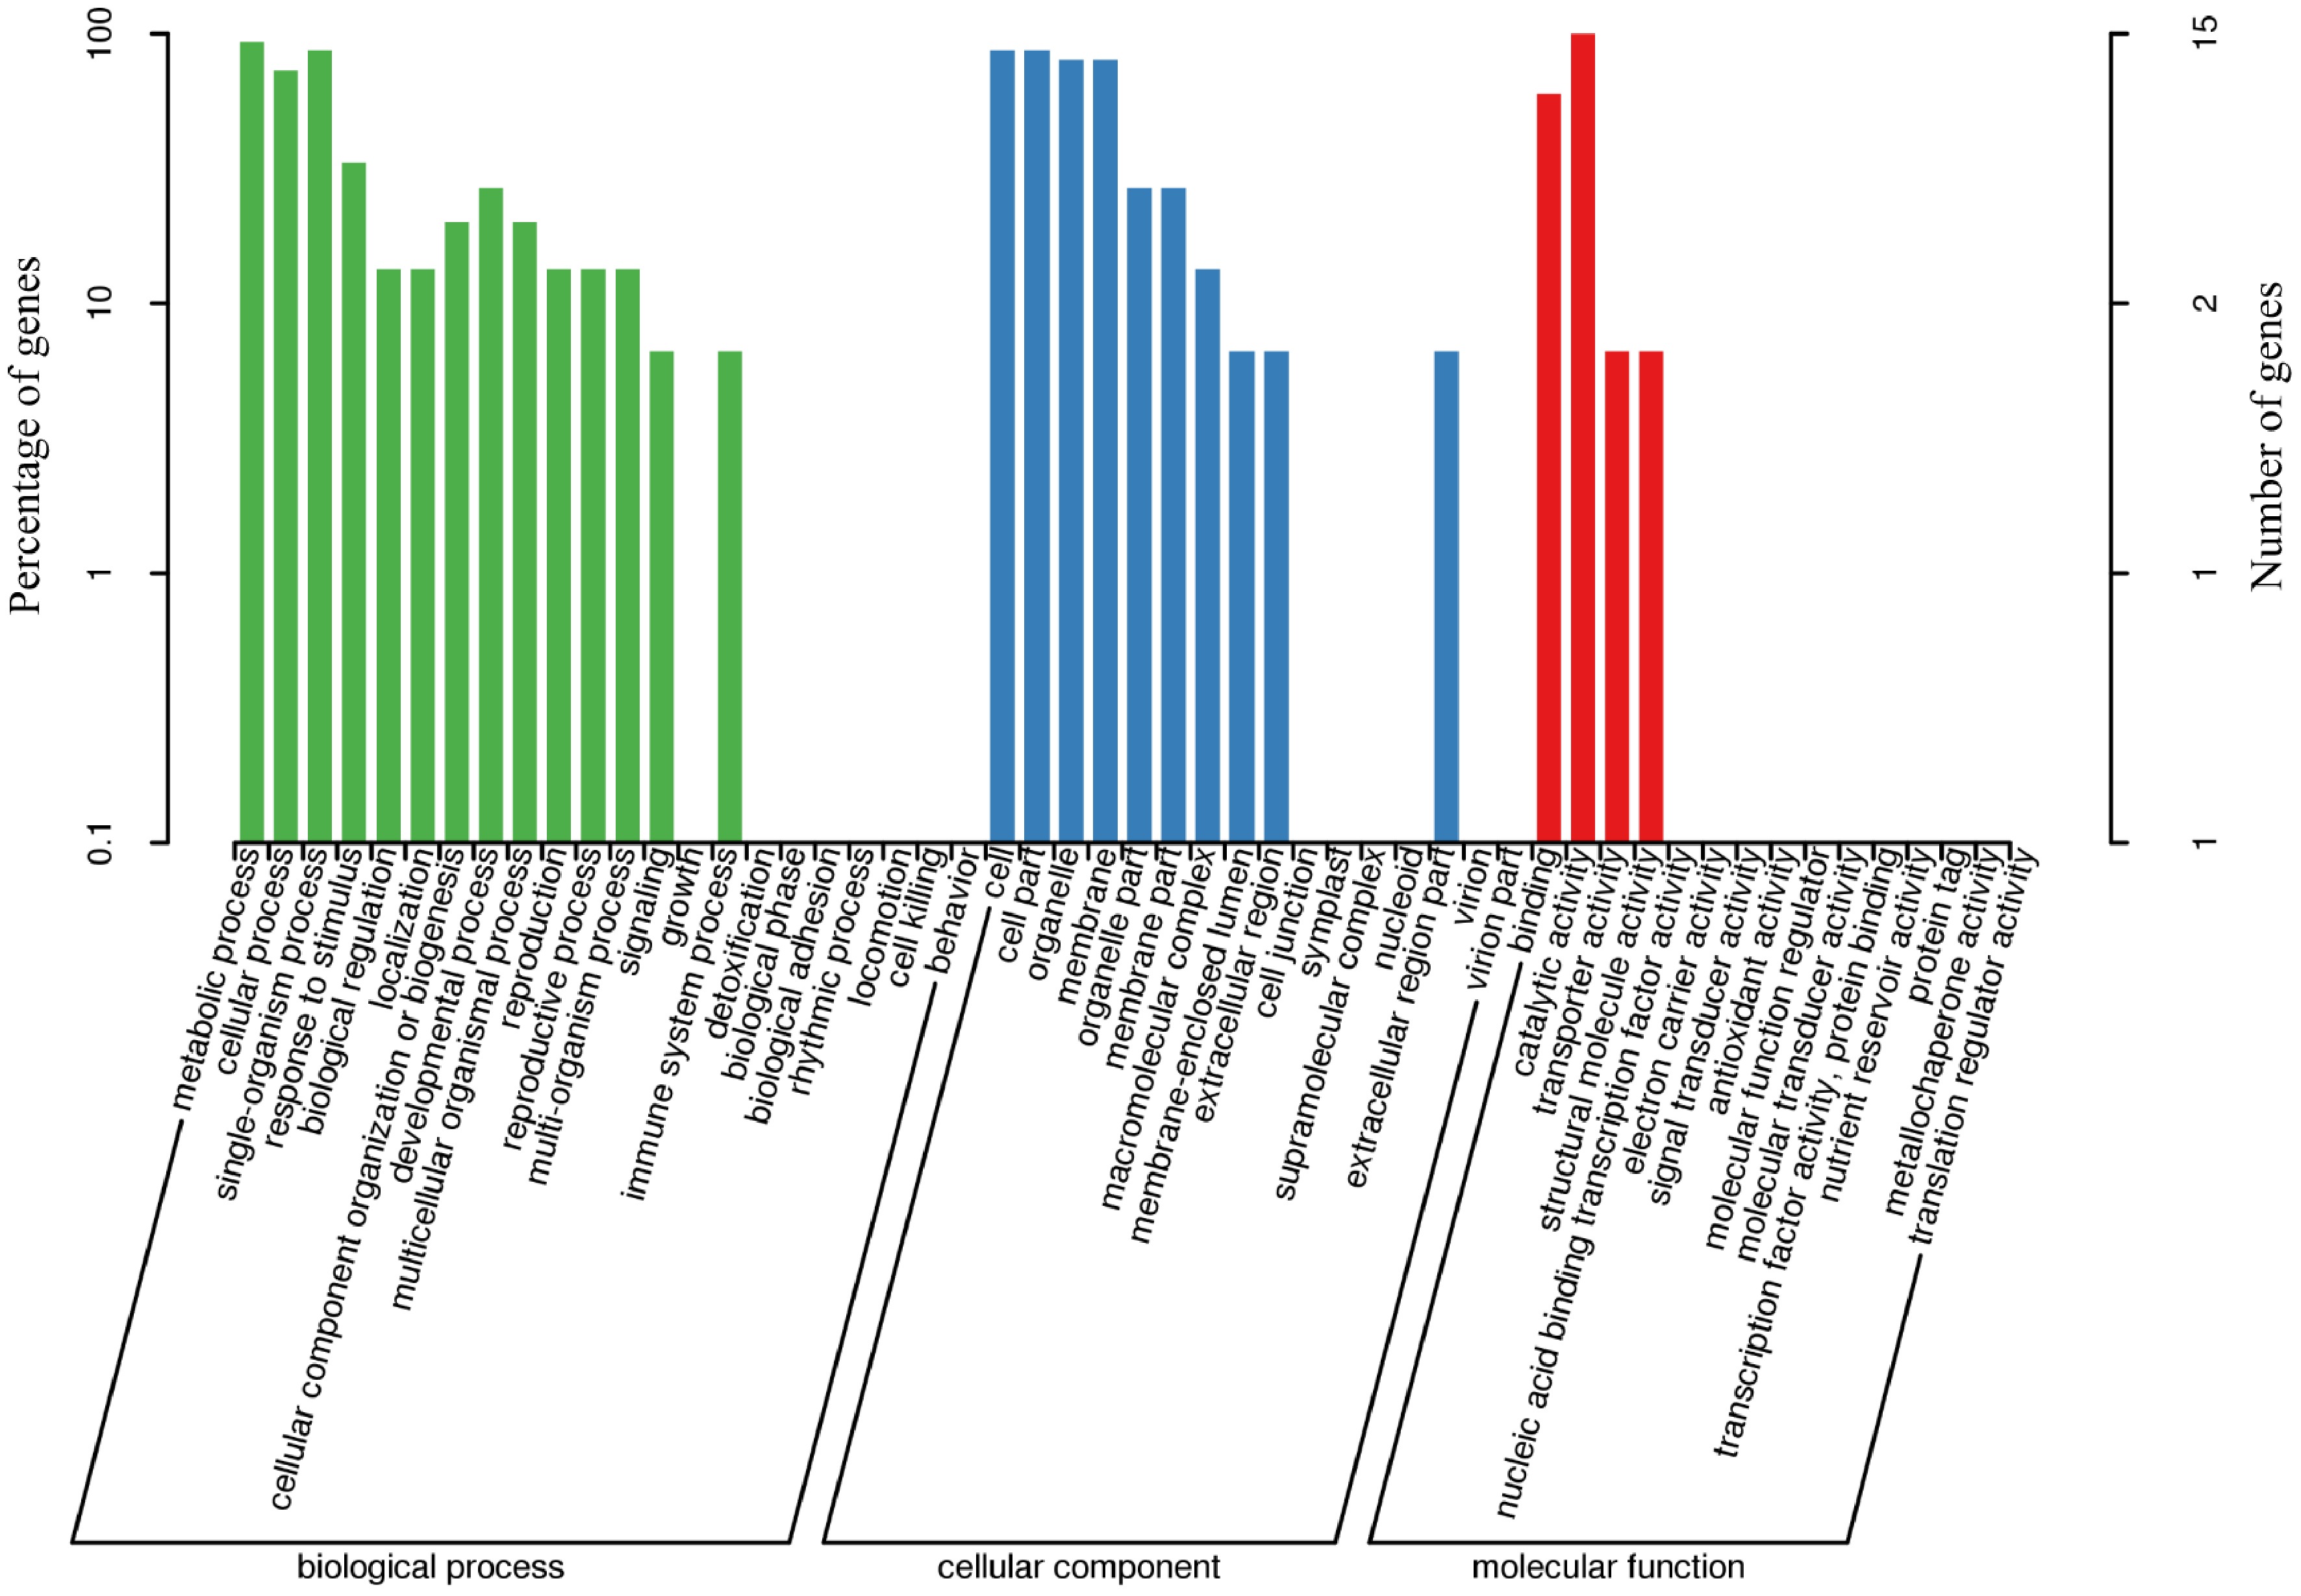
Figure 5.
GO functional-enrichment analysis of DEGs associated with the biosynthesis of leaves cuticular wax in A. inebrians under the Epichloë endophyte and B. graminis treatments.
-
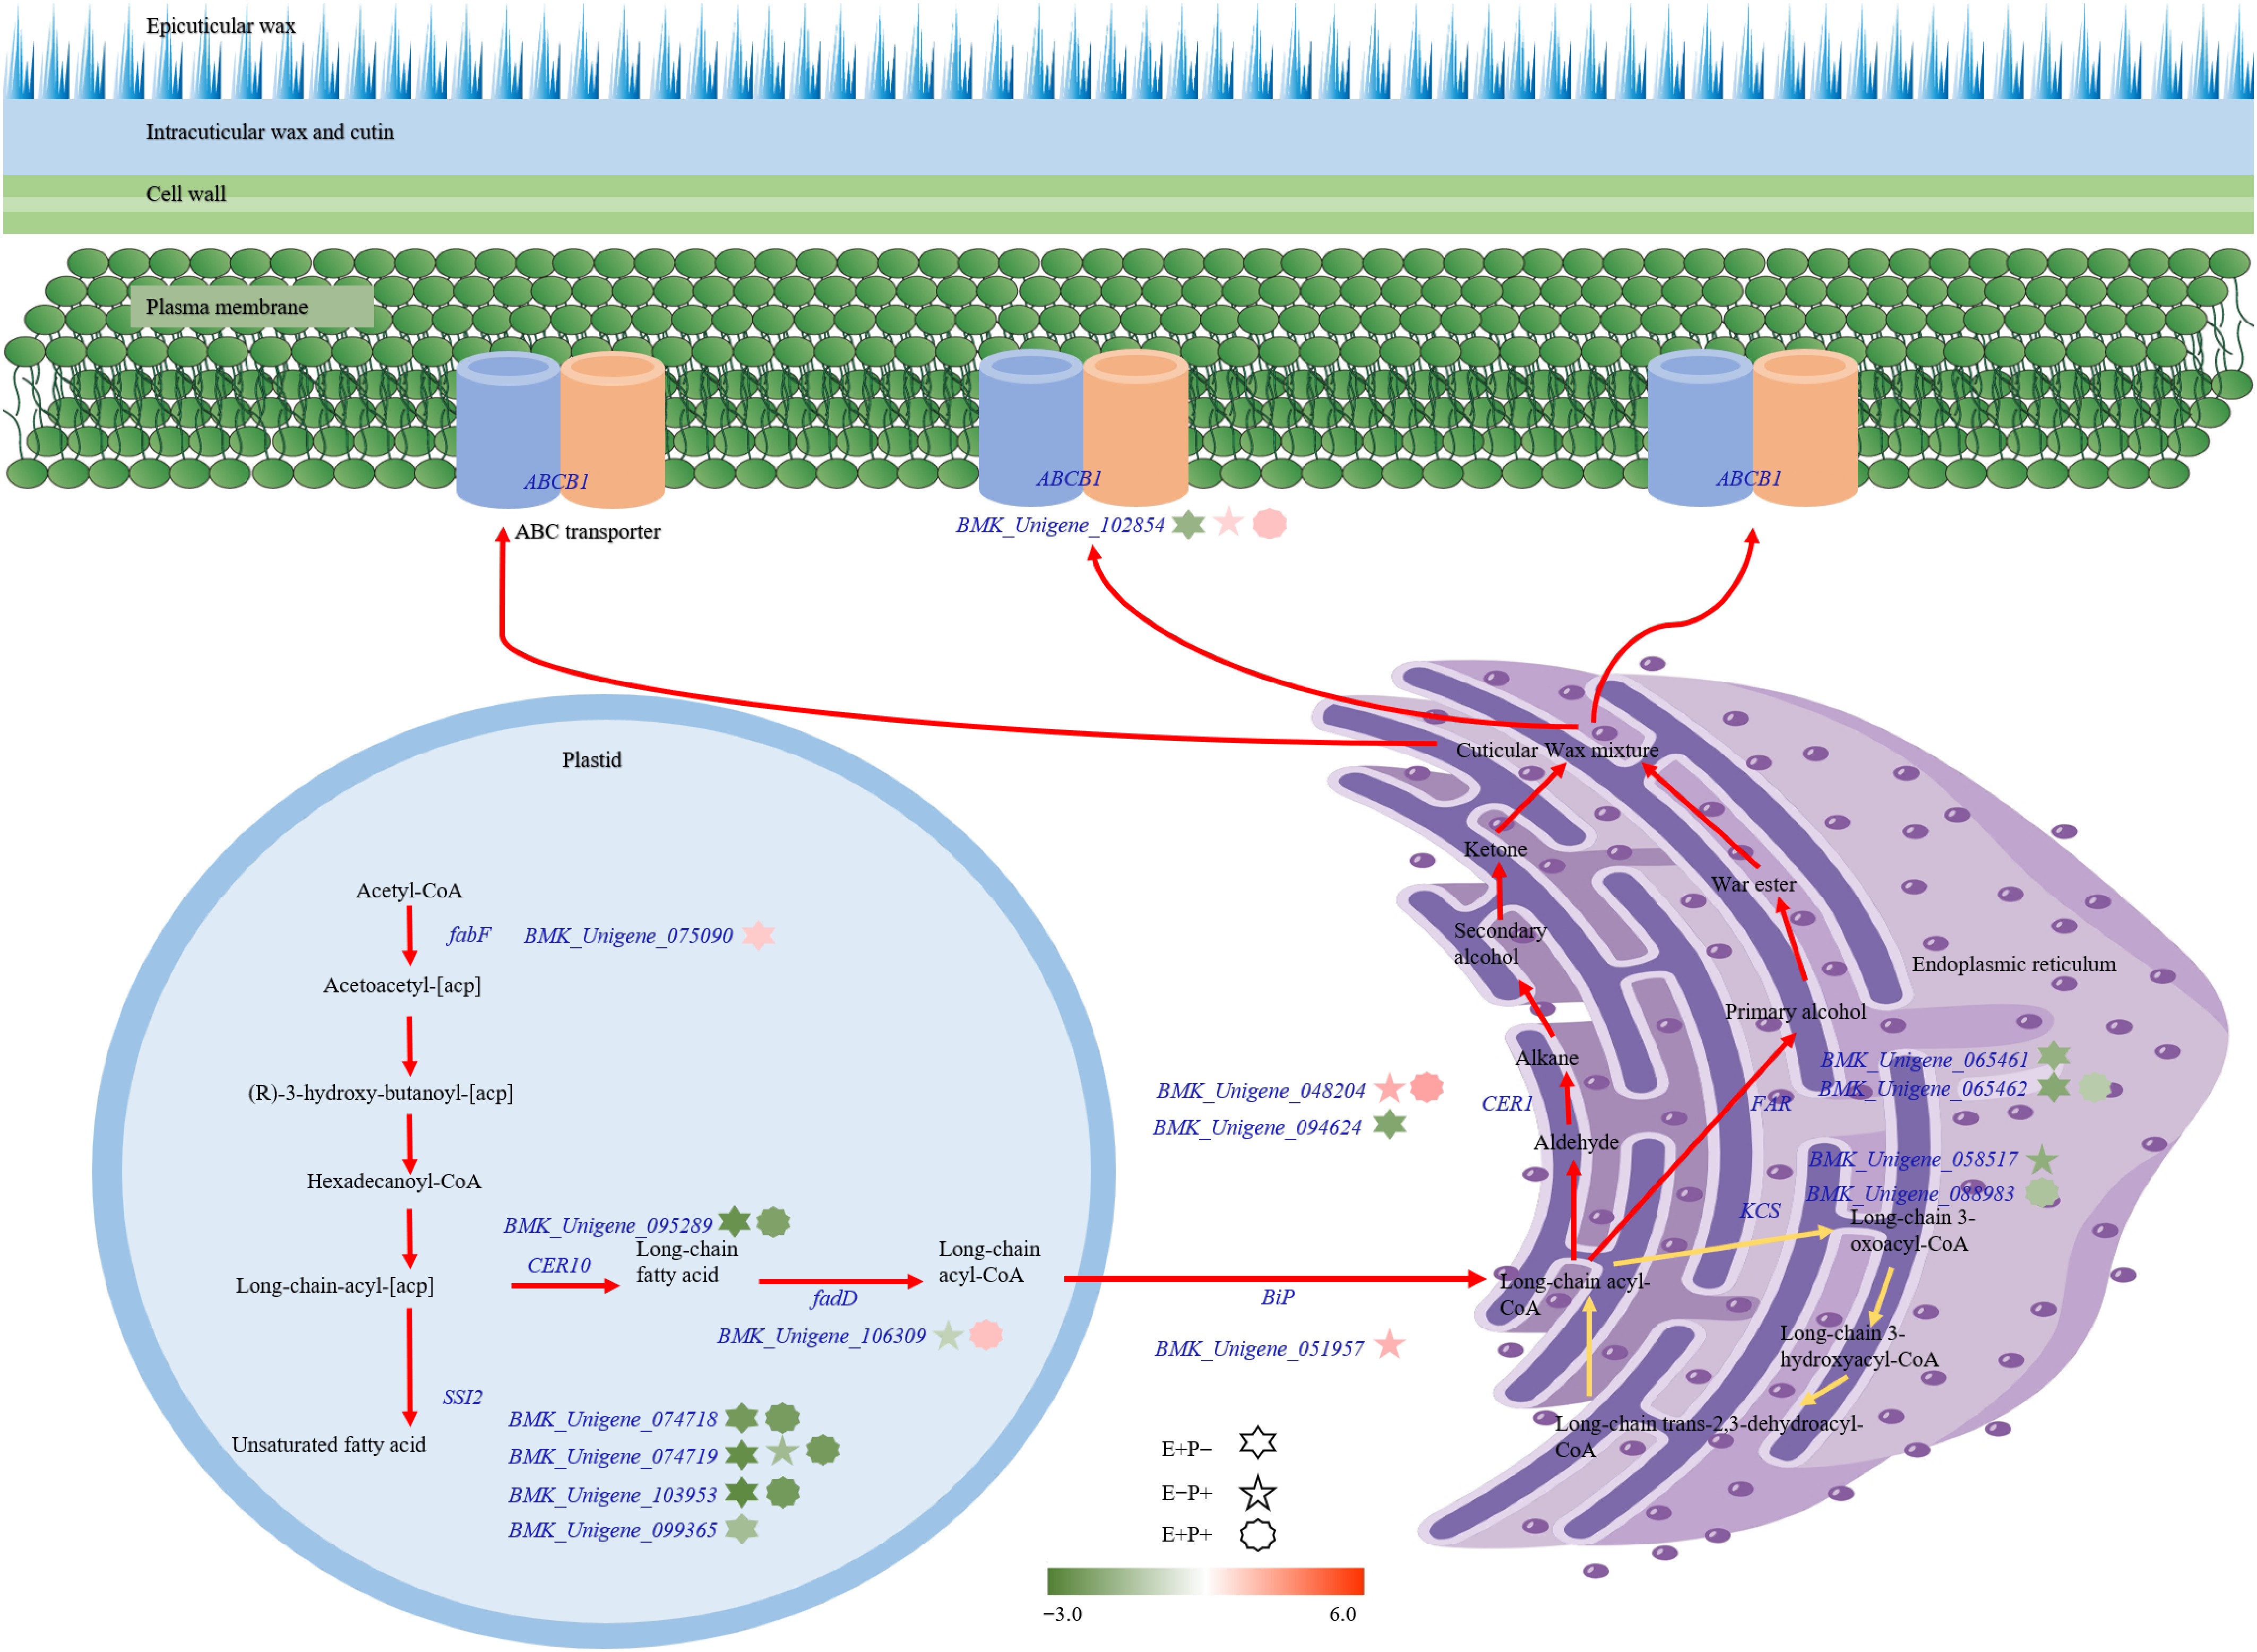
Figure 6.
Modeling of cuticular wax biosynthesis pathway in A. inebrians under the Epichloë endophyte and B. graminis treatments. Color bars from green to red represent down- and up-regulation of transcriptional expression. Gene IDs are displayed.
-
Wax composition Treatment df F-value p-value Total content E 1 20.954 0.002 P 1 78.062 < 0.001 E × P 1 0.919 0.532 Phenols E 1 2.855 0.130 P 1 1.608 0.240 E × P 1 0.034 0.859 Hydrocarbons E 1 1.229 0.300 P 1 2.932 0.125 E × P 1 0.880 0.376 Fatty acids E 1 0.013 0.911 P 1 16.539 0.004 E × P 1 0.002 0.966 Ethers E 1 0.186 0.677 P 1 5.800 0.043 E × P 1 0.186 0.677 Esters E 1 4.248 0.073 P 1 15.751 0.004 E × P 1 1.775 0.219 Alcohols E 1 0.901 0.370 P 1 2.254 0.172 E × P 1 0.103 0.757 The values in bold mean significant differences. Table 1.
Two-way ANOVA analysis the effects of Epichloë endophyte (E), and Blumeria graminis (P) treatments on the total content of cuticular wax, and the relative content of the wax compositions of the leaves of Achnatherum inebrians (n = 5).
Figures
(6)
Tables
(1)