-
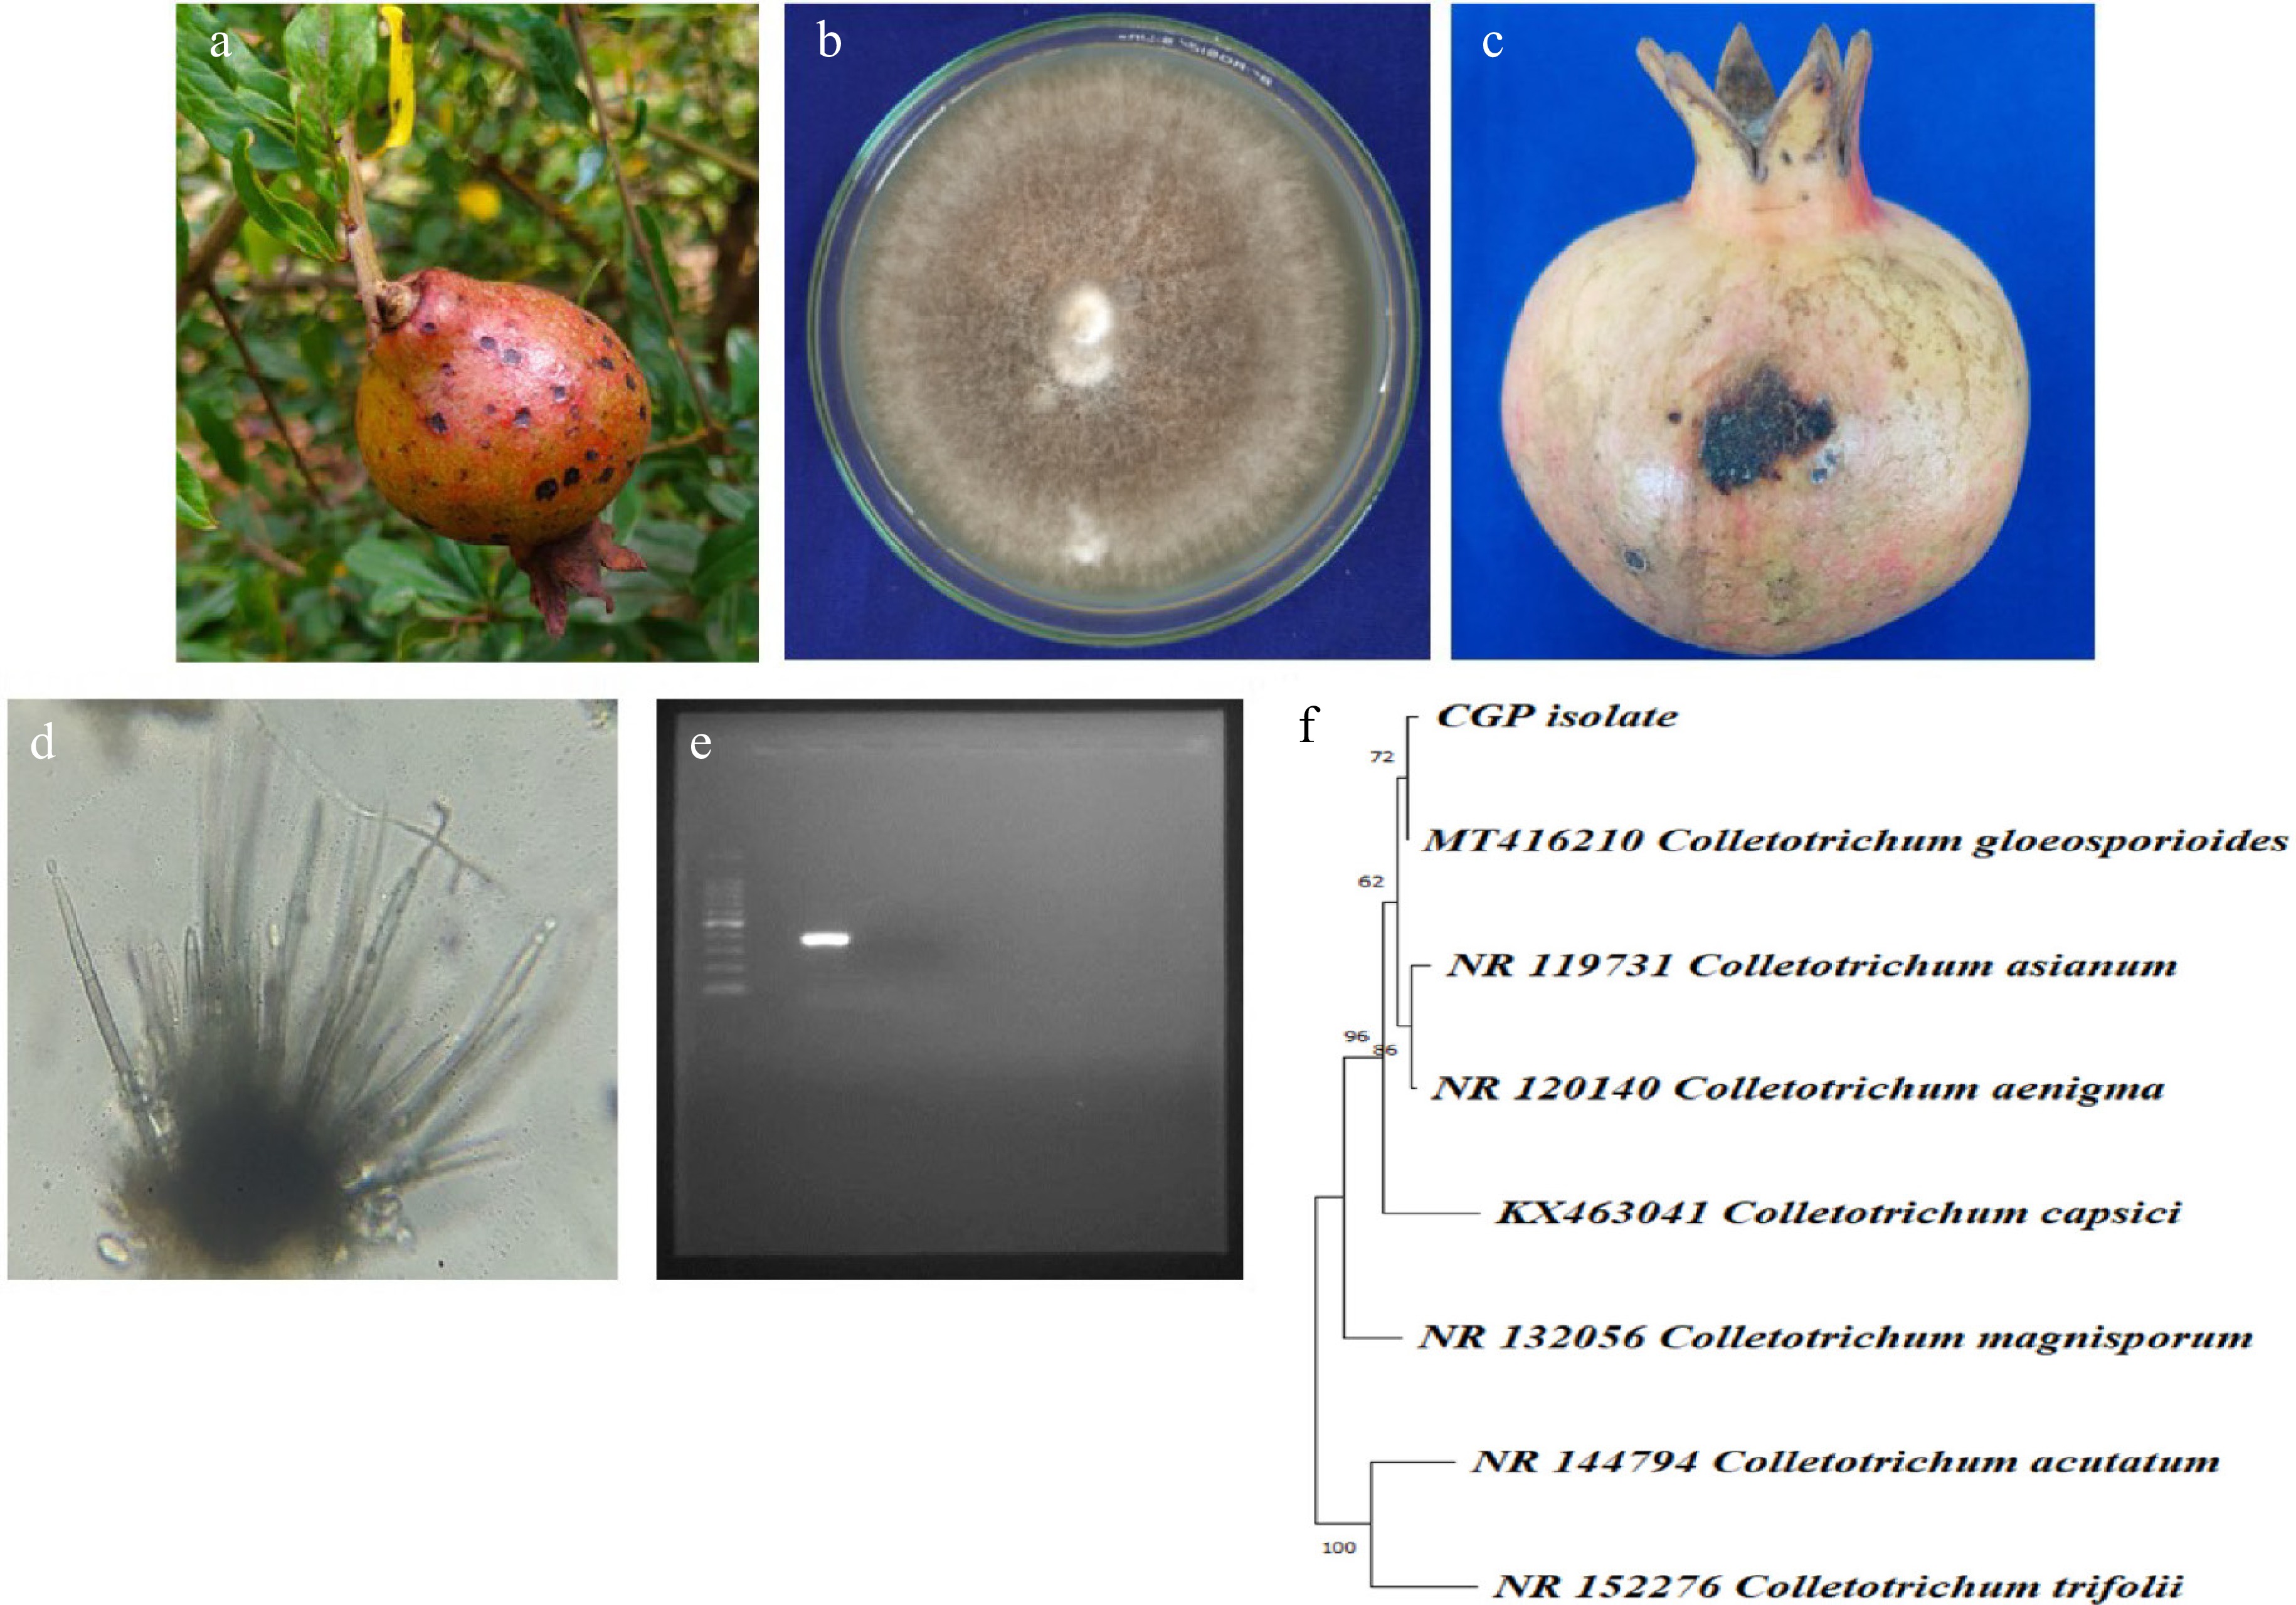
Figure 1.
(a) Symptoms on fruit. (b) Pure culture of pathogen. (c) Pathogenicity on mature fruit. (d) Acervuli. (e) ~380 band size on agarose gel. (f) Phylogenetic analysis.
-
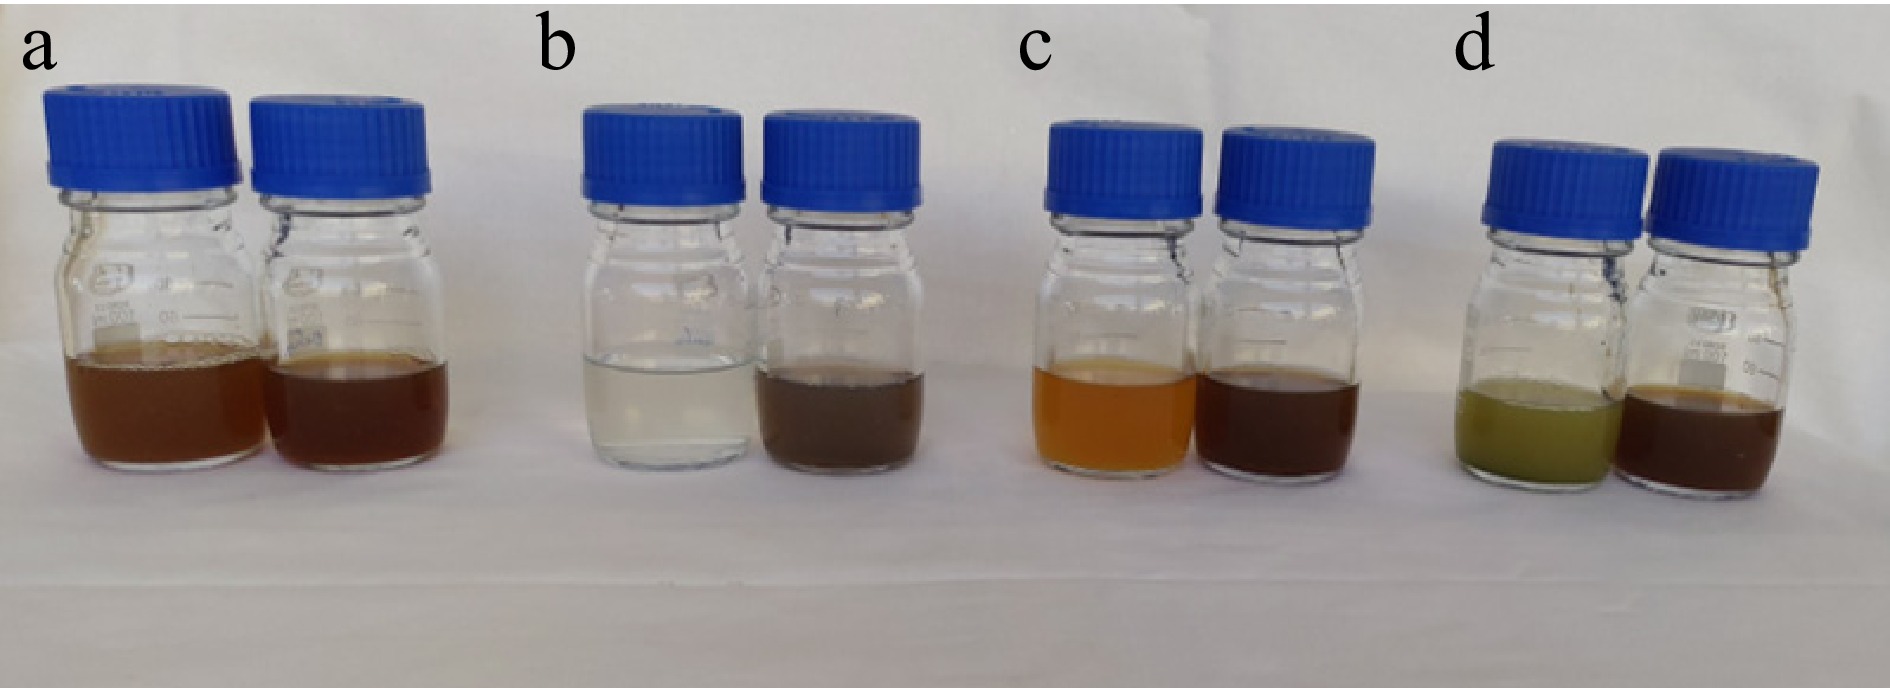
Figure 2.
Change of colour as an indication of silver nanoparticles synthesis. (a) D. metel extract and AgNPs, (b) M. oleifera extract and AgNPs, (c) A. sativum extract and AgNPs, (d) P. julifera extract and AgNPs.
-
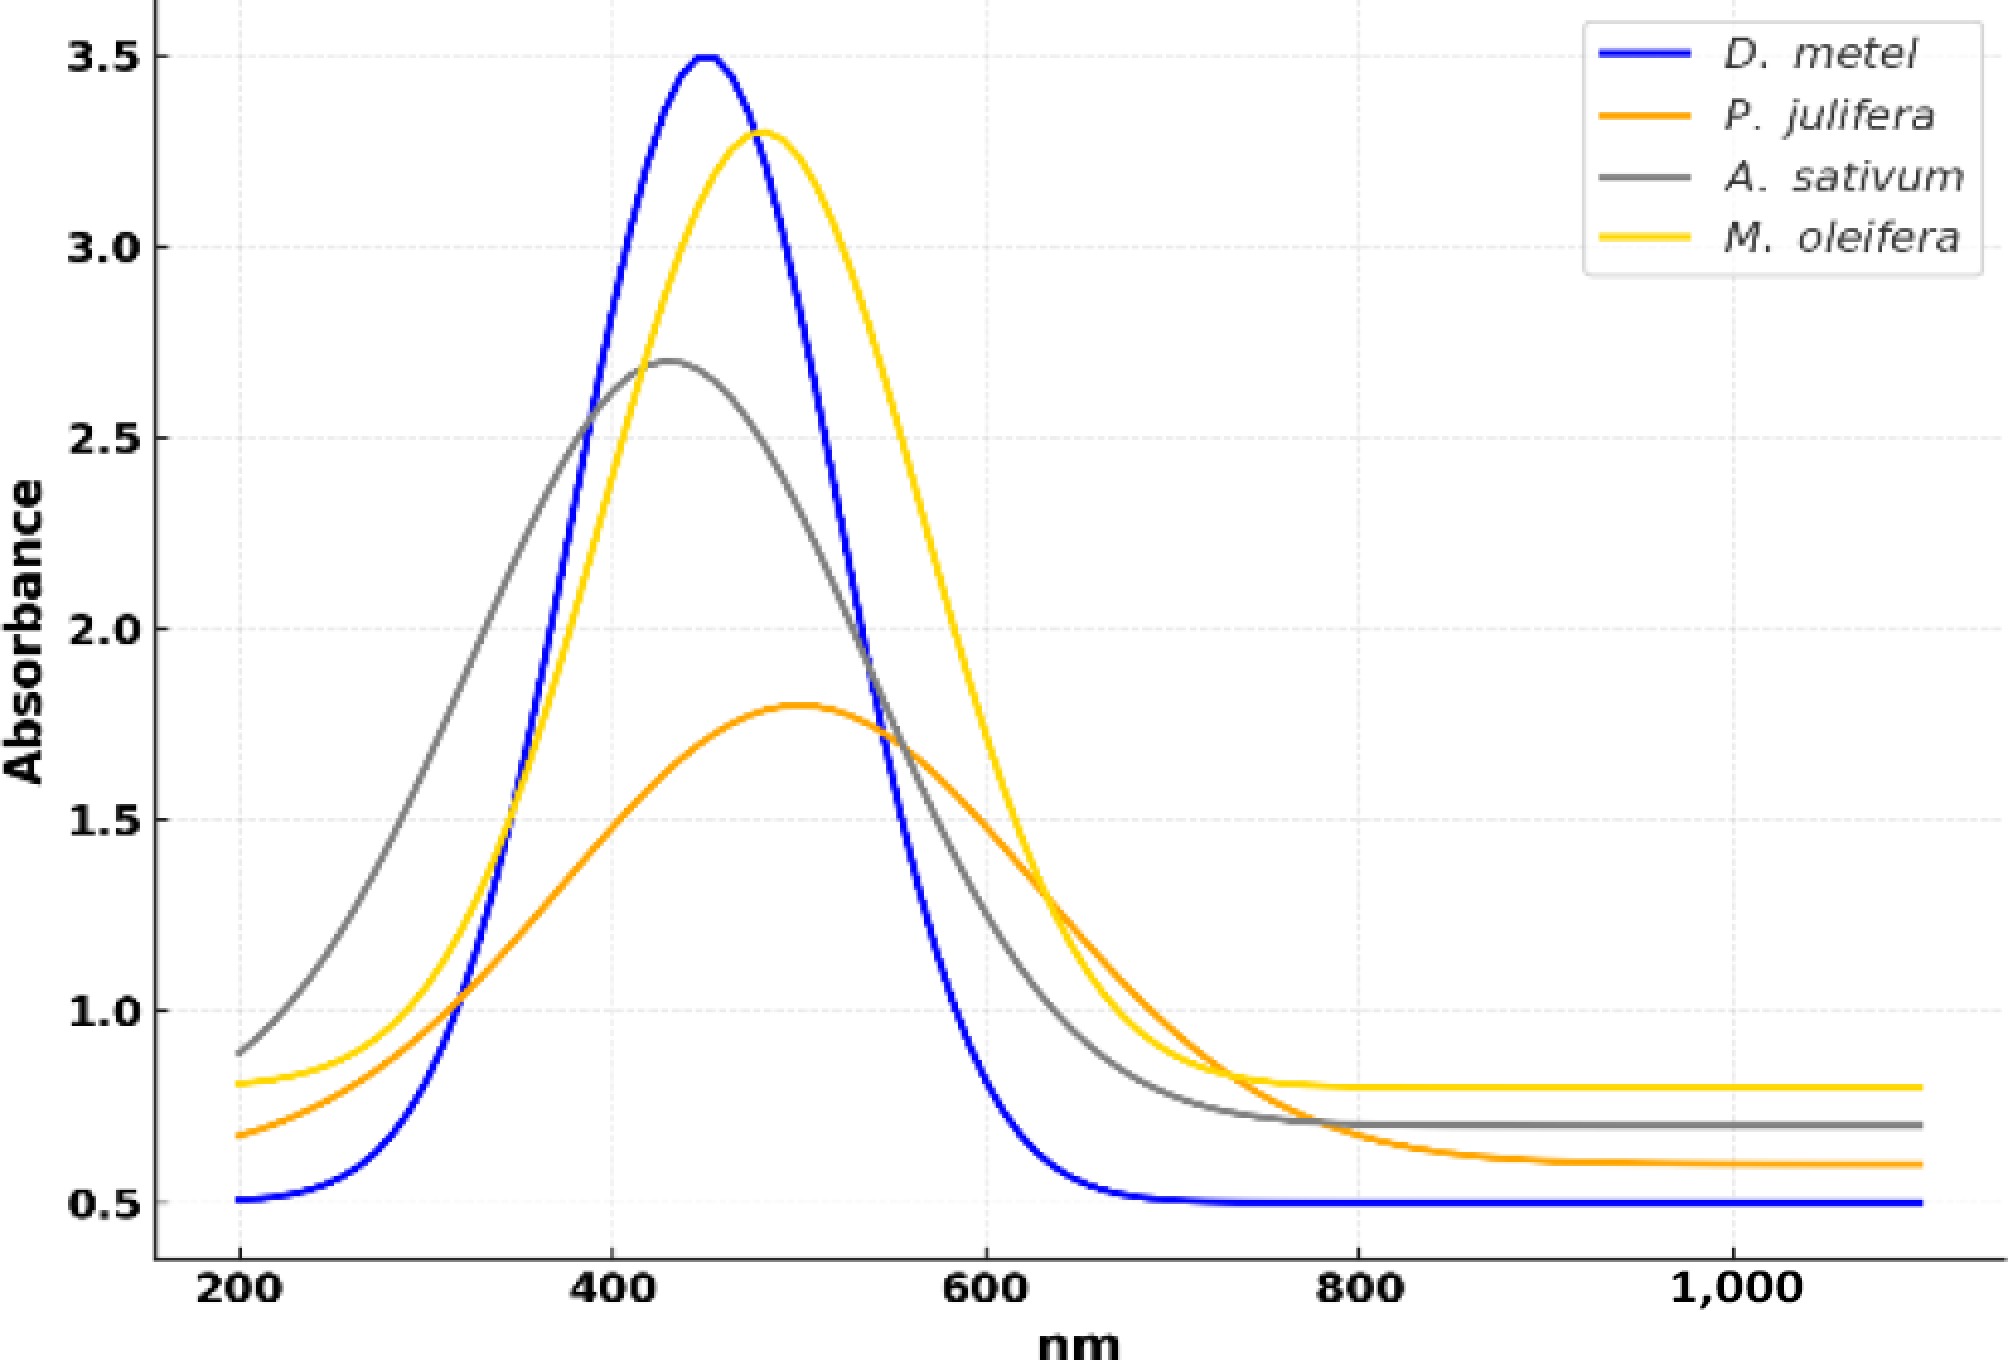
Figure 3.
UV vis absorption spectra of biosynthesized AgNPs.
-
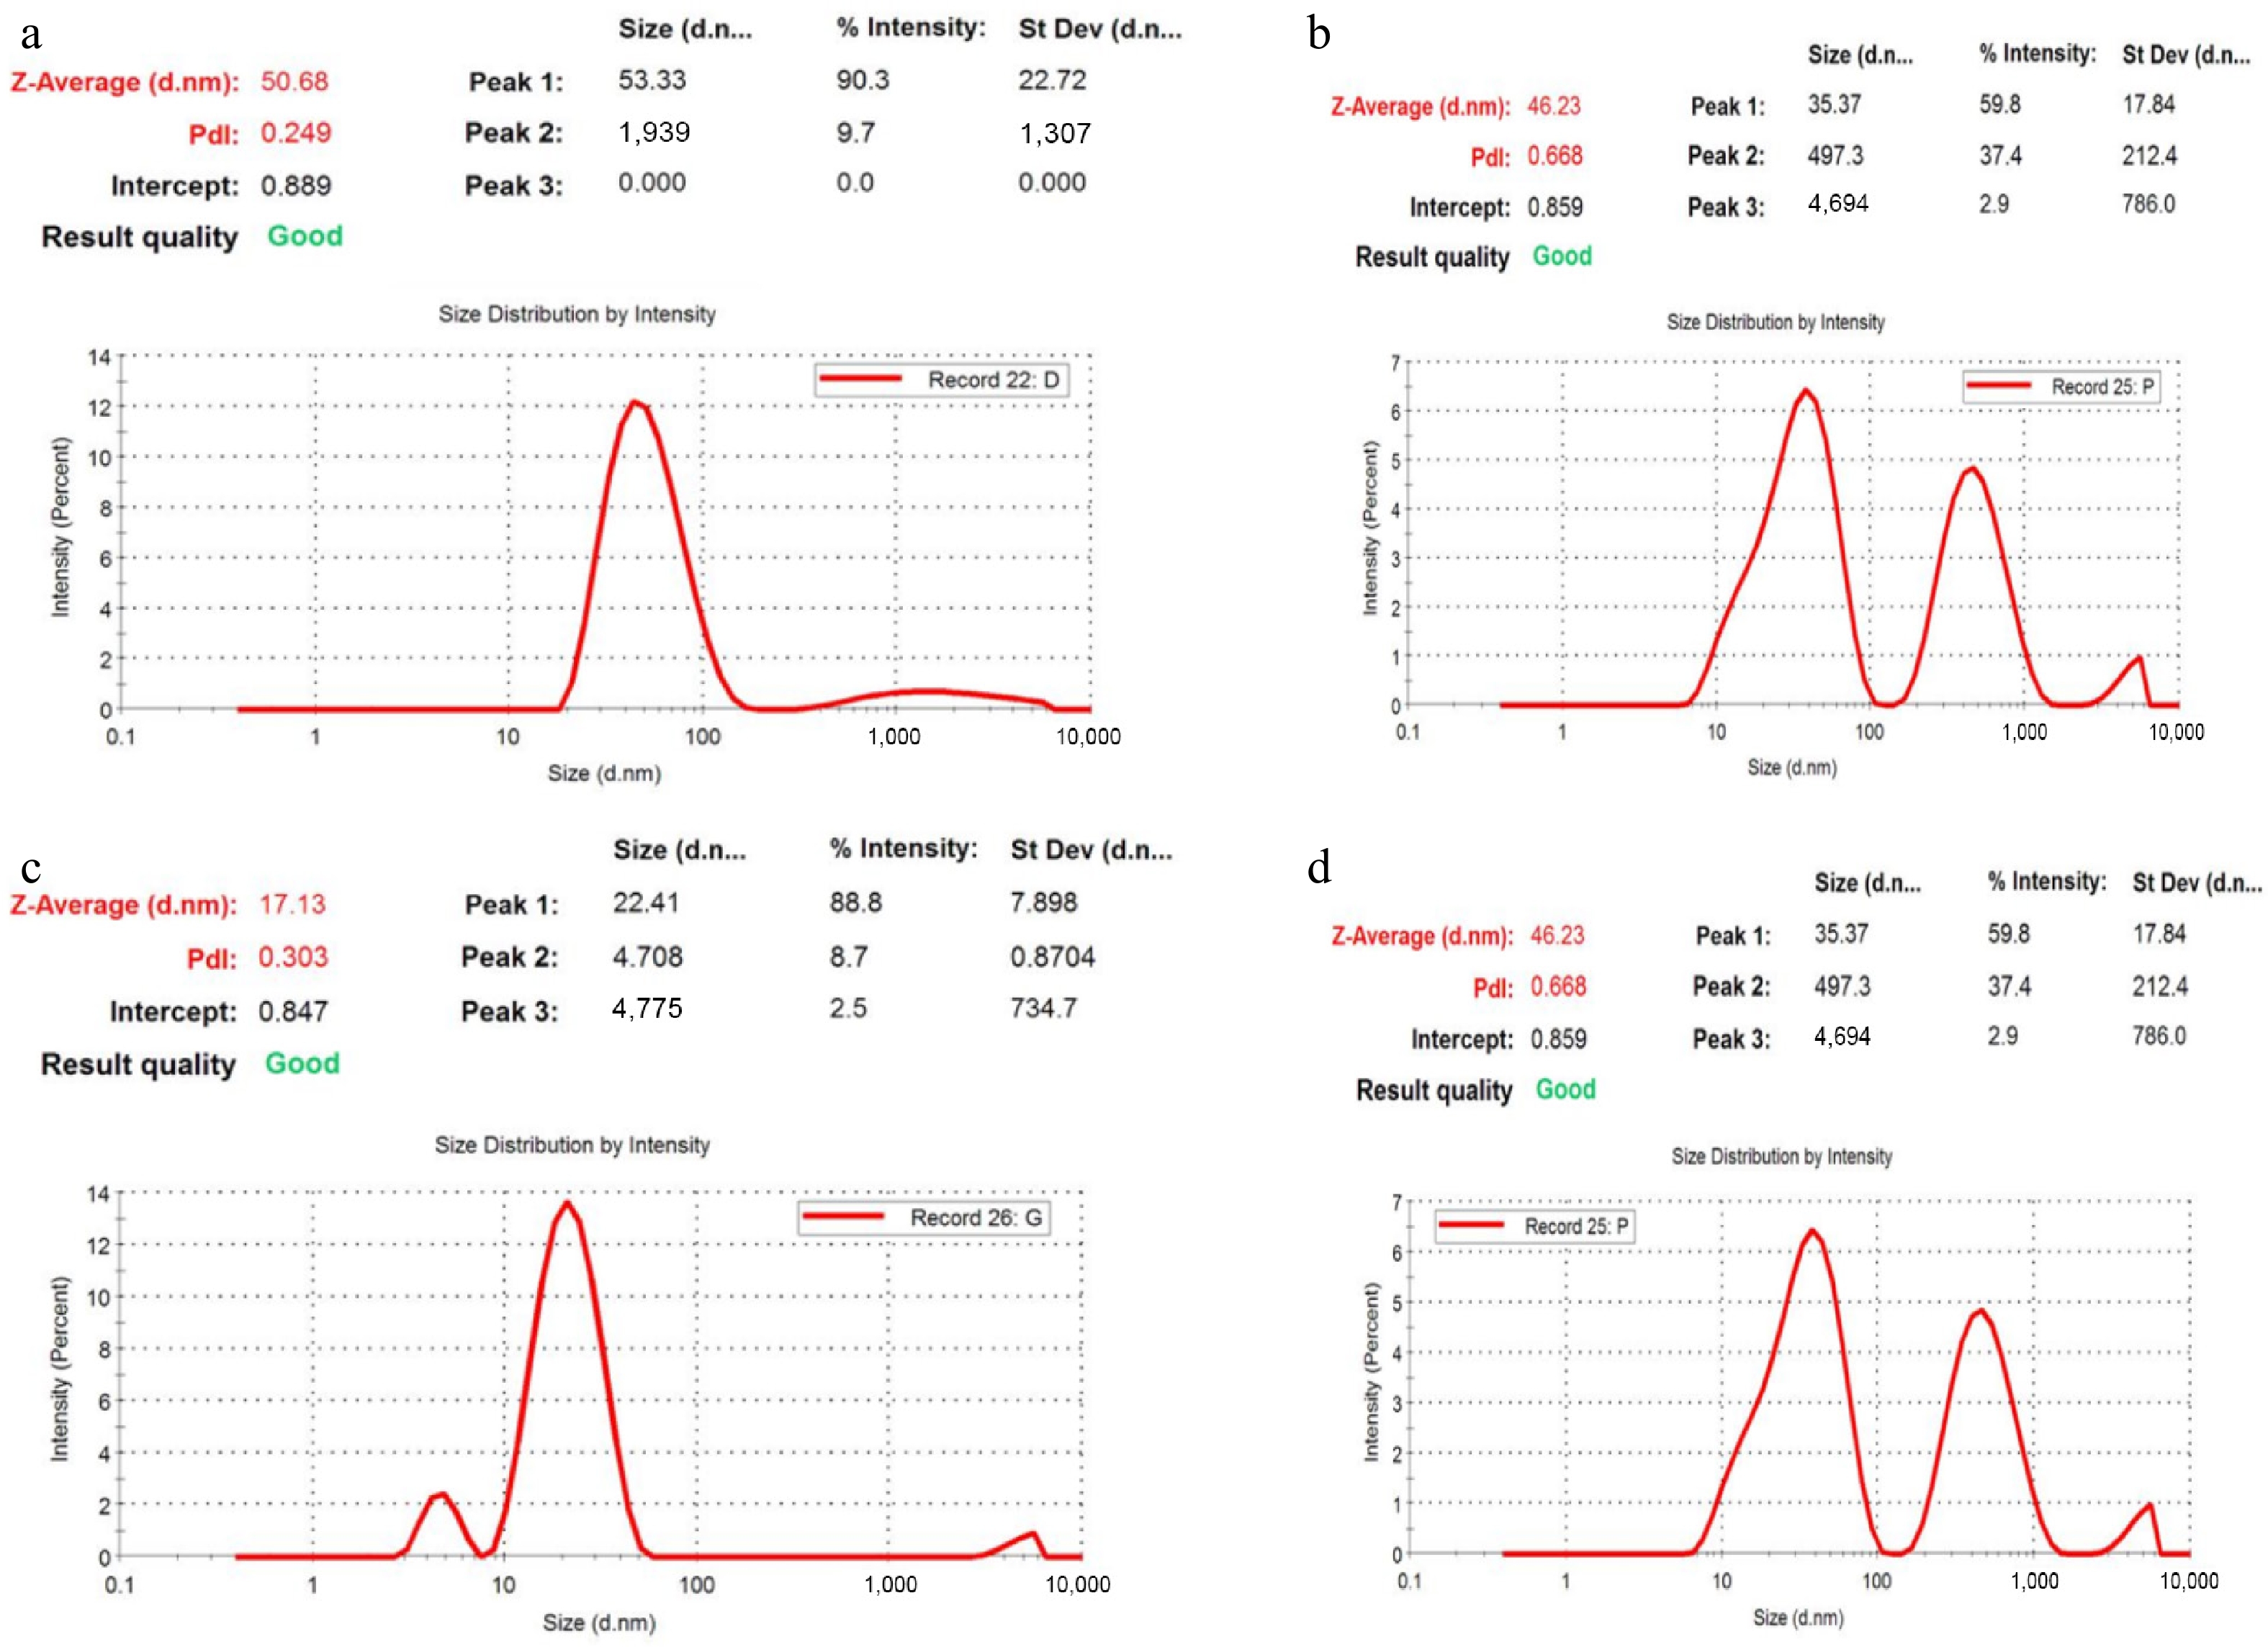
Figure 4.
Zeta analysis of green synthesized AgNPs. (a) D. metel-AgNPs, (b) A. sativum AgNPs, (c) M. oleifera-AgNPs, (d) P. julifera AgNPs.
-
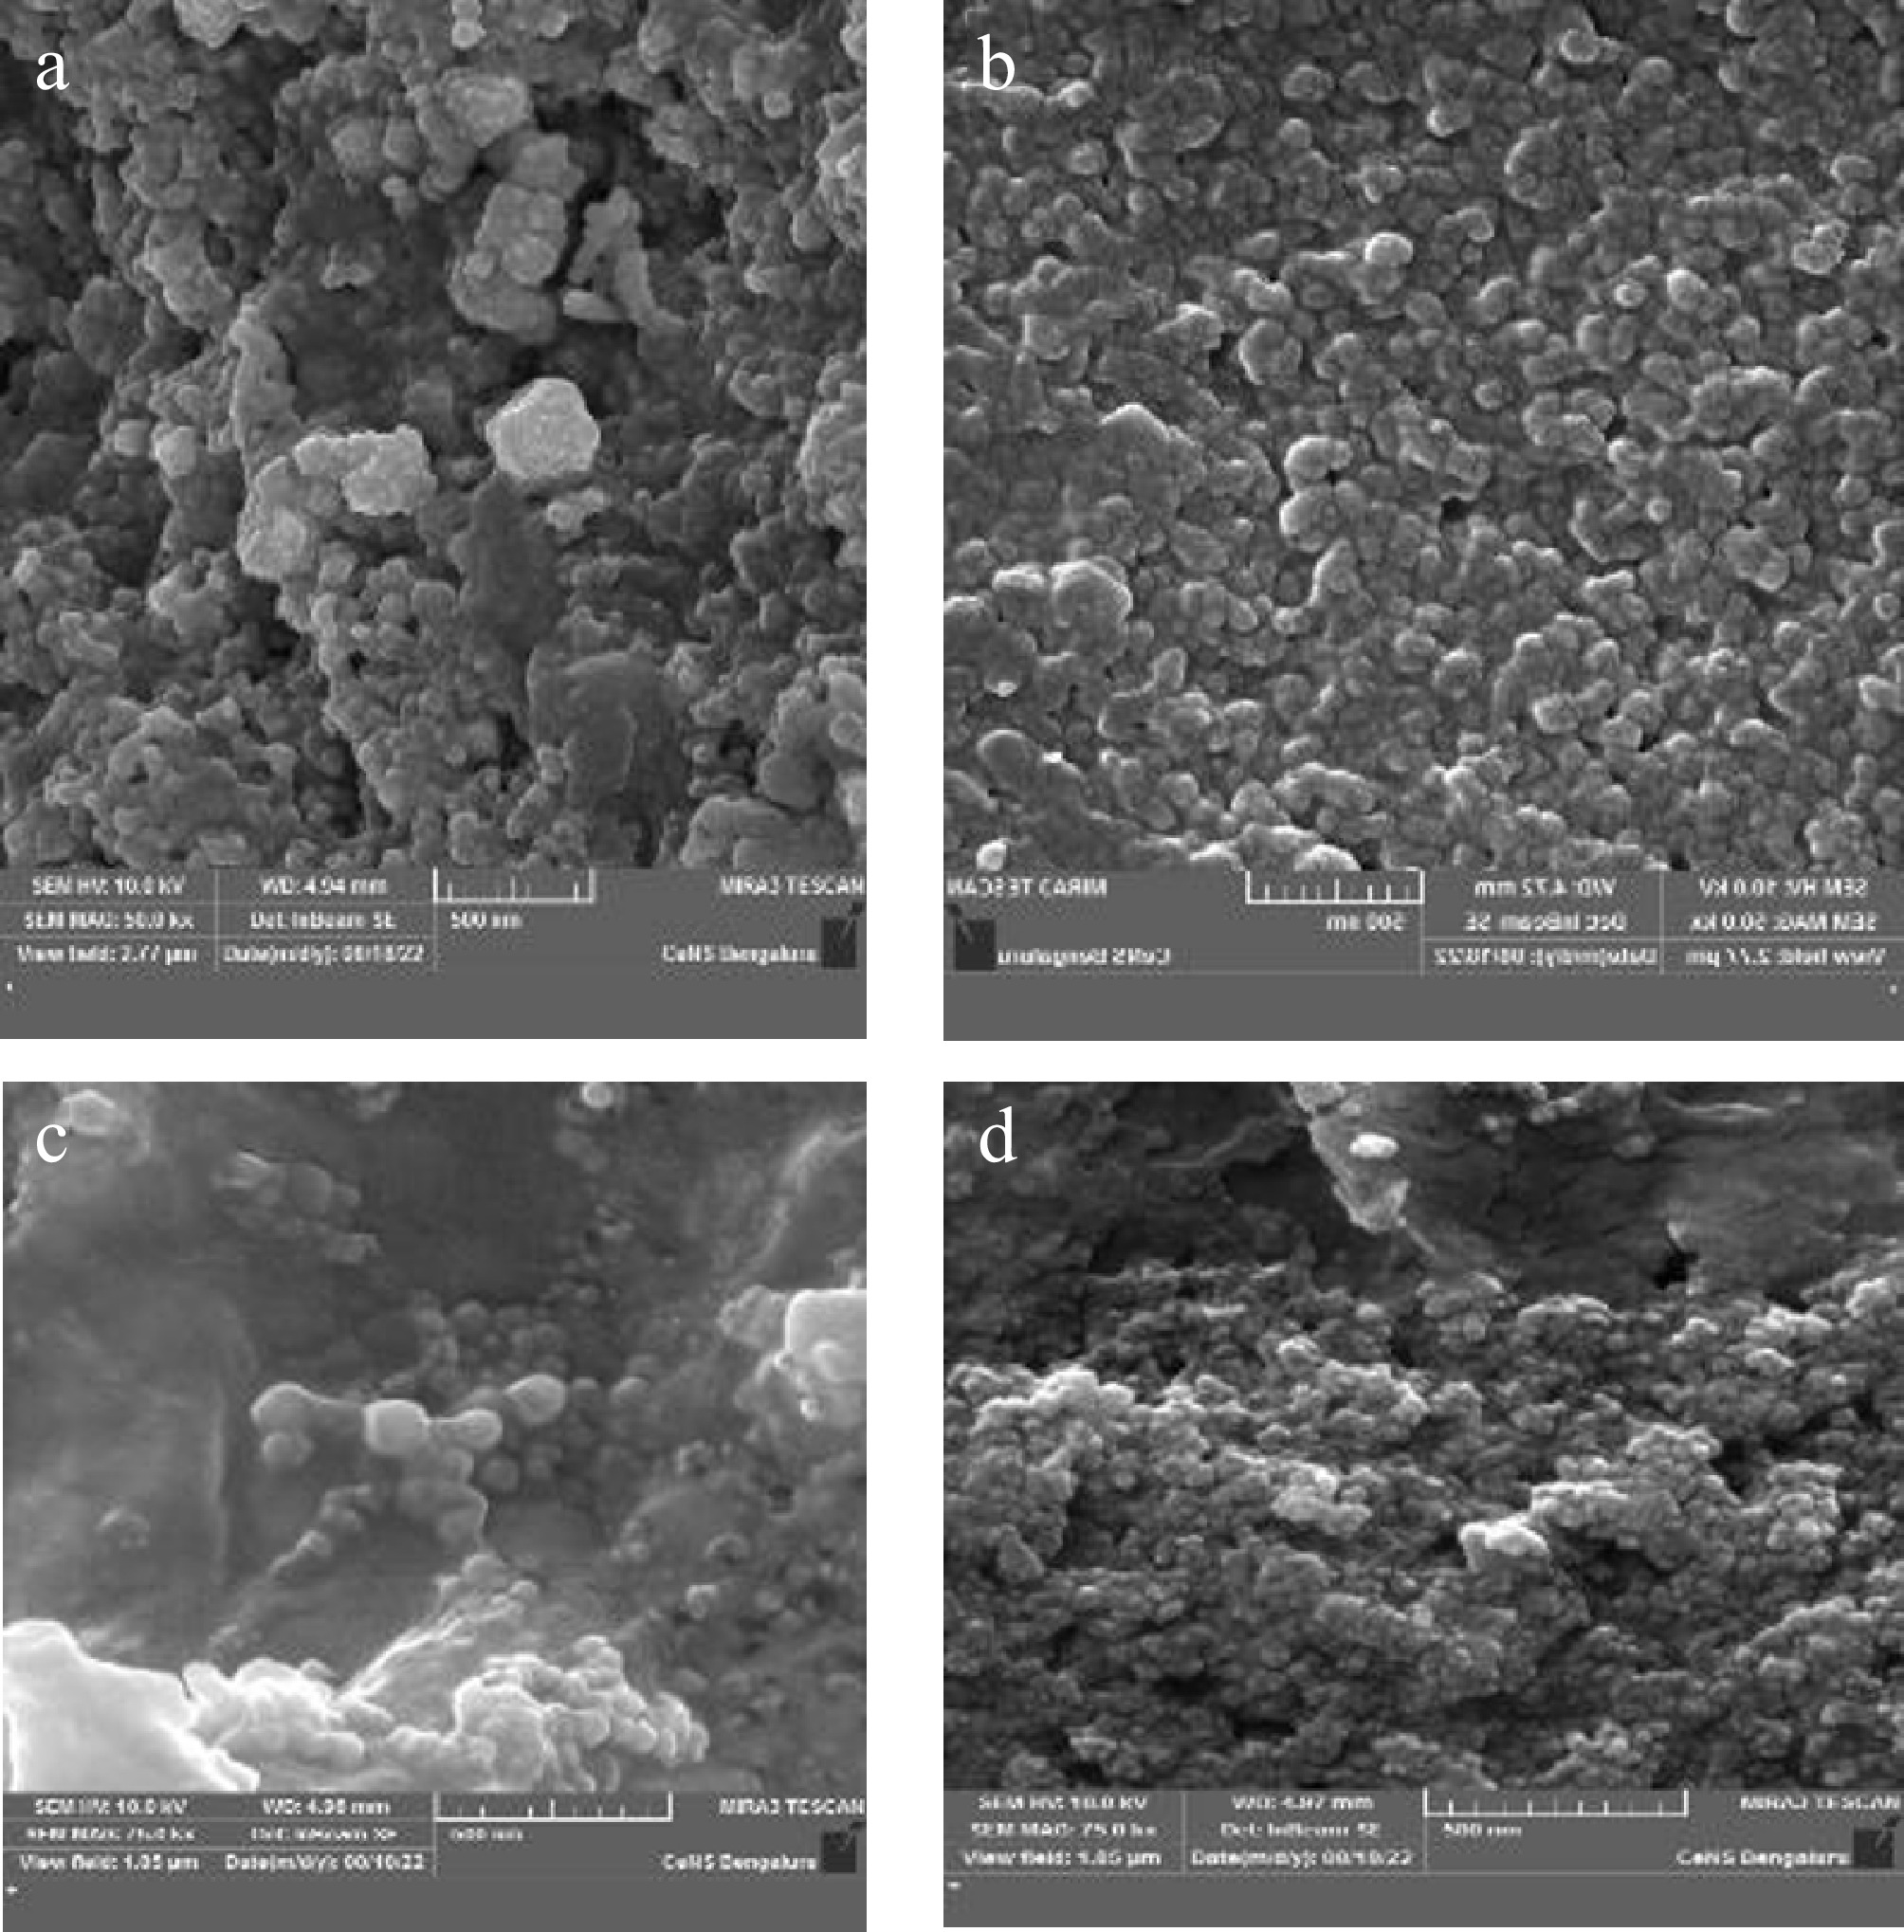
Figure 5.
Field emission scanning electron microscopy (FESEM) image of green synthesized silver nanoparticles. (a) D. metel, (b) A. sativum, (c) M. oleifera, (d) P. julifera.
-
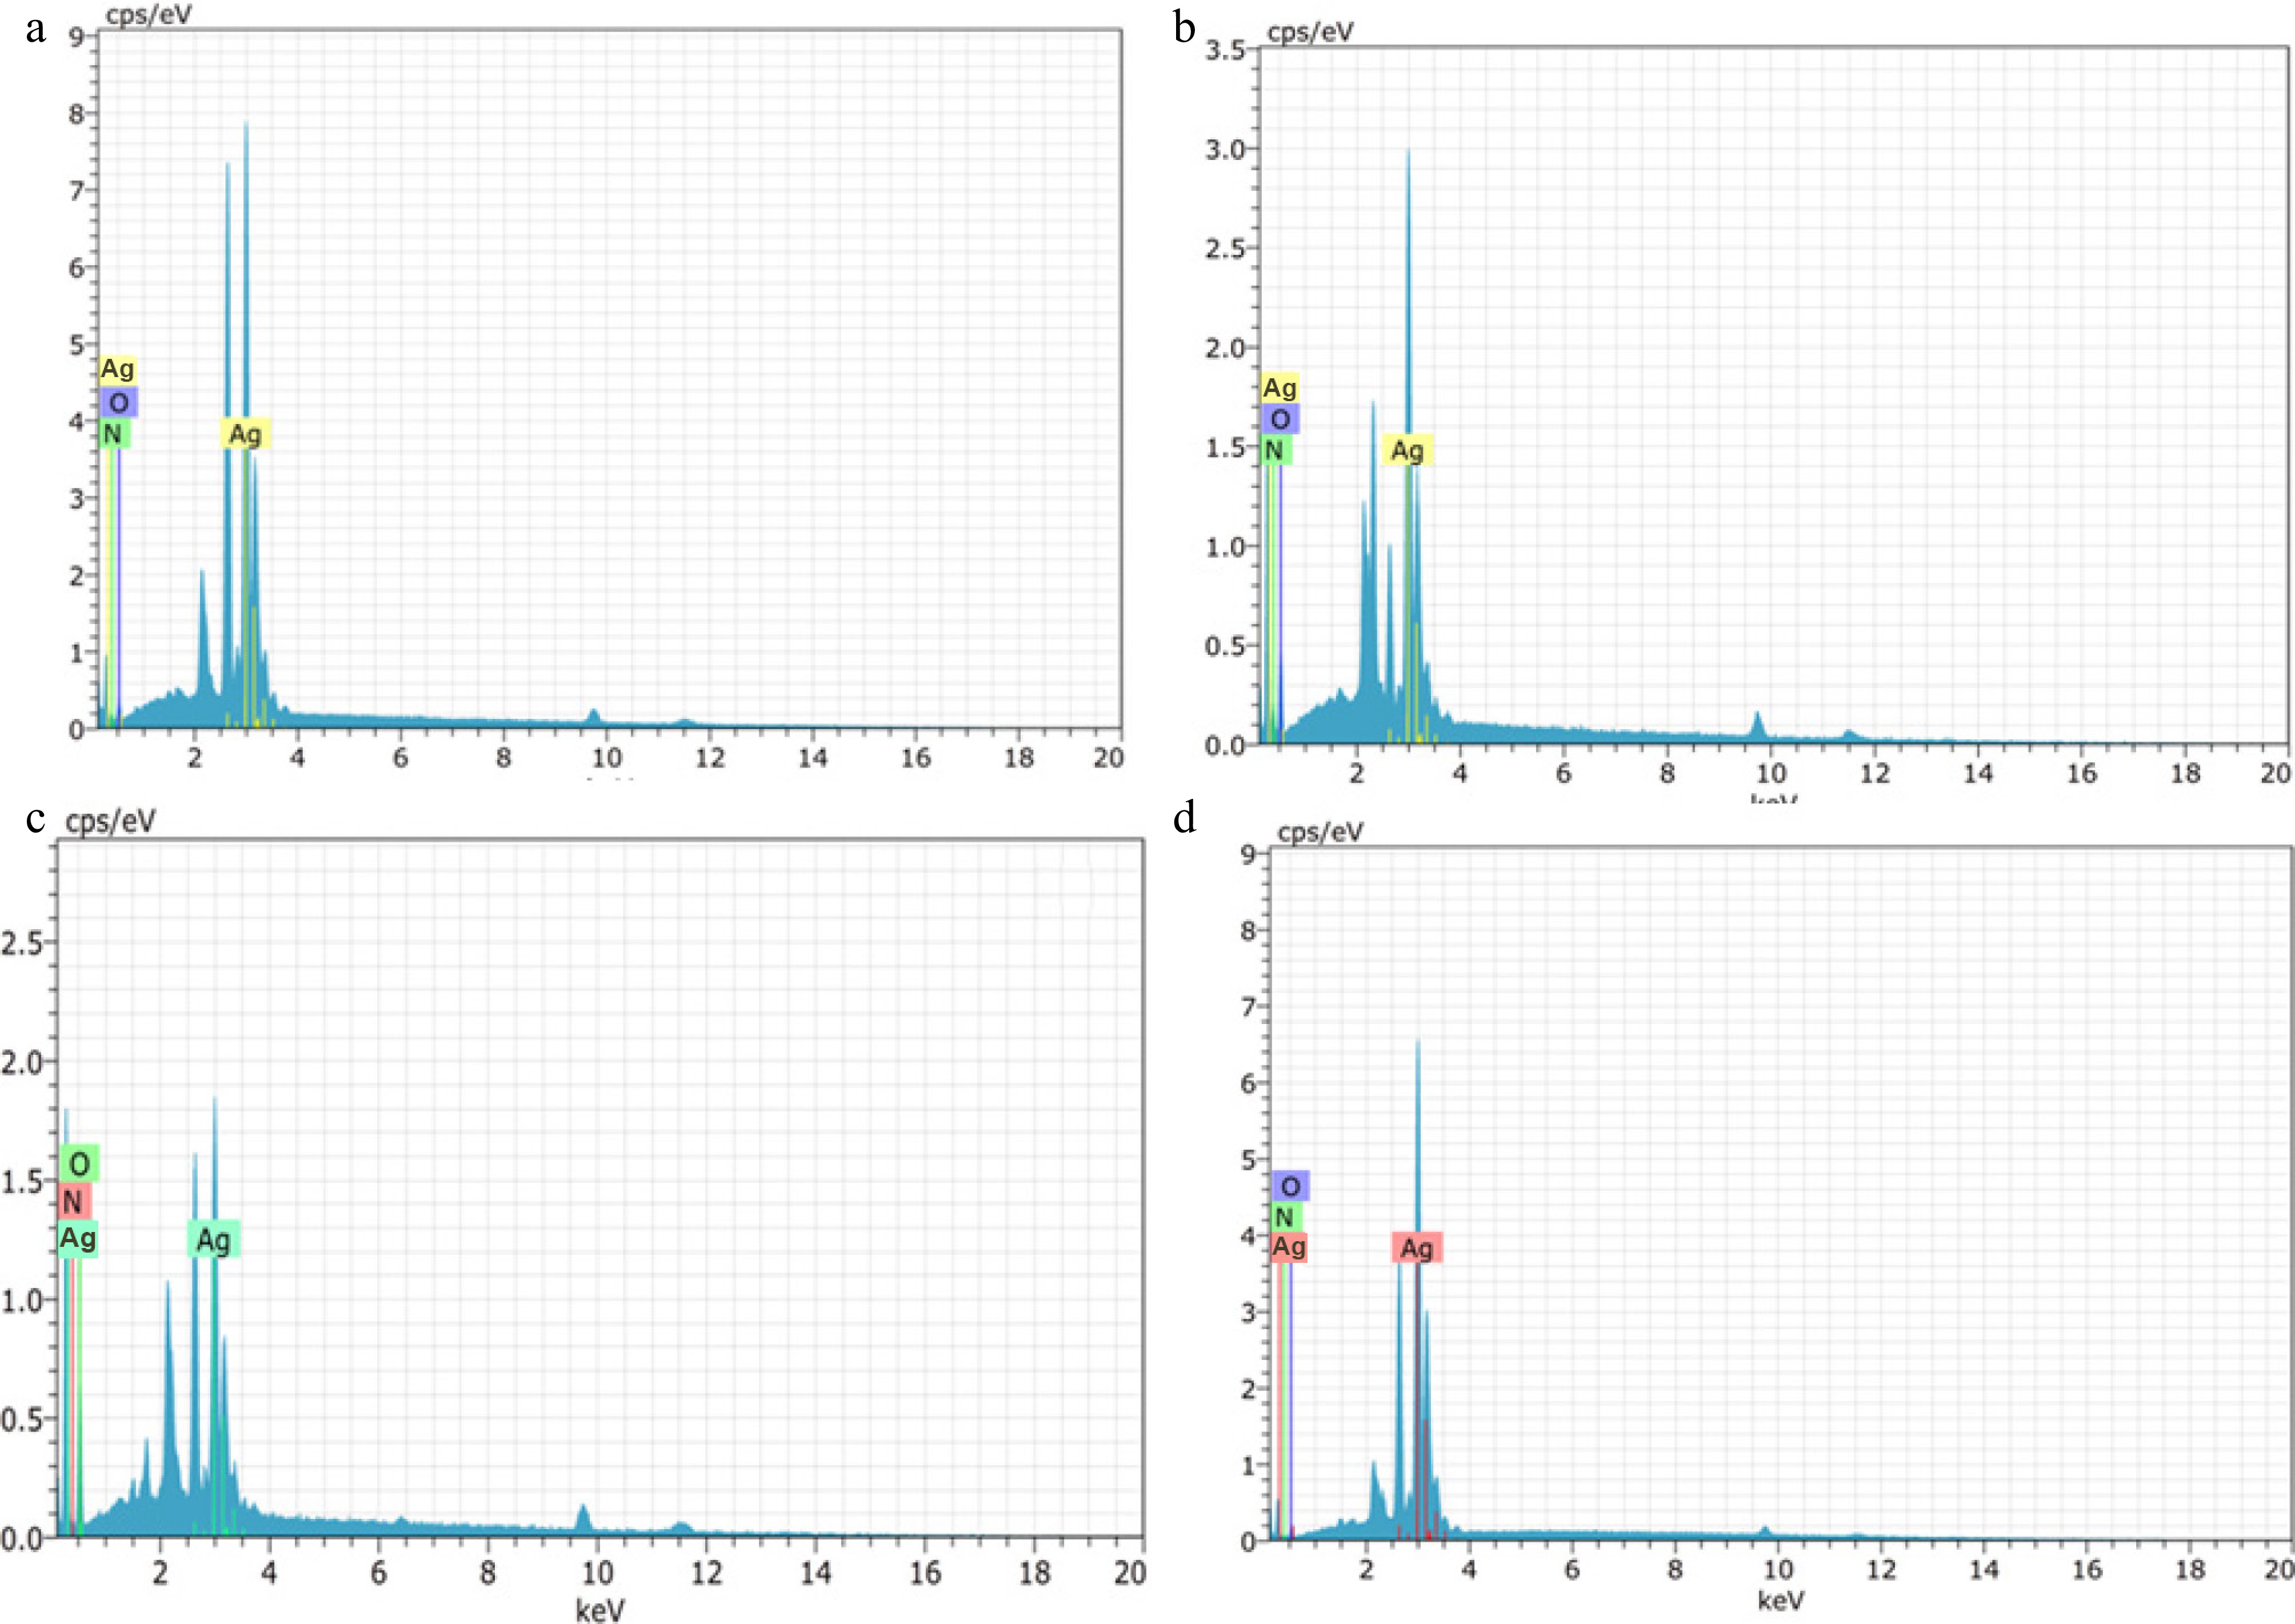
Figure 6.
Energy Dispersive X-Ray Spectroscopy (EDX) spectra of green silver nanoparticles synthesized from (a) D. metel, (b) A. sativum, (c) M. oleifera, (d) P. julifera.
-
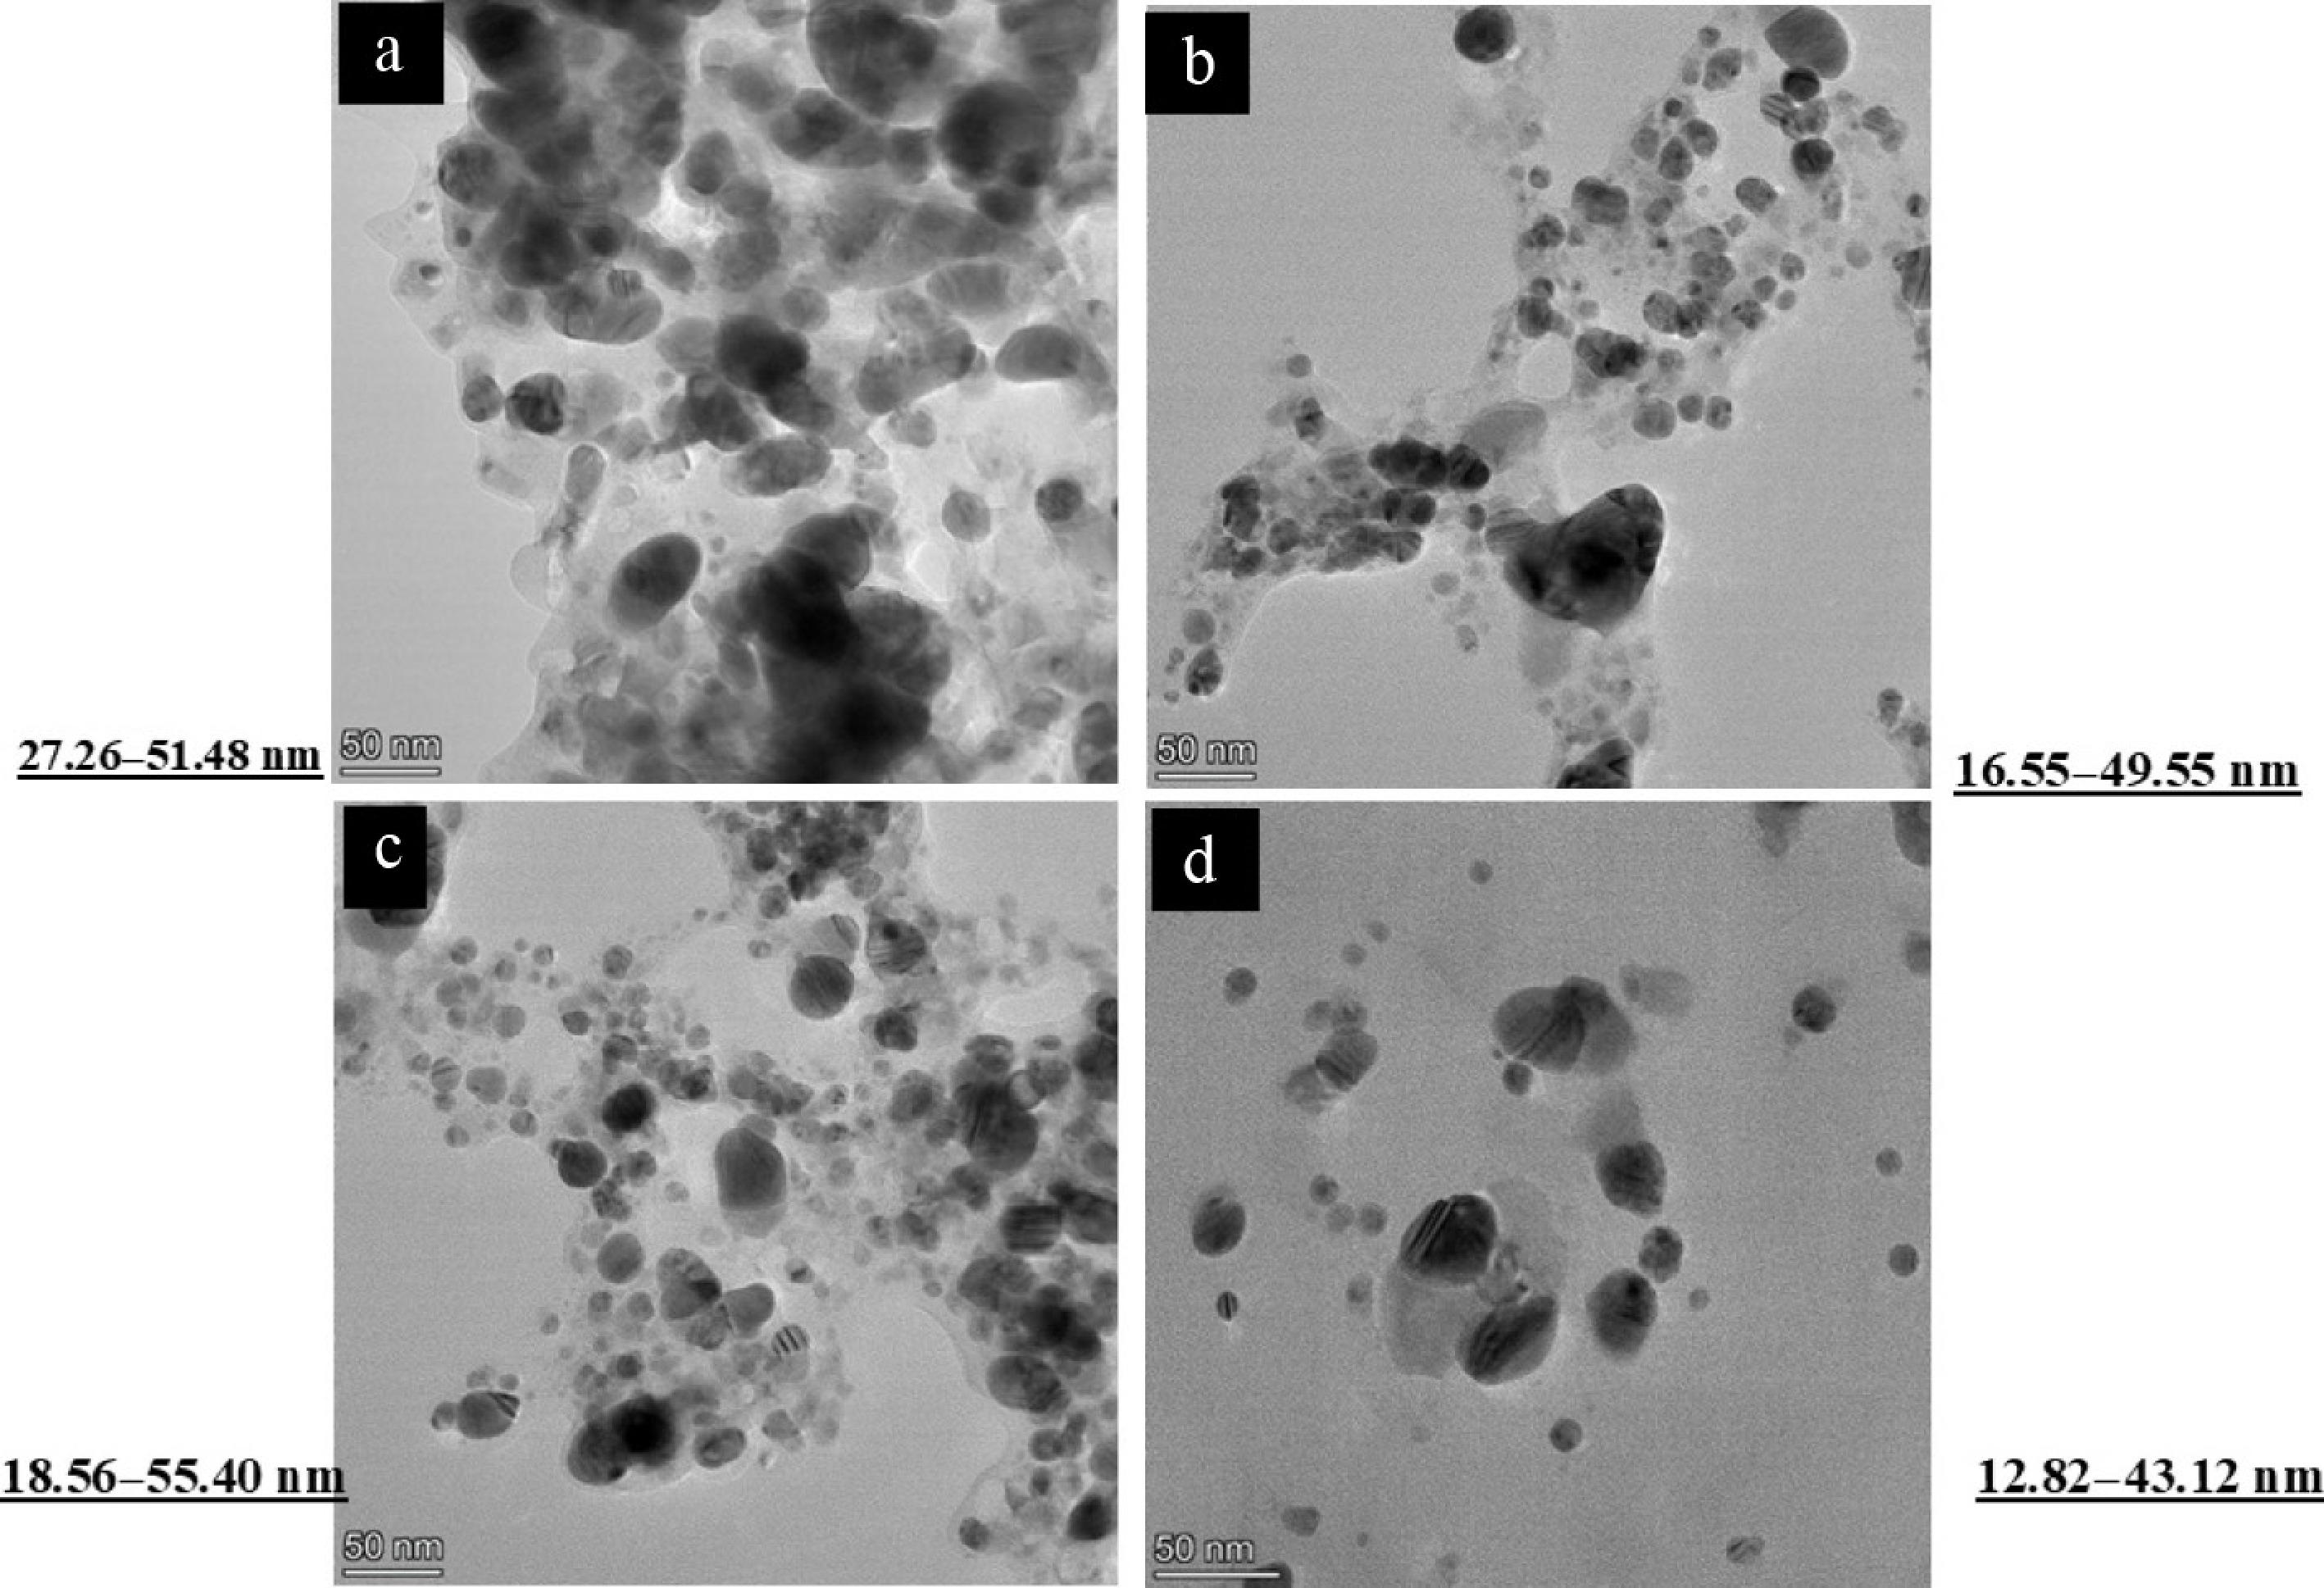
Figure 7.
Transmission Electron Microscope (TEM) image of green silver nanoparticles synthesized from (a) D. metel, (b) A. sativum, (c) M. oleifera, (d) P. julifera.
-
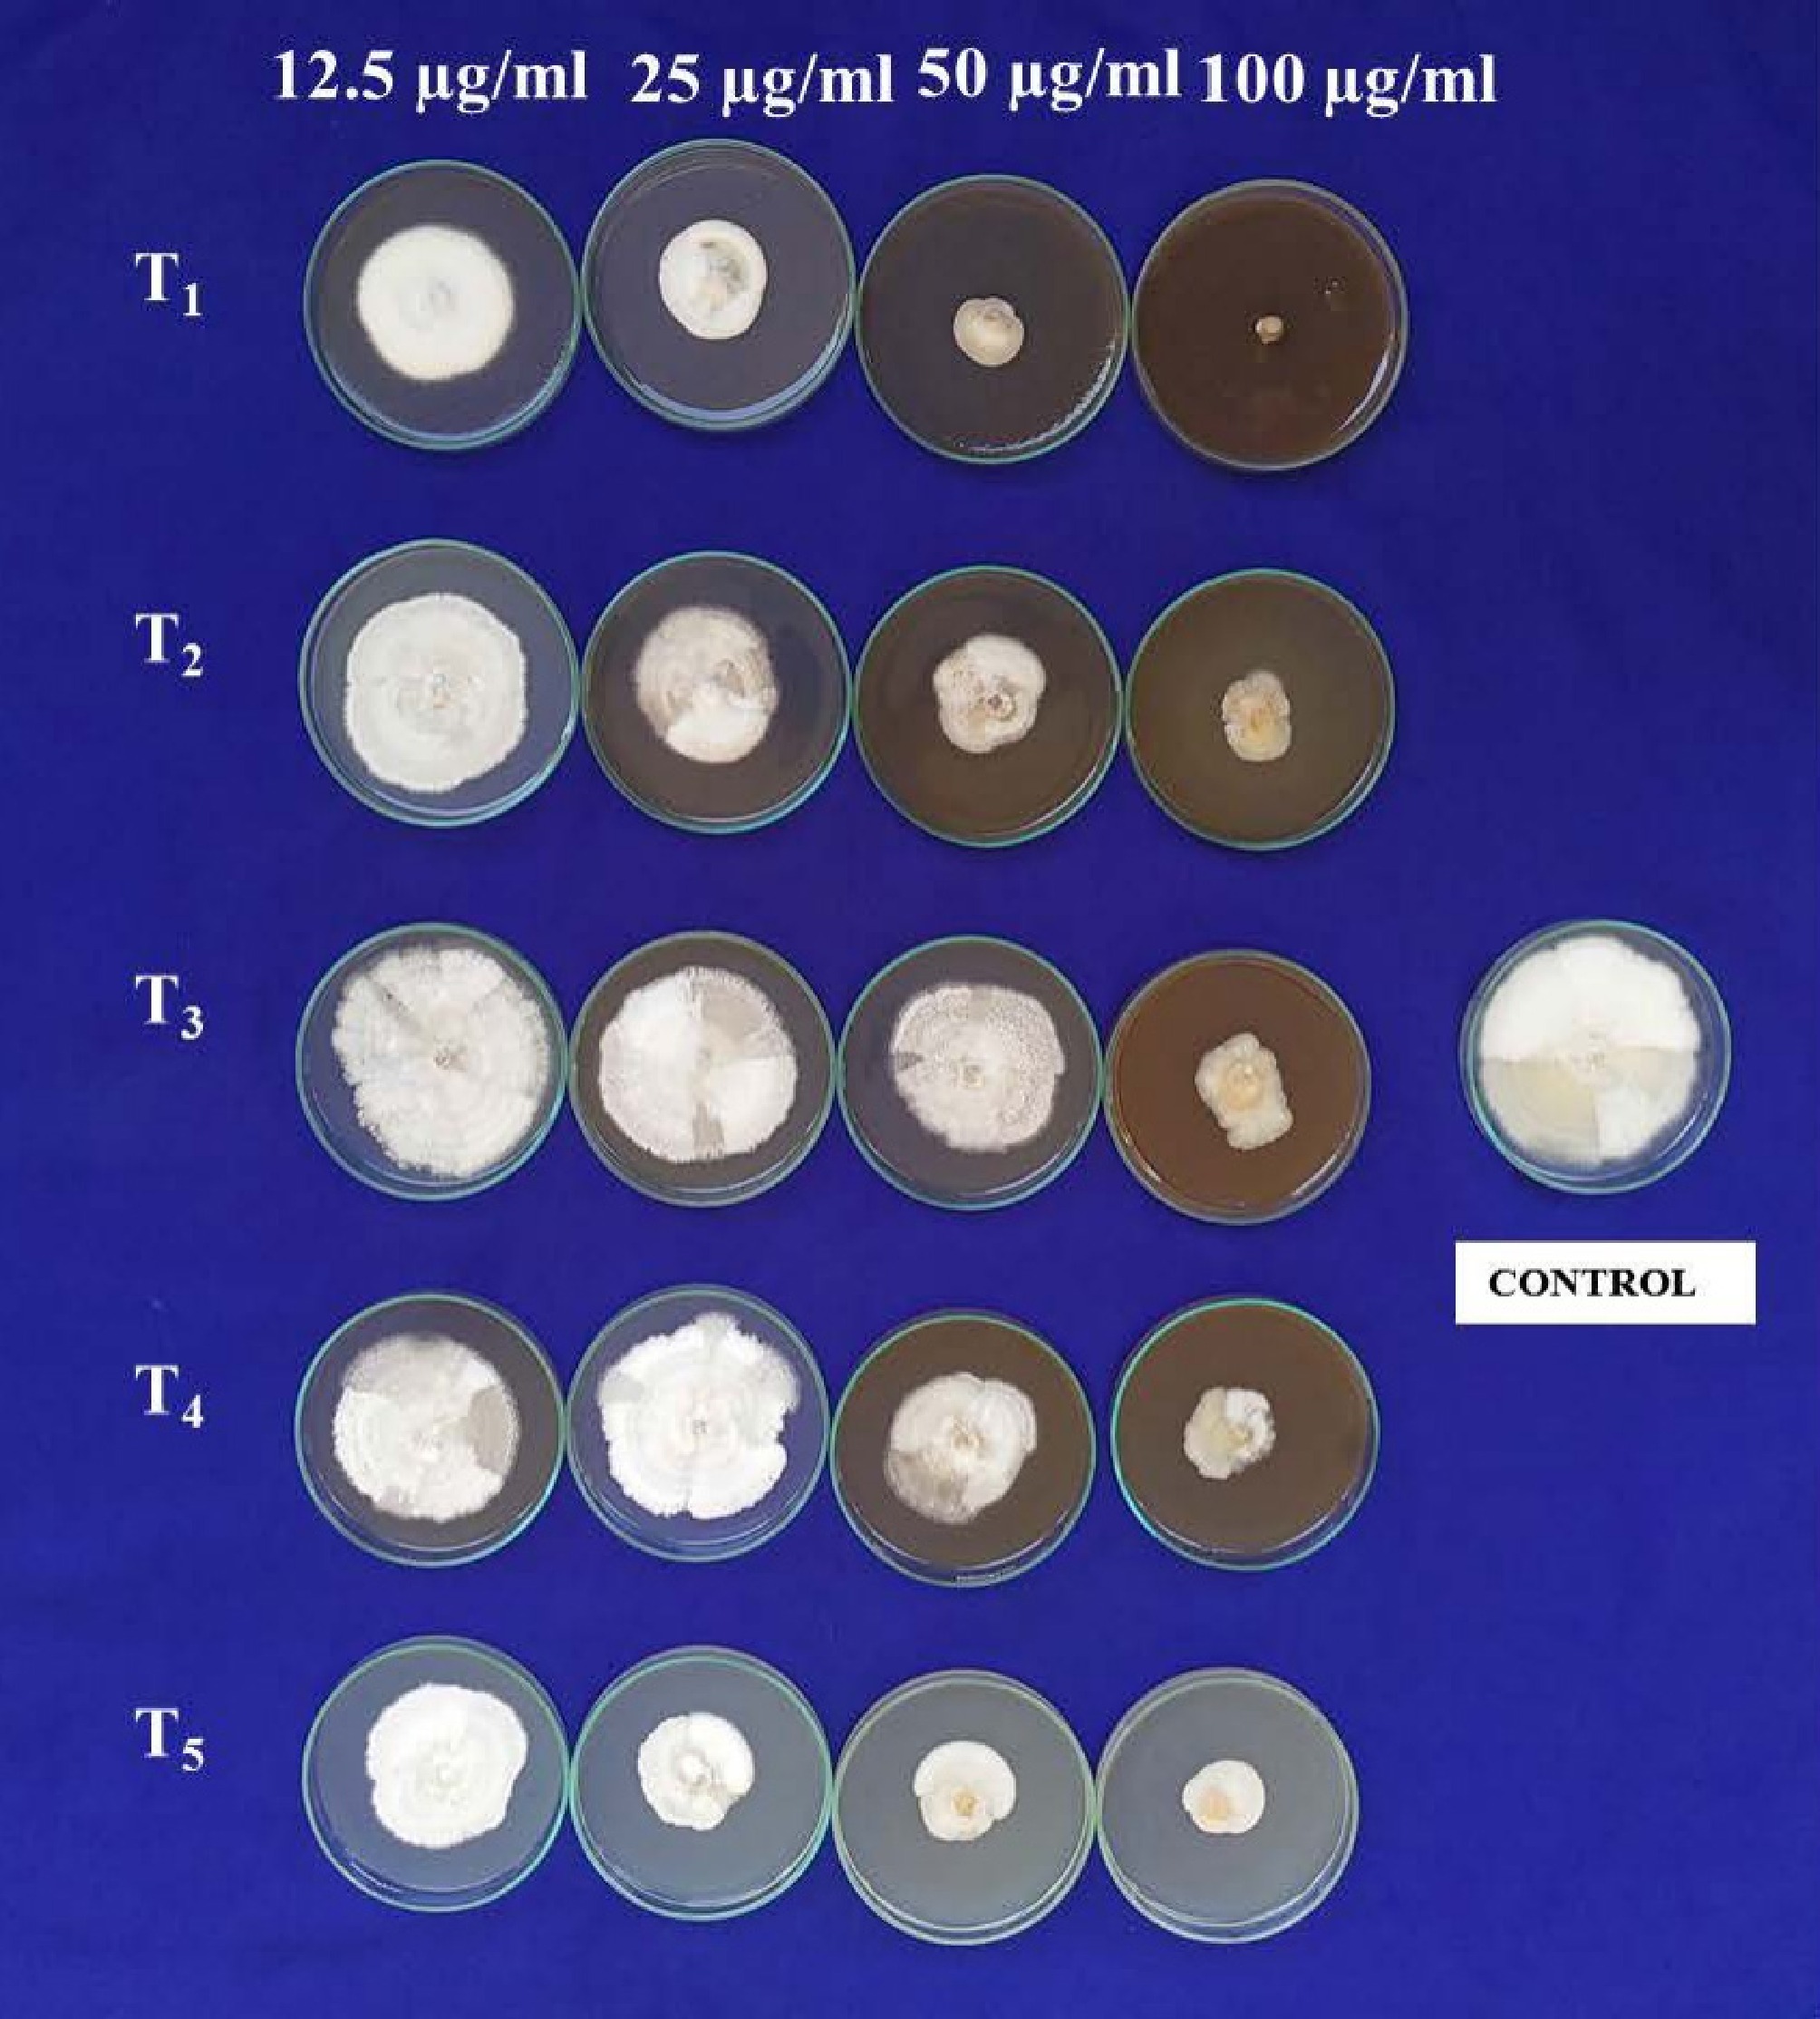
Figure 8.
Antifungal bio assay AgNPs against C. gloeosporioides. T1: D. metel, T2: A. sativum,T3: M. oleifera, T4: P. julifera.
-
Sl.
No.Treatment Concentrations 12.5 µg·mL−1 25 µg·mL−1 50 µg·mL−1 100 µg·mL−1 MG MI #Sporulation MG MI Sporulation MG MI Sporulation MG MI Sporulation 1 D. metel-AgNPs 54.93 (47.81) 38.96 ++ 30.00 (33.20) 66.67 + 25.00 (29.99) 72.22 _ 0.01 (0.54) 99.99 _ 2 A. sativum-AgNPs 64.90 (53.65) 27.89 ++ 53.11 (46.76) 40.99 + 44.03 (41.56) 51.07 _ 23.00 (28.65) 74.44 _ 3 M. oleifera-AgNPs 78.31 (62.22) 12.99 ++ 67.00 (54.92) 25.56 ++ 57.33 (49.20) 36.30 + 35.00 (36.26) 61.11 _ 4 P. julifera-AgNPs 74.66 (59.76) 17.04 ++ 68.00 (55.53) 24.45 + 54.00 (47.28) 40.00 _ 29.66 (32.99) 67.04 _ 5 AgNO3 78.96 (62.67) 12.27 ++ 59.33 (50.36) 34.07 + 54.67 (47.66) 39.26 _ 27.67 (31.72) 69.26 _ 6 Copper oxy
chloride63.2 (52.7) 30.00 ++ 45.6(42.5) 49.30 + 32.4(35.0) 63.99 + 19.7 (26.2) 78.11 − SE ± m CD (p = 0.01) Treatment 0.15 0.42 Concentration 0.13 0.37 Treatment × Concentration 0.29 0.83 Data represent mean mycelial growth (MG, mm), angular-transformed values in parentheses, and mycelial inhibition over control (MI, %). Sporulation scoring: ++ = good (5–10 spores/microscopic field, 40×); + = poor (1–5 spores/microscopic field, 40×); – = no sporulation. Mean of three replications. CD = critical difference at p = 0.01; SE = standard error. Table 1.
In vitro evaluation of green-synthesized silver nanoparticles (AgNPs) against Colletotrichum gloeosporioides using the poison food technique.
Figures
(8)
Tables
(1)