-
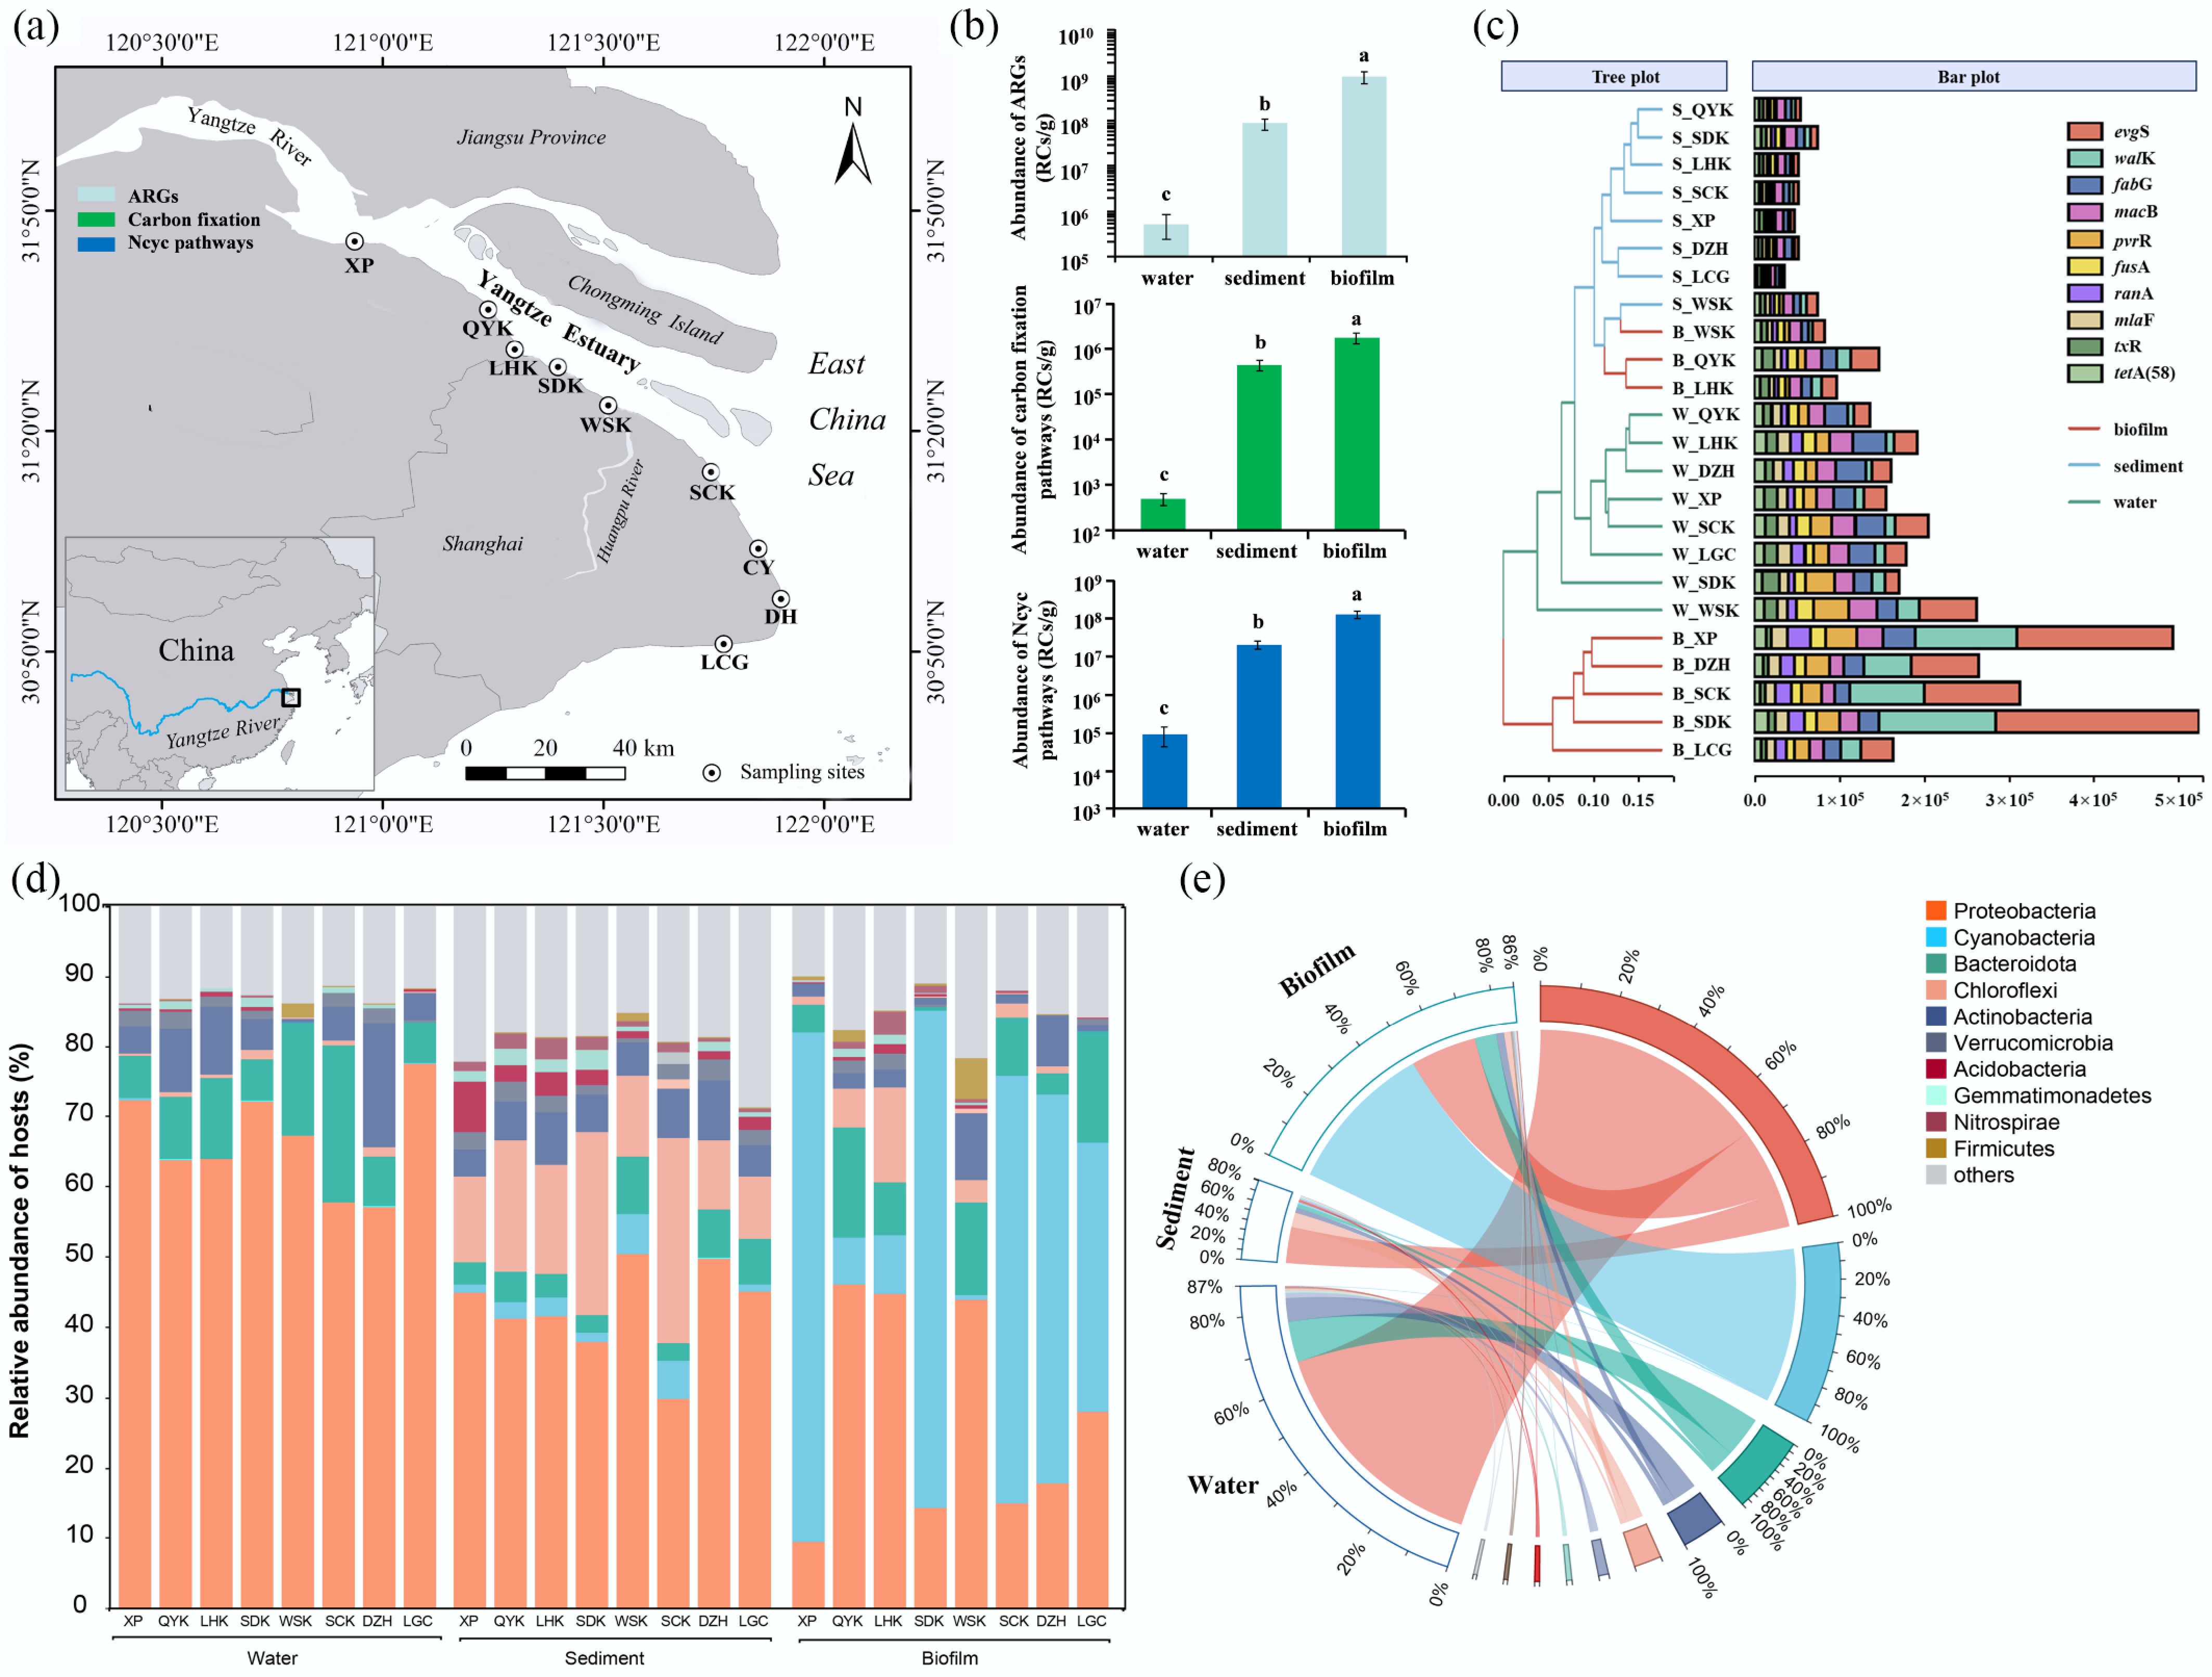
Figure 1.
(a) The eight sampling sites along the Yangtze Estuary, (b) the average abundances of ARGs, carbon fixation, and nitrogen cycling genes in the biofilms, sediments and water samples, (c) the abundance of individual ARGs in biofilm, sediment and water samples in the eight sampling sites, and their cluster analysis, (d) the relative abundance of ARGs hosts showed by sampling site, and (e) medium.
-
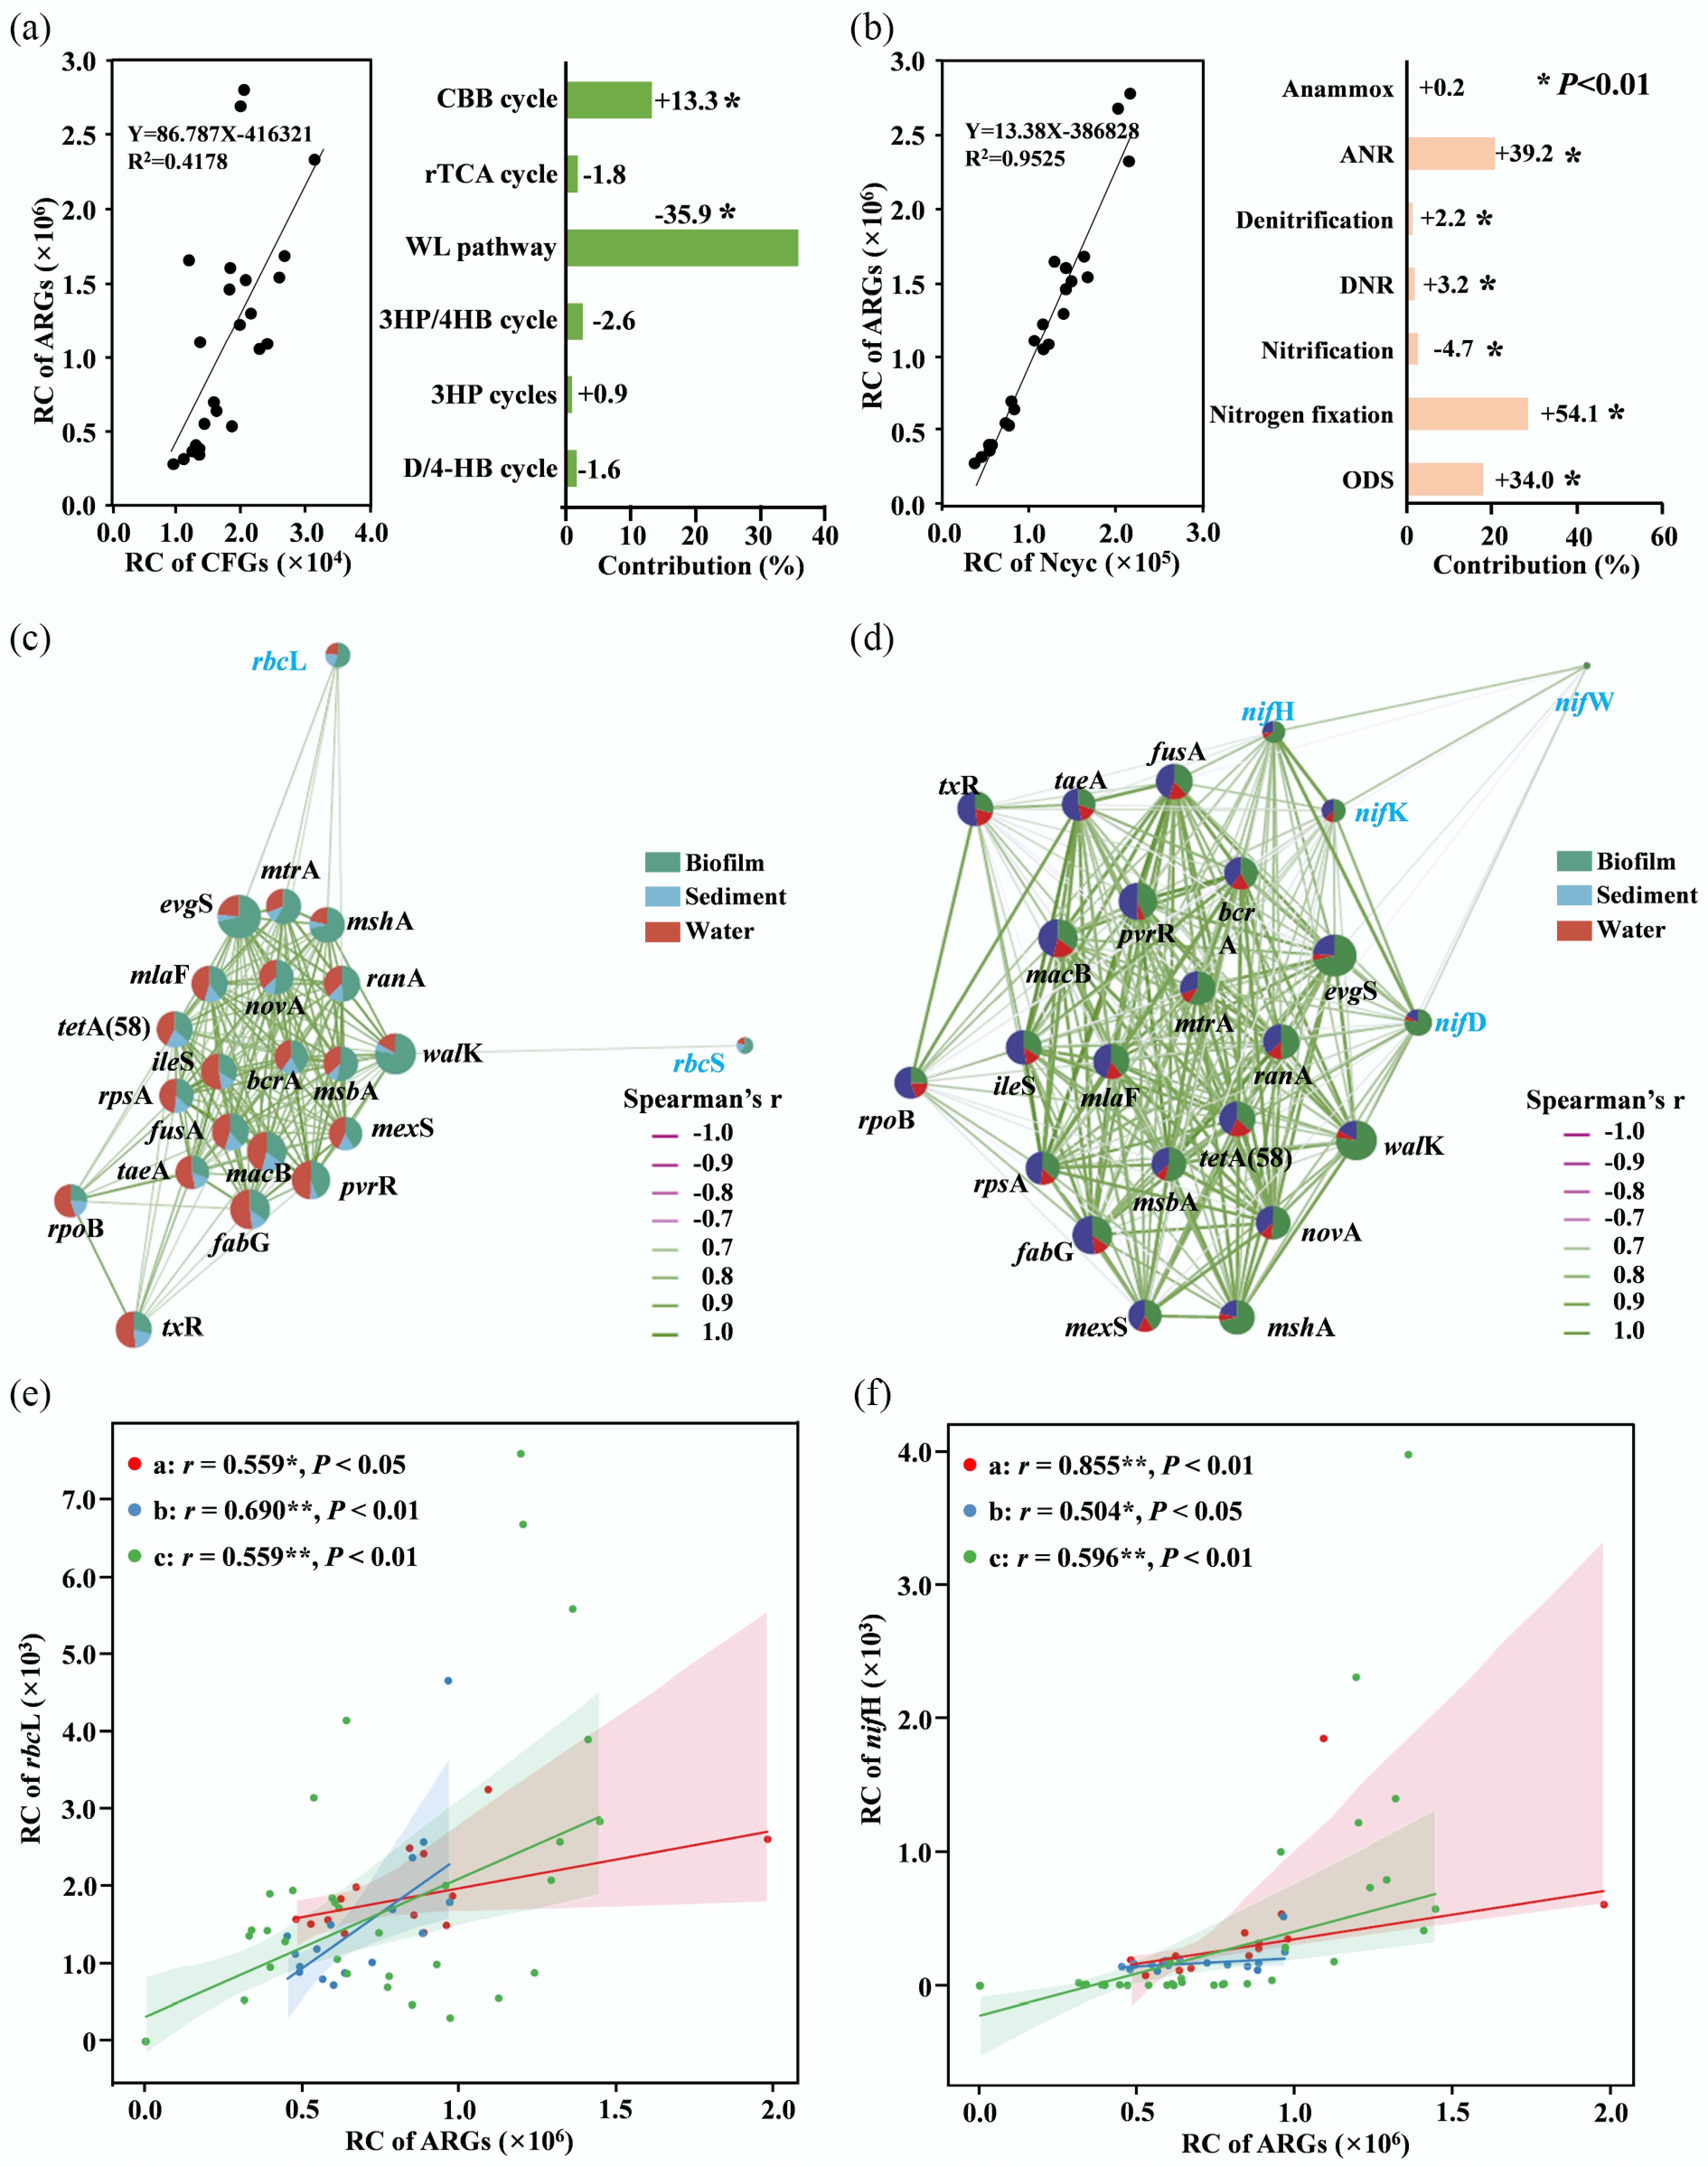
Figure 2.
Corelationship between ARGs and carbon-nitrogen fixing genes or pathways. (a) Relationship between the total abundances of ARGs and carbon-fixing genes, with contributions of different pathways to ARG variation by pRDA. (b) The relationship between the total abundances of ARGs and nitrogen metabolic genes, with contributions of different pathways to ARG variation by pRDA. (c) Network of functional genes of the Calvin cycle and the top 20 abundant individual ARGs. (d) Network of functional genes in nitrogen fixation and the top 20 abundant individual ARGs. (e) Relationship between rbcL and ARGs. (f) Relationship between nifH and ARGs. Red indicates the Nile River Estuary, blue indicates Chinese estuaries, and green indicates the East China Sea. Symbols: +, positive correlation; −, negative correlation; *, significant correlations between ARGs and functional genes (p < 0.05).
-
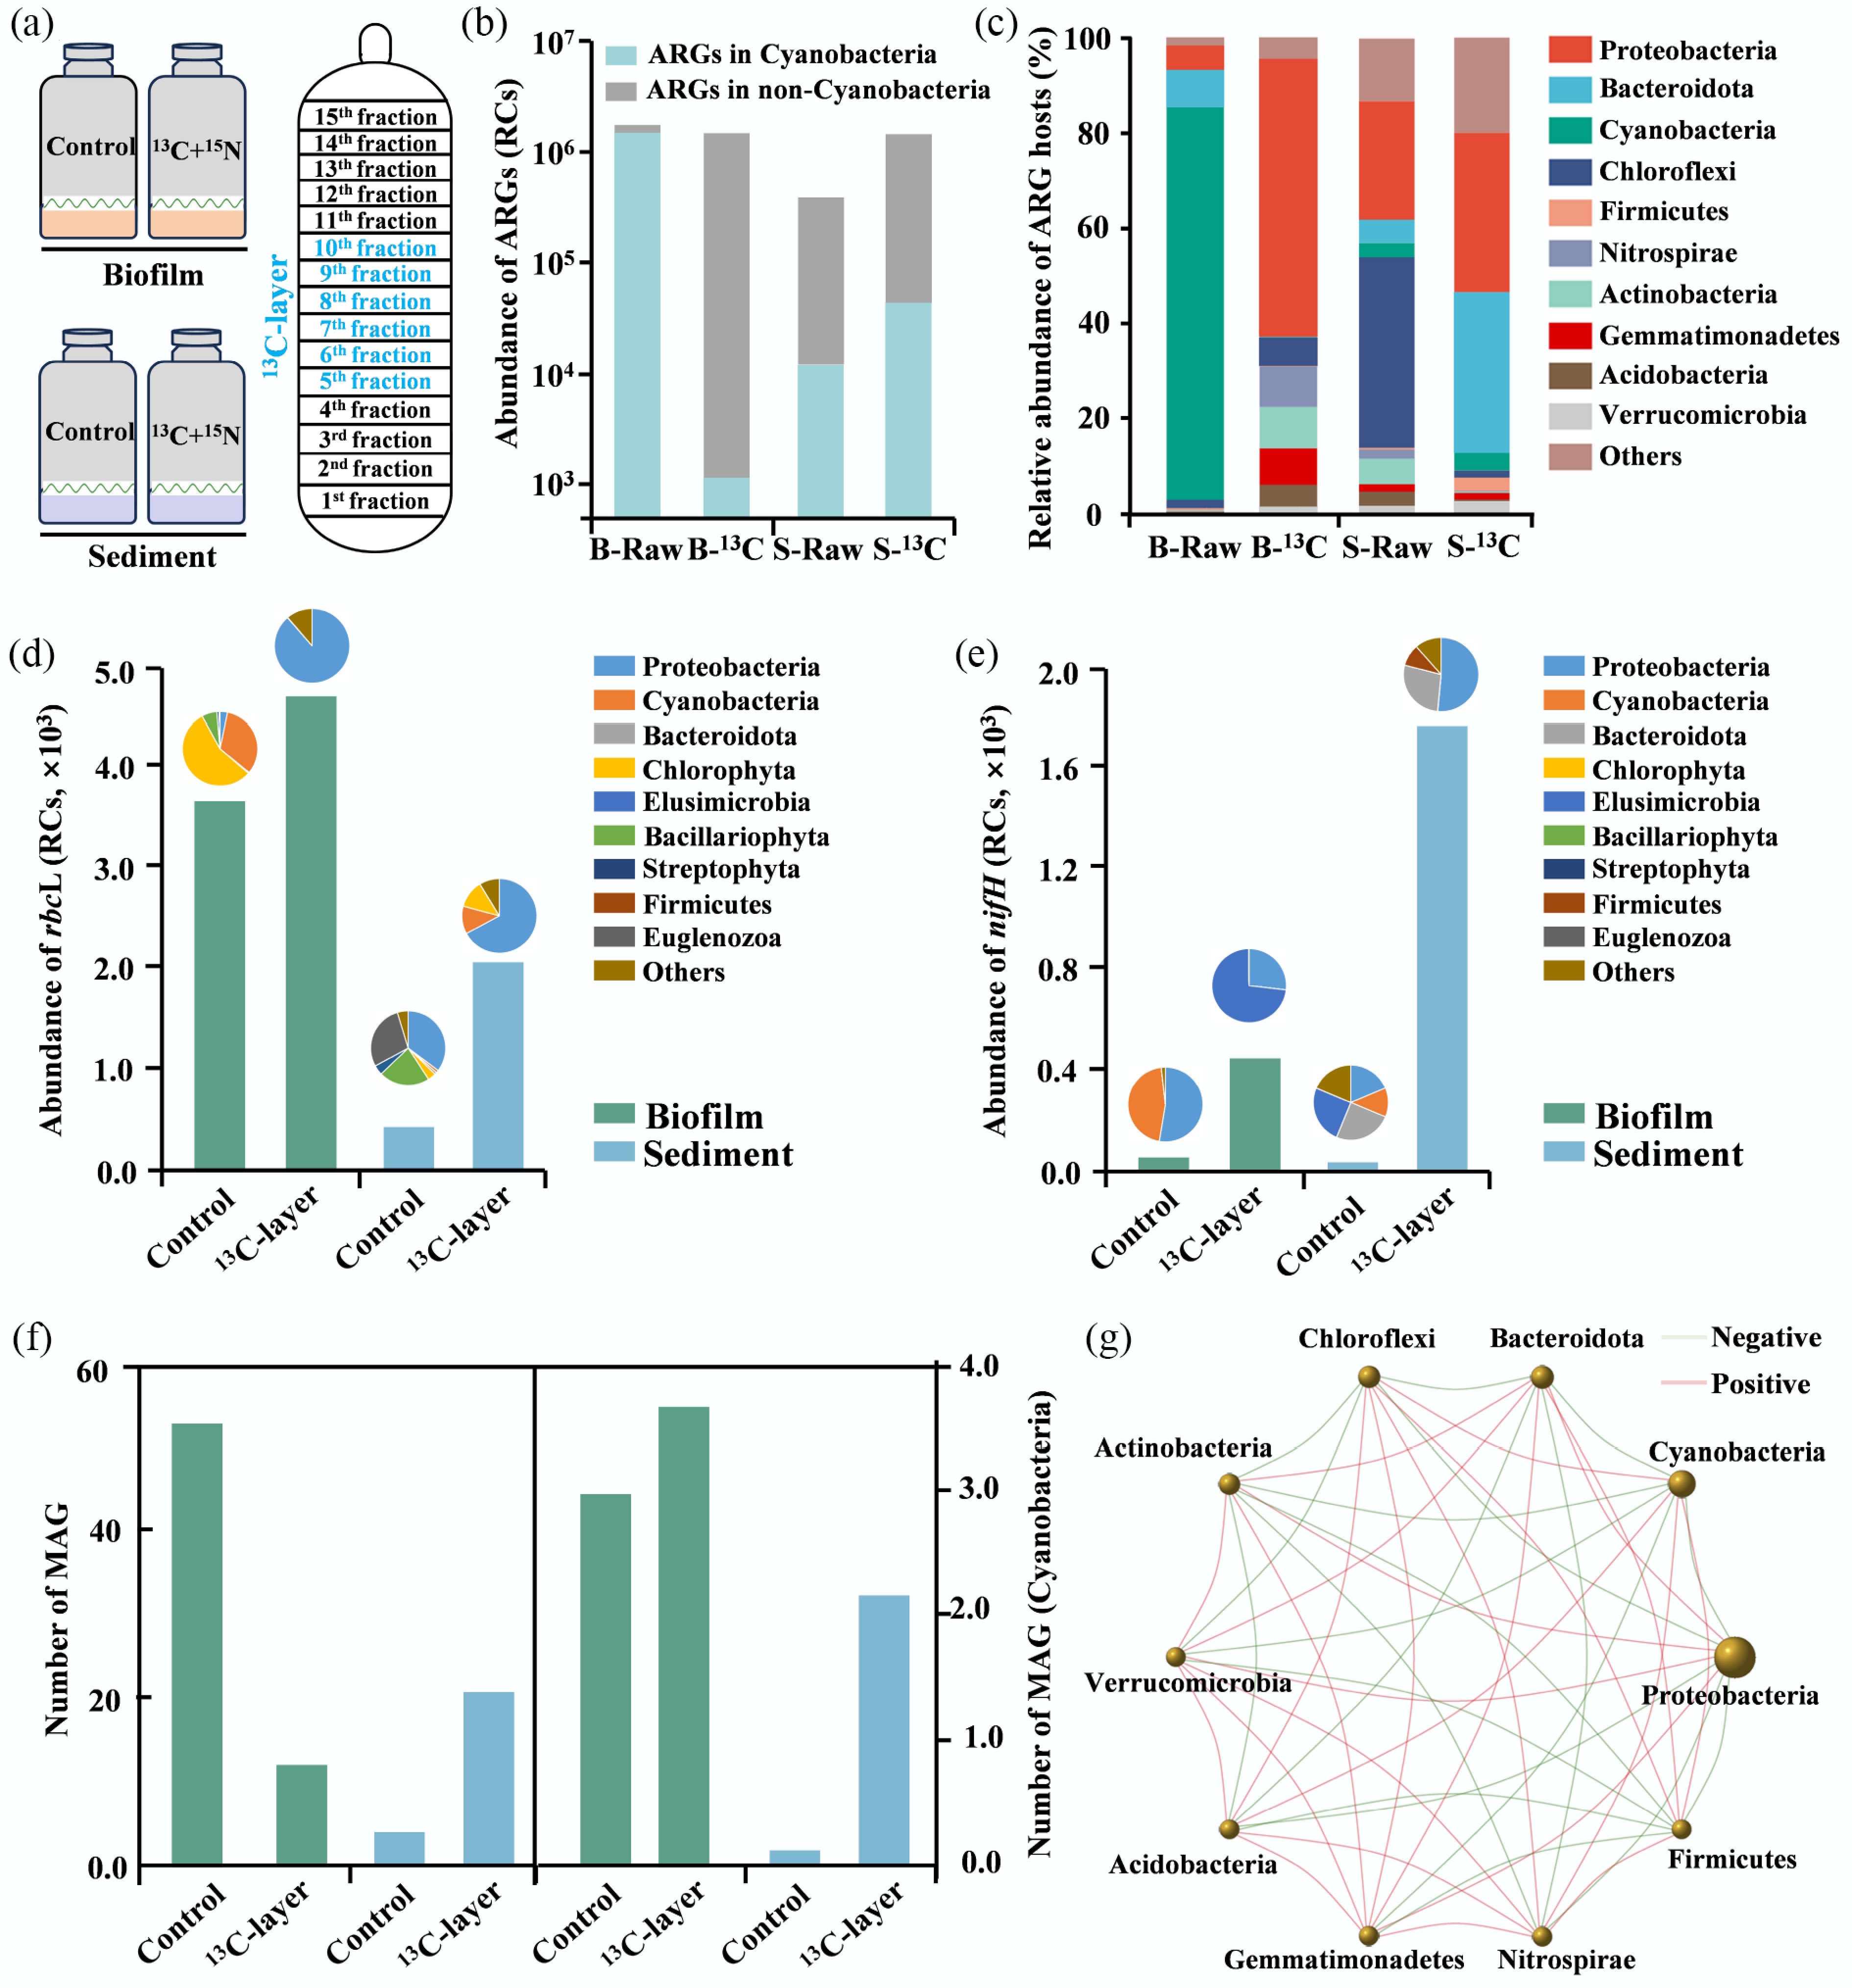
Figure 3.
The DNA-SIP microcosms of biofilm and sediment taken along the Yangtze Estuary. (a) The DNA-SIP microcosm and DNA stratification. (b) The abundance of ARGs in control and 13C-layer groups. (c) The relative abundance of ARGs hosts in control and 13C-layer groups. (d) The abundance of rbcL and its hosts in control and 13C-layer groups. (e) The abundance of nifH and its hosts in control and 13C-layer groups. (f) The abundance of MAGs and the MAGs of Cyanobacteria in control and 13C-layer groups. (g) The network of ARGs hosts in the biofilm, sediment, and water samples.
-
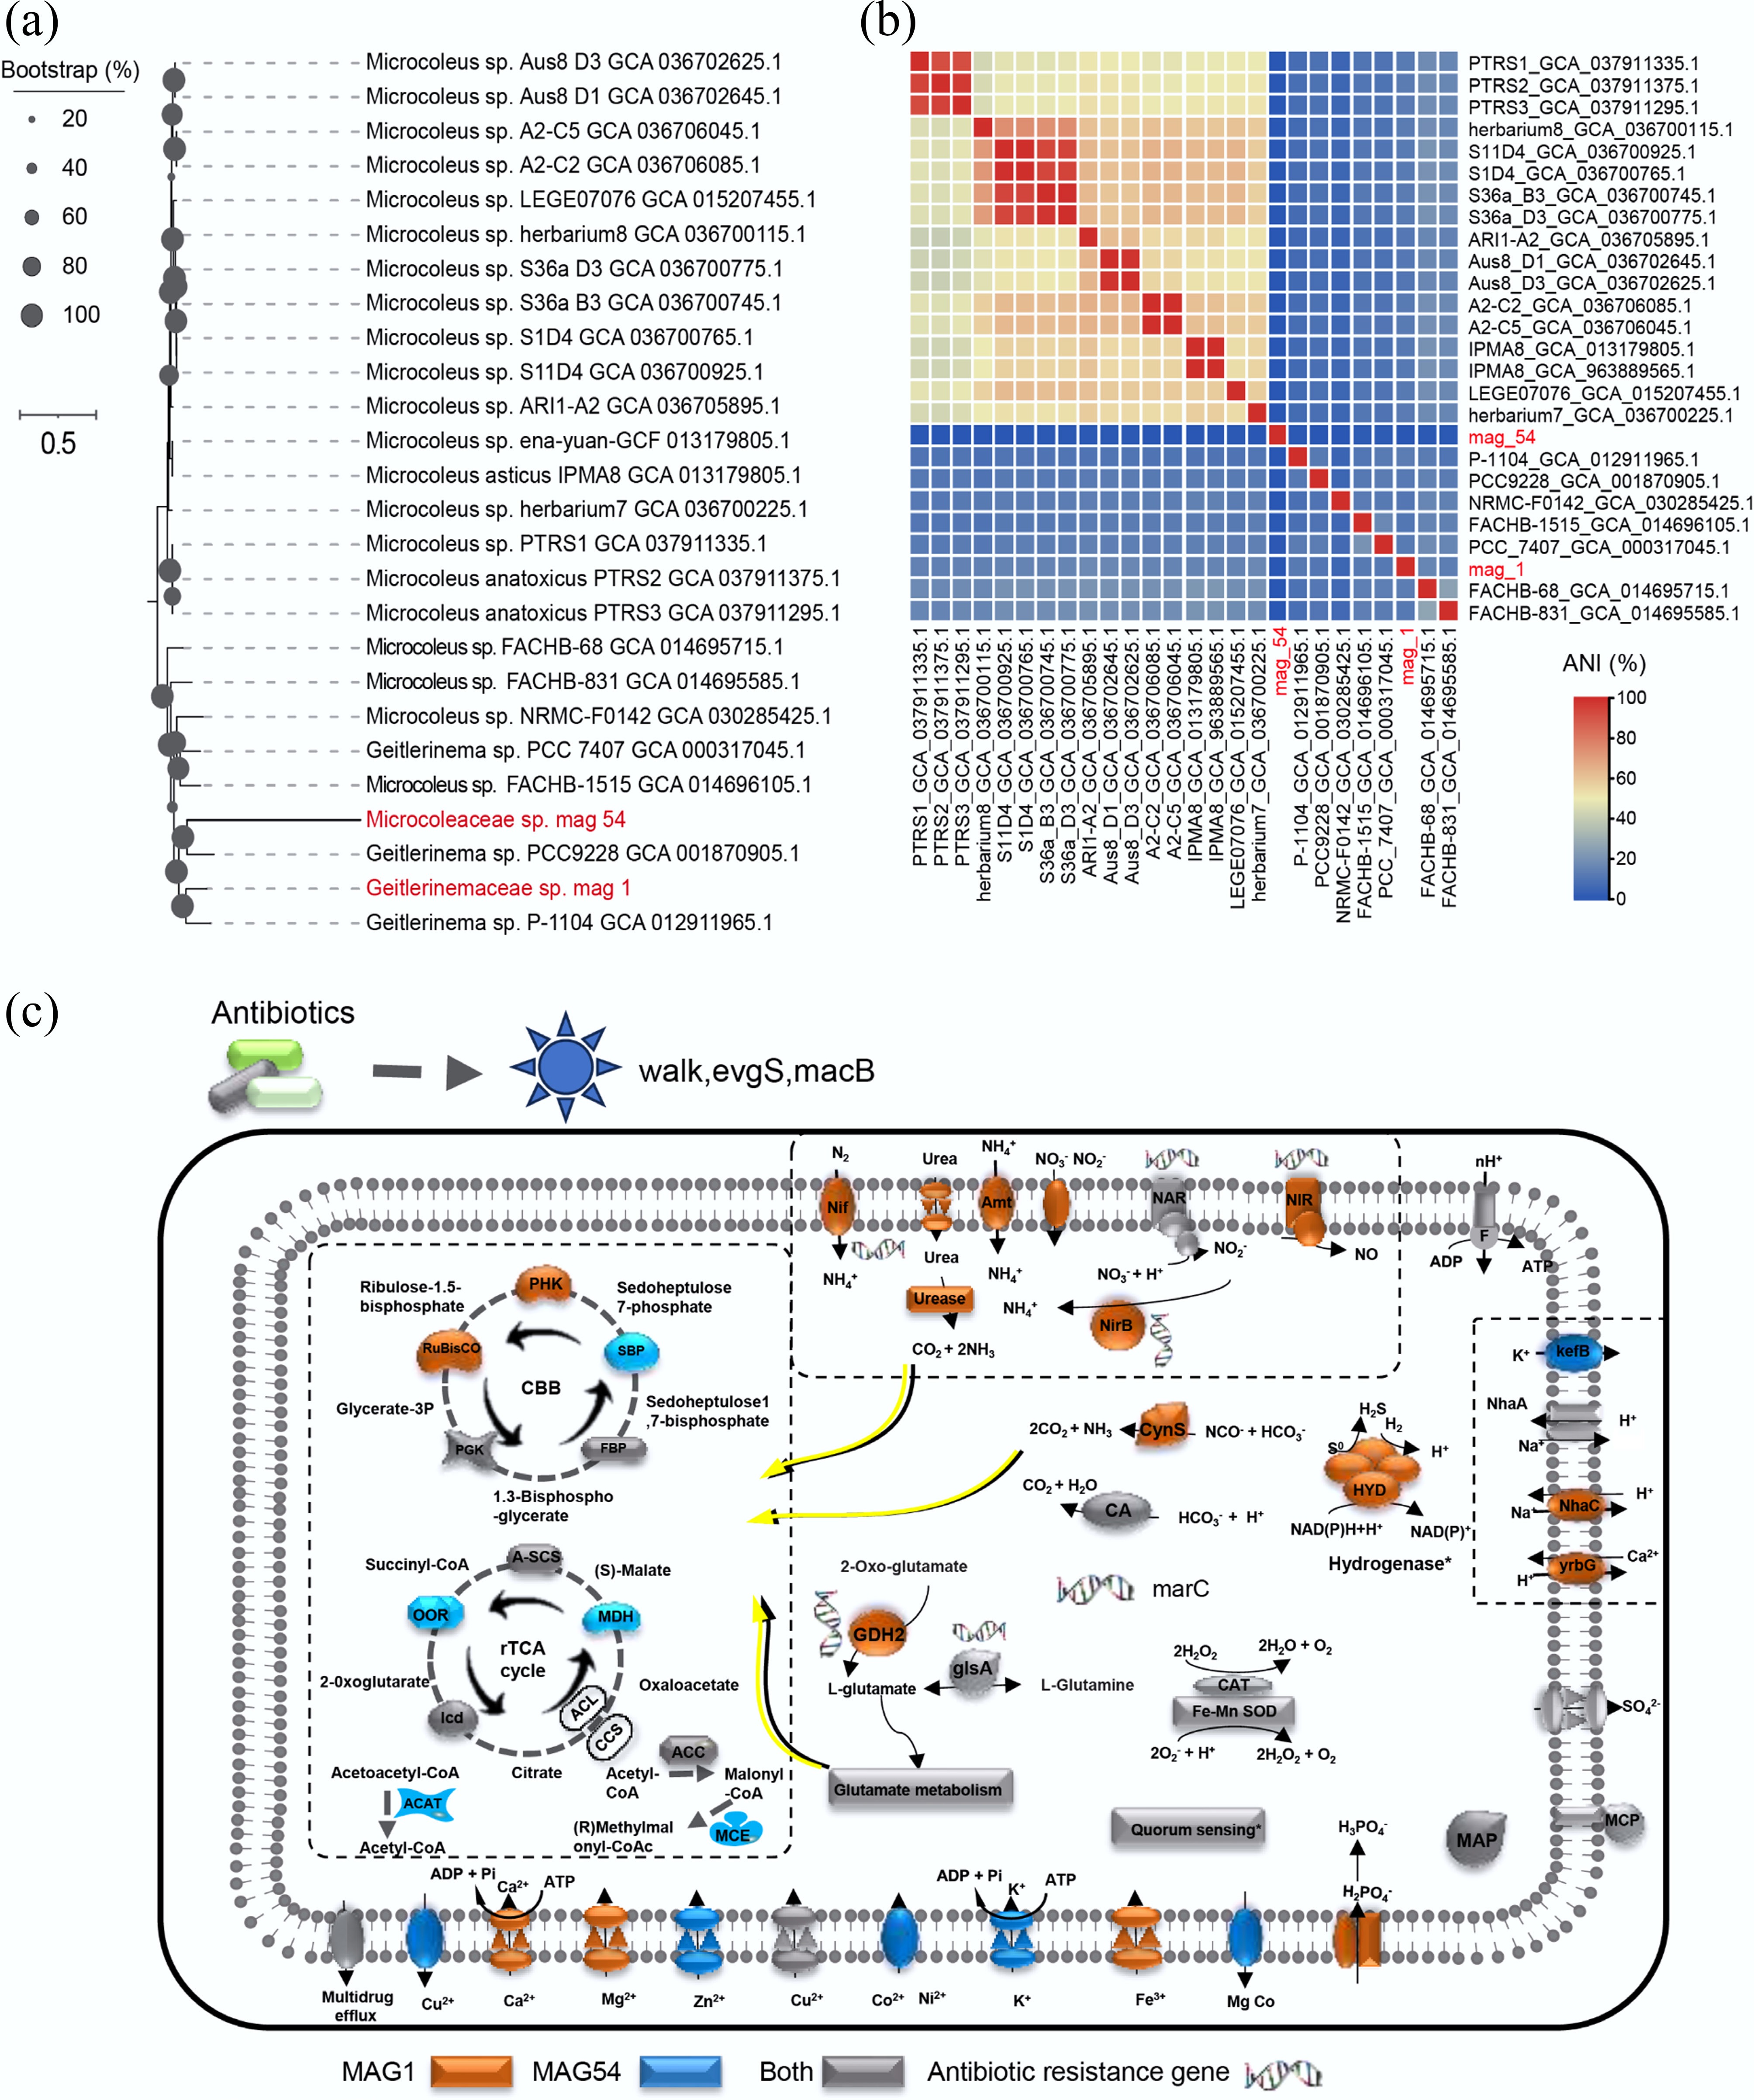
Figure 4.
(a) A phylogenomic tree was constructed to investigate the evolutionary relationships among Cyanobacterial genomes: (b) Average Nucleotide Identity (ANI) analysis was performed to assess further assess the genomic similarities and differentiation among the Cyanobacterial strains. (c) Metabolic analyses of cyanobacteria metagenome-assembled genomes (MAGs), providing insights into their survival strategies in estuarine coastal biofilms. Colors denote the presence of specific genes in MAG1 (orange), MAG54 (blue), or both (grey). Asterisks represent incomplete features. Key enzymes and pathways are abbreviated as follows: Nif, nitrogen fixation protein, amt, ammonium transporter; NAR, ferredoxin-nitrate reductase; NIR, ferredoxin-nitrite reductase; NirB, nitrite reductase (NADH) large subunit; CynS, cyanate; CA, carbonic anhydrase; HYD, 3b [NiFe] hydrogenase; CAT, catalase; kefB, glutathione-regulated potassium-efflux system protein; NhaA, Na+ : H+ antiporter; yrbG, Na+ : H+ antiporter; MAP, methionyl aminopeptidase; GDH2, glutamate dehydrogenase; glsA, glutaminase; MarC, nitrite reductase (NADH) large subunit; MCP, methyl-accepting protein; MSP, methionine salvage pathway; SOD, superoxide dismutase. PGK, phosphoglycerate kinase; RuBisCO, ribulose-bisphosphate carboxylase large chain; FBP, fructose-bisphosphate aldolase; SBP, fructose-1,6-bisphosphatase II/sedoheptulose-1,7-bisphosphatase; PRK, phosphoribulokinase; A-SCS, succinyl-CoA synthetase alpha subunit; MDH, malate dehydrogenase; ICD, isocitrate dehydrogenase; OOR, 2-oxoglutarate/2-oxoacid ferredoxin oxidoreductase subunit alpha; MCE, methylmalonyl-CoA/ethylmalonyl-CoA epimerase; ACAT, methylmalonyl-CoA/ethylmalonyl-CoA epimerase; ACC, acetyl-CoA C-acetyltransferase. Enzyme complexes of the respiratory chains are labeled using Roman numerals.
Figures
(4)
Tables
(0)