-
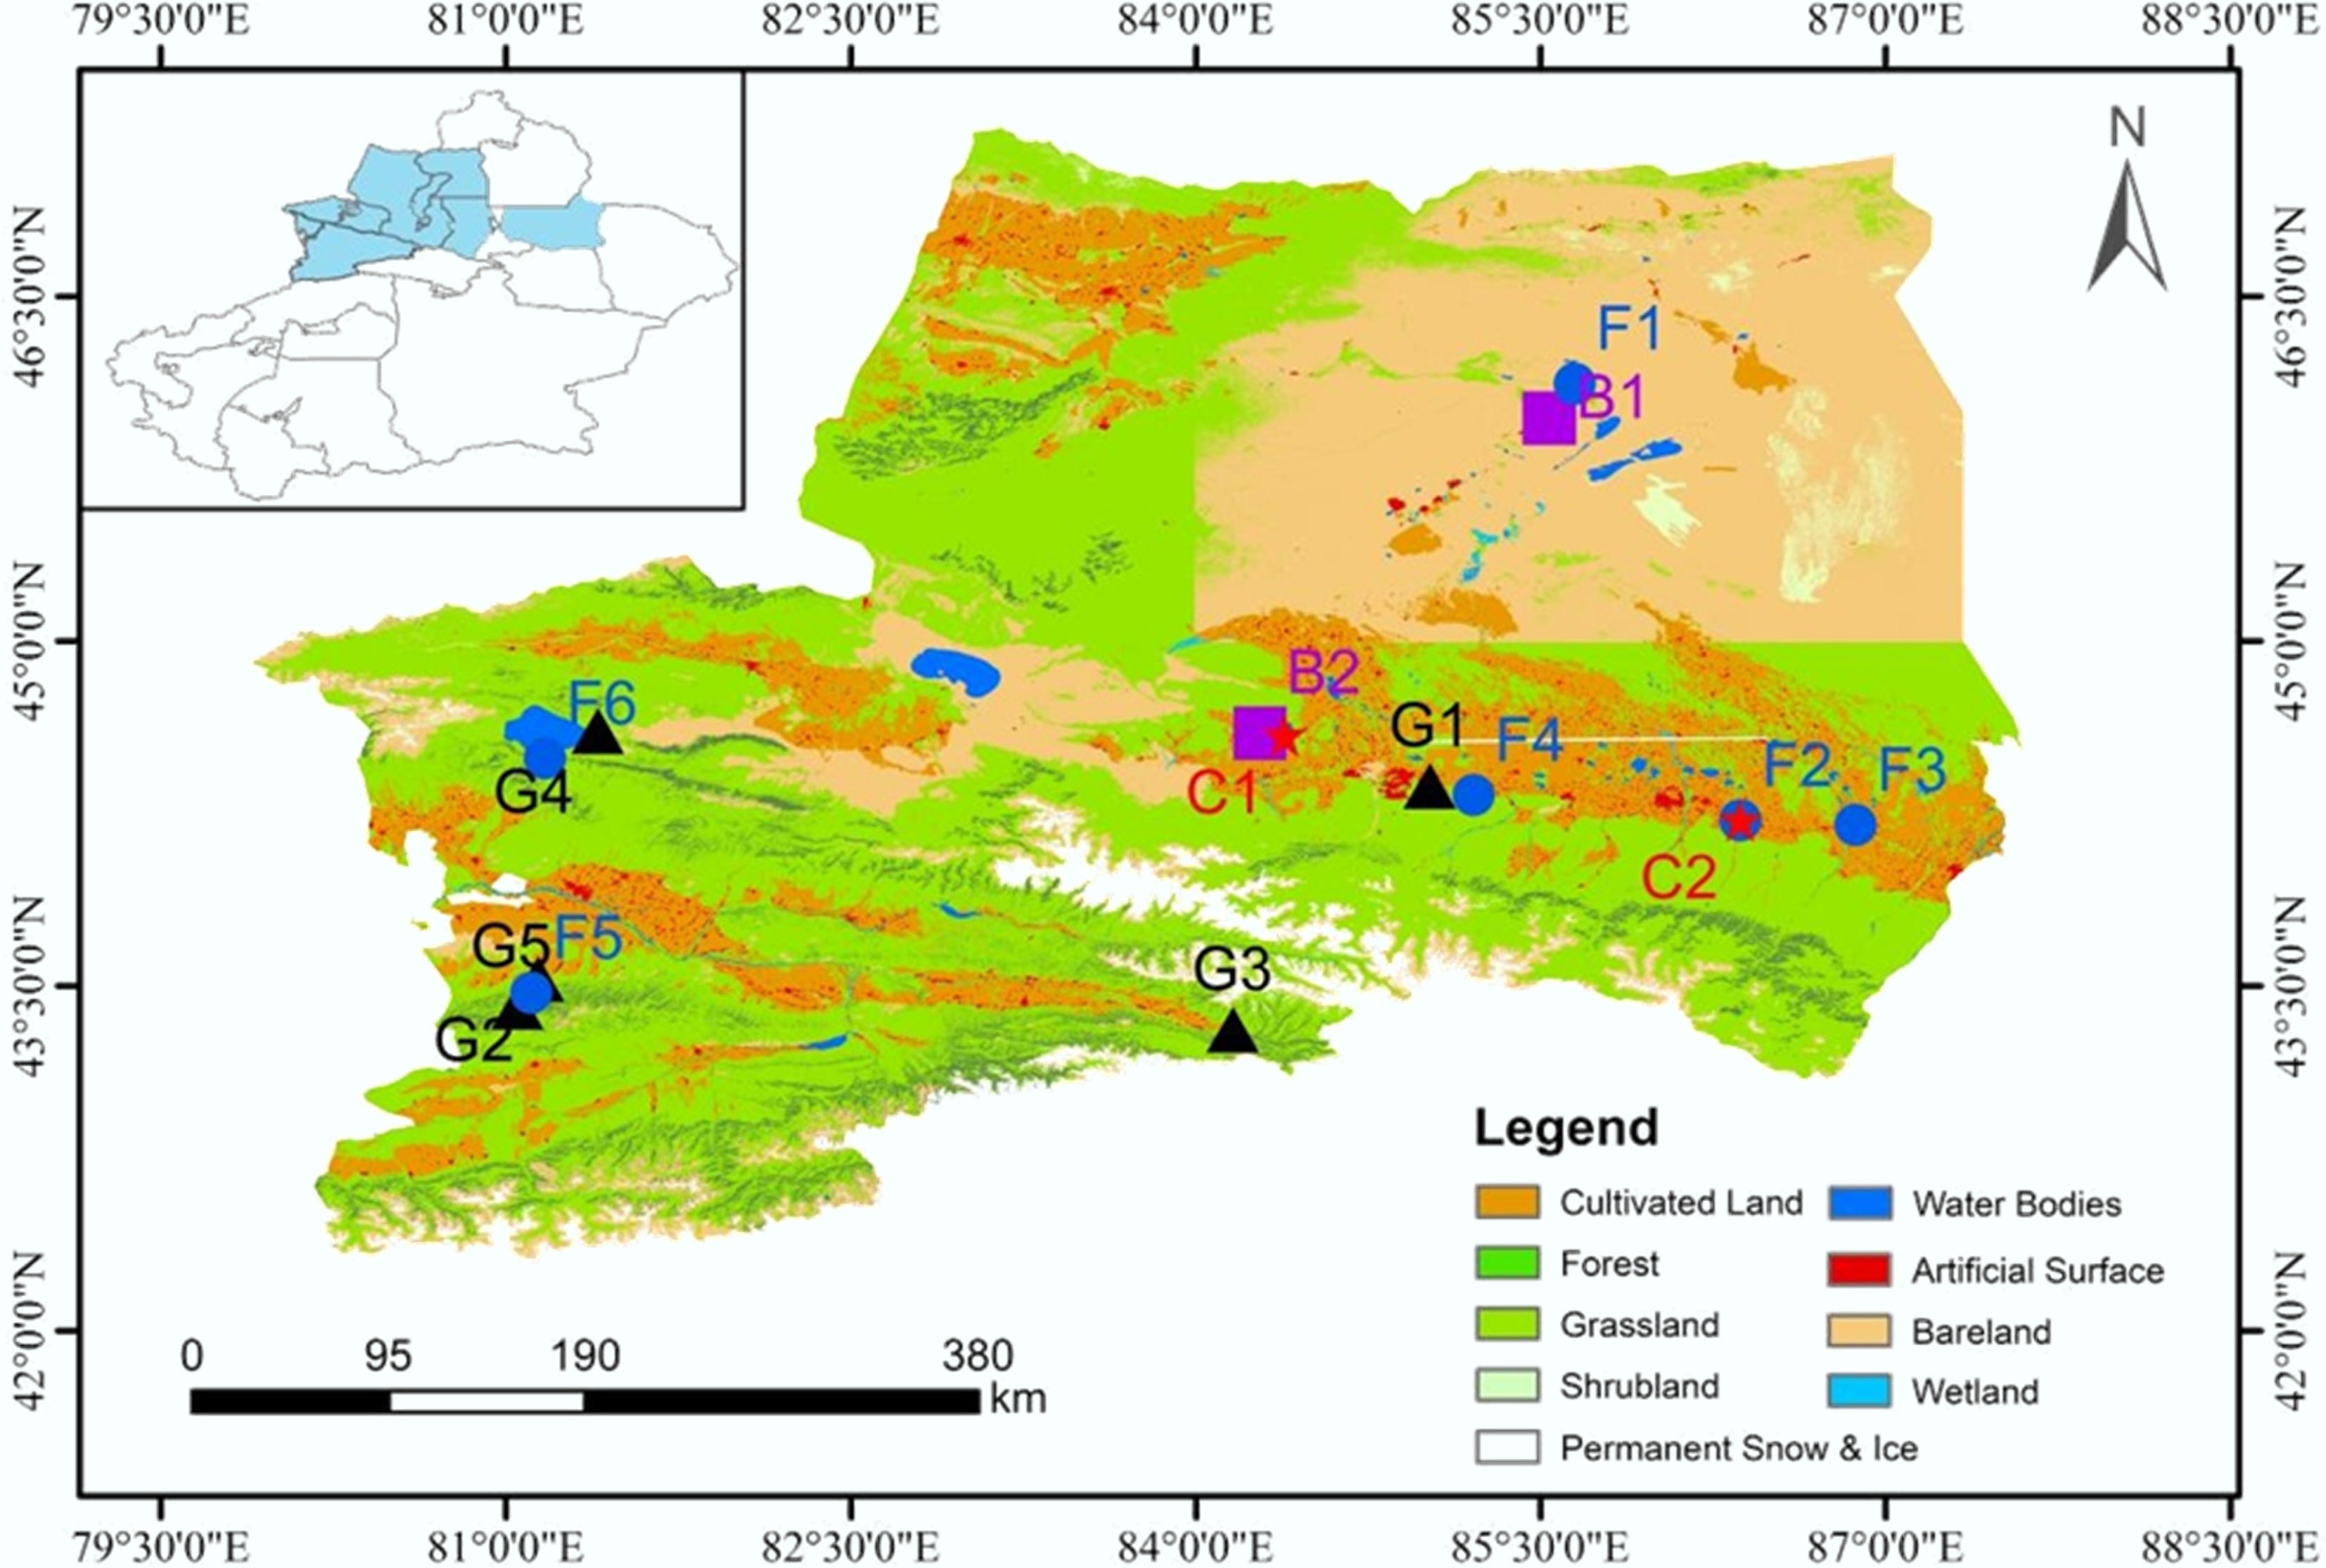
Figure 1.
Spatial distribution of sampling sites across different land-use types in Xinjiang, China. Land-cover data were derived from the GlobeLand30 dataset.
-
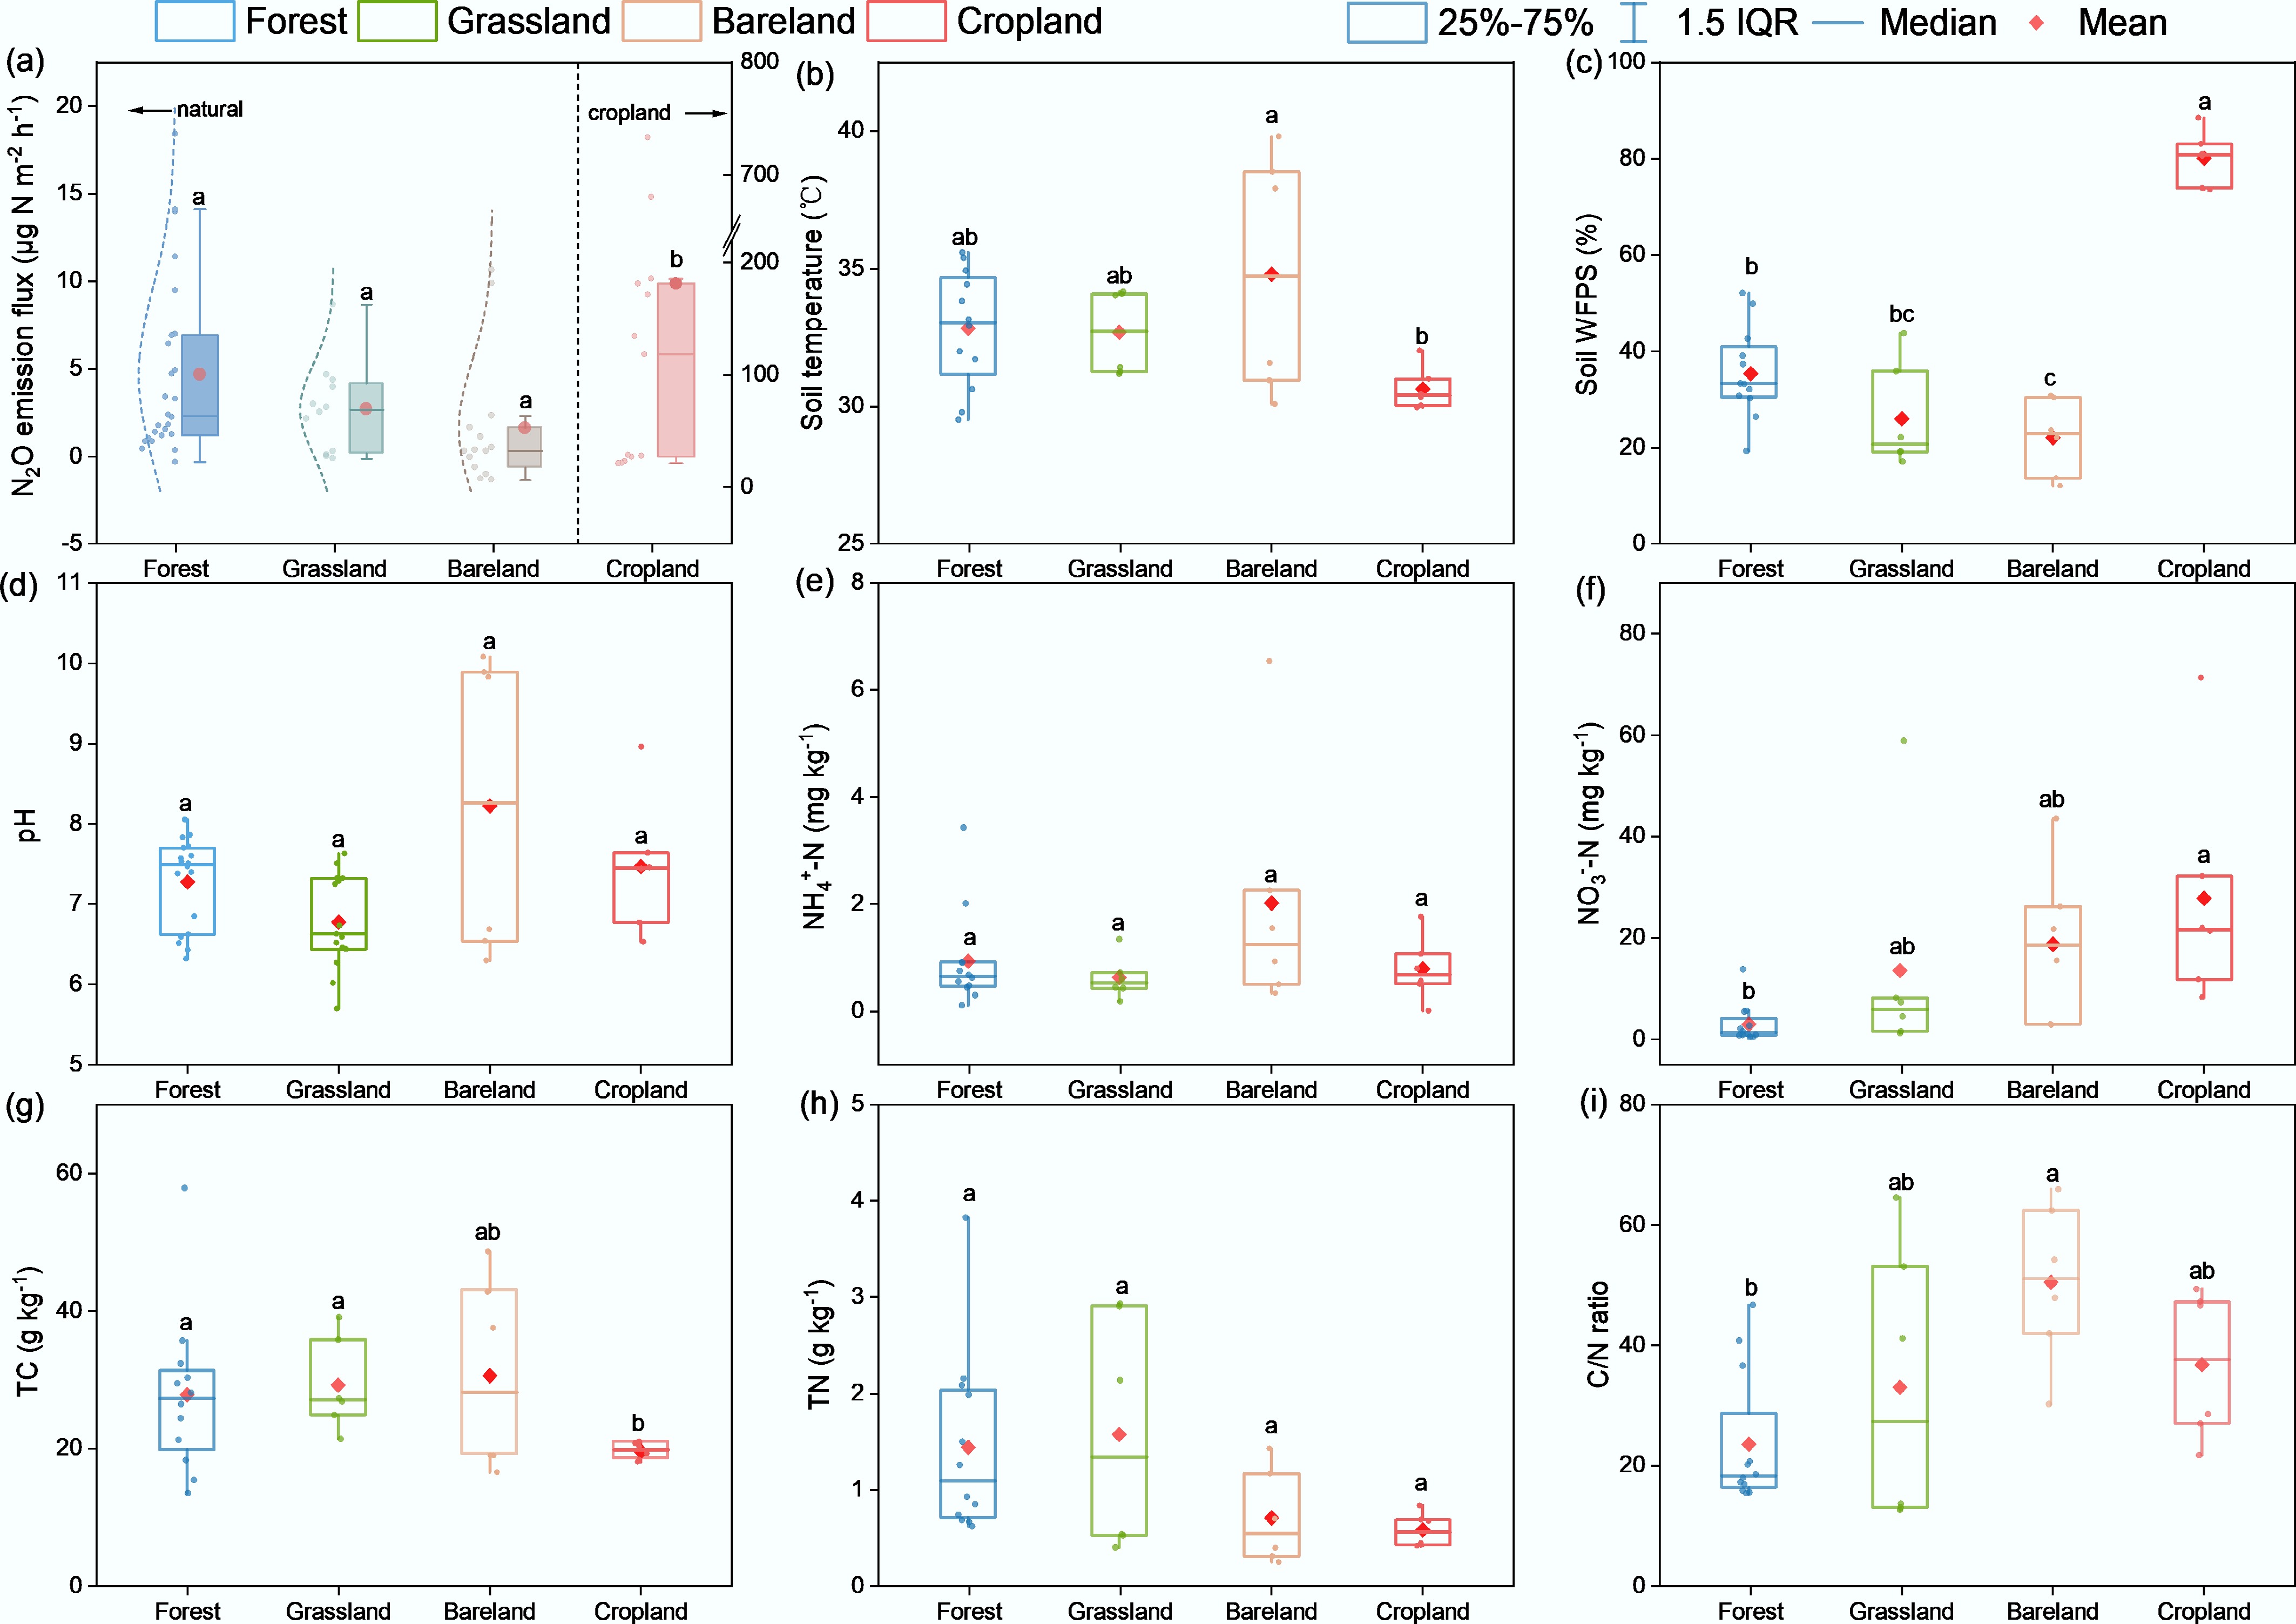
Figure 2.
Effects of different land-use types on soil physicochemical properties. Different lowercase letters indicate significant differences among land-use types (p < 0.05).
-
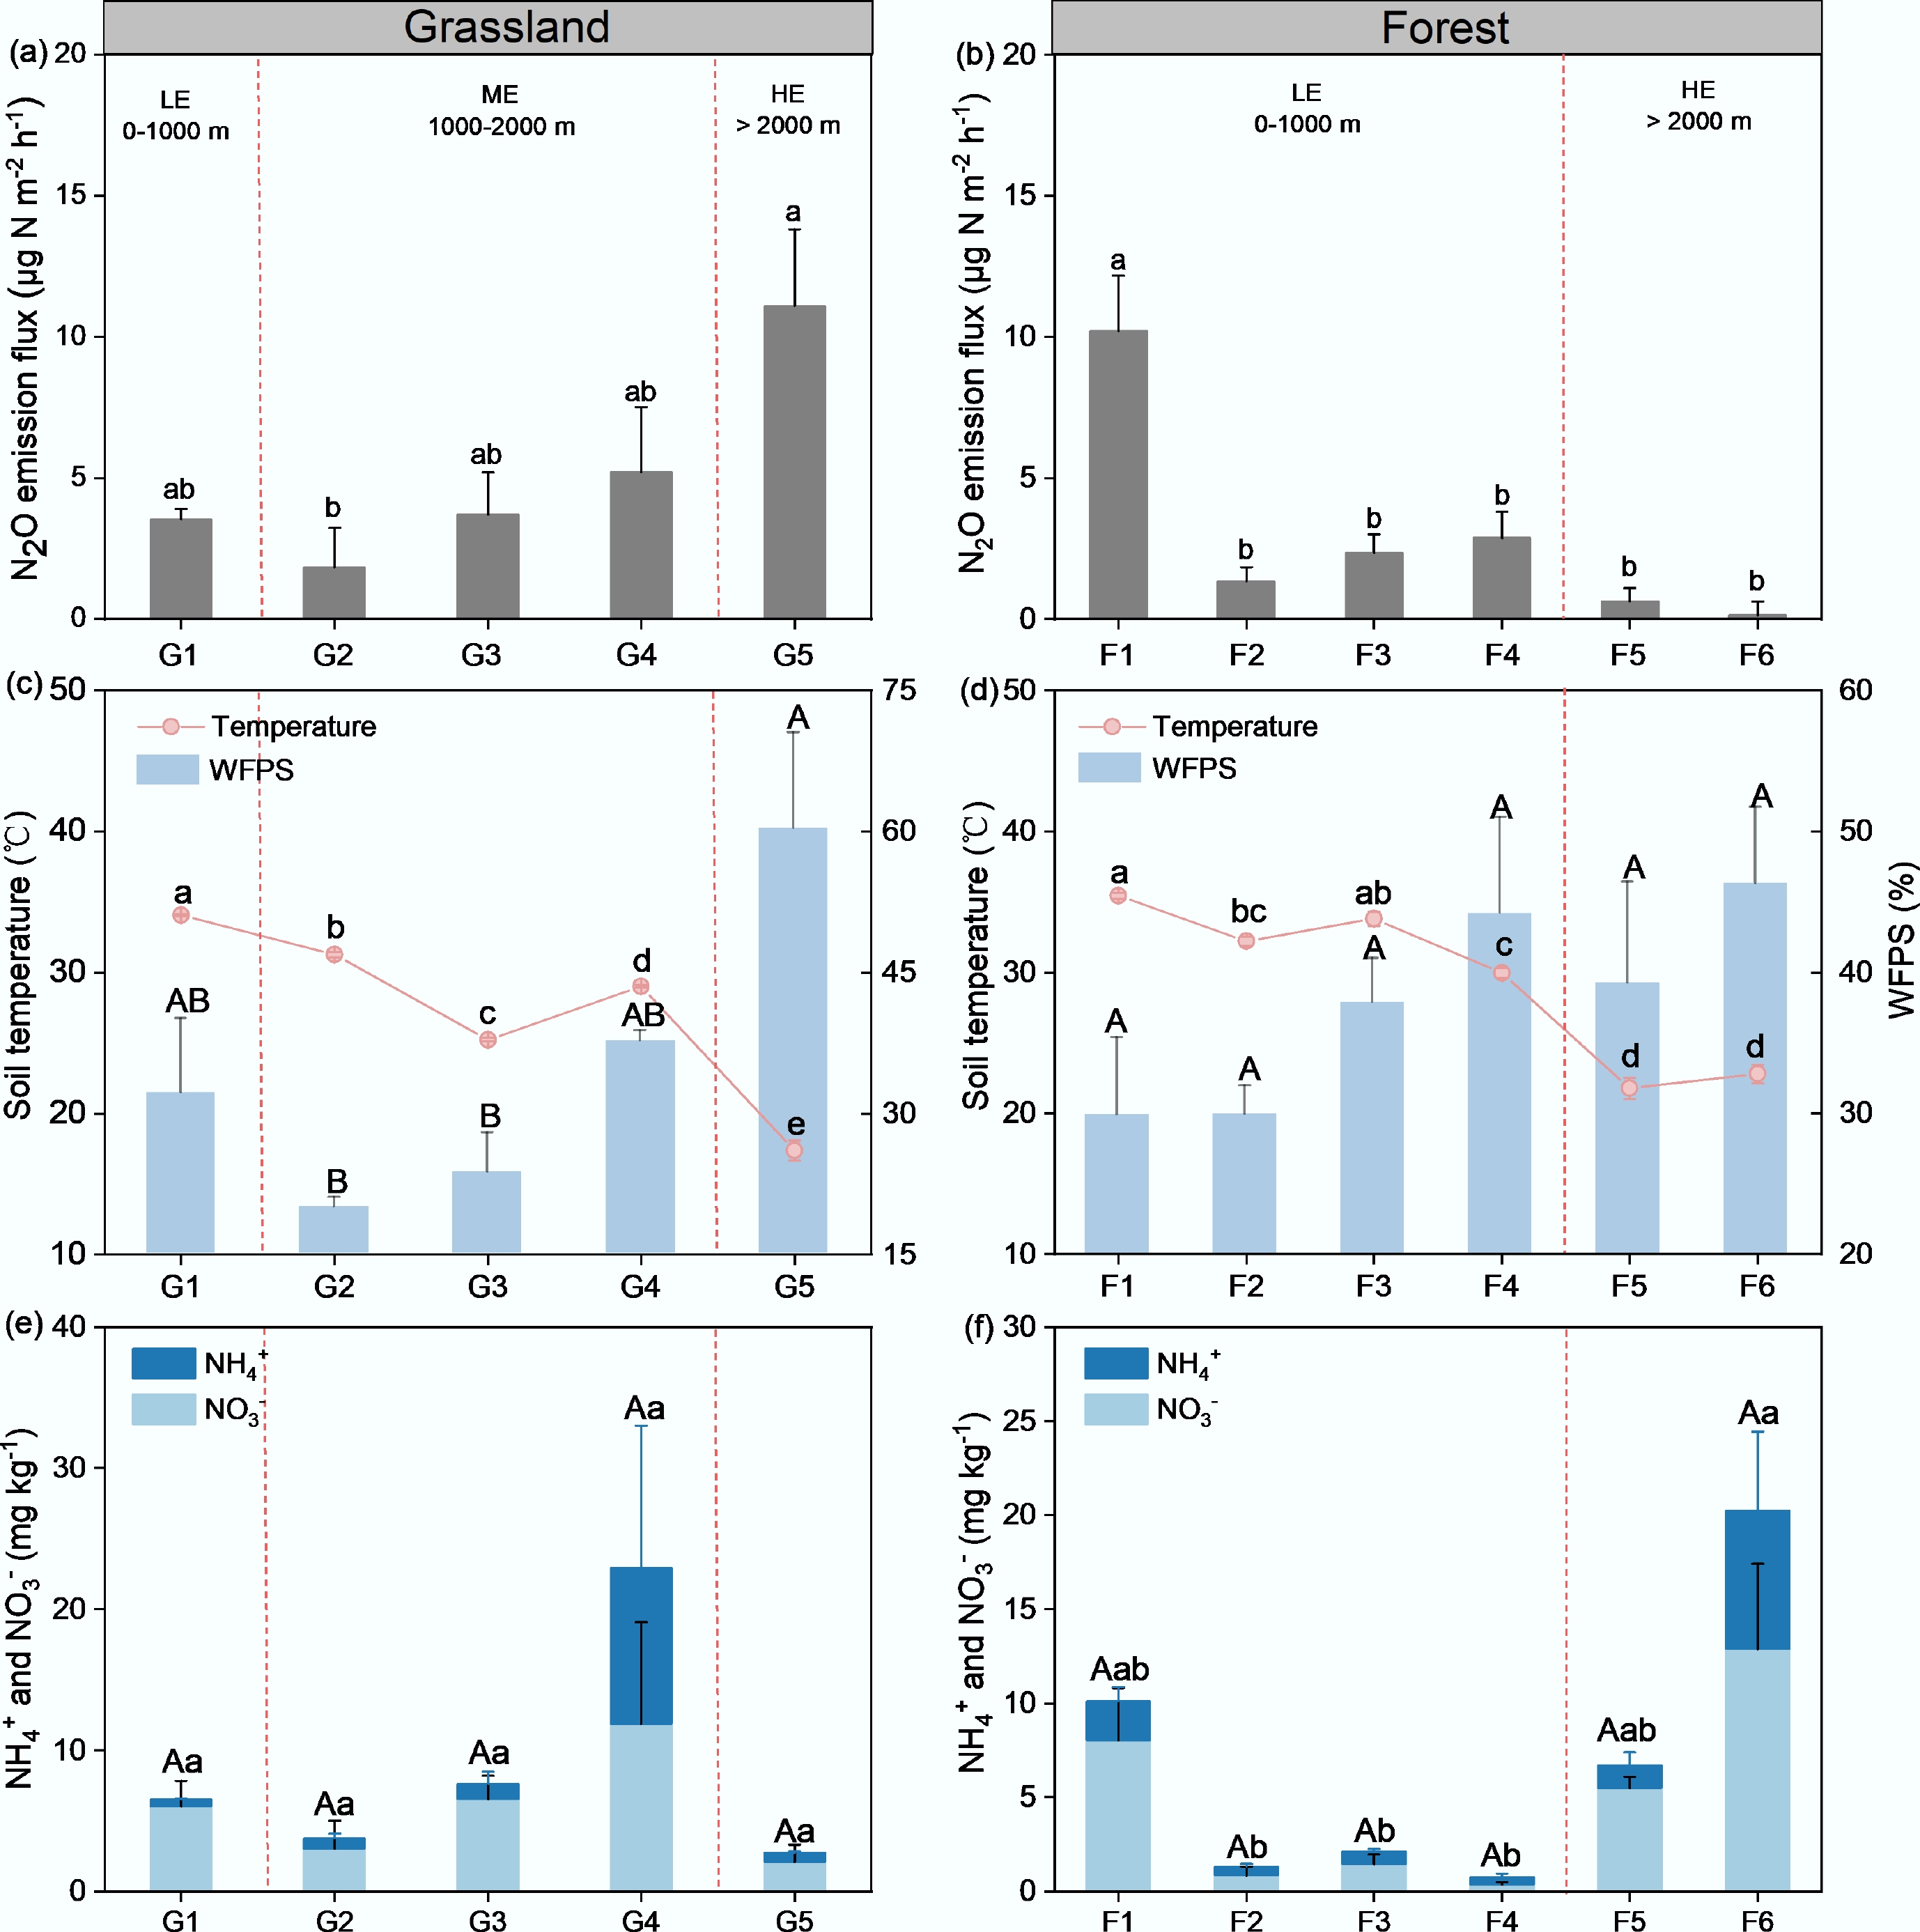
Figure 3.
In situ N2O emission fluxes in (a) grasslands, and (b) forest. Soil temperature and WFPS across (c) grasslands, and (d) forest sites; and soil inorganic nitrogen content (NH4+ and NO3−) across (e) grassland, and (f) forest sites. Different letters (a, b) above the bars indicate significant differences (p < 0.05) among sites within each vegetation type. Error bars represent standard errors of the mean. No forest site was at the ME.
-
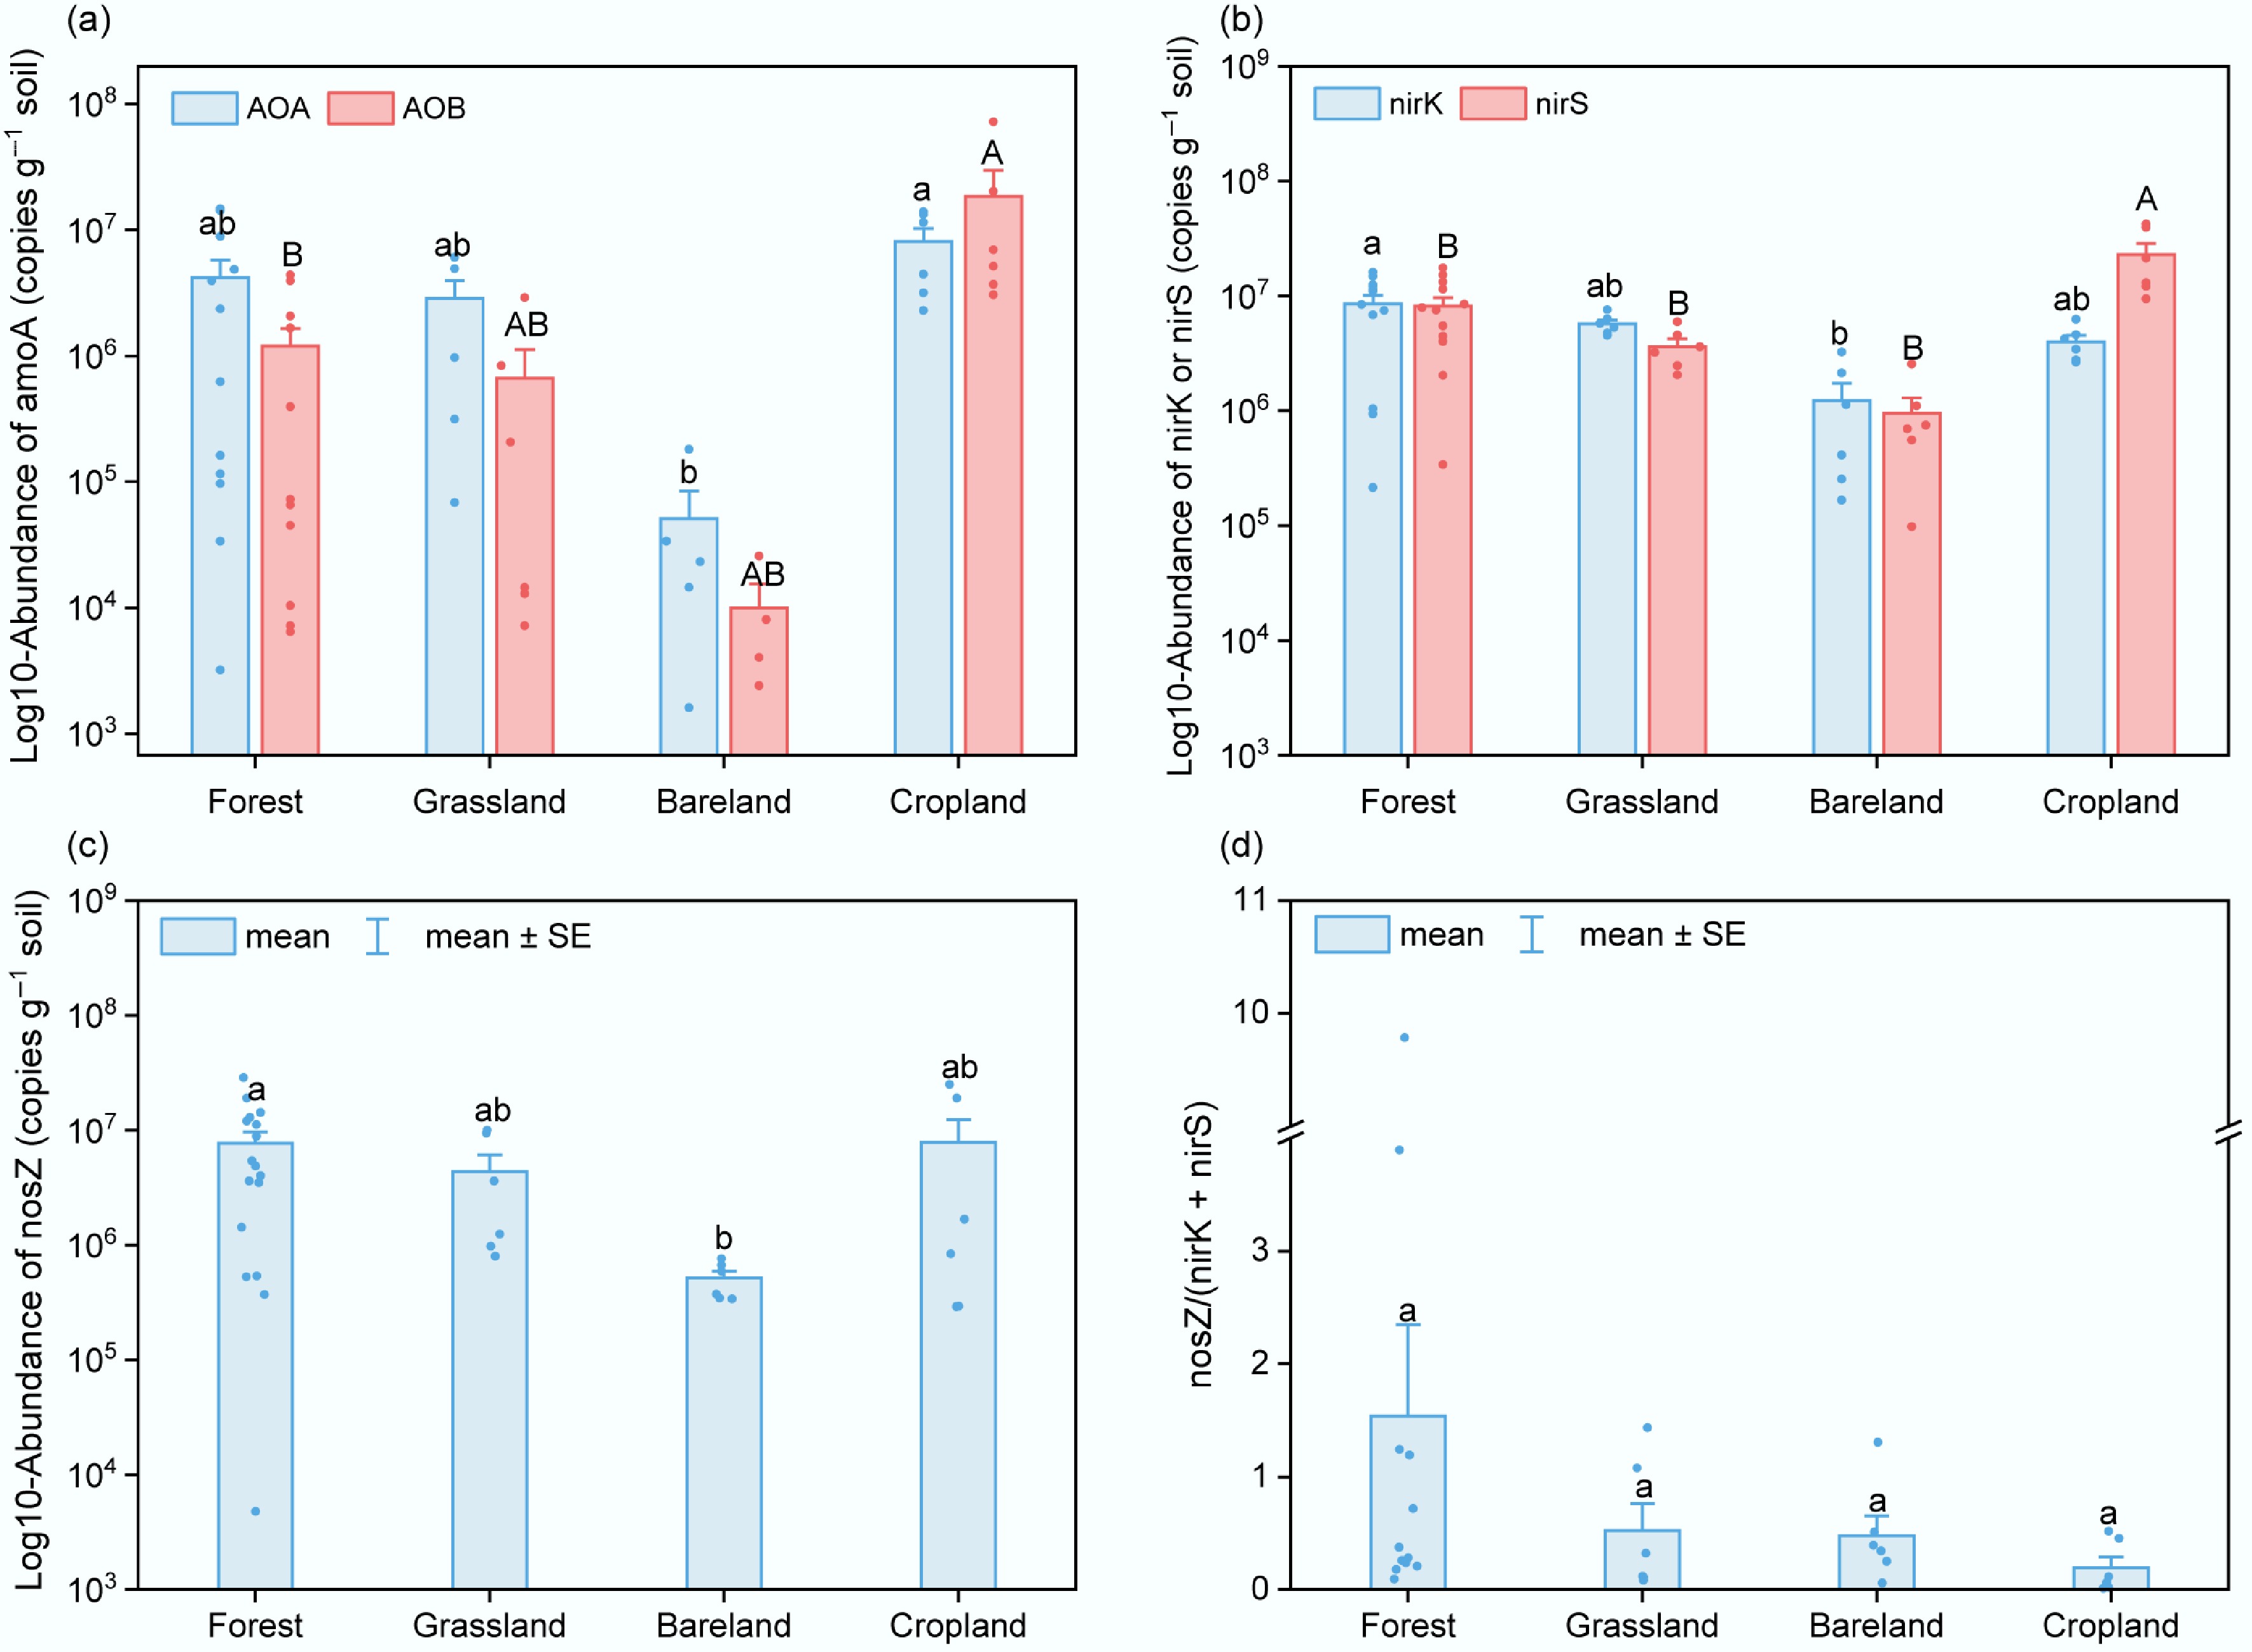
Figure 4.
Abundances of nitrogen-cycling functional genes in soils under different land-use types. (a) amoA genes of AOA and AOB. (b) nirK and nirS genes. (c) nosZ genes. (d) Ratio of nosZ to (nirK + nirS). Different letters indicate significant differences (p < 0.05).
-
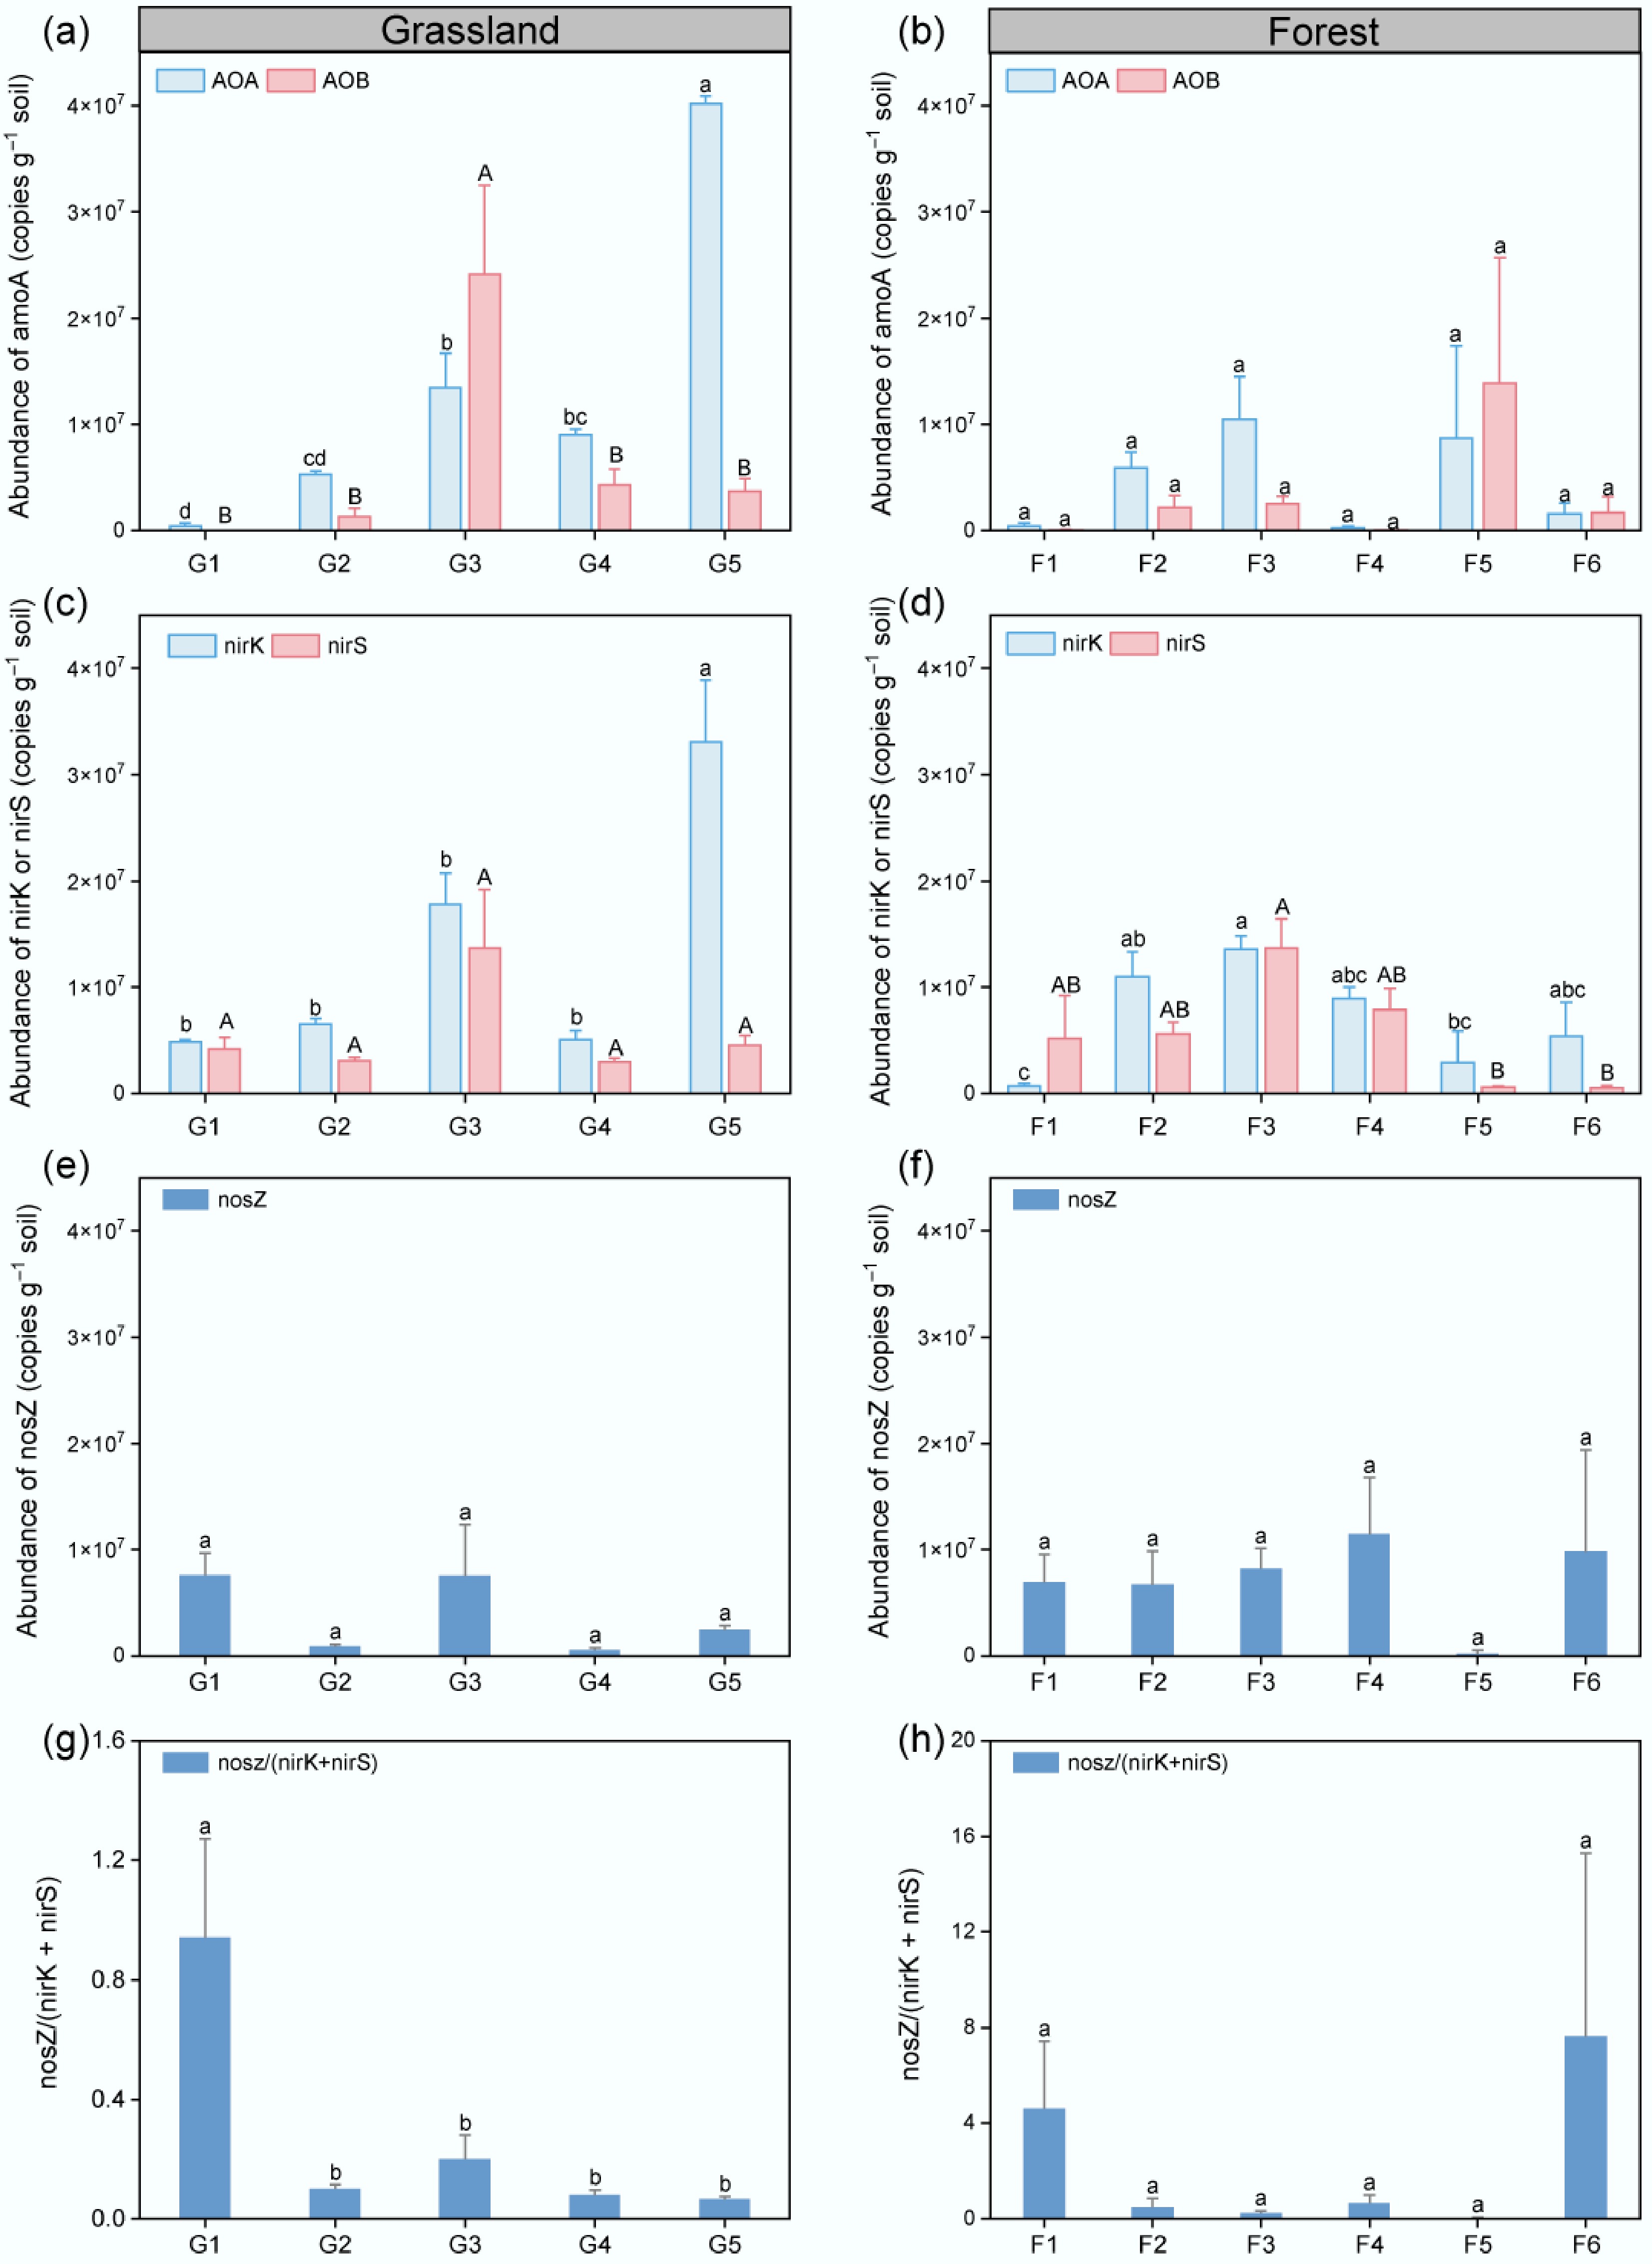
Figure 5.
Abundances of nitrogen-cycling functional genes in grassland and forest soils along elevation gradients. (a), (b) Abundances of amoA genes in AOA and AOB. (c), (d) Abundances of nirK and nirS genes. (e), (f) Abundances of nosZ gene. (g), (h) Ratios of nosZ to (nirK + nirS) in grassland and forest soils at low (LE < 1,000 m), medium (ME, 1,000−2,000 m), and high (HE > 2,000 m) elevations. Error bars indicate ± SE, and different letters denote significant differences among sites (p < 0.05).
-
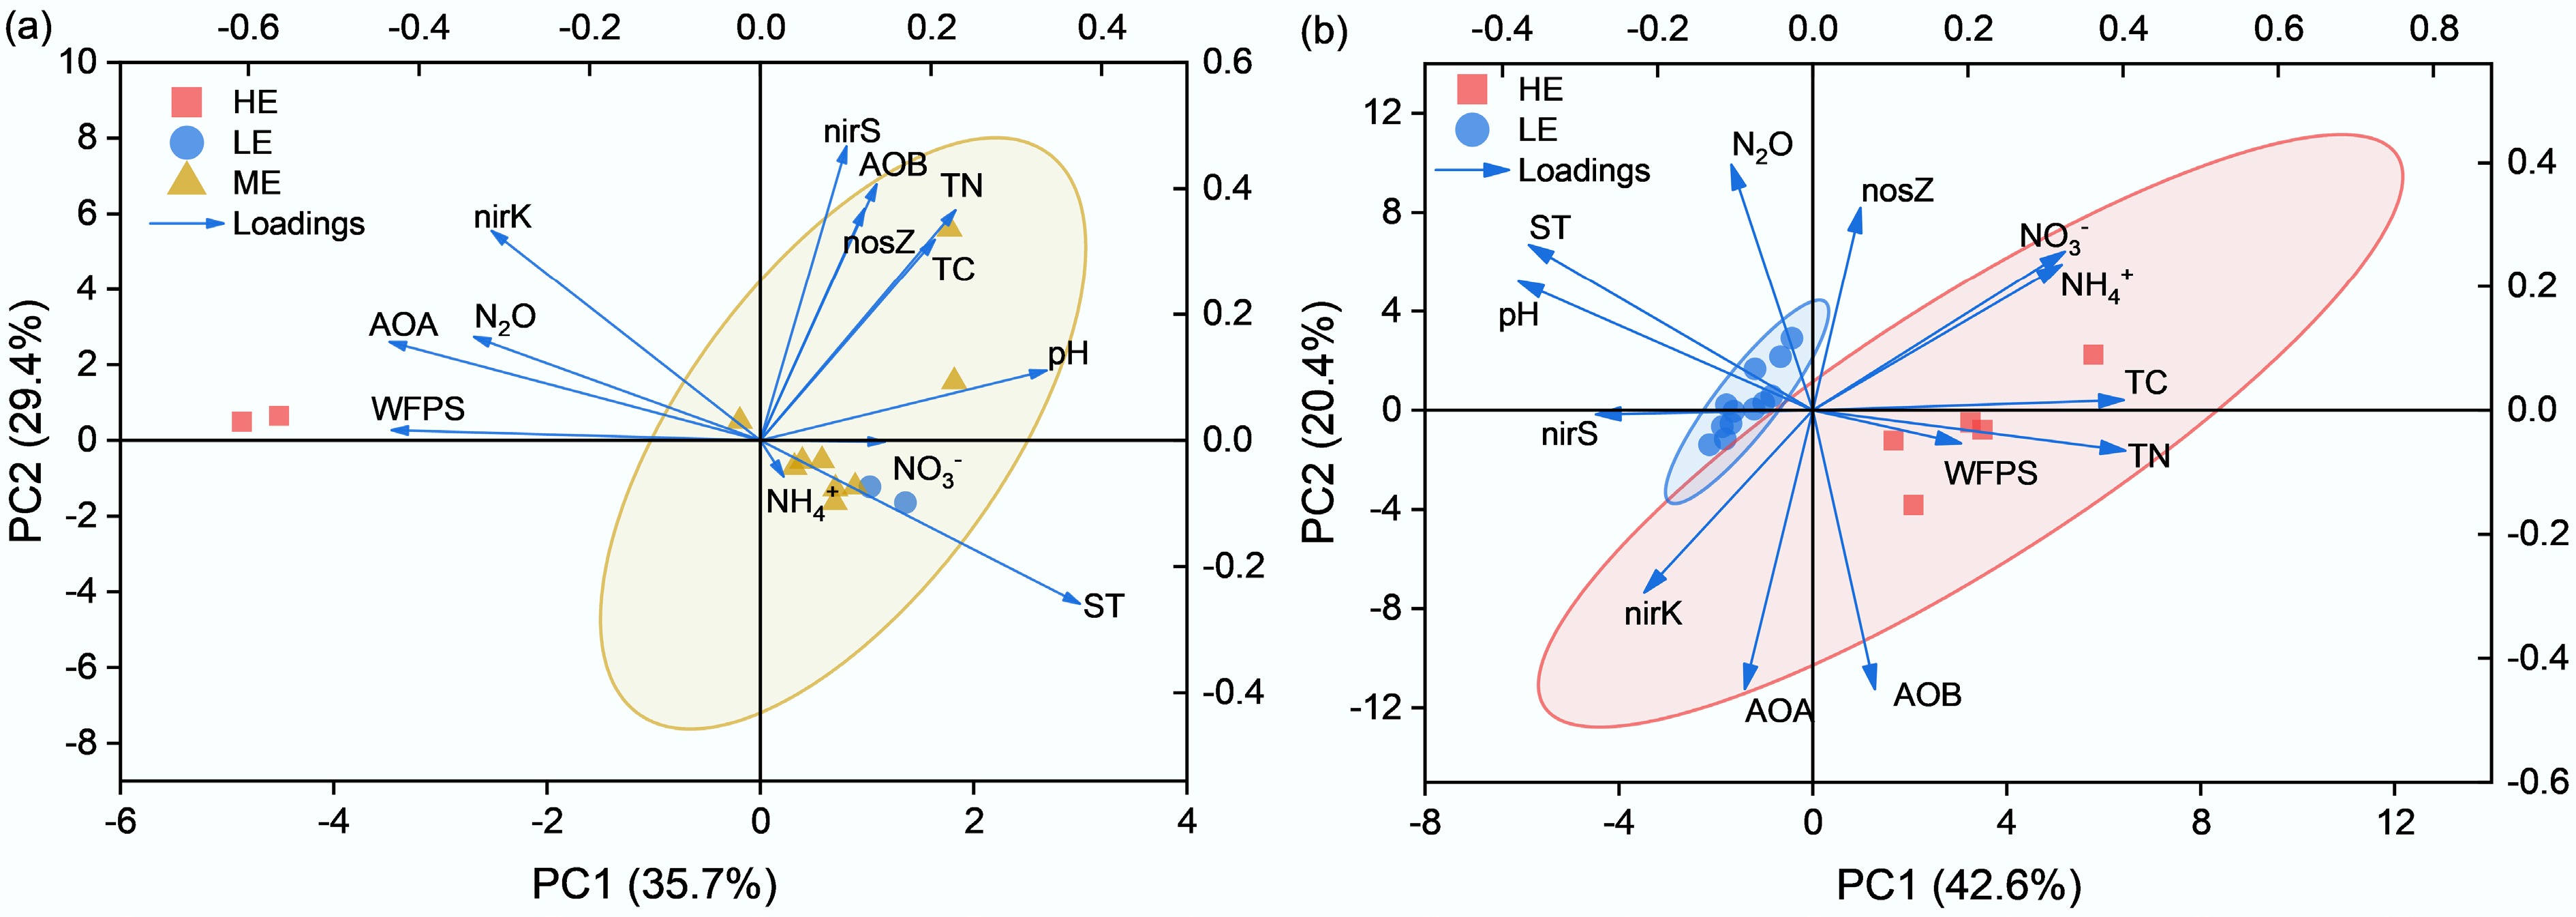
Figure 6.
PCA results showing correlations between soil N2O emissions, environmental factors, and nitrogen-cycling genes in (a) grassland, and (b) forest soils along the elevation gradient. Arrows represent variable loadings (ST, WFPS, TC, TN, pH, NH4+, NO3−, AOA, AOB, nirK, nirS, nosZ).
-
Variable Type LE ME HE pH Grassland 7.37 ± 0.07a 6.84 ± 0.15a 5.60 ± 0.16b Forest 7.64 ± 0.06a — 6.55 ± 0.07b TC (g kg−1) Grassland 24.06 ± 1.60a 42.88 ± 4.34a 24.31 ± 1.91a Forest 27.50 ± 3.37b — 90.45 ± 11.42a TN (g kg−1) Grassland 0.47 ± 0.04b 3.85 ± 0.53a 0.87 ± 0.08b Forest 1.42 ± 0.27b — 8.57 ± 1.00a C/N Grassland 52.63 ± 6.77a 11.57 ± 0.68c 28.20 ± 1.24b Forest 23.24 ± 3.2a — 10.61 ± 0.51b NH4+-N (mg kg−1) Grassland 0.47 ± 0.06a 4.31 ± 3.37a 0.68 ± 0.06a Forest 0.91 ± 0.26b — 4.29 ± 2.34a NO3−-N (mg kg−1) Grassland 6.05 ± 1.81a 7.15 ± 2.55a 2.07 ± 1.26a Forest 2.68 ± 1.12b — 9.19 ± 2.63a Values are means ± standard deviations (SE). Significant effects (p < 0.05) are shown in bold. Different lowercase letters (a, b, c) within the same row indicate significant differences among elevation treatments (LE, ME, HE) at p < 0.05, while the same letter indicates no significant difference. ME data are unavailable because forest stands are mainly absent in the mid-elevation zone of the Tianshan region, where vegetation transitions from low-elevation artificial forests to shrublands and grasslands. TN, total nitrogen; TC, total carbon. Table 1.
Soil chemical properties of the high-elevation (HE, control), medium-elevation (ME), and low-elevation (LE, climate change treatment) sites
-
Type Experimental site Experiment date N2O flux (μg N m−2 h−1) Ref. Latitude Longitude Altitude (m) Natural land Grassland 42°52.76' 83°41.90' 2,468 2013−2017 1.34 [36] Grassland 42°53' 83°42.5' 2,468 2017−2019 2.91 [21] Grassland 42°49.22' 84°22.52' 2,390 2014 0.99 [37] Grassland − − < 1,000 2023 3.54 This work − − 1,000−2,000 3.59 − − > 2,000 11.09 Forest 41°48.35' 86°04.37' 918 2019 7.90 [38] Forest − − < 1,000 2023 4.38 This work − − > 2,000 0.45 Bareland 44°30' 82°36' 387 2016 0.046 [39] Bareland − − < 1,000 2023 1.80 This work Cropland Cotton 37°01.10′ 80°43.80′ 1,367 2016 9.86 [40] Cotton 43°56' 87°28' 599 2012 110.02 [41] Corn 43°57.72' 87°30.08' 584 2013 87.84 [42] Cotton 44˚33' 85˚56' 369 2021−2022 21.83 [43] Cotton 44°18.48' 86°03.75' 476 2021 94.76 [44] Cotton − − < 1,000 2023 181.32 This work Table 2.
Summary of mean N2O fluxes from previous studies in Xinjiang, China
Figures
(6)
Tables
(2)