


-
Nitrous oxide (N2O) is a potent greenhouse gas with a global warming potential approximately 298 times that of carbon dioxide over a 100-year horizon and is also involved in the depletion of stratospheric ozone[1,2]. Globally, soils are the dominant source of atmospheric N2O, contributing more than 60% of total emissions, primarily through microbial-mediated nitrification and denitrification processes[3,4]. Understanding the environmental and biological drivers of N2O fluxes is therefore critical for constraining greenhouse gas budgets and predicting their responses to future climate change.
Arid and semi-arid ecosystems, which account for approximately 40% of the Earth's terrestrial surface, have historically been overlooked in global N2O assessments compared with temperate and humid ecosystems[5]. The weak contribution of N2O emissions from the arid zone could mainly be attributed to the suppression of microbial processes and the limited decomposition rate under high temperatures and low water availability[6,7]. However, due to the growth of the human population, anthropogenic activities have exerted stronger impacts on soil nutrient cycling[8], including in soils under natural vegetation[9]. For instance, Pan et al. synthesized global evidence showing that fertilizer use in croplands is the primary anthropogenic source of nitrogenous gases and a major contributor to atmospheric and aquatic nitrogen pollution[10]. Xu et al. revealed that nitrogen fertilization can enhance the release of native soil nitrogen, resulting in additional N2O emissions and greater environmental nitrogen loading[11].
Soil N2O emission is affected by multiple edaphic and climatic factors, including soil temperature, moisture, and nutrient availability, which jointly regulate microbial nitrification and denitrification[12]. In dry climates, soil water availability appears to be the most important driver of microbial activity and also a major factor governing the spatial heterogeneity of nitrogen (N) transformations[7,13]. In particular, soil moisture has been identified as a critical regulator of N2O production, with intermediate water-filled pore space providing optimal conditions for nitrification and denitrification[7]. For example, a global meta-analysis revealed that altered precipitation regimes drive strong shifts in denitrifier function and substantially influence terrestrial N2O emissions[14,15]. Further, pathway partitioning studies show that nitrifiers can account for 34.2% of total N2O on average in semi-arid grasslands, and > 75% immediately after wetting or fertilization pulses in dryland croplands, underscoring their prominent role in arid environments[16]. Soil N2O production is primarily mediated by microbial nitrification and denitrification processes, in which several key functional genes play essential roles: amoA encodes the ammonia monooxygenase that drives the first step of nitrification, nirK and nirS encode nitrite reductases that catalyze the reduction of NO2− to NO during denitrification, and nosZ encodes nitrous oxide reductase, the only enzyme capable of reducing N2O to N2[3]. These gene-controlled pathways jointly determine the balance between N2O production and consumption across soils with contrasting moisture and oxygen conditions. Moreover, under the highly aerobic and water-limited conditions typical of arid soils, ammonia-oxidizing archaea (AOA) and bacteria (AOB) can still actively produce N2O via nitrification and nitrifier denitrification. These microorganisms show remarkable tolerance to desiccation and elevated temperatures, allowing them to sustain activity even when denitrification is strongly suppressed by drought[17]. Recent research has shown that AOA and AOB exhibit distinct nitrogen source preferences: AOA favor ammonia, and many β-AOB (β-proteobacterial ammonia-oxidizing bacteria) prefer urea, which contributes to their ecological niche differentiation and variable roles in nitrification-driven N2O emissions[18]. Meanwhile, land-use conversion, such as steppe to cropland, has been shown to increase the spatial heterogeneity of soil functional genes and to reshape microbial nutrient cycling processes, emphasizing the importance of anthropogenic management in regulating N2O fluxes[19].
In addition to soil water balance, temperature exerts key regulatory effects on enzymatic activities and the composition and functioning of microbial communities in natural soils. It is demonstrated that denitrifier-related N2O emission potentials are strongly constrained by temperature across global forest soils[20], while studies in alpine and temperate grasslands have similarly reported temperature-sensitive N2O responses, with asymmetric warming markedly enhancing emissions during the nongrowing season[21]. As climate change intensifies across northern arid regions, it is increasingly crucial to elucidate how natural soil N2O emissions respond to these environmental changes. Elevation gradients provide a natural framework for investigating the effects of climatic variation, particularly shifts in temperature and precipitation, on soil biogeochemical processes. In humid and temperate regions, previous studies have shown that N2O emissions typically decline with elevation owing to reduced microbial activity under cooler conditions[22]. However, such elevational patterns may behave differently in arid landscapes where the combined influence of warming, soil moisture constraints, and altered rainfall regimes can modify nitrification-denitrification dynamics[12].
Beyond climatic controls, vegetation and land-use types may further modulate the elevational effects by altering soil organic matter inputs, plant-microbe interactions, and nutrient transformation pathways. Forests, grasslands, croplands, and barren lands differ substantially in soil carbon availability, nitrogen cycling strategies, and microbial community composition, all of which can interact with elevation-induced microclimatic changes[19]. Such ecosystem-specific differences have been widely reported. It is demonstrated that converting natural steppe to cropland significantly reshapes soil microbial functional gene profiles, particularly nitrifier and denitrifier gene abundances, thereby modifying nitrogen transformation pathways and increasing the spatial heterogeneity of microbial nutrient cycling processes[19]. A global meta-analysis has demonstrated that cropland systems, compared with natural vegetation, exhibit fundamentally different carbon and nitrogen turnover dynamics. These differences include increased inorganic nitrogen availability, altered microbial community composition, and significantly higher N2O emission potentials[8]. These findings highlight that vegetation and land-use differences can strongly mediate how soils respond to climatic gradients. Along mountain gradients, increasing elevation generally results in cooler and wetter conditions that slow organic matter decomposition and nitrogen mineralization, thereby promoting the accumulation of soil organic carbon and total nitrogen[23]. Despite these potential interactions, empirical evidence remains limited regarding how elevation and land use jointly shape N2O emissions in arid ecosystems.
In this study, field measurements of N2O fluxes, soil physicochemical properties, and nitrogen-cycling functional genes were conducted across forest, grassland, cropland, and barren land along a pronounced elevation gradient in the arid region of Xinjiang, China. This study aims to examine how N2O fluxes vary with elevation and land-use type, to identify the key environmental and microbial drivers at different elevations, and to evaluate whether the relative importance of abiotic and biotic controls shifts along the gradient. It was anticipated that lower elevations, characterized by warmer and drier conditions, would result in higher N2O fluxes in forest soils but lower fluxes in grasslands due to water limitation. The hypothesis further posited that changes in the abundance and functional potential of nitrogen-cycling microbial communities would mediate the effects of elevation on N2O emissions, and that land-use type would influence both the magnitude of emissions and the relative contributions of environmental and microbial regulation. Addressing these questions aims to provide new insights into the complex interactions governing N2O emissions in arid ecosystems undergoing climatic change.
-
This study was conducted in the arid zone around the Tianshan Mountains, Xinjiang, China (43.408°−45.965° N, 81.050°−86.997° E), located in northwestern China at elevations ranging from 310 to 3,180 m above sea level. The region is characterized by abundant land resources and diverse geomorphological features, including vast piedmont alluvial plains and undulating low mountain hills, supporting a variety of vegetation types. The climate is classified as a temperate continental arid climate, with long, cold winters and short, relatively cool summers. During 2006–2020, the region experienced a mean annual temperature of 7 °C, with July being the warmest month (mean = 11.2 °C)[24]. Mean annual precipitation is only 150–500 mm, far below that of humid regions in China, and shows a spatial gradient, highest in the central part of the study area, intermediate in the west, and lowest in the east. Precipitation is also seasonally skewed, with most falling in spring and summer.
To investigate the influence of vegetation type and elevation on soil N2O emissions, a field campaign was conducted in July 2023 to evaluate growing-season emission rates. The sampling sites included grassland (G1−G5), forest (F1−F6), barren land (B1 and B2), and cropland (C1 and C2) (Supplementary Table S1). Sampling sites were distributed along the Yizhao Highway and Duku Highway to capture an elevation gradient; as a result of regional topographic features, most medium- and high-elevation sites (G2−G5, F5, and F6) were distributed along the southern flank of the Tianshan Mountains (Fig. 1). The studied high-elevation grasslands were mainly characterized as alpine meadow (G5) and alpine steppe (G1−G4), while the high-elevation forest sites were spruce forests. The low-elevation sites were distributed along the economic belt at the northern flank of the Tianshan Mountains near Urumqi, including planted forests (Populus euphratica), forage grasslands (Krascheninnikovia ceratoides and Stipa purpurea), and cotton fields. For comparison, sampling sites were classified into three elevation categories: low-elevation (LE, < 1,000 m), medium-elevation (ME, 1,000−2,000 m), and high-elevation (HE, 2,000−3,000 m). In situ N2O flux measurements were conducted at 15 sites representing different vegetation types, and corresponding soil samples were collected for physicochemical and microbial analyses. Forest stands were absent from the mid-elevation zone due to the natural vegetation distribution in the Tianshan region, leading to the absence of ME forest plots.
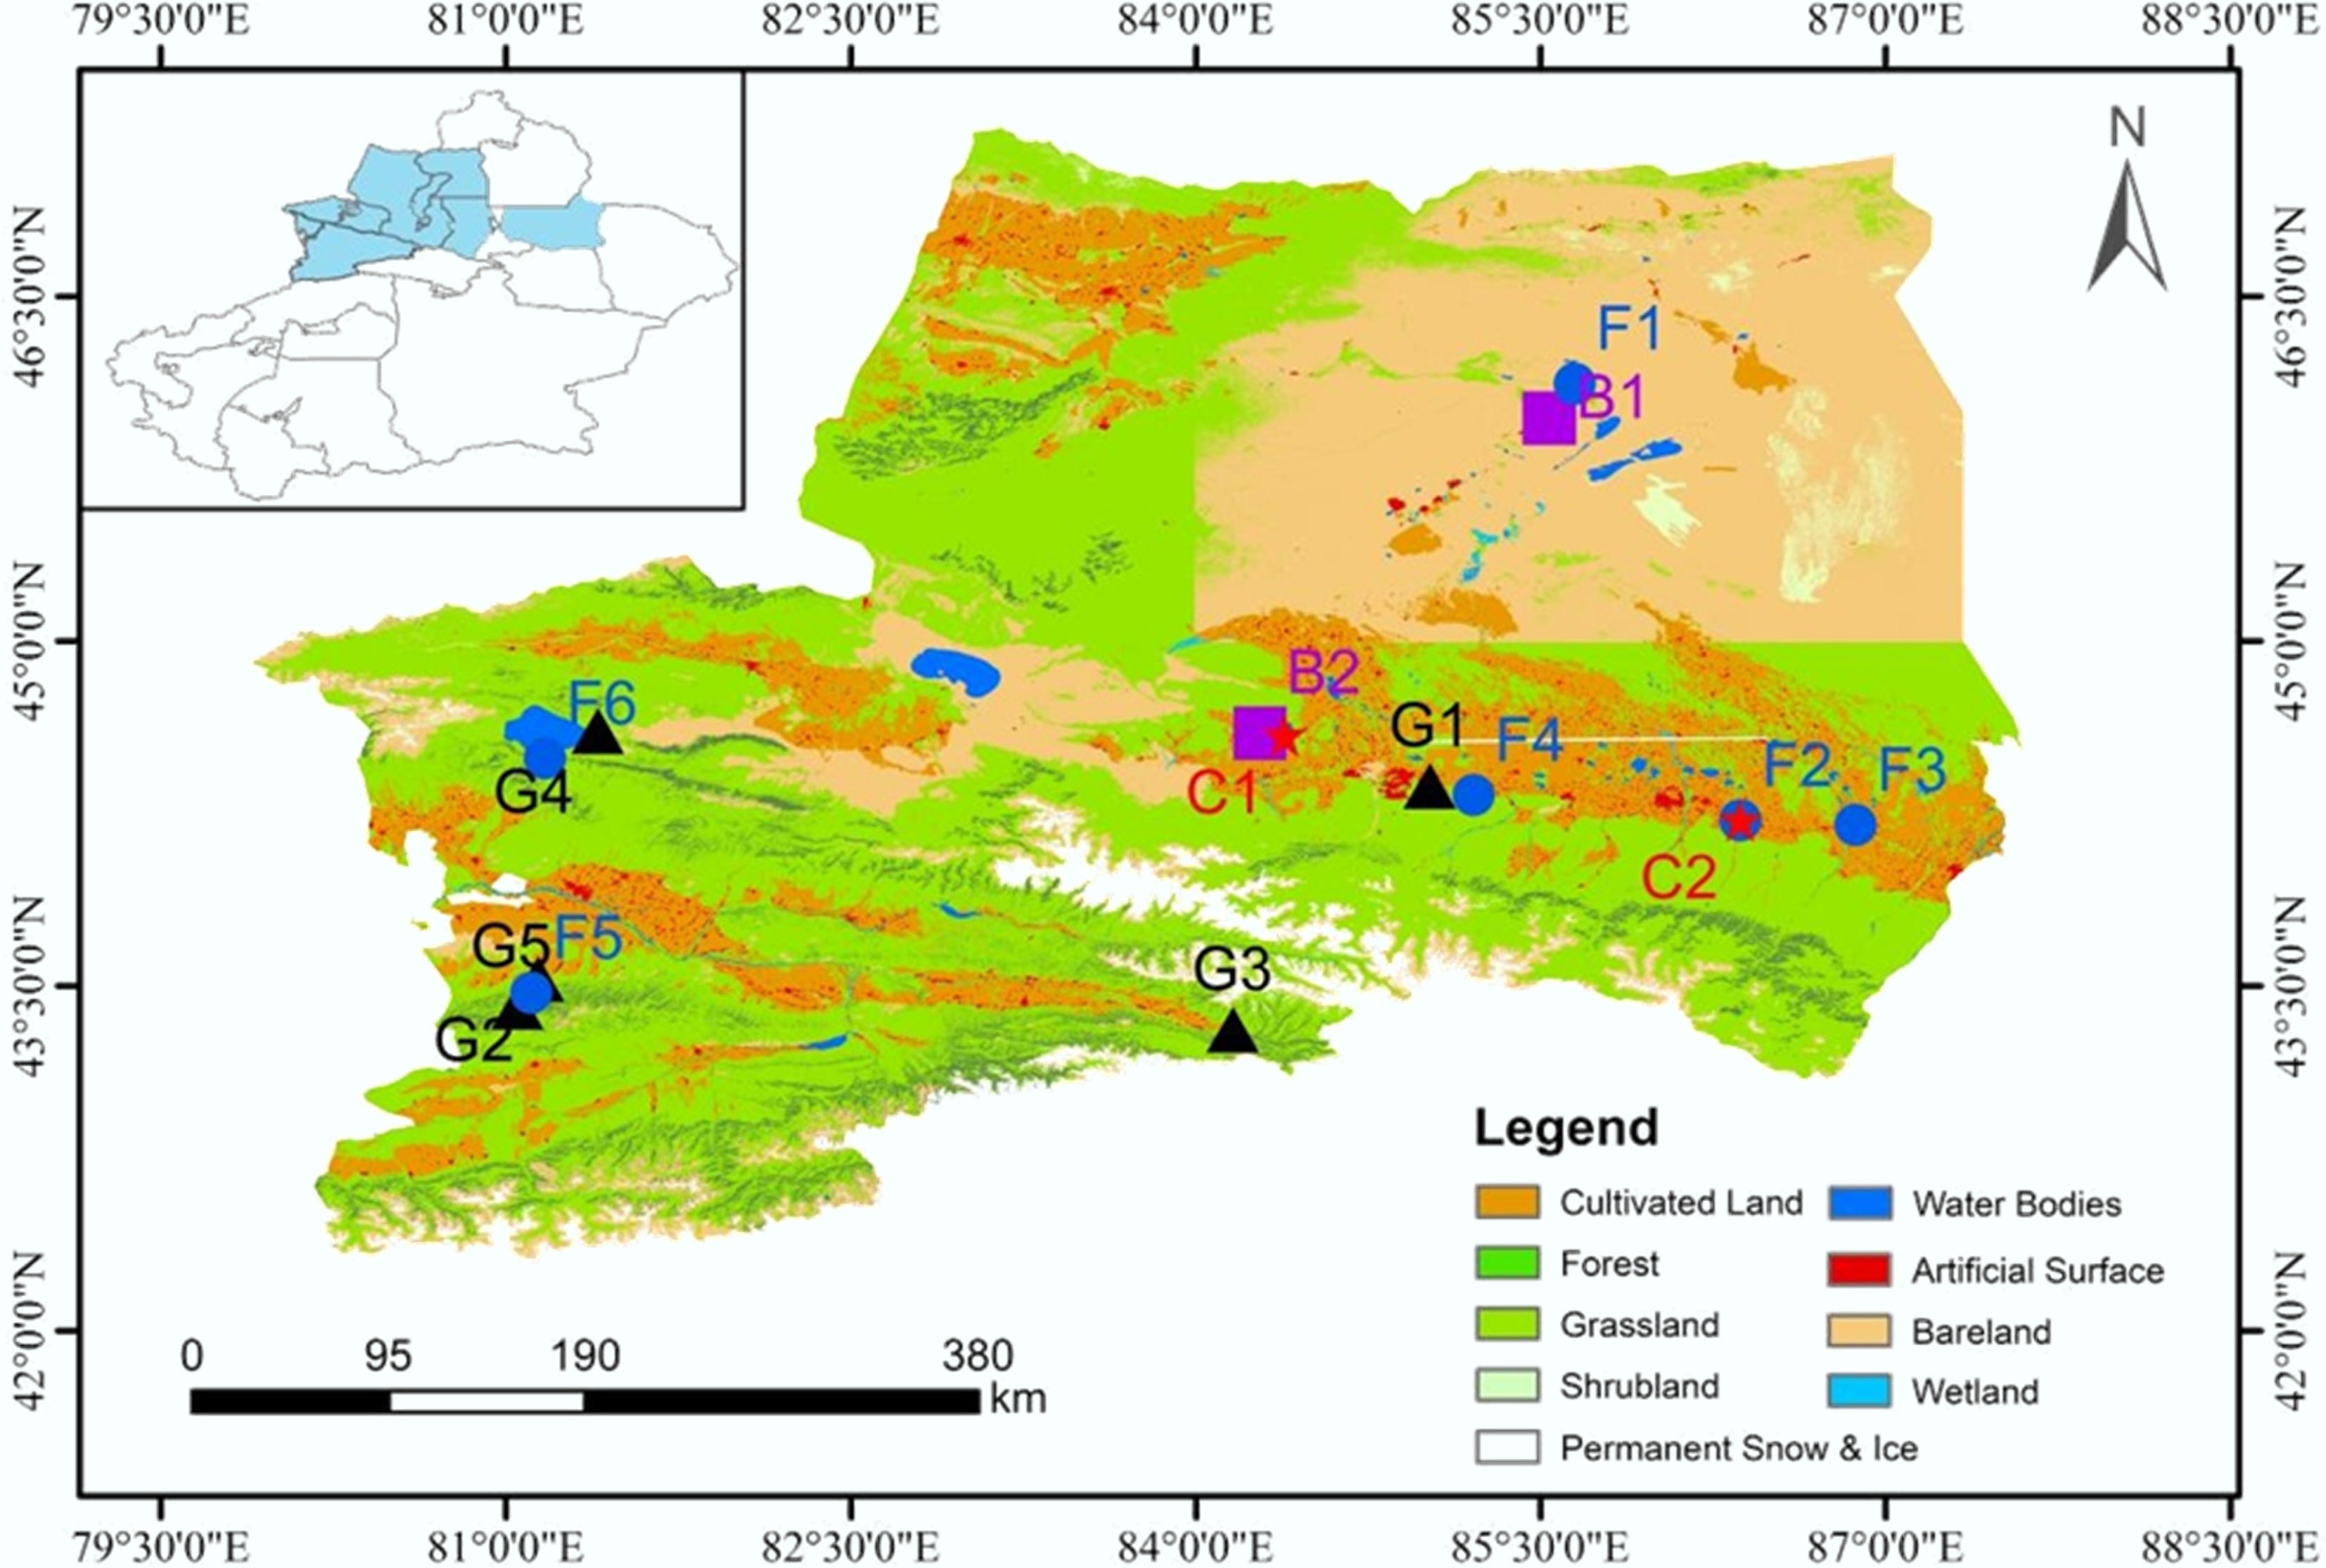
Figure 1.
Spatial distribution of sampling sites across different land-use types in Xinjiang, China. Land-cover data were derived from the GlobeLand30 dataset.
Field measurements and sampling
-
At each site, three parallel sampling points were established, and at each point, a pre-buried soil ring (inner diameter: 20 cm) was installed to ensure an airtight fit with the smart chamber (LI-COR Biosciences, Lincoln, NE, USA) during measurements. To ensure robust flux estimation and account for fine-scale spatial variability, gas flux measurements at each sampling point were conducted with three to six replicate chamber runs. The chamber was connected to a portable N2O gas analyzer (LI-7820, LI-COR Biosciences, Lincoln, NE, USA) for parameter configuration and in situ flux determination. The analyzer employs Optical Feedback–Cavity Enhanced Absorption Spectroscopy (OF-CEAS) with a measurement rate of 1 Hz, a response time of ≤ 2 s, and a precision of 0.40 ppb at 330 ppb with 1 s averaging. The deadband for mixing was set to 30 s, followed by a 180 s measurement period, and each measurement was replicated three times. Fluxes were calculated using the SoilFluxPro software. All flux measurements were conducted between 11:00 and 16:00 under stable, rain-free conditions. The measurement campaign was conducted within one week, ensuring comparability among different sites.
During flux measurements, soil temperature (ST, °C) and volumetric water content (VWC, %, v/v) at 10 cm depth were continuously recorded adjacent to the chamber using a temperature-moisture logger (TOMST, Czech Republic). In addition, all soil samples were collected from the surface layer (3–10 cm depth) after carefully removing surface litter and debris. Samples were sieved through a 2 mm mesh, with one subsample stored at 4 °C for subsequent soil physicochemical analyses and another stored at −20 °C for later quantification of nitrogen-cycling functional gene abundances.
Soil parameters
-
Fresh soil equivalent to 8 g dry weight was added to 40 mL of 1 M KCl solution, and the mixture was shaken at room temperature for 2 h. The resulting suspension was centrifuged and filtered, and the concentrations of NH4+ and NO3− in the KCl extracts were determined using a UV-visible spectrophotometer (UV-6100, China). The pH of the same KCl extract (soil-to-solution ratio 1:5, 1 M KCl) was measured using a potentiometric method (PHS-3E, China) after calibration with standard buffer solutions at pH 4.00, 6.86, and 9.18.
Water-filled pore space (WFPS, %) was calculated from the measured volumetric soil moisture (VWC, cm3 cm−3), together with a bulk density (BD) of 1.30 g cm−3 reported in a recent study from Xinjiang[25], and a particle density (PD) of 2.65 g cm−3, using the formula:
$ WFPS=\dfrac{VWC}{1-(BD/PD)}\times 100{\text{%}} $ (1) Soil DNA was extracted from an appropriate amount of homogenized soil sample, and the abundances of the functional genes AOA, AOB, nirS, nirK, and nosZ were quantified by quantitative real-time PCR (qPCR) using the ChamQ SYBR Color qPCR MasterMix (2×) (Vazyme, China) on a QuantStudio™ 5 Real-Time PCR System (Applied Biosystems, USA). The qPCR amplification program consisted of an initial pre-denaturation step, followed by denaturation, annealing, and extension, for a total of 40 cycles. Detailed information on the target functional genes, primer sequences, and amplification conditions is provided in Supplementary Table S2.
Statistical analyses
-
All experimental data were plotted using Origin 2021 (OriginLab Corporation, USA). Before analyzing the effects of land use on soil physicochemical properties, the Shapiro-Wilk test was used to assess data normality. When these assumptions were met, a one-way ANOVA was used to test significant differences among groups; otherwise, the non-parametric Kruskal-Wallis test was applied. The relationship between N2O fluxes and their potential driving factors (e.g., soil temperature, WFPS, and inorganic nitrogen) was examined using regression fitting with the 'Simple Fit' plug-in in Origin. Principal component analysis (PCA) was performed using the 'Principal Component Analysis' plug-in in Origin 2021 to identify the significant environmental and soil variables associated with variations in N2O fluxes along elevation gradients. In addition, a random forest regression model was implemented in R (version 4.3.0) using the 'randomForest' package to evaluate the relative importance of abiotic and biotic predictors. The model was trained with 1,000 trees, and variable importance was assessed using the percentage increase in mean squared error (%IncMSE). Functional gene abundances (amoA, AOB, nirK, nirS, and nosZ) were log-transformed prior to analysis.
-
A distinct difference in soil N2O fluxes was observed among soils under different vegetation types (Fig. 2a). Overall, soils under natural vegetation exhibited low N2O fluxes (−1.64 to 18.41 µg N m−2 h−1), whereas cropland soils showed higher fluxes by two orders of magnitude (mean = 181.32 µg N m−2 h−1). Accordingly, cropland soils showed the greatest water availability and the lowest temperatures (Fig. 2b, c) under management practices. Together with the relatively high inorganic N supply (not significant; Fig. 2e, f), cropland soils are likely to provide favourable conditions for N2O production processes such as anaerobic denitrification. By contrast, barelands released the lowest N2O fluxes of 1.61 µg N m−2 h−1, showing negative values under extremely dry conditions despite accumulation of NH4+ and NO3− (Fig. 2a−c & h).
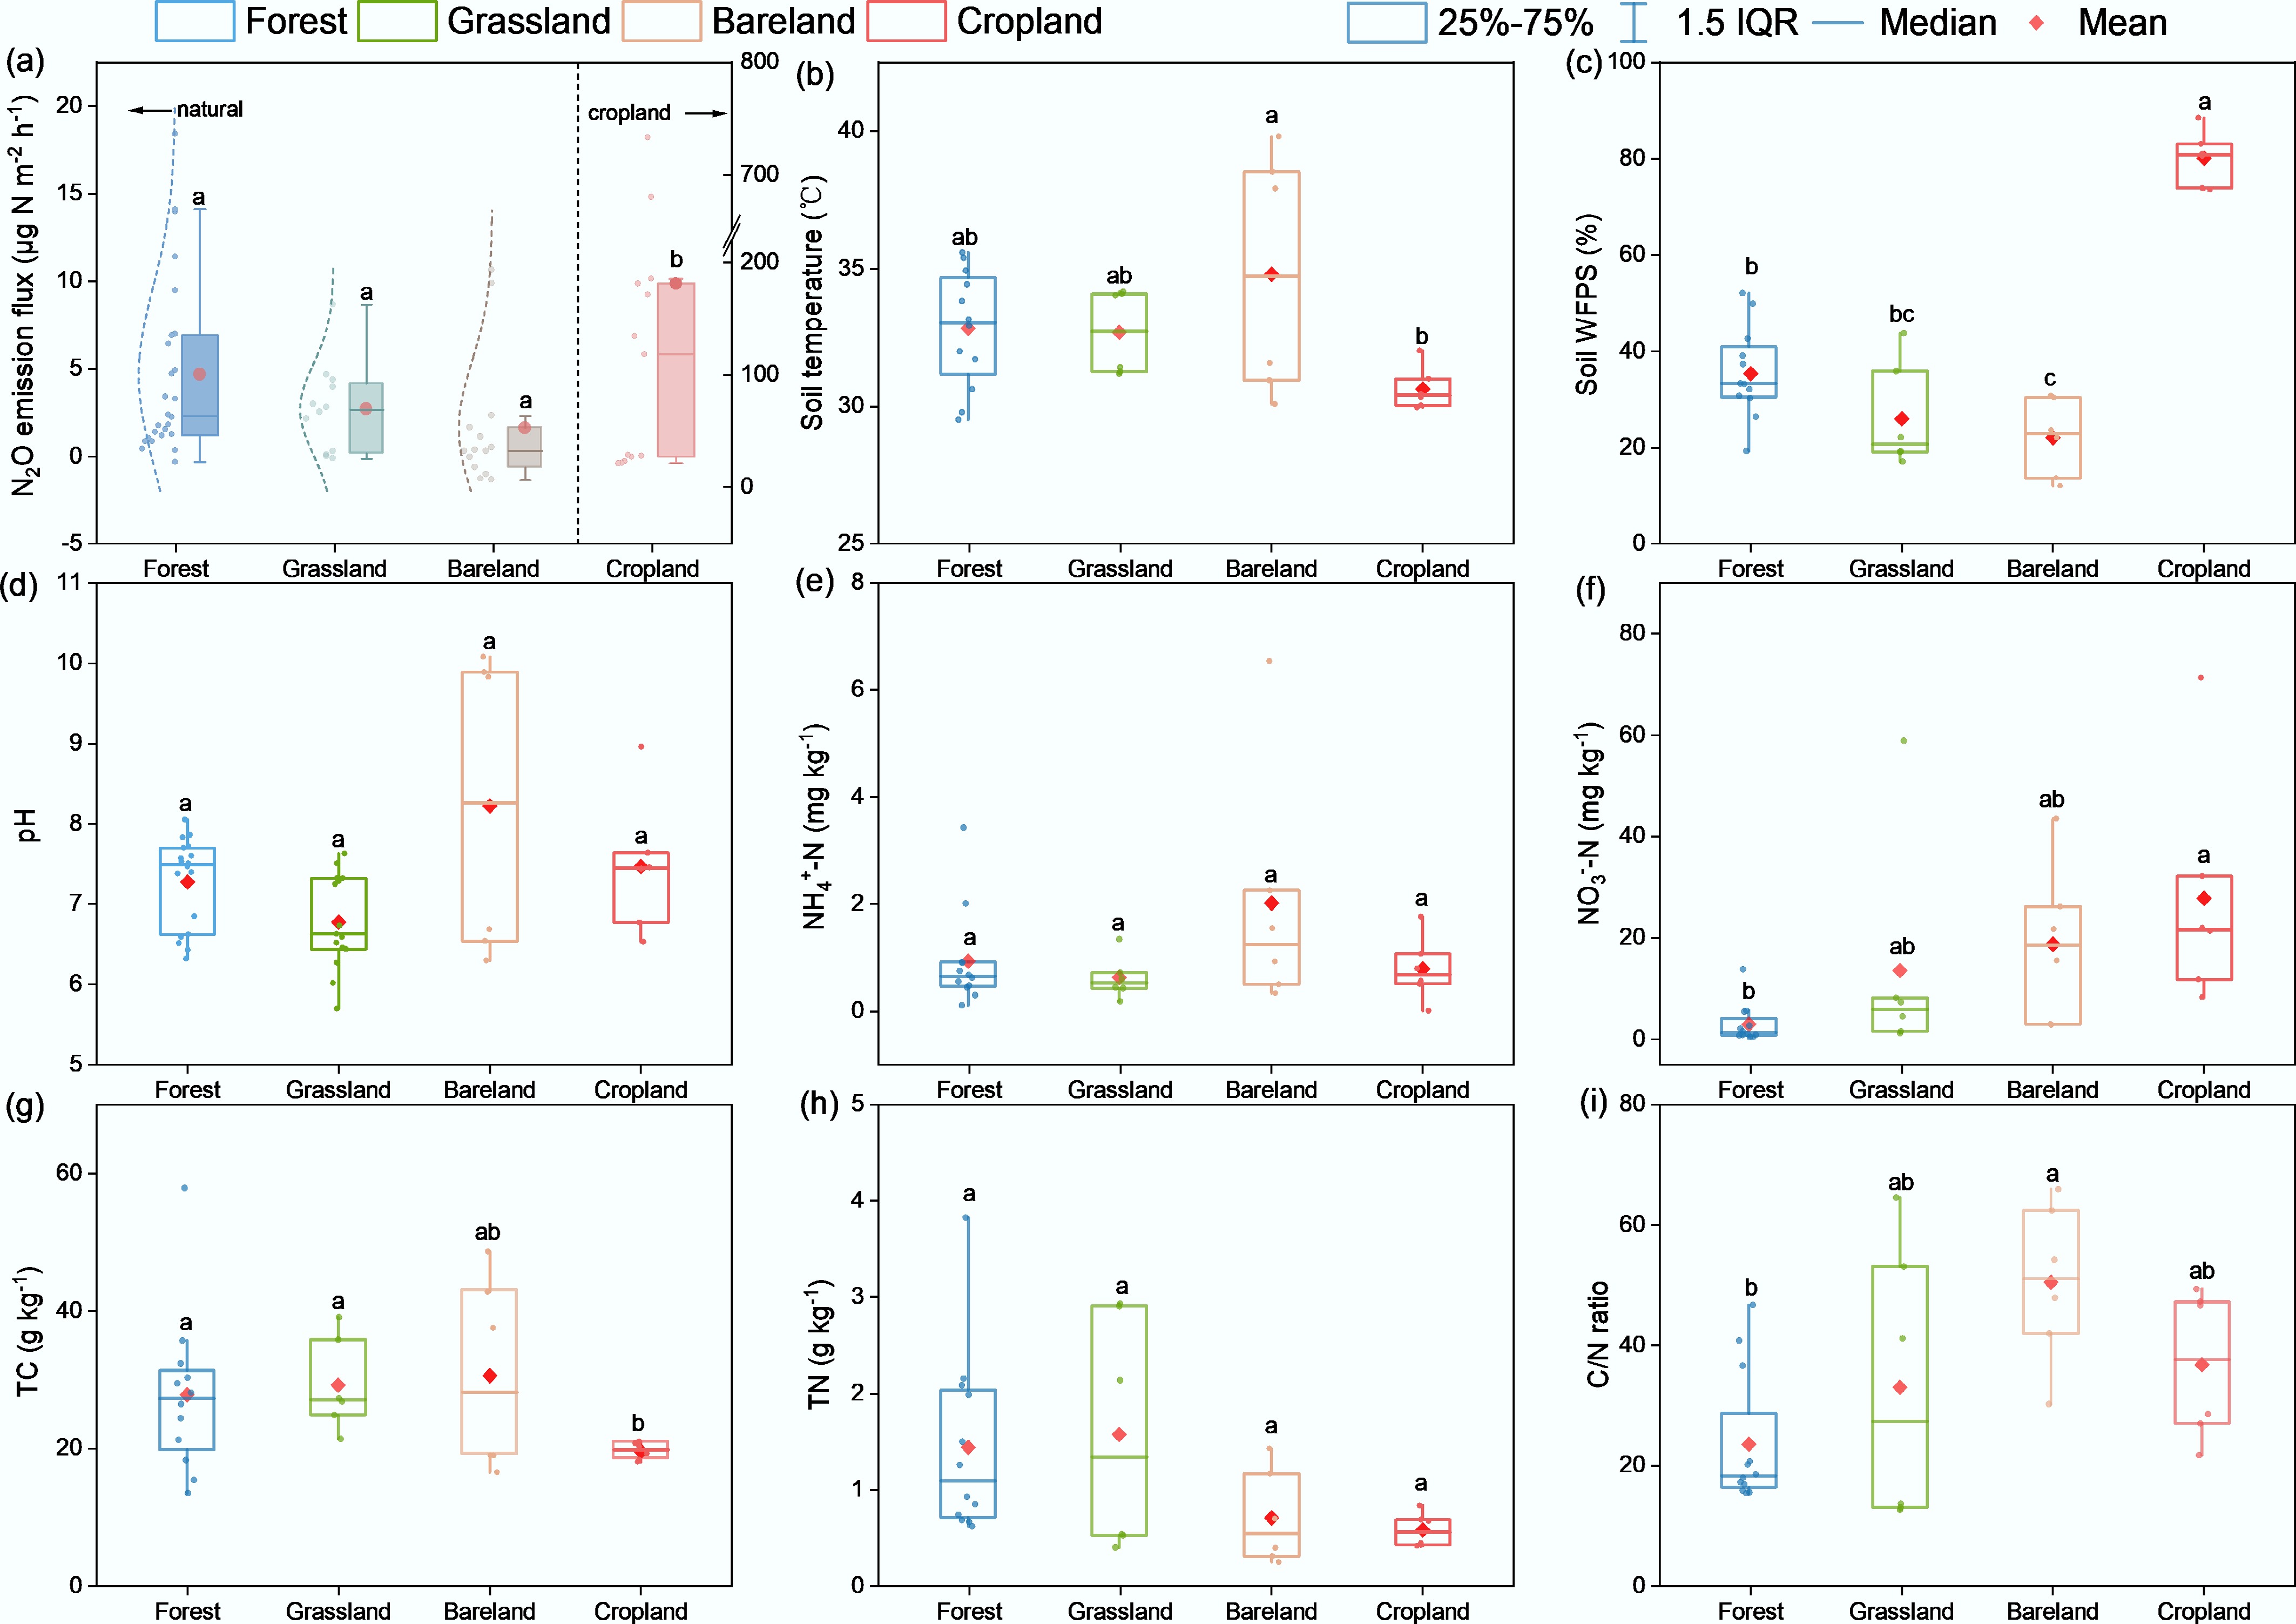
Figure 2.
Effects of different land-use types on soil physicochemical properties. Different lowercase letters indicate significant differences among land-use types (p < 0.05).
In grassland soils, N2O fluxes varied in a range of –0.13 to 8.65 µg N m−2 h−1 (mean flux: 2.69 µg N m−2 h−1; Fig. 2a). In forest soils, the fluxes were generally higher (4.66 µg N m−2 h−1) and varied over a broader range (–0.32 to 18.41 µg N m−2 h−1). Comparing these two ecosystem types, it was found that forest soils had higher water contents at the low-elevation sites (Fig. 2c), but somewhat lower N supplies, mainly reflected in total N content and NO3− concentration (Fig. 2f, h). Despite a higher N2O emission potential (on average) than bare soils, forest and grassland soils generally had lower inorganic N concentrations but higher total N contents. As a result, particularly for the forest soils, C/N ratios were close to 20, among the lowest of all soil types.
N2O emission from grassland soils along the elevation gradient
-
In situ N2O emissions from grassland soils showed a clear increasing trend with elevation (Fig. 3a). At the low-elevation site (LE, G1), the mean flux was 3.54 µg N m−2 h−1, whereas at mid-elevation sites (ME, G2–G4), fluxes gradually increased from 1.83 to 5.22 µg N m−2 h−1. The highest values occurred at the high-elevation site (HE, G5), where the mean flux reached 11.09 µg N m−2 h−1. Similarly, soil temperature declined gradually along the elevation gradient, while soil WFPS increased markedly at the highest site (G5), exceeding 60% (Fig. 3c). Linear regression analysis indicated that N2O fluxes were positively correlated with soil WFPS (R2 = 0.58, p < 0.001; Supplementary Fig. S1b) and were negatively correlated with soil temperature (R2 = 0.07, p = 0.68, Supplementary Fig. S1a). For inorganic N substrates (Fig. 3e), the elevation increase stimulated the concentrations of both NH4+ and NO3−, reaching their highest at the G4 site (1,983 m), but these concentrations dramatically dropped when elevation increased further at the G5 site (2,901 m). In contrast, the soil NH4+/NO3− ratio in grassland sites showed no significant variation along the elevational gradient (Supplementary Fig. S2a).
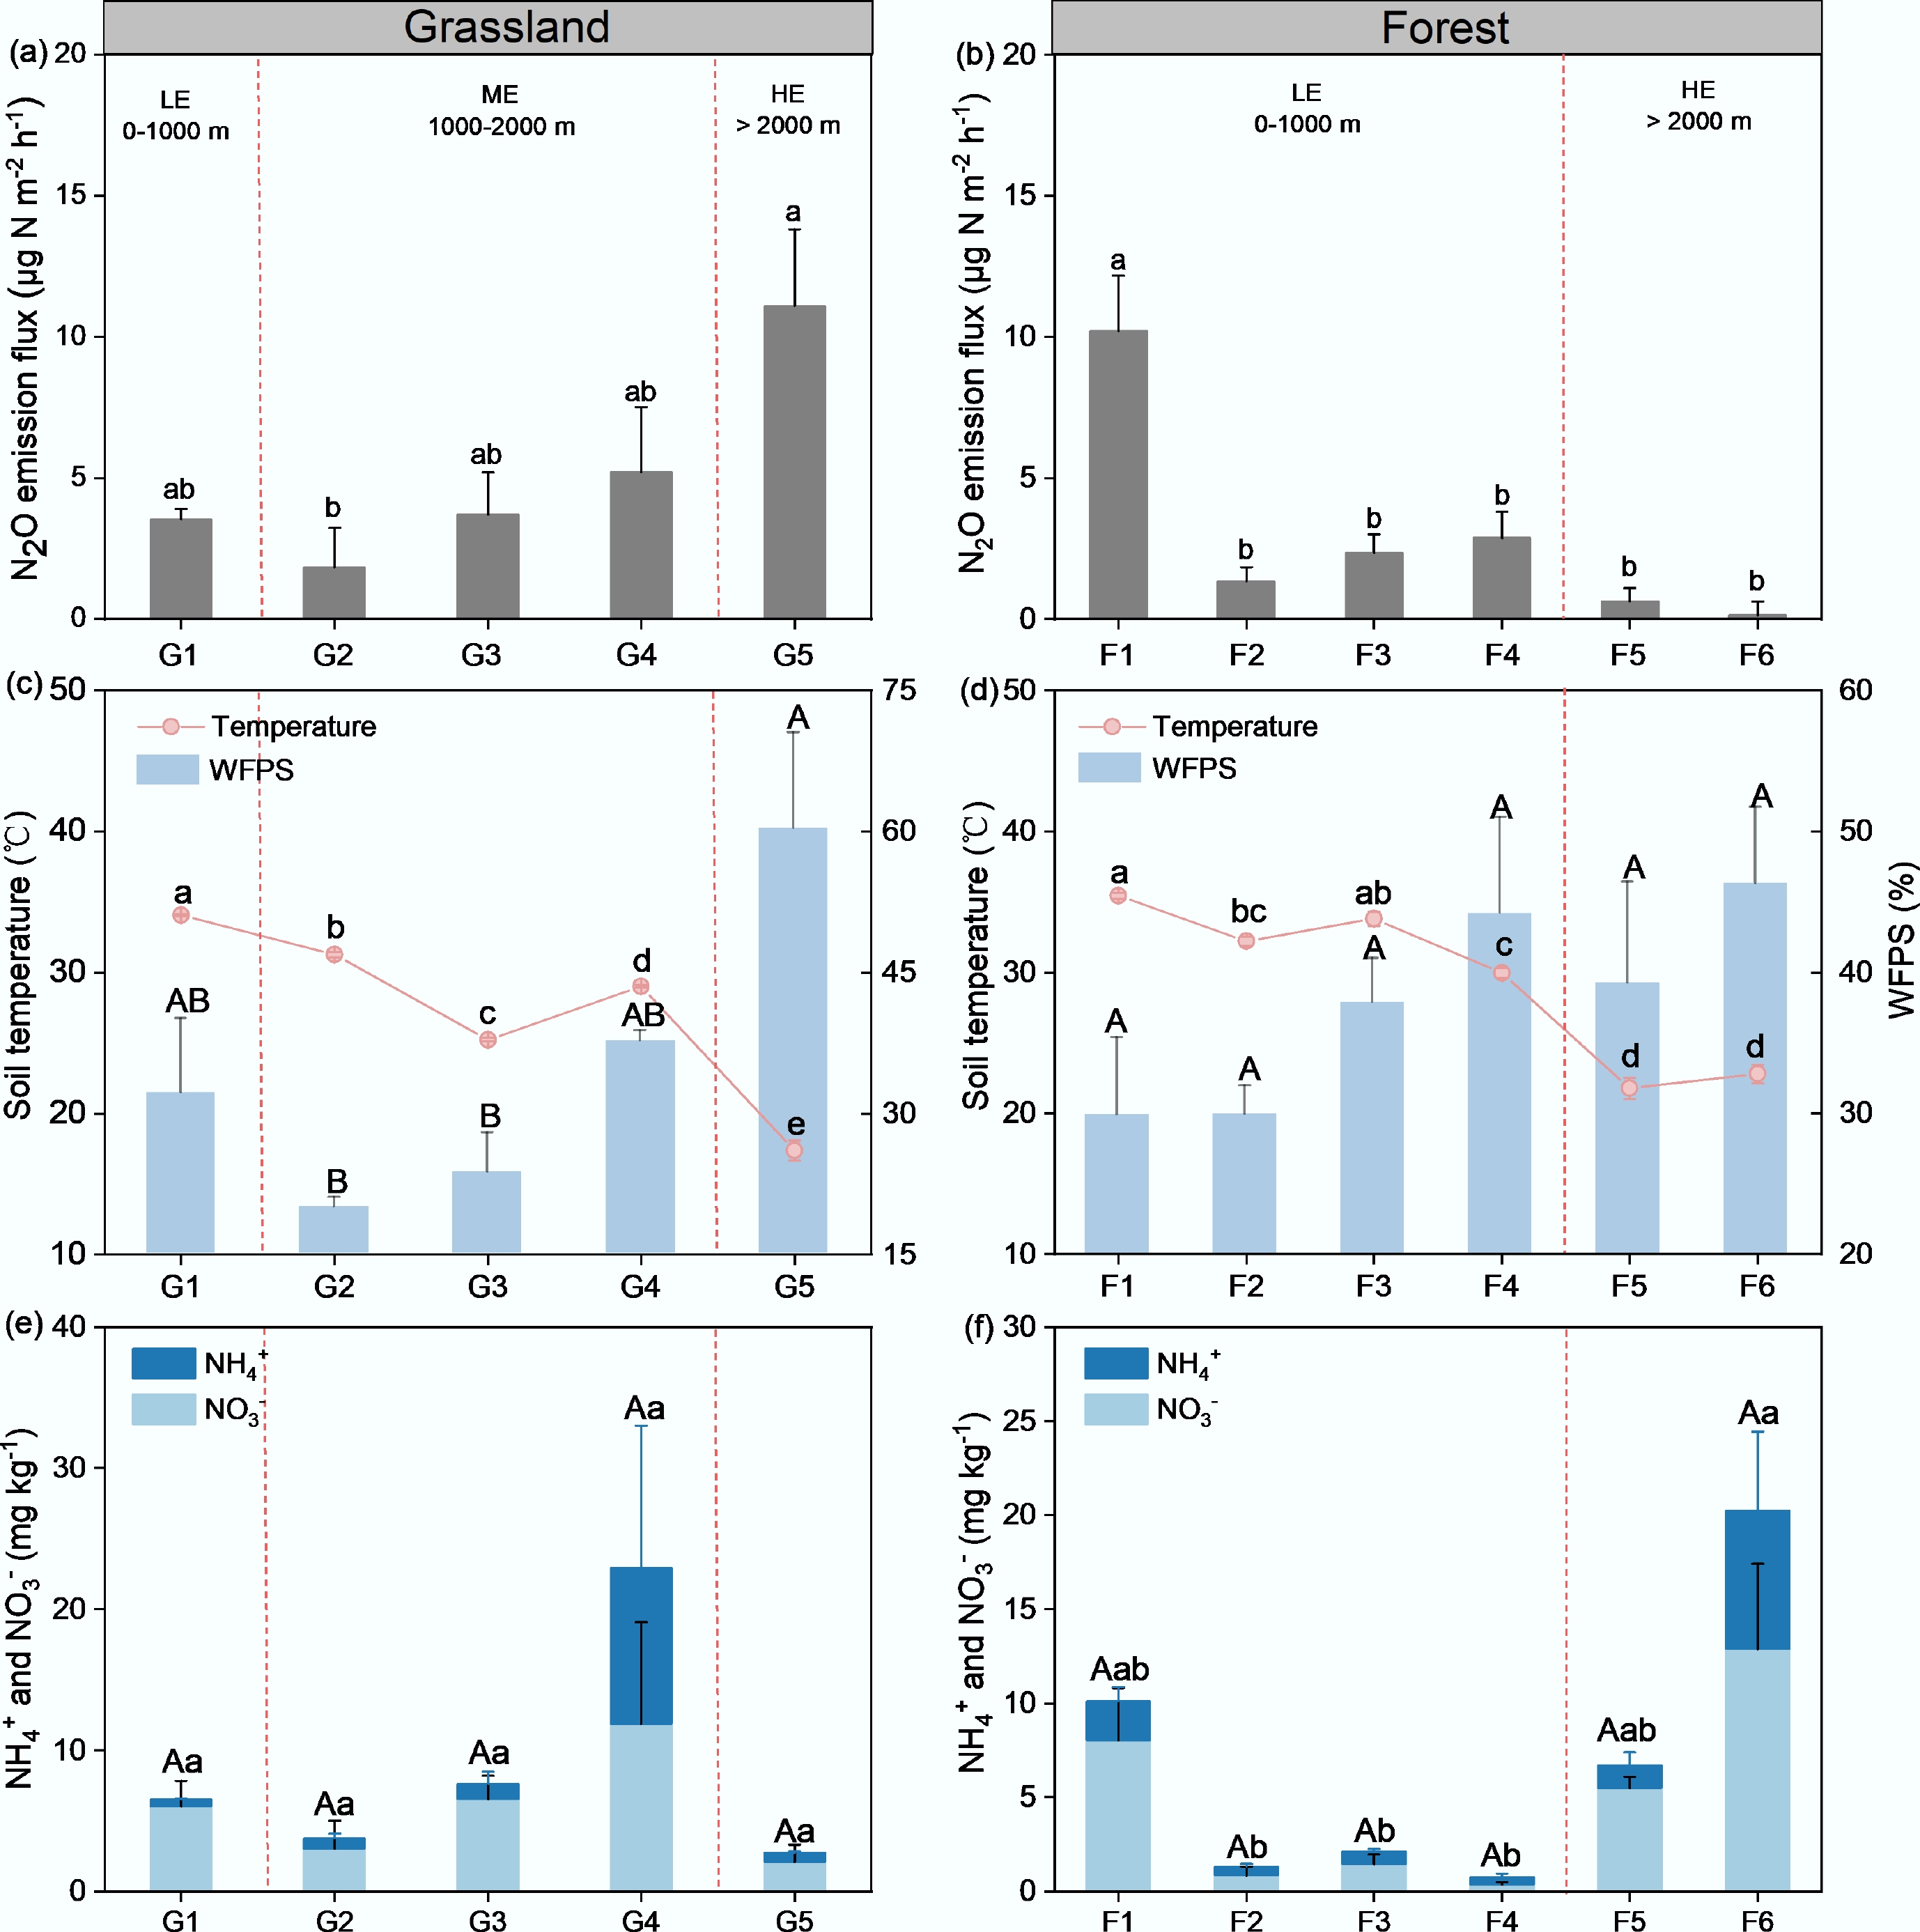
Figure 3.
In situ N2O emission fluxes in (a) grasslands, and (b) forest. Soil temperature and WFPS across (c) grasslands, and (d) forest sites; and soil inorganic nitrogen content (NH4+ and NO3−) across (e) grassland, and (f) forest sites. Different letters (a, b) above the bars indicate significant differences (p < 0.05) among sites within each vegetation type. Error bars represent standard errors of the mean. No forest site was at the ME.
Soil chemical properties in the grassland exhibited an apparent variation along the elevation gradient from 541 to 2,901 m (Table 1). Soil pH gradually decreased from 7.37 ± 0.07 at the low-elevation (LE) site to 6.84 ± 0.15 at the mid-elevation (ME) site and further to 5.60 ± 0.16 at the high-elevation (HE) site (p < 0.05). Total carbon contents increased markedly at ME to 42.88 ± 4.34 g kg−1, which was significantly higher than 24.06 ± 1.60 g kg−1 at LE and 24.31 ± 1.91 g kg−1 at HE (p < 0.05). Total nitrogen contents showed a similar trend, reaching 3.85 ± 0.53 g kg−1 at ME, significantly greater than 0.47 ± 0.04 g kg−1 at LE and 0.87 ± 0.08 g kg−1 at HE (p < 0.05). In contrast, the C/N ratio was lowest at ME (11.57 ± 0.68), while it was higher at the LE (52.63 ± 6.77) and HE (28.20 ± 1.24) (p < 0.05). Although NH4+ and NO3− concentrations did not differ significantly among elevations, they showed an increasing trend from LE to ME, followed by a decreasing trend at higher elevations.
Table 1. Soil chemical properties of the high-elevation (HE, control), medium-elevation (ME), and low-elevation (LE, climate change treatment) sites
Variable Type LE ME HE pH Grassland 7.37 ± 0.07a 6.84 ± 0.15a 5.60 ± 0.16b Forest 7.64 ± 0.06a — 6.55 ± 0.07b TC (g kg−1) Grassland 24.06 ± 1.60a 42.88 ± 4.34a 24.31 ± 1.91a Forest 27.50 ± 3.37b — 90.45 ± 11.42a TN (g kg−1) Grassland 0.47 ± 0.04b 3.85 ± 0.53a 0.87 ± 0.08b Forest 1.42 ± 0.27b — 8.57 ± 1.00a C/N Grassland 52.63 ± 6.77a 11.57 ± 0.68c 28.20 ± 1.24b Forest 23.24 ± 3.2a — 10.61 ± 0.51b NH4+-N (mg kg−1) Grassland 0.47 ± 0.06a 4.31 ± 3.37a 0.68 ± 0.06a Forest 0.91 ± 0.26b — 4.29 ± 2.34a NO3−-N (mg kg−1) Grassland 6.05 ± 1.81a 7.15 ± 2.55a 2.07 ± 1.26a Forest 2.68 ± 1.12b — 9.19 ± 2.63a Values are means ± standard deviations (SE). Significant effects (p < 0.05) are shown in bold. Different lowercase letters (a, b, c) within the same row indicate significant differences among elevation treatments (LE, ME, HE) at p < 0.05, while the same letter indicates no significant difference. ME data are unavailable because forest stands are mainly absent in the mid-elevation zone of the Tianshan region, where vegetation transitions from low-elevation artificial forests to shrublands and grasslands. TN, total nitrogen; TC, total carbon. N2O emission from forest soils along the elevation gradient
-
In situ N2O emission from the forest soils exhibited an elevation pattern opposite to that observed in grasslands (Fig. 3b). At low-elevation sites (LE, F1–F4), mean fluxes were generally higher, ranging from 1.35 to 10.21 µg N m−2 h−1, with the maximum observed at F1. By contrast, fluxes at high-elevation sites (HE, F5–F6) declined sharply to below 1.00 µg N m−2 h−1 (means of 0.63 and 0.14 µg N m−2 h−1, respectively). Statistical analysis revealed that the N2O fluxes at F1 were significantly greater than those at all other sites (p < 0.05), whereas no difference was detected among sites F2–F6. In forest soils, both soil temperature and WFPS exhibited trends along the elevation gradient similar to those in the grassland soils, i.e., temperature decreased and moisture increased with increasing elevation (Fig. 3d). However, unlike in grasslands where N2O fluxes closely followed changes in soil moisture, forest N2O emissions showed a stronger consistency with temperature variations (Supplementary Fig. S1b; R2 = 0.46, p < 0.001).
With increasing elevation, forest soil pH decreased significantly from 7.64 ± 0.06 at LE to 6.55 ± 0.07 at HE (p < 0.05). In contrast to grasslands, where total carbon and nitrogen contents peaked at ME, forest soils exhibited dramatic increases in carbon and nitrogen availability at the HE sites above 2,000 m (p < 0.05). However, the C/N ratio in forest soils dropped from 23.24 ± 3.20 at LE to 10.61 ± 0.51 at HE (p < 0.05). Accordingly, both NH4+ and NO3− concentrations in forest soils were much higher at the HE sites, and exceeded those in grassland soils at comparable elevations.
Functional gene abundance for soil N cycling
-
At low-elevation sites, the abundances of significant nitrogen-cycling functional genes across vegetation cover types showed an overall pattern similar to that of N2O fluxes (Fig. 4). Overall, cropland soils exhibited the highest gene abundances, followed by forest and grassland, while bareland soils had the lowest values (p < 0.05). In forest and grassland soils, the gene abundance of AOA exceeded that of AOB, indicating the importance of archaeal nitrifiers in arid natural ecosystems. Among denitrifying functional genes, soils with vegetation (cropland, grassland, and forest) exhibited minor differences; the nosZ/(nirK + nirS) ratios in forest soils were highest on average, though not statistically significant.
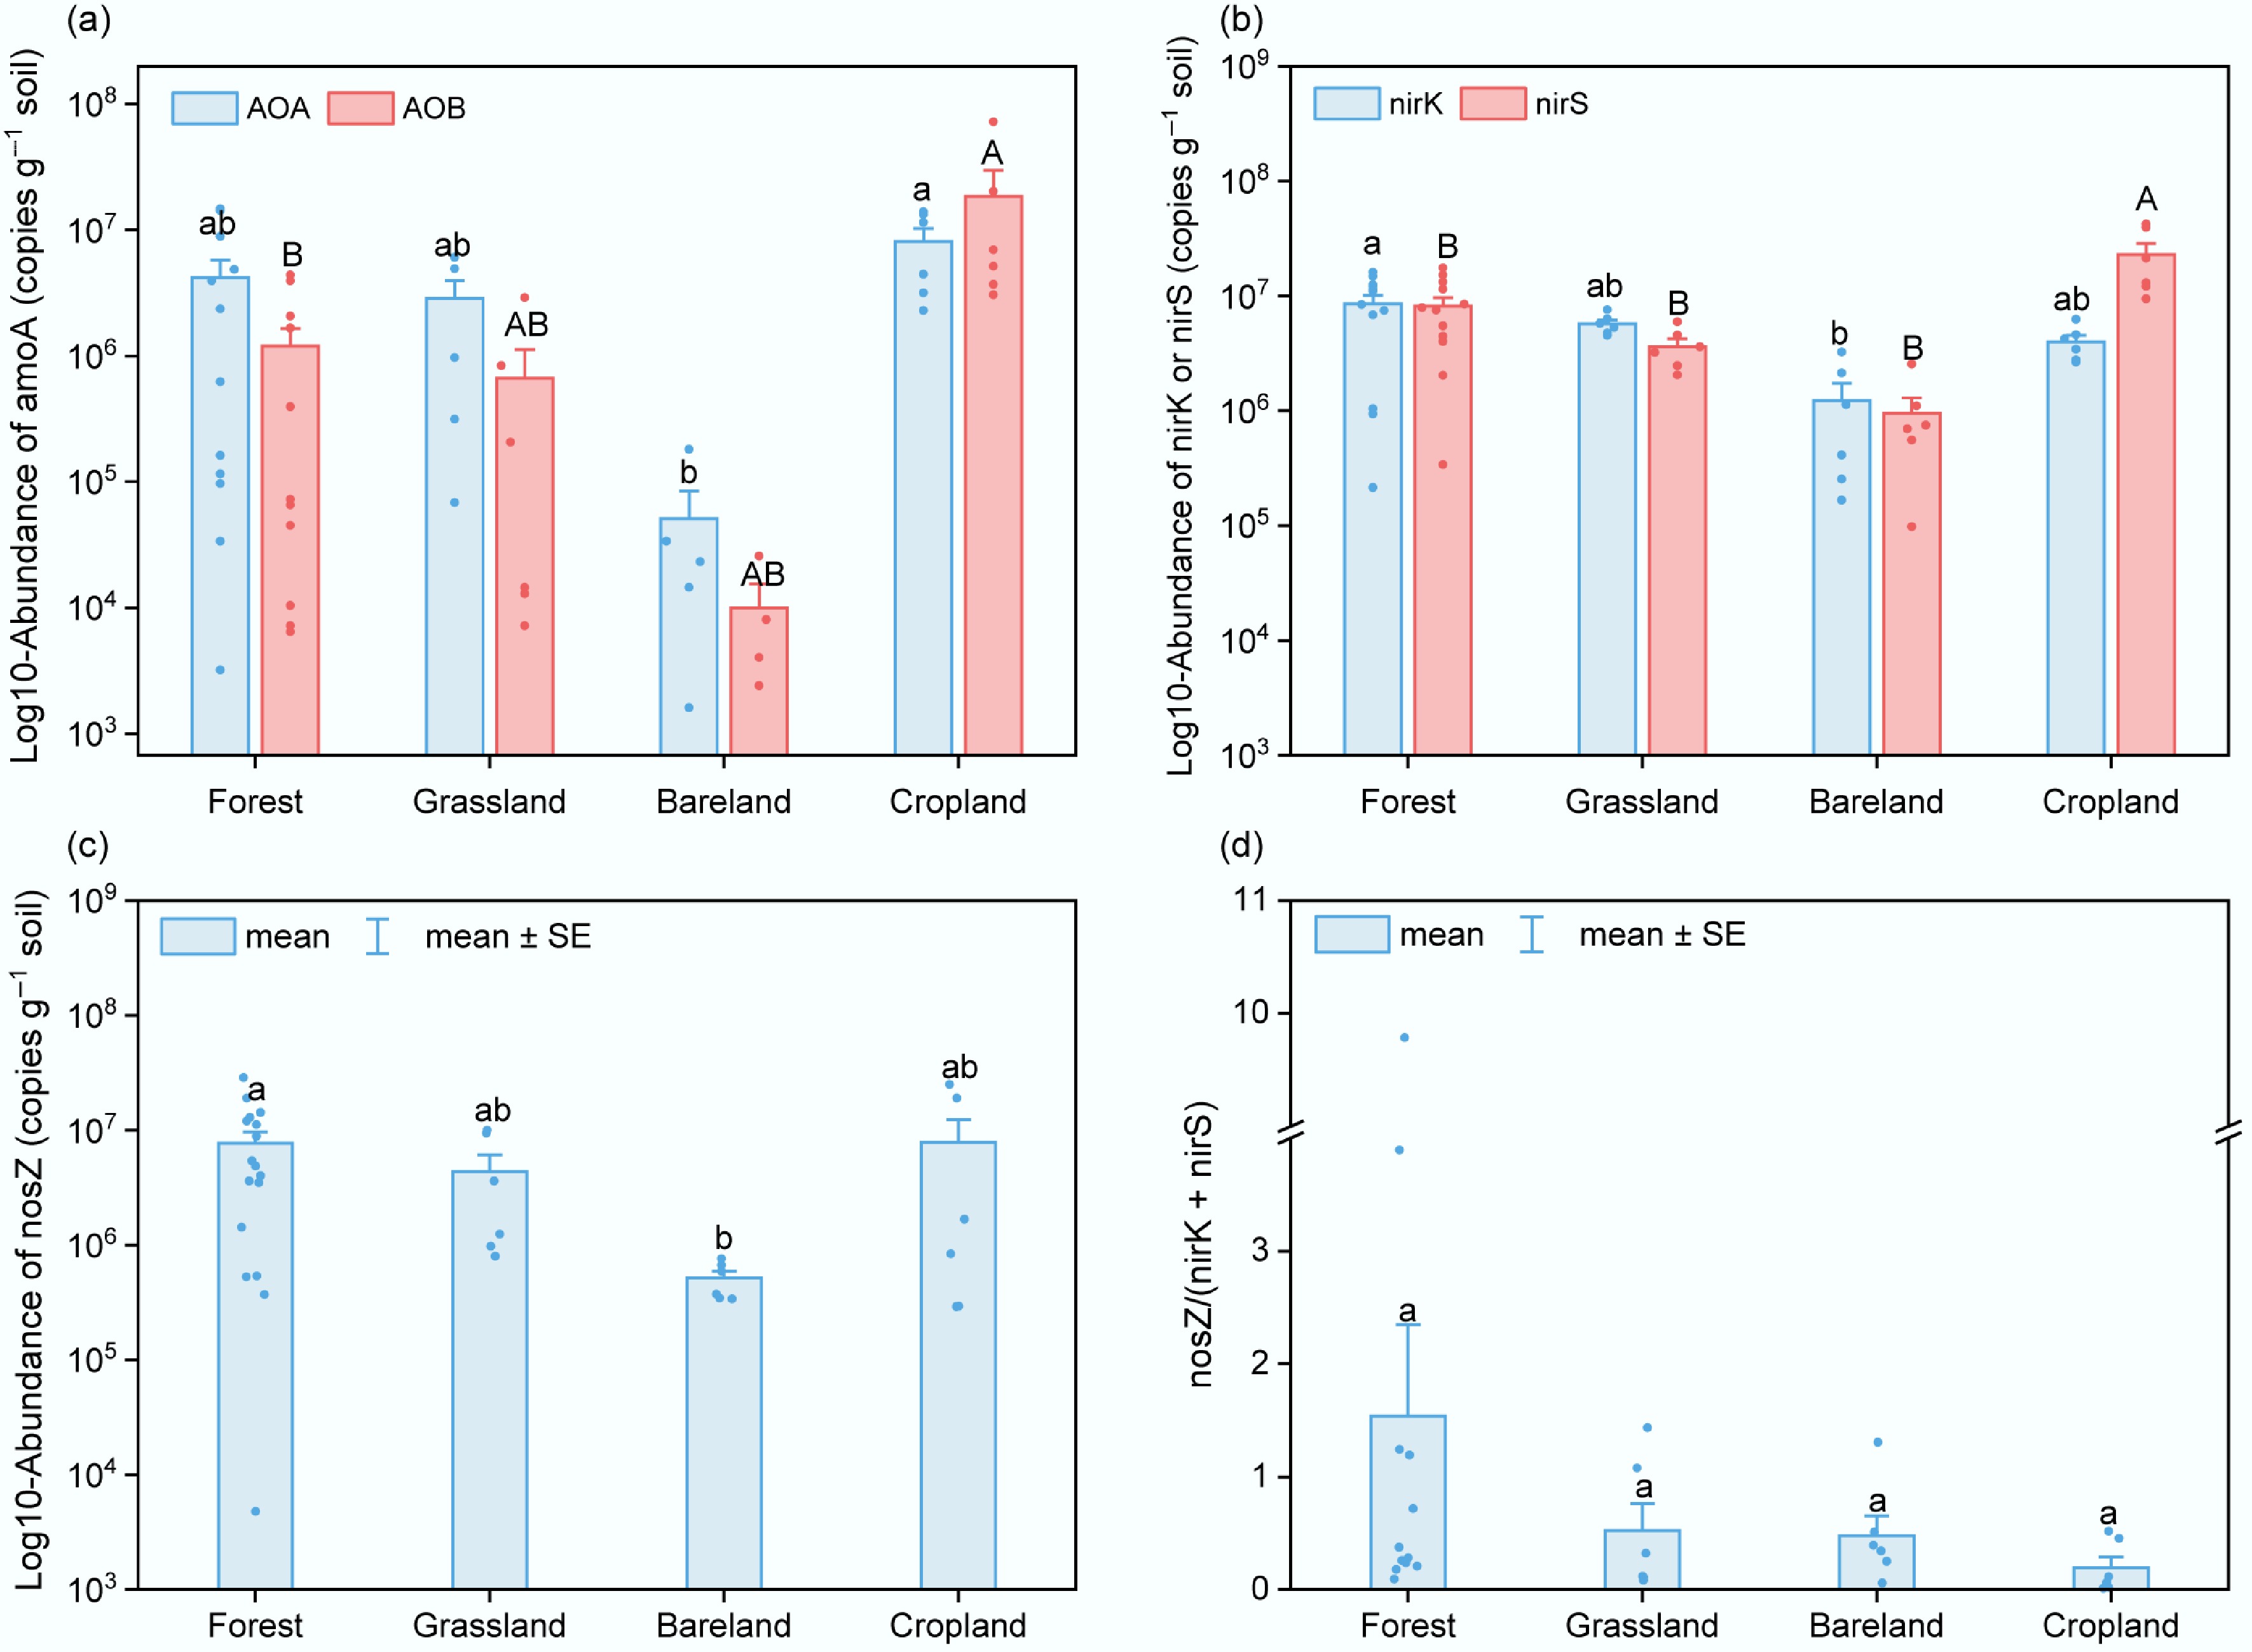
Figure 4.
Abundances of nitrogen-cycling functional genes in soils under different land-use types. (a) amoA genes of AOA and AOB. (b) nirK and nirS genes. (c) nosZ genes. (d) Ratio of nosZ to (nirK + nirS). Different letters indicate significant differences (p < 0.05).
The abundance of nitrogen functional genes in grassland soils showed clear variation along the elevation gradient (Fig. 5a). The abundance of AOA increased steadily from low to high elevation and reached its maximum at the high-elevation sites (p < 0.05). However, AOB abundance increased significantly from low to medium elevation and then declined at higher elevations. For denitrifying gene abundances, nirK showed an elevation-dependent trend of increase which was consistent with AOA (p < 0.05), whereas nirS exhibited slight significant variation (Fig. 5c); the nosZ displayed an opposite pattern, being more abundance at the low elevation (Fig. 5e), resulting in higher nosZ/(nirK + nirS) ratios at the low elevation than those at higher elevations (Fig. 5g). In contrast to grasslands, slight variation across elevations was detected in both nitrifying and denitrifying functional gene abundances in the forest (Fig. 5b, f). Both nirK and nirS showed a decline from low to high elevations, which was significant for the nirS abundance (Fig. 5d). In addition, the AOA abundance was significantly lower in forest soils than in grassland soils.
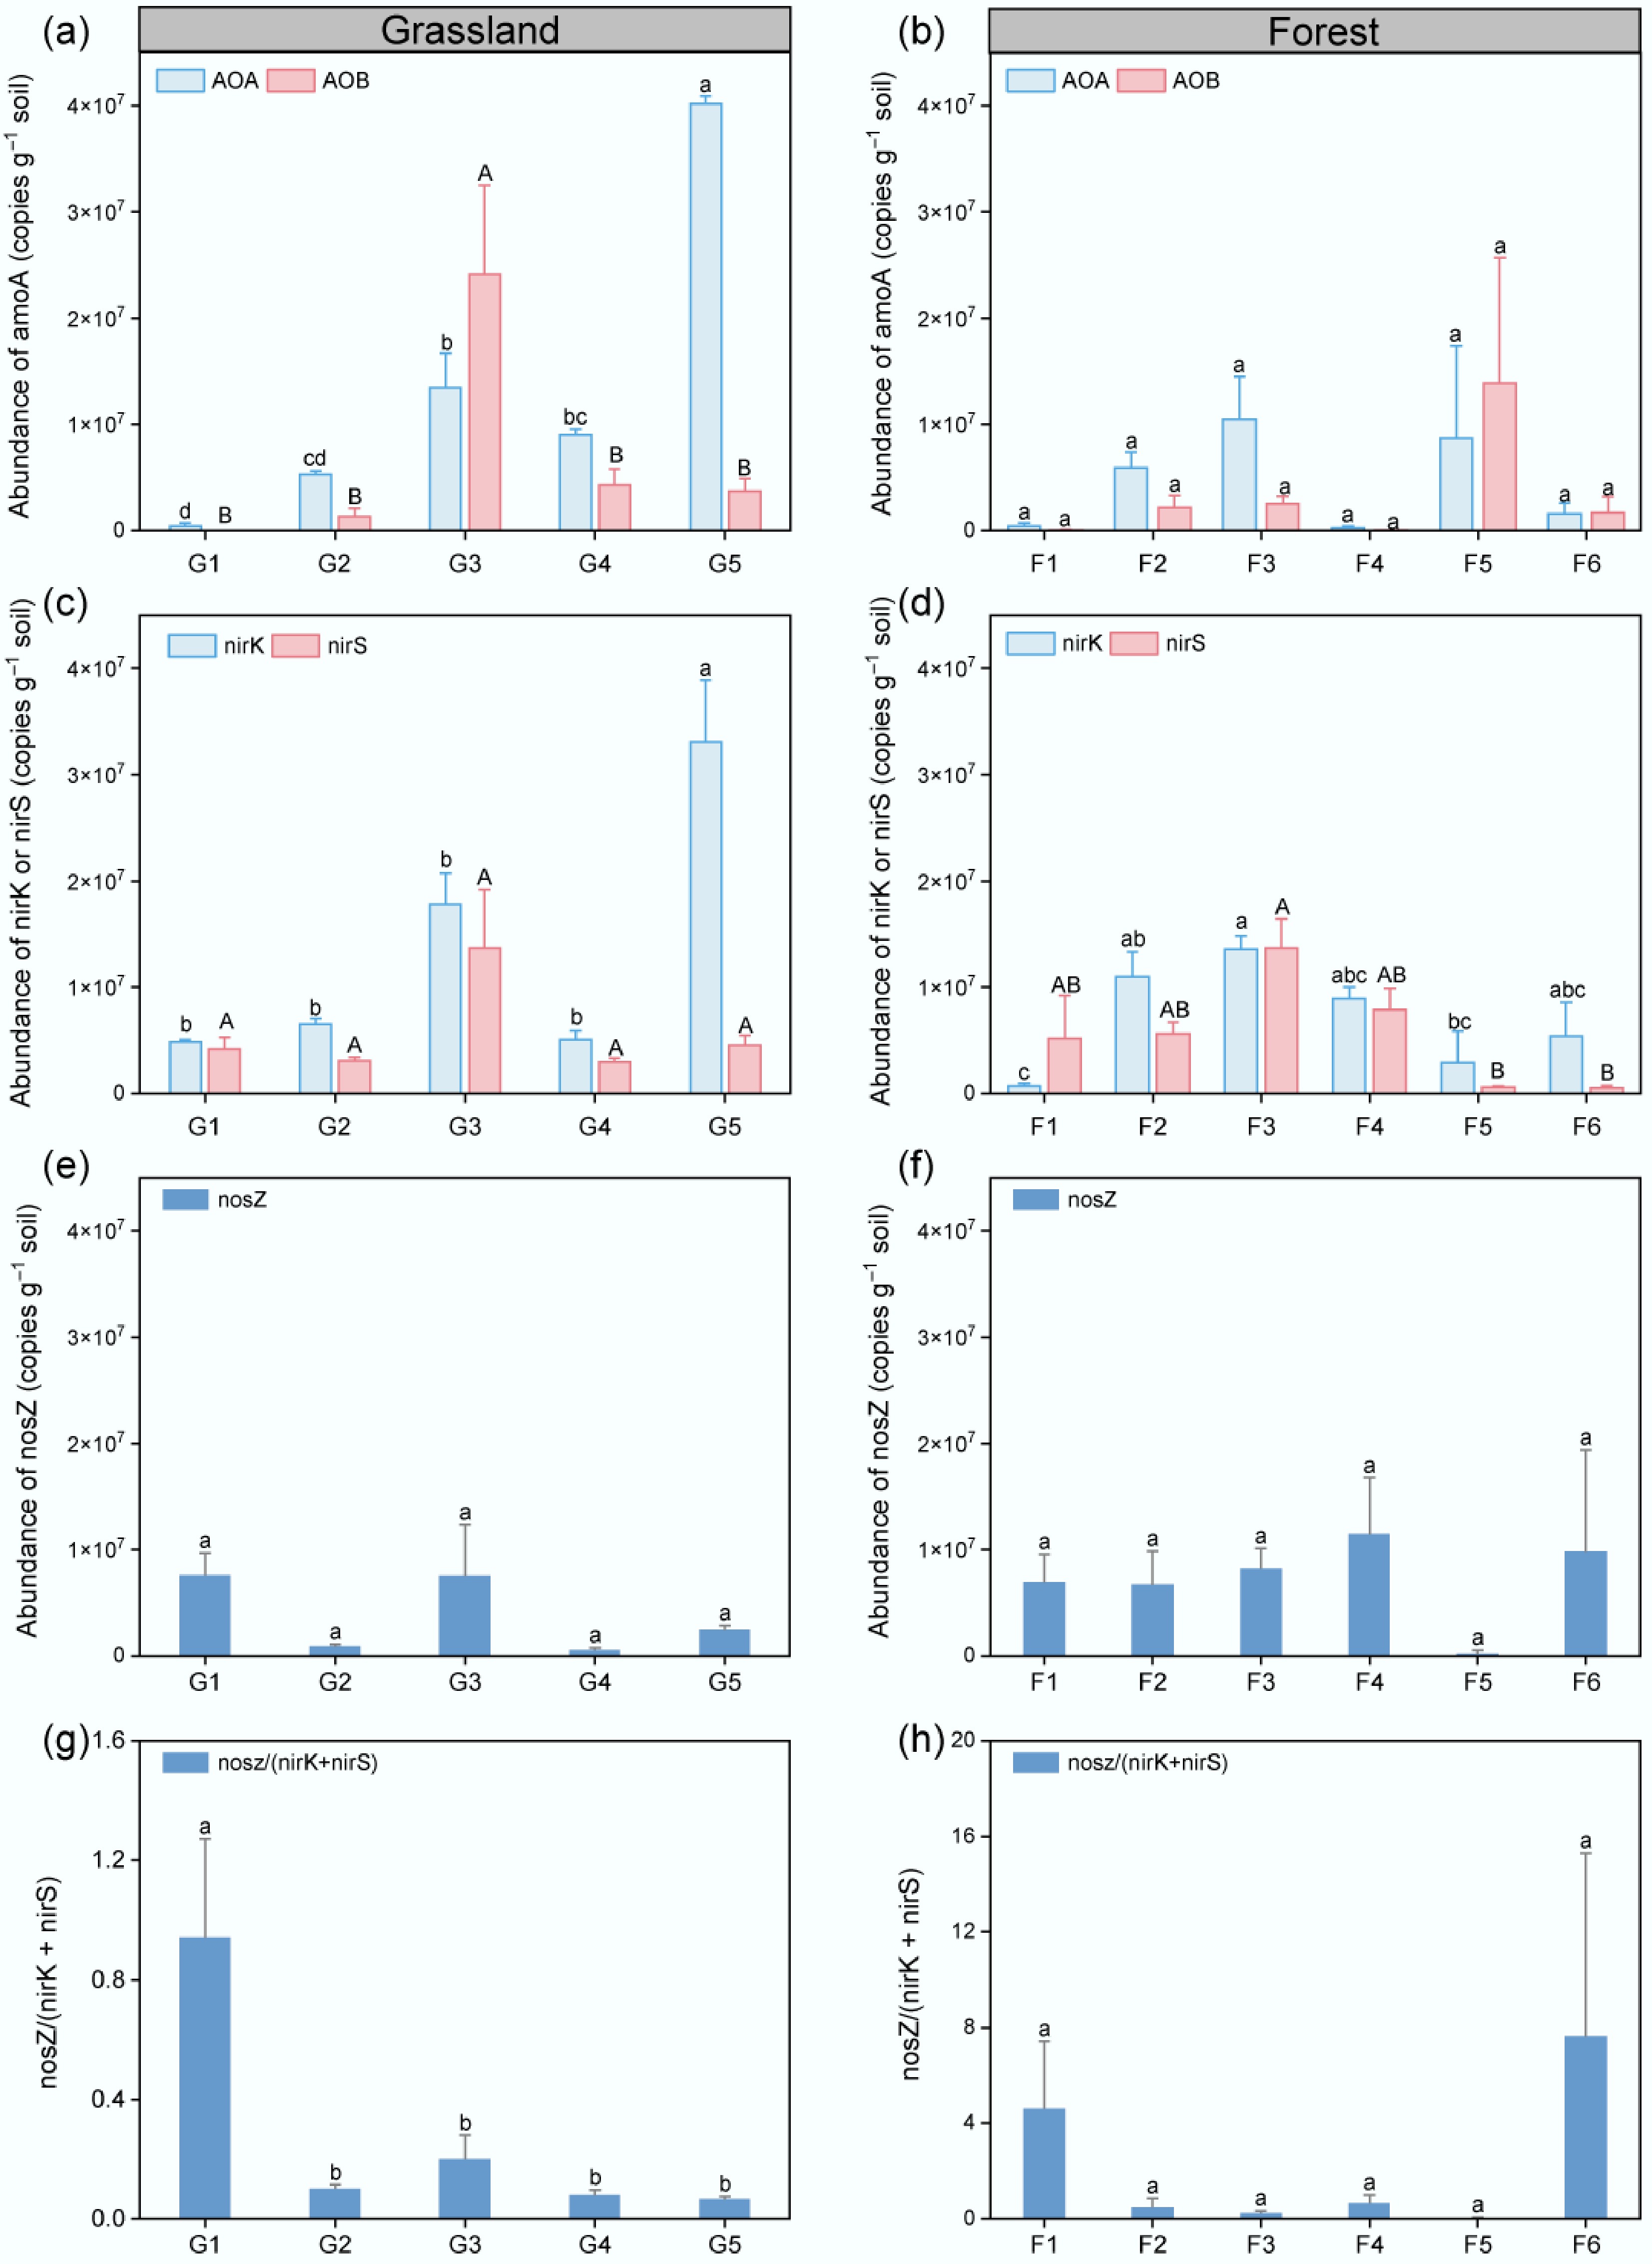
Figure 5.
Abundances of nitrogen-cycling functional genes in grassland and forest soils along elevation gradients. (a), (b) Abundances of amoA genes in AOA and AOB. (c), (d) Abundances of nirK and nirS genes. (e), (f) Abundances of nosZ gene. (g), (h) Ratios of nosZ to (nirK + nirS) in grassland and forest soils at low (LE < 1,000 m), medium (ME, 1,000−2,000 m), and high (HE > 2,000 m) elevations. Error bars indicate ± SE, and different letters denote significant differences among sites (p < 0.05).
Contrasting drivers of N2O emissions along the elevation gradient
-
PCA revealed distinct sets of variables associated with N2O emissions at low and high elevations. In grasslands (Fig. 6a), PC1 and PC2 explained 35.7% and 29.4% of the variance, with high-elevation samples aligning with higher WFPS and nirK abundance and lower soil pH. These PCA patterns are supported by the regression results in Supplementary Fig. S1, where WFPS showed a significant positive relationship with N2O fluxes (R2 = 0.58, p < 0.001), while soil temperature and inorganic N exhibited weak associations, consistent with their minor PCA contributions. Random forest results (Supplementary Fig. S3a) also identified denitrification genes (nirK + nirS) and WFPS among the highest-ranking predictors, further corroborating their strong PCA loadings. In forest soils (Fig. 6b), PC1 and PC2 accounted for 42.6% and 20.4% of the variance, with clear separation between low- and high-elevation sites along PC1, which was dominated by temperature- and organic nutrient-related variables (TC, TN). This pattern aligns with Supplementary Fig. S1a, where soil temperature showed a significant relationship with N2O fluxes in forests (R2 = 0.46, p < 0.001), and with the random forest analysis (Supplementary Fig. S3b), in which elevation, temperature, and TC/TN were the most influential predictors, whereas WFPS and inorganic N contributed weakly in both analyses. These convergent lines of evidence collectively validate the PCA interpretation that grassland N2O variability is more closely associated with moisture-related factors, whereas forest N2O variation aligns primarily with temperature-related gradients.
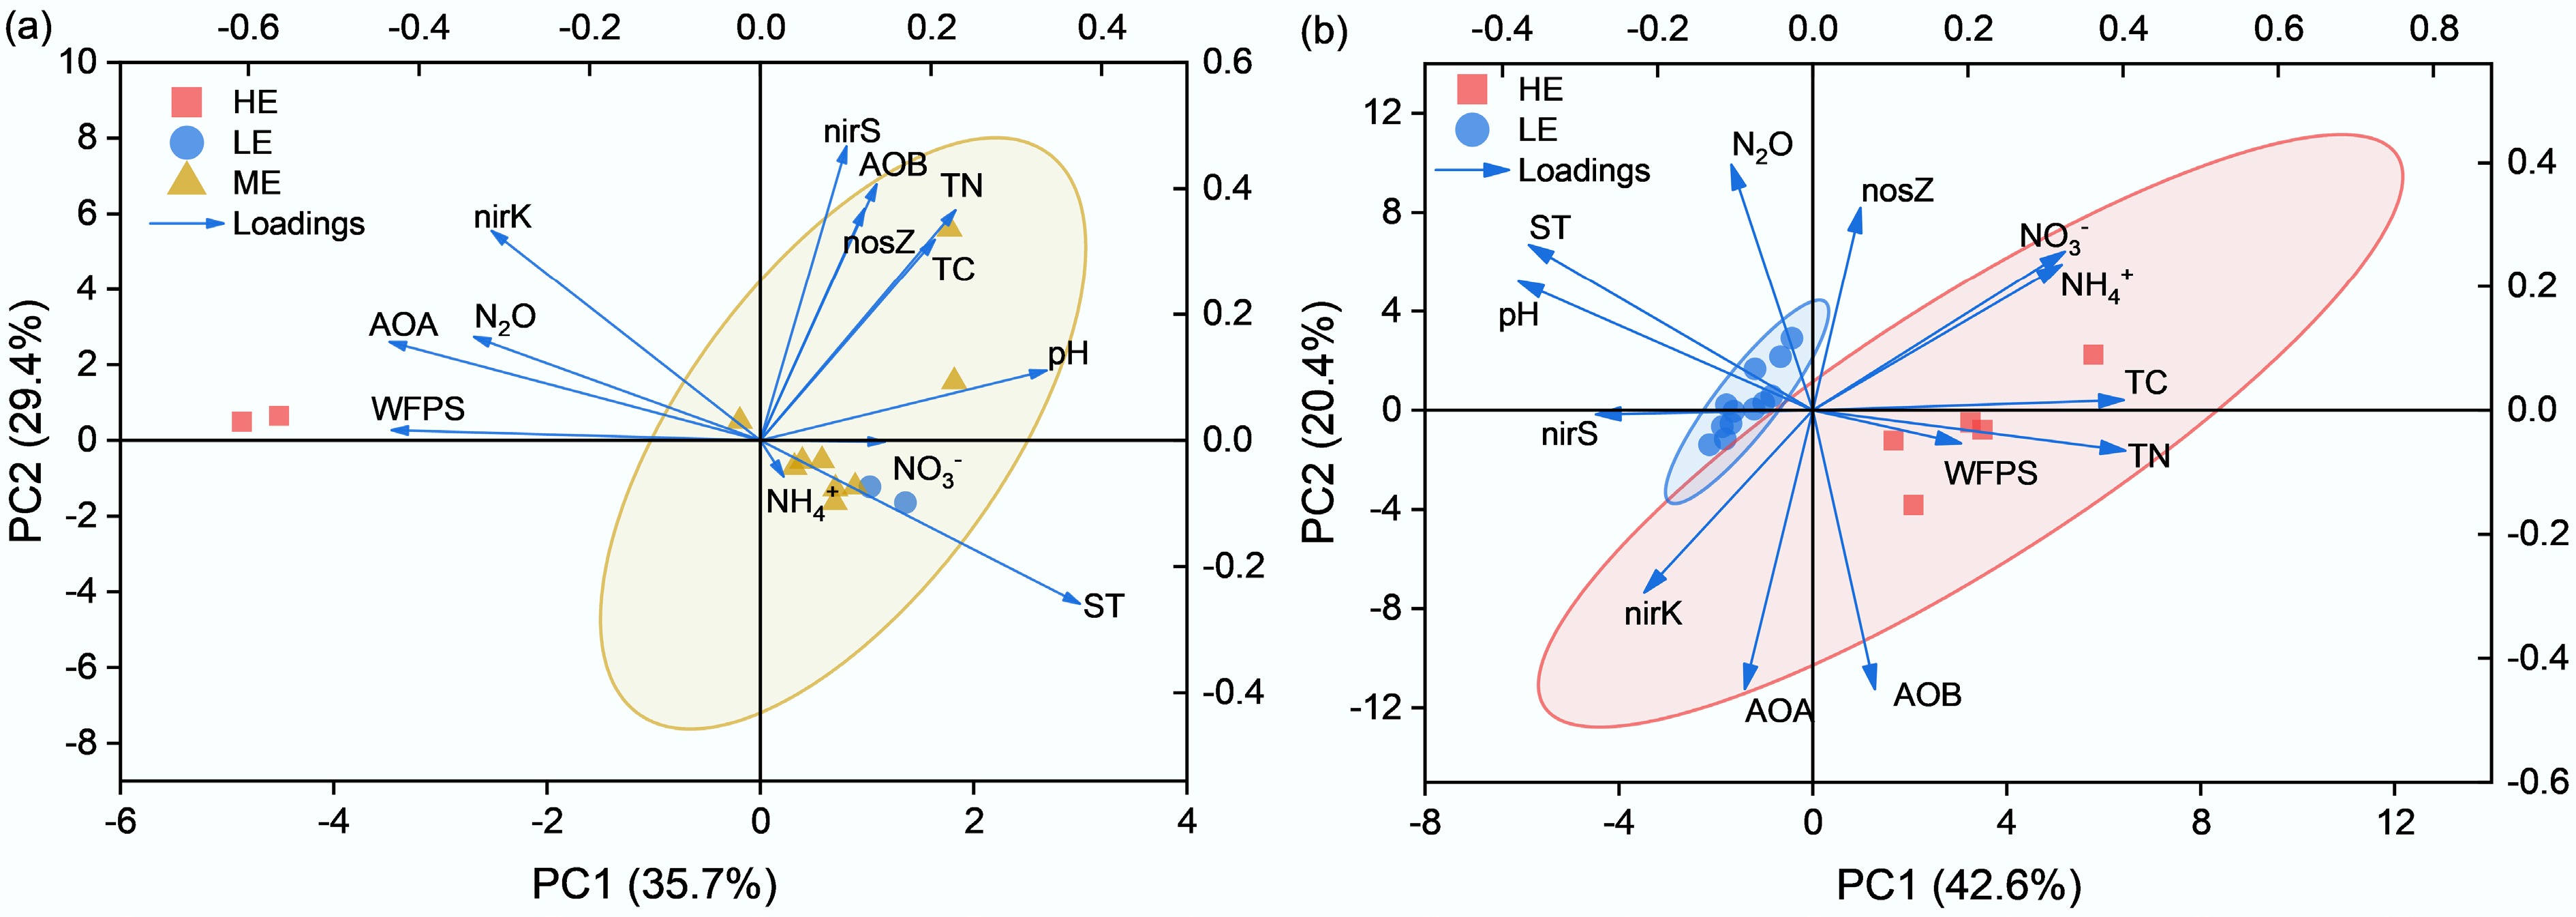
Figure 6.
PCA results showing correlations between soil N2O emissions, environmental factors, and nitrogen-cycling genes in (a) grassland, and (b) forest soils along the elevation gradient. Arrows represent variable loadings (ST, WFPS, TC, TN, pH, NH4+, NO3−, AOA, AOB, nirK, nirS, nosZ).
-
Based on in situ flux measurements, the study demonstrated that vegetation types strongly affect soil N2O emissions from the arid zone of Xinjiang Province, NW China (Fig. 2a). Among all emission sources, cropland soils (cotton field) stood out as the major hotspots of N2O emissions, with an average flux of 181.32 µg N m−2 h−1 and a maximum of 733.53 µg N m−2 h−1. These flux magnitudes are generally comparable to those previously reported for irrigated cotton systems in northern Xinjiang (Table 2)[26,27]. Beyond Xinjiang, irrigated cotton systems in other parts of China also exhibit substantial N2O losses. For example, mean N2O fluxes ranging from 5.8 to 373.0 µg N m−2 h−1, corresponding to an annual emission of 2.6 kg N ha−1 yr−1, have been reported for irrigated cotton fields in northern China, with the highest emissions occurring shortly after N fertilization[28]. Other studies have demonstrated that in arid northwestern China, the use of mulched drip irrigation combined with biochar application reduced cumulative growing-season N2O emissions from cotton fields by approximately 29%–38% compared with conventional furrow irrigation under high nitrogen input. This approach also maintained higher yields and water use efficiency[29]. The strong N2O emission strengths could be attributed to the relatively high inorganic NO3− content and soil WFPS, which likely support active nitrification and denitrification (Fig. 2). Other studies from this arid region have also found that intensive irrigation and fertilization jointly enhance N2O emissions, with transient surges in N2O fluxes after irrigation and fertilization events[26,27]. Compared with other northern agricultural regions of China, such as winter wheat–summer maize systems in the North China Plain (0.3−30.7 kg N ha−1 yr−1;[30]) and rainfed maize fields in northeast China (1.8−2.8 kg N ha−1 yr−1;[31]), the studied cropland soils from the Xinjiang arid region reveal a comparable emission potential despite generally lower inorganic-nitrogen concentrations (Table 1), highlighting the importance of wetting-induced pulse emissions of N2O.
Table 2. Summary of mean N2O fluxes from previous studies in Xinjiang, China
Type Experimental site Experiment date N2O flux (μg N m−2 h−1) Ref. Latitude Longitude Altitude (m) Natural land Grassland 42°52.76' 83°41.90' 2,468 2013−2017 1.34 [36] Grassland 42°53' 83°42.5' 2,468 2017−2019 2.91 [21] Grassland 42°49.22' 84°22.52' 2,390 2014 0.99 [37] Grassland − − < 1,000 2023 3.54 This work − − 1,000−2,000 3.59 − − > 2,000 11.09 Forest 41°48.35' 86°04.37' 918 2019 7.90 [38] Forest − − < 1,000 2023 4.38 This work − − > 2,000 0.45 Bareland 44°30' 82°36' 387 2016 0.046 [39] Bareland − − < 1,000 2023 1.80 This work Cropland Cotton 37°01.10′ 80°43.80′ 1,367 2016 9.86 [40] Cotton 43°56' 87°28' 599 2012 110.02 [41] Corn 43°57.72' 87°30.08' 584 2013 87.84 [42] Cotton 44˚33' 85˚56' 369 2021−2022 21.83 [43] Cotton 44°18.48' 86°03.75' 476 2021 94.76 [44] Cotton − − < 1,000 2023 181.32 This work Compared with agricultural soils, natural vegetation-covered soils generally showed marginal emissions below 5 µg N m−2 h−1, in accordance with fluxes reported from natural soils in the Xinjiang region (Table 2). In the grassland and bareland, soils were significantly drier with a mean soil WFPS of around 20%, likely promoting mineralization processes and the accumulation of inorganic N (Fig. 2e & f)[6]. However, water scarcity appears to be the primary limiting factor for N2O fluxes, which can be attributed to the suppression of microbial activities (denitrifiers) for N2O production[32]. On the other hand, the studied forest soils from the low elevation were derived from four sites, showing a significant variability in N2O fluxes (0.28–15.49 µg N m−2 h−1). All forest sites in low elevation were situated along the northern piedmont of the Tianshan Mountains and primarily consisted of secondary shelterbelts or managed plantations established for windbreak and sand stabilization (Fig. 1). Their management legacy, including occasional irrigation and fertilization, together with the spatial heterogeneity of soil physicochemical properties, likely contributed to the elevated and variable N2O emissions observed relative to the adjacent grasslands. Among these sites, F1 exhibited the highest N2O flux, coinciding with enriched nitrate concentrations, higher soil temperature, and lower water-filled pore space (Fig. 3d, f). Such a combination of warm and moderately dry conditions is conducive to nitrification-driven N2O formation, as accelerated ammonium oxidation and nitrite turnover can occur in well-aerated soils with limited moisture[6,33]. However, this explanation is only partly supported by molecular evidence. The abundances of AOA and AOB were both low at the F1 site, suggesting limited microbial nitrification potential. Because functional gene abundance reflects only potential rather than instantaneous activity, biological drivers alone cannot fully explain the observed flux heterogeneity. Recent evidence from arid ecosystems indicates that abiotic or nitrite-mediated chemical reactions can represent an important alternative pathway for N2O formation under warm, dry conditions. Recent studies in arid ecosystems have shown that under prolonged dry conditions, abiotic reactions involving nitrite (NO2−) can contribute substantially to N2O formation, complementing microbial pathways. For example, Homyak et al.[34] demonstrated that in dryland soils of California, chemical nitrosation and nitrite decomposition produced rapid pulses of nitrogen oxides even in the absence of significant microbial activity. In a subsequent mechanistic study, Homyak et al.[35] further showed that soil acidity and organic matter enhanced abiotic gas formation, confirming that nitrite-mediated chemical denitrification can be an important source of N2O in warm and dry environments. These results indicate that abiotic nitrite reactions under dry and warm conditions may substantially contribute to N2O emissions, which could help explain the remarkably high flux observed at site F1 among low-elevation forest soils.
Variations of N2O emission in grassland soils along the elevation gradient
-
Across the elevation gradient (541−2,901 m), N2O emissions from grassland soils showed a clear increasing trend (Fig. 3a). This pattern was accompanied by increasing soil moisture, as indicated by higher WFPS, and a concurrent decline in soil temperature with increasing elevation (Fig. 3c). These results suggest that anaerobic processes, such as denitrification, contribute to enhanced N2O emissions[45]. The variation of denitrifying gene abundance supports the hypothesis, as nirK strongly increased from low to medium and then to high elevations (Fig. 5c). In addition, the decrease in soil pH was accompanied by a decline in nosZ gene abundance (on average), indicating that N2O reduction was suppressed[46]. Consistent with these observations, multiple lines of evidence indicate that enhanced soil moisture conditions and denitrification-related microbial activity play a central role in shaping N2O flux patterns along the elevational gradient. Together, these pieces of evidence converge to indicate that incomplete denitrification dominates N2O production in high-elevation grassland soils, consistent with previous subalpine grassland studies showing that increased moisture availability enhances denitrification under high-elevation climatic conditions[45]. However, the soil inorganic N content seems weakly related to N2O emission strength (Fig. 6a). At the G4 site, exceptionally high NH4+ and NO3− concentrations in the soil were observed, likely influenced by light grazing from surrounding areas. This may point to the relative importance of soil WFPS on N2O emissions rather than substrate N availability during the growing season, as reported in work from alpine steppe and alpine meadows[47,48]. On the other hand, grazing can significantly influence soil microbial communities for N cycling. A recent meta-analysis demonstrated that heavy grazing reduced N2O emissions by suppressing amoA and nirS abundances, thereby lowering both nitrification and denitrification potentials, whereas moderate grazing had weaker or neutral effects[49]. As for the site G4, grazing may stand out as a factor contributing to the explanation of weak N2O emission potential, but further investigation is needed to explore the mechanism based on more sample coverage and longer observations.
Commonly, the elevation gradient in mountain ecosystems leads to a wetter but colder climate, slowing organic matter decomposition but enhancing leaching processes due to increased precipitation driven by orographic uplift[50]. As a consequence, the release of organic acids and leaching of cations would result in a drop of soil pH, as observed in the study (Table 1). Accordingly, soil AOA abundance increased dramatically, and the relative importance of AOB decreased (Fig. 5a), suggesting the sensitivity of soil microorganisms to the shift towards a wetter climate at higher elevations. This pattern aligns well with a study conducted from 1,800 to 4,100 m in the Gongga Mountains of the Xizang region[51]. It was found that declines in soil pH and biodiversity contributed most to the preference for AOA over AOB in soils along an elevation gradient. Hence, although the direct contribution of nitrification to N2O may be minor, the dominant role of ammonia-oxidizing archaea in providing nitrate as a substrate for denitrification is supported by functional gene analysis (Fig. 6a).
Comparison of N2O emissions in forest soils from low and high elevations
-
The in situ observations of N2O fluxes from forest soils revealed a significant decrease from low to high elevation (Fig. 3b), with a pattern opposite to that observed in grasslands. Along this elevational gradient, soil temperature declined markedly, while soil WFPS increased (Fig. 3d). In addition, soil total carbon and nitrogen contents both increased notably at high elevations (Table 1), suggesting enhanced organic-matter accumulation under cooler conditions[23]. Overall, the responses of soil edaphic properties to elevational climatic gradients in forest soils were largely comparable to those observed in grasslands, except for the relatively low soil WFPS in the high-elevation spruce forests. The statistical analysis shows that high-elevation samples are clearly separated from low-elevation ones, indicating distinct regulatory mechanisms between the two groups. In these spruce soils (F5 and F6 sites), the extremely low N2O fluxes compared with the grassland soils from similar elevations may not be explained by the high inorganic N contents (Fig. 3f), but rather attributed to the dry soil condition. Spruce forests are a dominant forest type in the medium and high elevation zones of Xinjiang Arid Zone, usually inhabiting sloping terrains with limited water availability[52]. Under the special geotopographical conditions, spruce forests in this region are commonly susceptible to drought[53]. Therefore, inorganic N compounds accumulated due to limited leaching but were not utilized in N cycling processes, including denitrification.
The PCA result (Fig. 6b) shows that PC1 clearly separates high-elevation forest soils from low-elevation soils, indicating a shift in the dominant regulatory mechanisms along the elevation gradient. This separation suggests that temperature-associated factors, rather than moisture or nutrient availability, play a central role in driving differences in forest N2O emissions. This temperature-centric control is further supported by regression and random forest analyses, which together indicate a significant positive relationship between soil temperature and forest N2O fluxes and consistently identify soil temperature as a dominant predictor. In contrast, WFPS exerts only a weak and statistically non-significant influence and ranks low in importance. The difference in N2O emissions between forest and grassland soils may reflect distinct microbial regulatory mechanisms. Compared with the grassland from the high elevation (G5), soil WFPS in the relatively steep forest floors[54] was generally low (29.82% to 44.12%) and might not support the anaerobic denitrification process[55]. More importantly, denitrifying functional gene abundances (mainly nirK and nirS) significantly decreased from low to high elevations (Fig. 5d), whereas amoA gene abundances (AOA and AOB; Fig. 5b) showed little difference. This pattern suggests that the potential size of the denitrifying community decreased with elevation, despite the increase in soil WFPS from 29.82% to 46.25%. Recent research has consistently highlighted the strong temperature sensitivity of denitrifying microbial communities in forest soils. While short-term N2O pulses in forest soils are triggered by nitrogen inputs, annual cumulative emissions are primarily controlled by temperature-driven shifts in denitrifier community composition rather than by substrate availability[56]. Similarly, Buckeridge et al. observed that both nirK and nirS responded markedly to short and long-term warming, leading to pronounced changes in potential N2O production rates[57]. At the global scale, Yu et al. demonstrated that mean annual temperature, rather than precipitation, was the best predictor of forest soil N2O emissions, in contrast to the moisture-dominated regulation observed in grassland ecosystems[58]. Together, these studies indicate that denitrification processes in forest soils are more thermally constrained, with enzymatic reduction reactions exhibiting stronger temperature dependence than those in moisture-limited grasslands. This helps explain the sharper decline in N2O fluxes with cooling observed in the high elevation forests of the Tianshan Mountains.
-
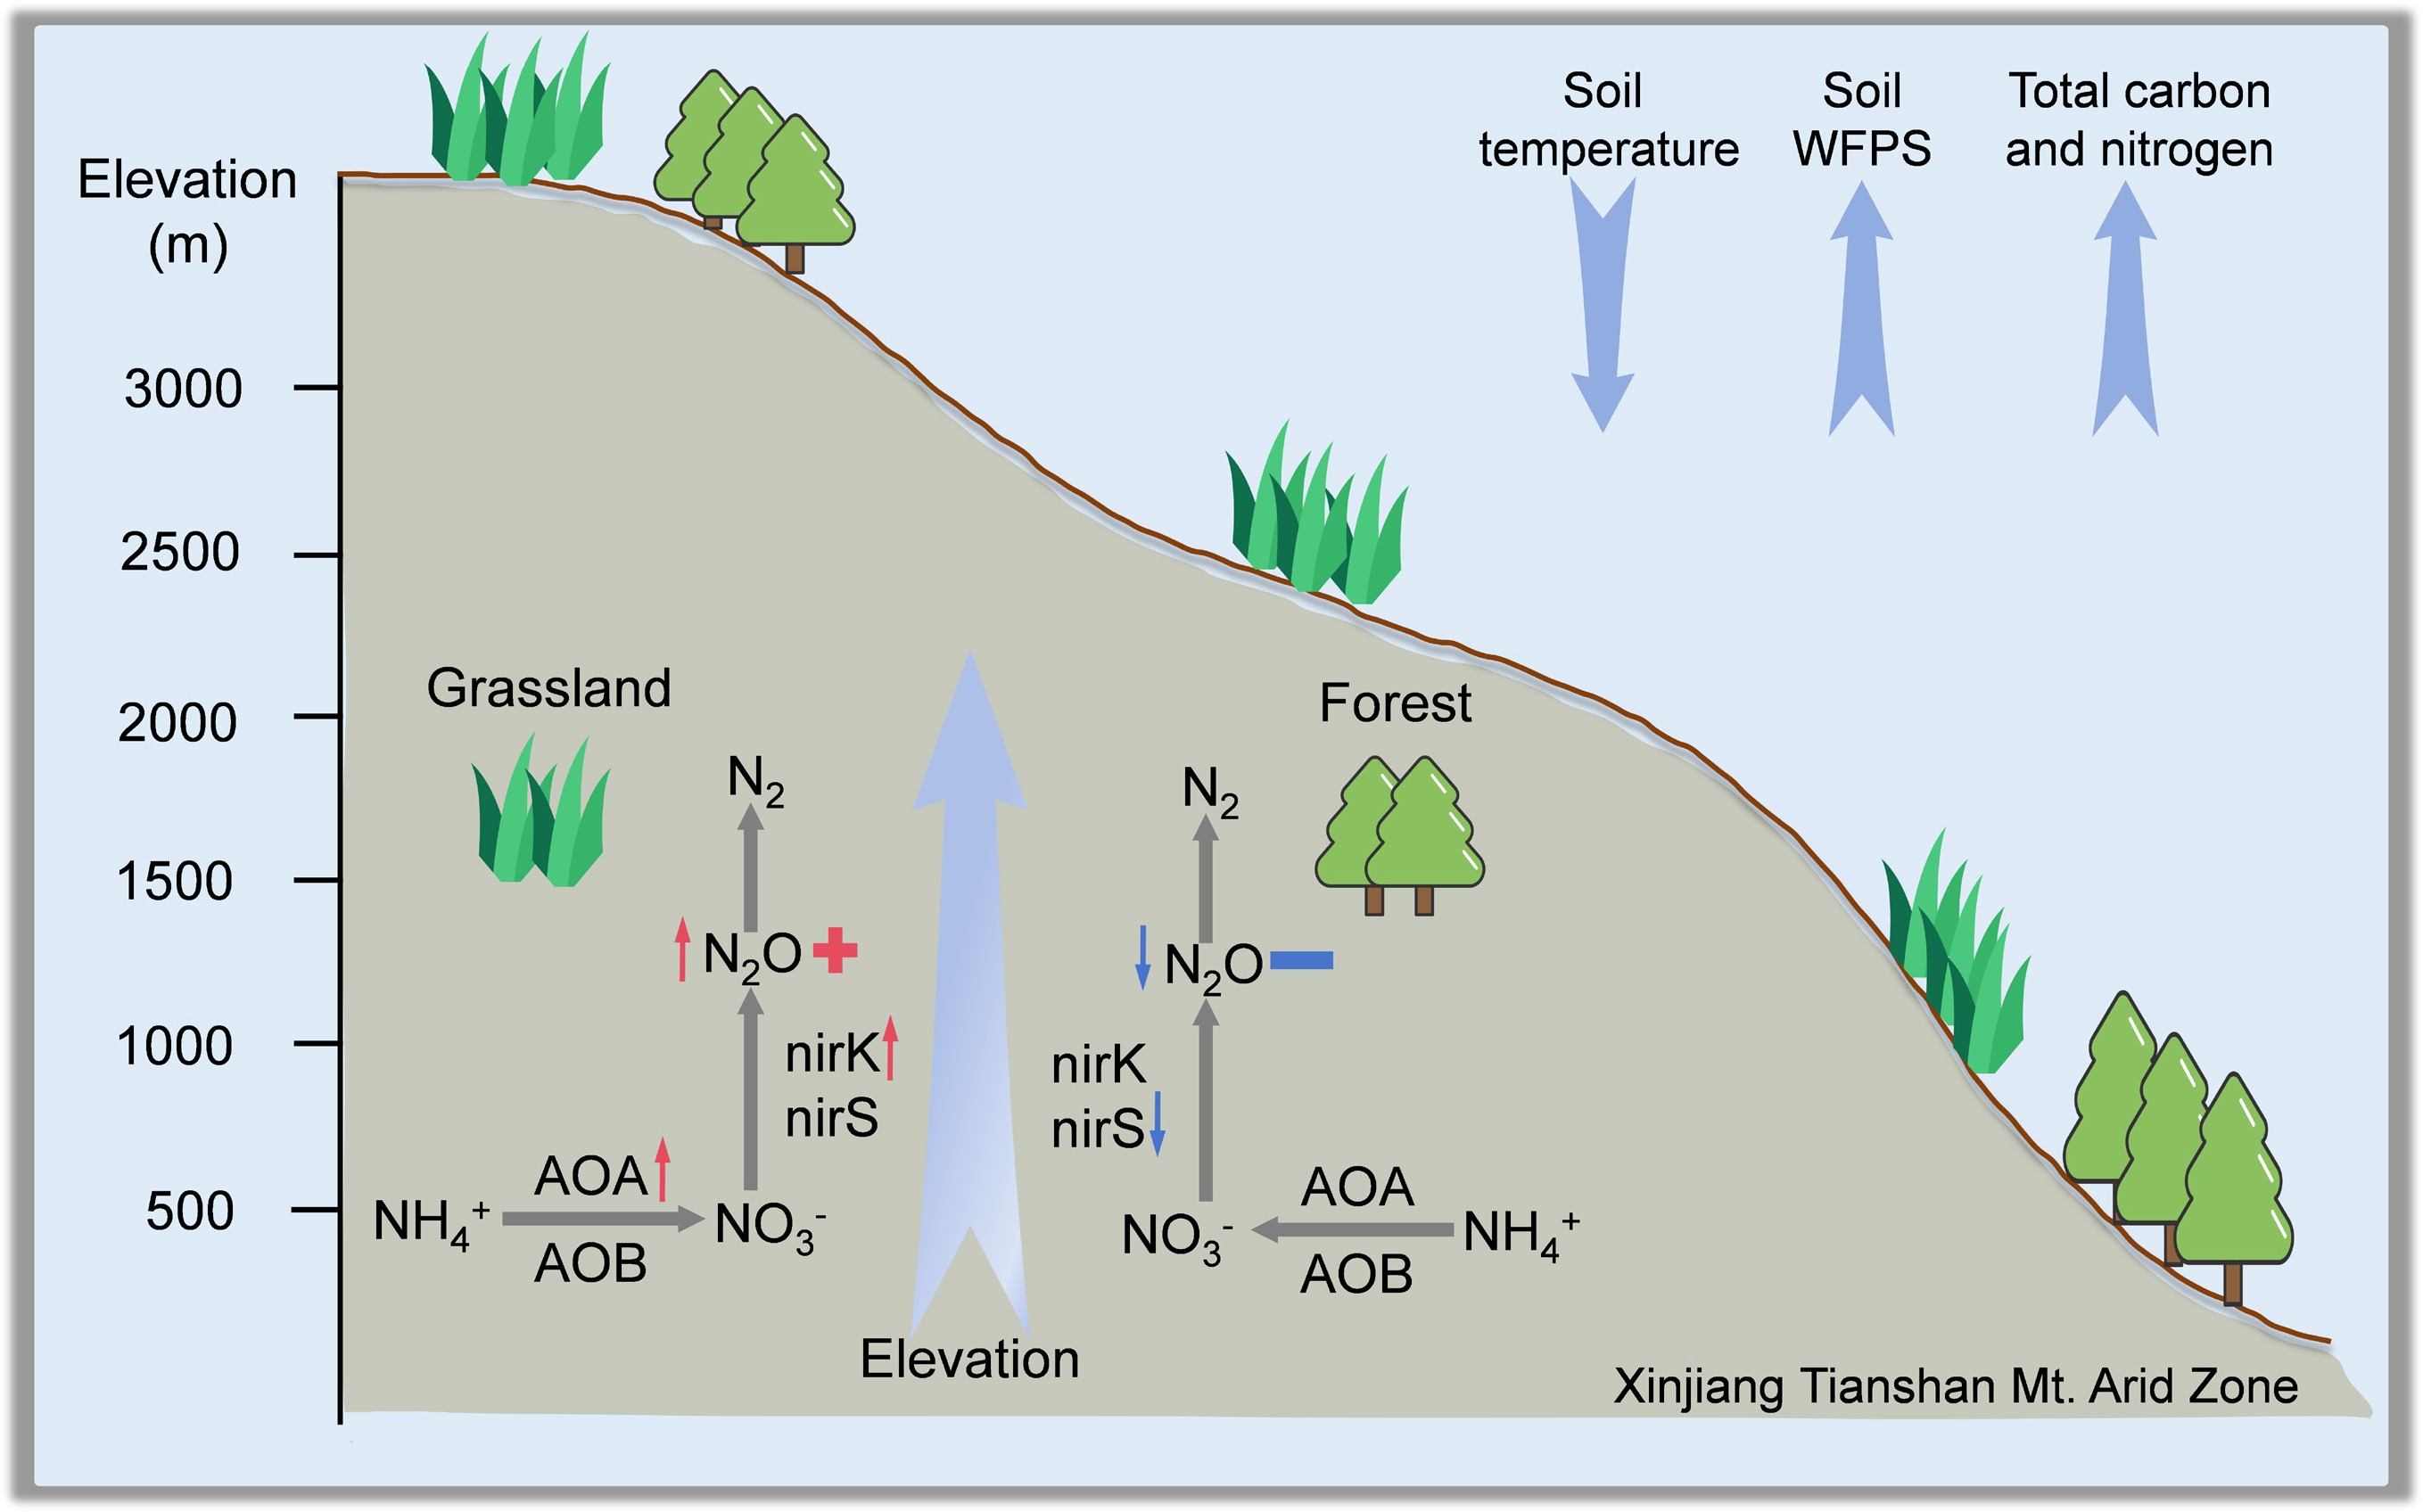
Field observational campaign demonstrated that vegetation type and elevation jointly control natural-soil derived N2O emissions in the arid zone of Xinjiang, northwestern China. Along the elevation gradient from 541 to 2,901 m, N2O emissions from grassland soils increased significantly to 11.09 µg N m−2 h−1, driven by rising soil moisture and incomplete denitrification under relatively low pH. By contrast, the N2O emission from forest soils was most pronounced at the low-elevation sites, likely favoring nitrification or even abiotic production of N2O under warm and dry conditions. The microbial organisms in grassland and forest soils responded differently to the climatic drivers with increasing elevation, providing key explanations for the different contributions of N2O emissions from soils under various vegetation types. The analysis of N2O emissions along an elevation gradient provides an important basis for predicting N2O emissions from natural soils under projected climate change in northern China (warmer and wetter conditions), highlighting that grassland N2O emissions could be a potential hotspot in future scenarios.
Nevertheless, N2O contributions from natural soils in the Xinjiang Arid Zone are generally much smaller than those from managed cropland systems, as revealed by regional measurements across low elevations. These strong emissions were primarily linked to a coupled effect of irrigation and fertilization during dry-wet transitions in the region. The relatively significant contribution of soil N2O emissions from planted forests (10.96 µg N m−2 h−1) in the study also provides an important warning about the further broadening of desert oases for human habitation, as greenhouse gas emissions from land-use change should not be overlooked. While these findings provide valuable insights into the spatial patterns of N2O emissions in arid ecosystems, the flux measurements were derived from a single field campaign, which may introduce limited temporal uncertainty. Incorporating synchronized or multi-period measurements in subsequent research would improve constraints on short-term and seasonal N2O dynamics. Moreover, advancing toward a more integrated assessment of soil N cycling under both climatic and anthropogenic influences remains an important direction for future investigation.
-
It accompanies this paper at: https://doi.org/10.48130/nc-0025-0022.
-
Not applicable.
-
The authors confirm contributions to the paper as follows: Zhixi Wu: field sampling and sample analysis, analysis and interpretation of results, manuscript writing and revising; Lifang Wu: field sampling and sample analysis, manuscript writing and revising; Dingxi Chen: field sampling and sample analysis; Zetong Niu: analysis and interpretation of results; Tonghui Yang: analysis and interpretation of results; Hong Mao: manuscript writing and revising; Muhammad Junaid Nazir: manuscript writing and revising; Longfei Yu: study design, manuscript writing and revising, supervision and funding acquisition. All authors reviewed the results and approved the final version of the manuscript.
-
The observational data from this study is available upon request from the corresponding author.
-
This work was financially supported by the National Natural Science Foundation of China (NSFC Grant No. 42577331), and the Guangdong Basic and Applied Basic Research Foundation (Grant No. 2025B1515020013). Longfei Yu acknowledges support from the Scientific Research Start-up Funds (Grant No. QD2022010C) from Tsinghua Shenzhen International Graduate School, and the Tianchi Talent Programme of Xinjiang Uygur Autonomous Region.
-
The authors declare that they have no conflict of interest.
-
Full list of author information is available at the end of the article.
- The supplementary files can be downloaded from here.
- Copyright: © 2026 by the author(s). Published by Maximum Academic Press, Fayetteville, GA. This article is an open access article distributed under Creative Commons Attribution License (CC BY 4.0), visit https://creativecommons.org/licenses/by/4.0/.
-
About this article
Cite this article
Wu Z, Wu L, Chen D, Niu Z, Yang T, et al. 2026. Soil N2O emission along an elevation gradient in the arid zone of Xinjiang, Northwestern China. Nitrogen Cycling 2: e010 doi: 10.48130/nc-0025-0022 

Soil N2O emission along an elevation gradient in the arid zone of Xinjiang, Northwestern China
- Received: 09 November 2025
- Revised: 18 December 2025
- Accepted: 25 December 2025
- Published online: 23 January 2026
Abstract: Nitrous oxide (N2O) is a potent greenhouse gas, yet its in situ emission strengths and driving mechanisms across elevation gradients and land-use types in arid ecosystems remain poorly constrained. In the arid zone of northwestern China (NW China), recent climate change has led to warmer and wetter soil conditions, likely driving shifts in N2O emissions. Hence, a field campaign was conducted around the Xinjiang Tianshan Mountains in summer 2023, to constrain N2O emission and its driving factors along an elevation gradient of 313−2,901 m. The studied sites covered soils under different vegetation types, including forest, grassland, cropland, and bareland. Across the four ecosystem types, N2O emissions differed markedly, with croplands showing the highest fluxes (mean 181.32 μg N m−2 h−1), followed by forests (4.66 μg N m−2 h−1) and grasslands (2.69 μg N m−2 h−1), whereas barelands contributed only negligible emissions. Results suggested that forest soils at low elevation were the main contributors of N2O emissions (up to 10.96 μg N m−2 h−1) among natural vegetation. As for the grassland soils, N2O emissions were significantly enhanced with increasing soil moisture along elevation, reaching 11.09 μg N m−2 h−1 at 2,901 m. Edaphic factors and functional gene abundances suggested that, despite the accumulation of soil carbon and nitrogen nutrients at higher elevation, soil N2O emission was mainly associated with the potential contributions of N-cycling microbial communities; both nitrifiers (ammonia-oxidizing archaea) and denitrifiers that responded strongly to the rise in soil moisture likely contributed to N2O emission in grassland soils, whereas the temperature decline with elevation may have constrained the denitrifier community in forest soils. Overall, the study of N2O emissions along the elevation gradient provides a natural proxy for predicting N2O emissions under climate change. Warmer and wetter climatic conditions in this arid region could transform alpine grassland soils into a significant source of N2O. At the regional scale, assessing the role of arid ecosystems in climate change feedbacks requires integrated analysis of both anthropogenic management practices and climate sensitivity.
-
Key words:
- Soil N2O emission /
- Elevation gradient /
- Arid ecosystem /
- Forest /
- Grassland