-
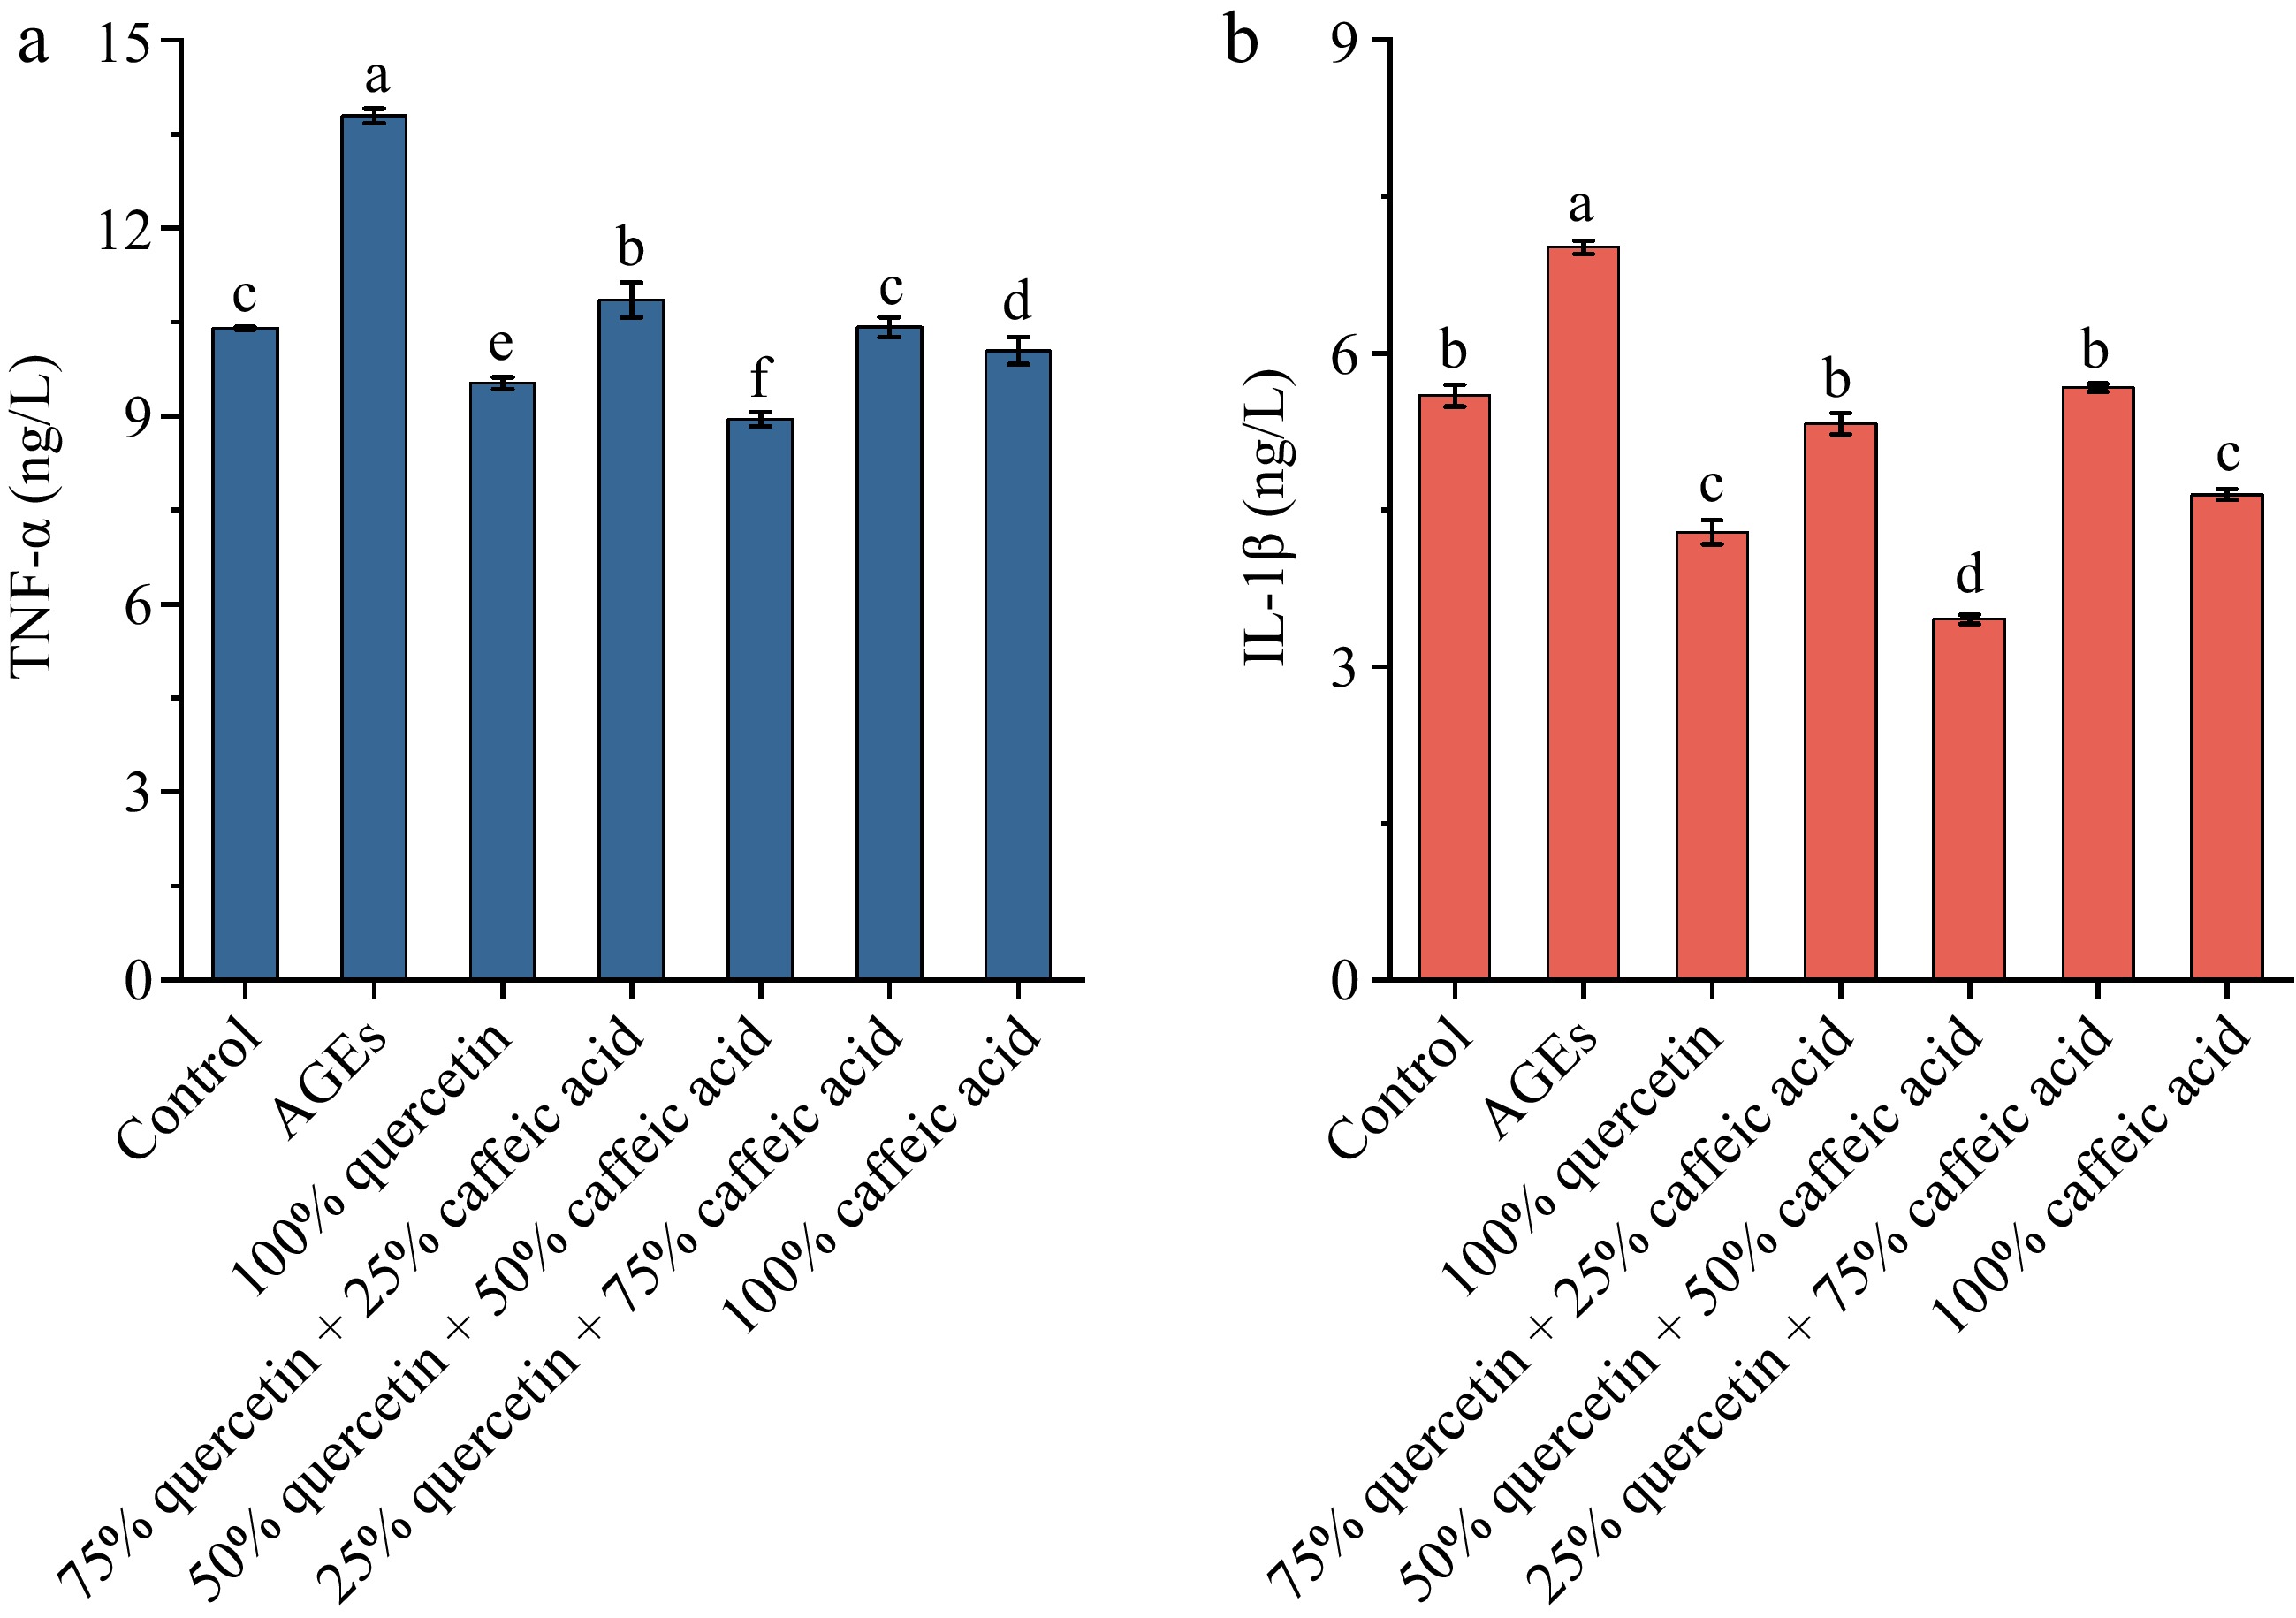
Figure 1.
The effect of different ratios of quercetin and caffeic acid on the expression of inflammatory factors (a) TNF-α, and (b) IL-1β. Different letters above bars indicate statistically significant differences between groups (p < 0.05).
-
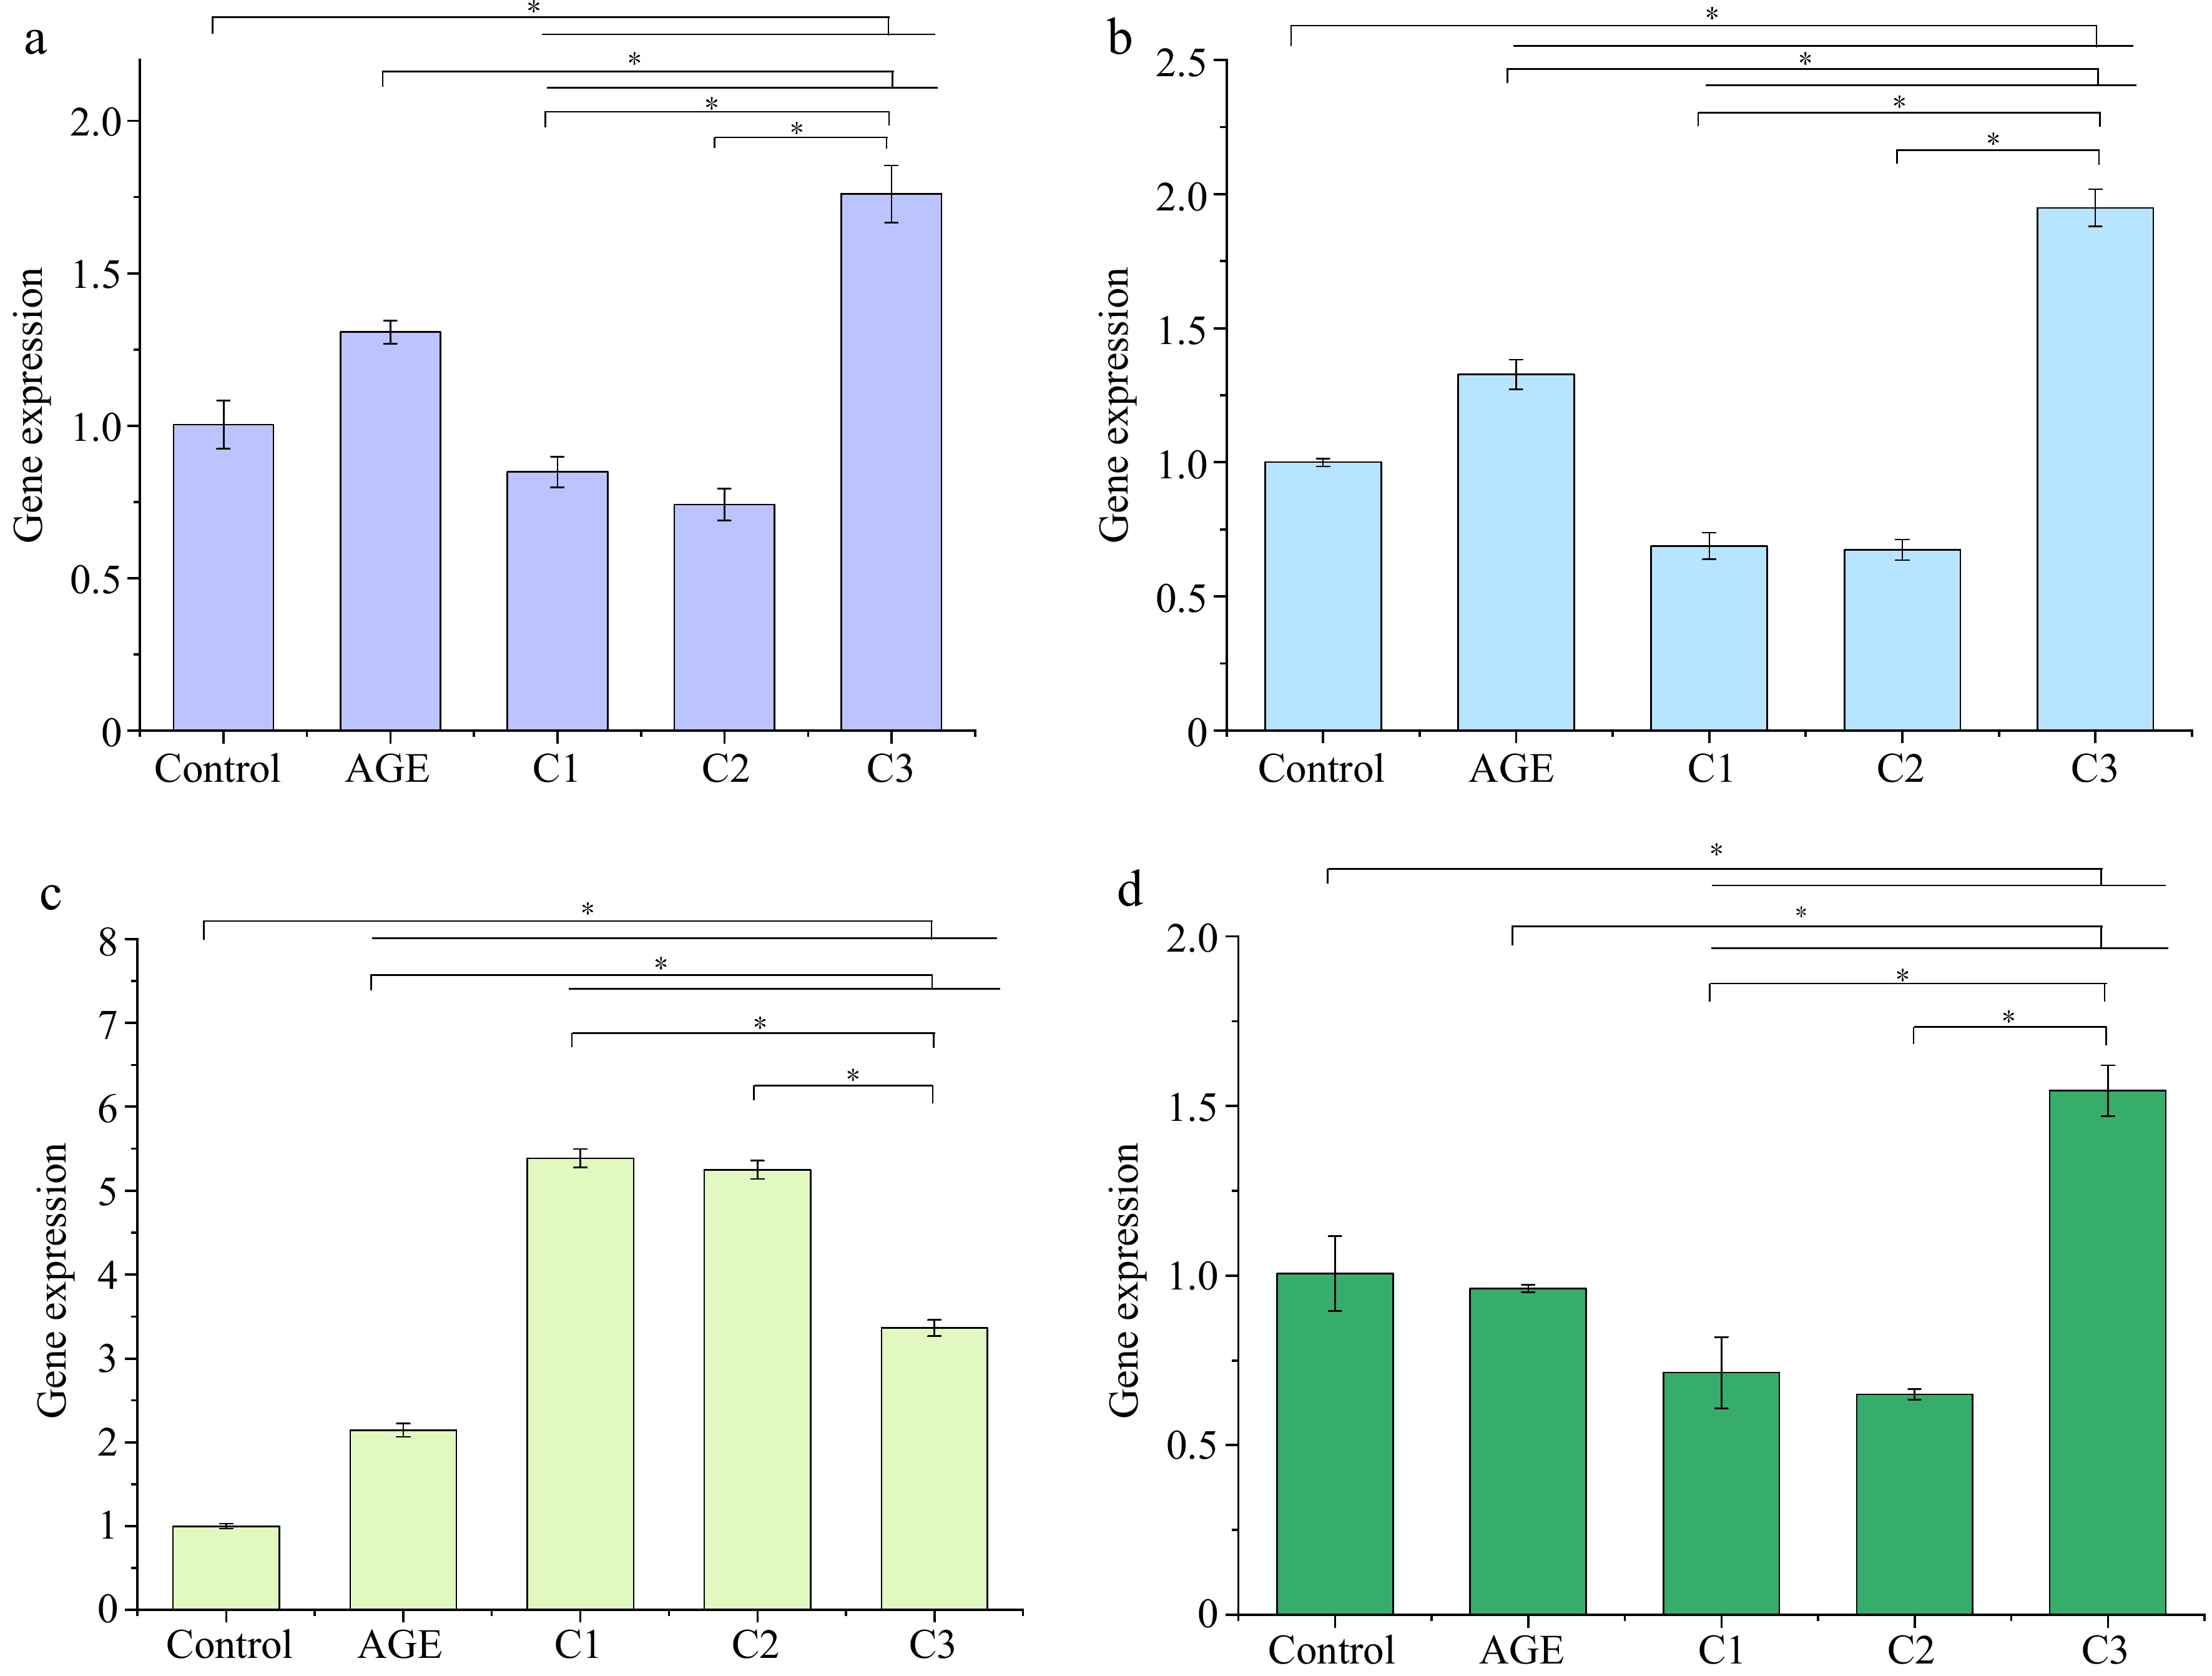
Figure 2.
Effects of different ratios of polyphenols on the gene expression of (a) ICAM1, (b) IL1B, (c) CXCL8, and (d) THBD. Gene expression was assessed by qPCR. * p < 0.05 indicates significant differences between groups. Control is the untreated control group, AGE refers to the group treated with AGEs, C1 represents the group treated with 100% quercetin, C2 represents the group treated with 50% quercetin + 50% caffeic acid, and C3 represents the group treated with 100% caffeic acid.
-
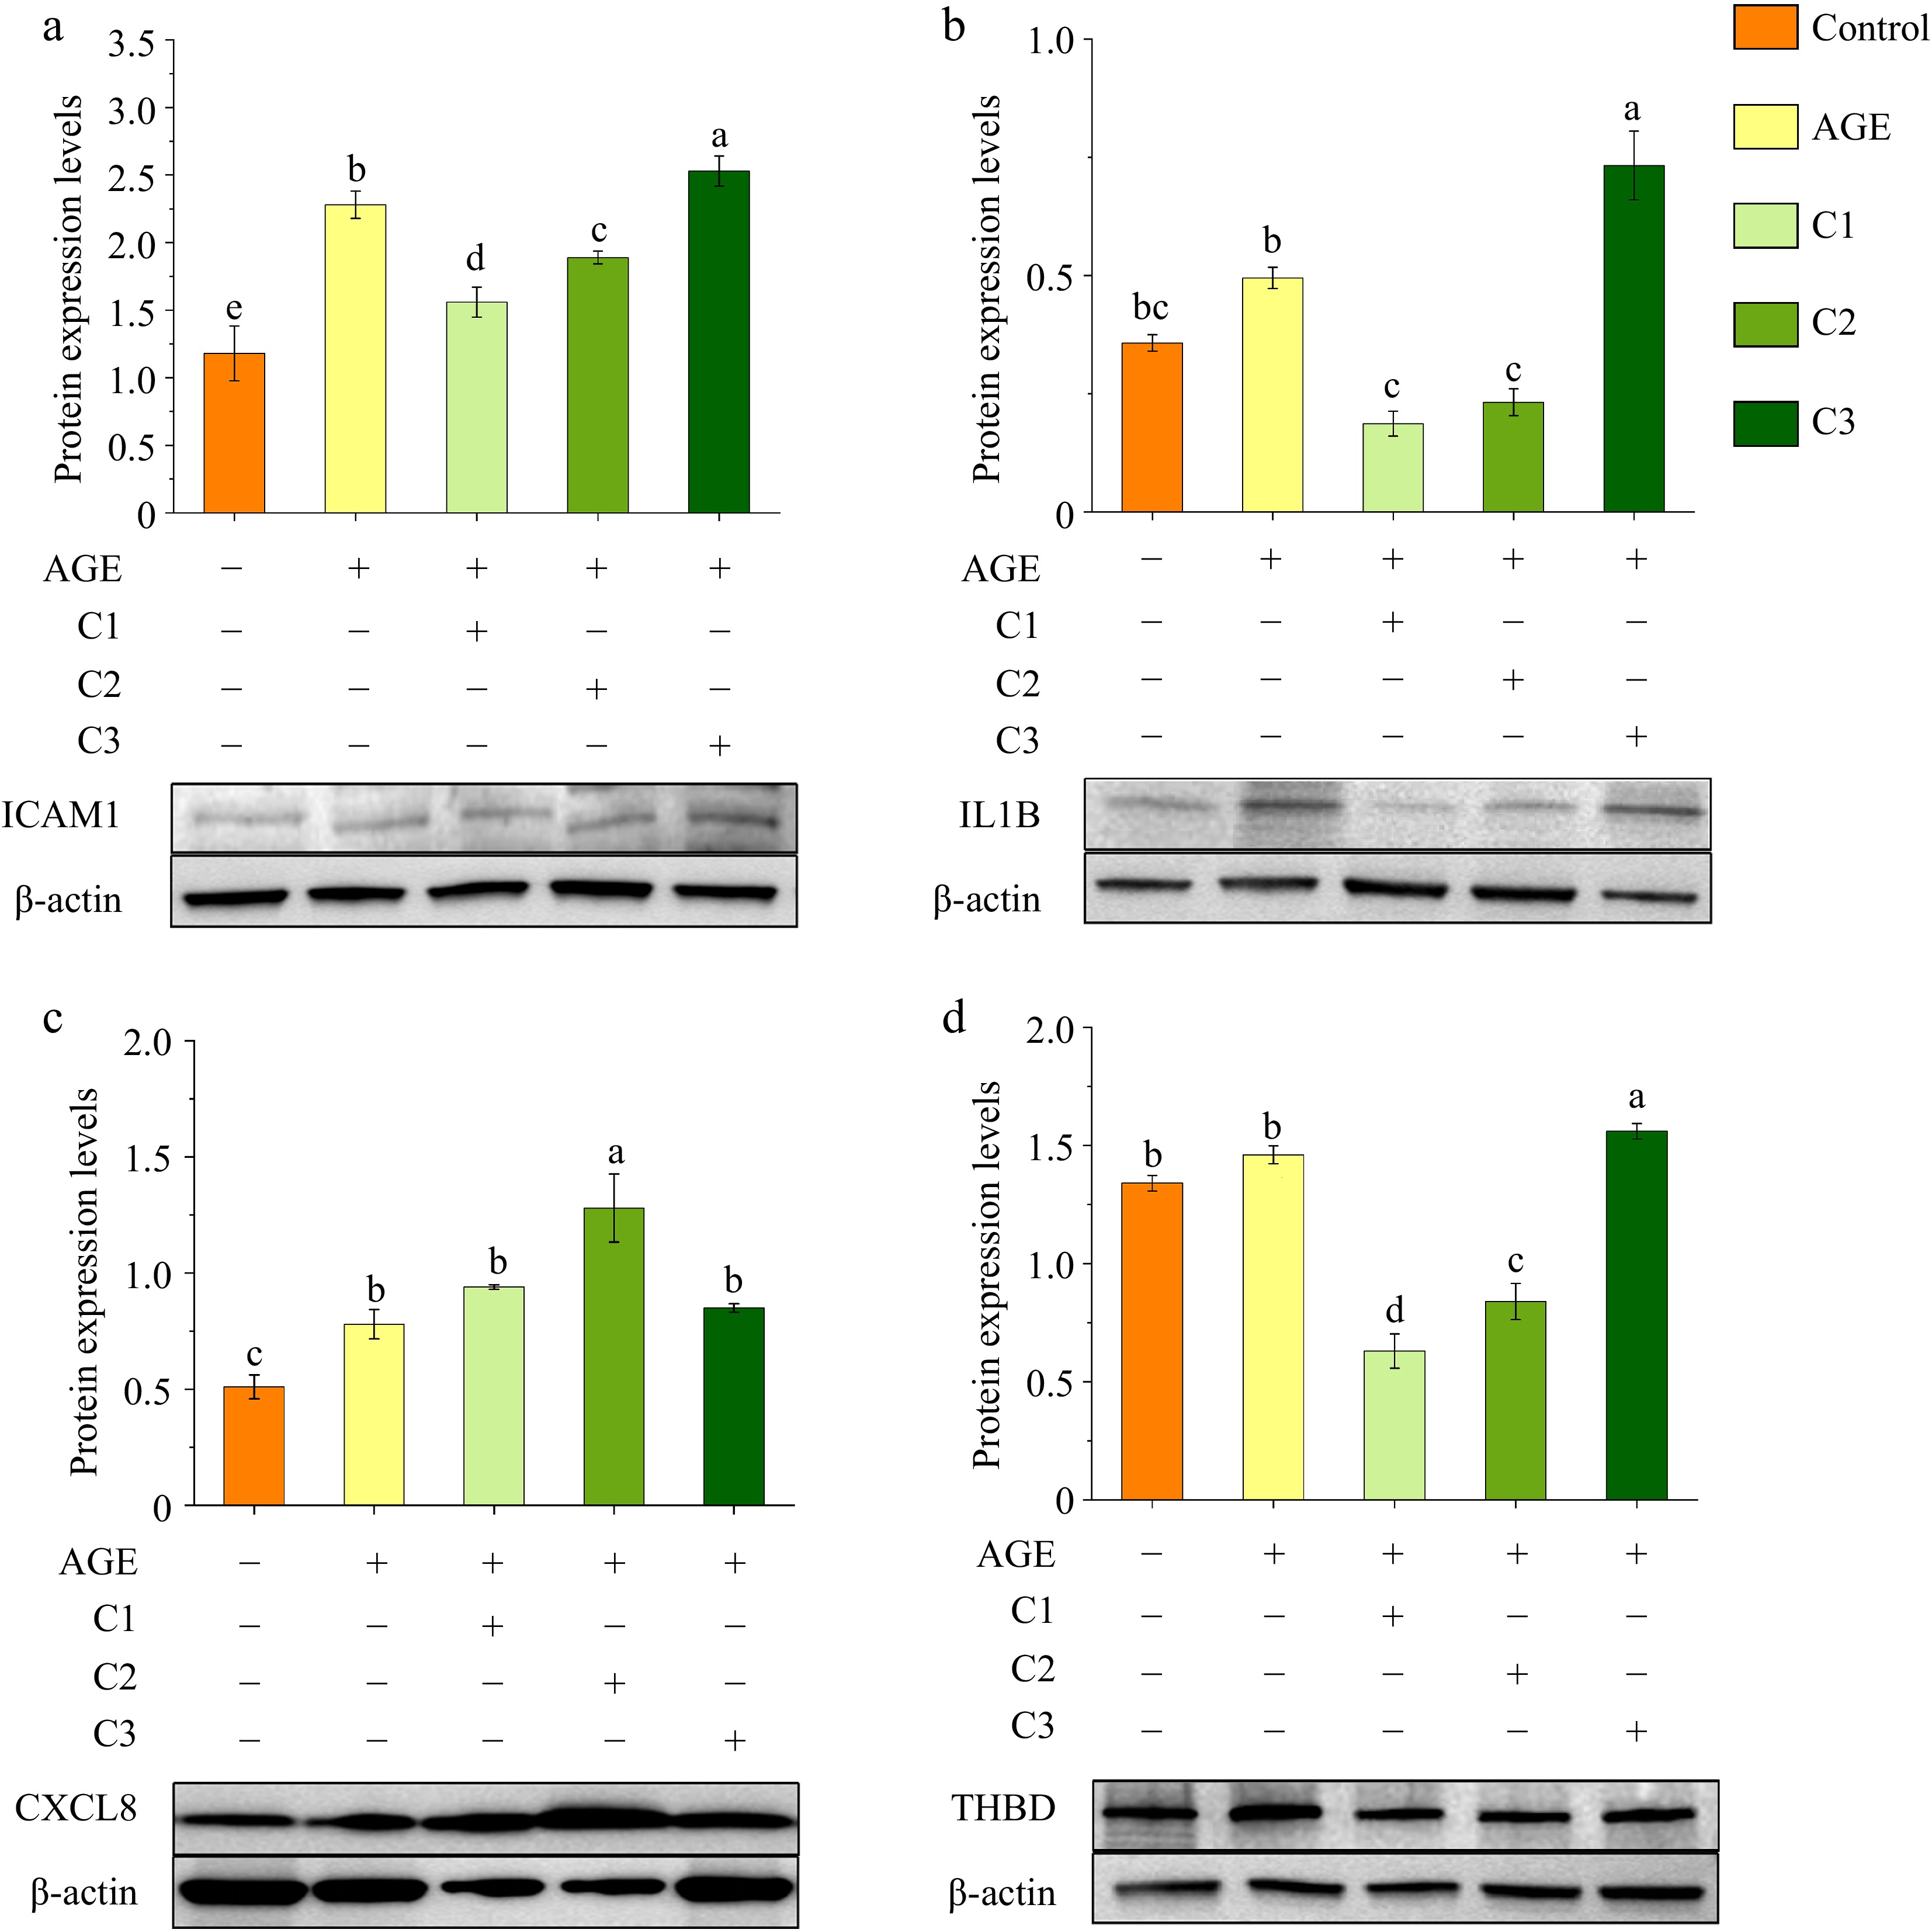
Figure 3.
Effects of different ratios of polyphenols on the protein expression of (a) ICAM1, (b) IL1B, (c) CXCL8, and (d) THBD. Protein expression levels were analyzed by Western blotting, with β-actin used as a loading control. Different letters above bars indicate statistically significant differences (p < 0.05). Control is the untreated control group, AGE refers to the group treated with AGEs, C1 represents the group treated with 100% quercetin, C2 represents the group treated with 50% quercetin + 50% caffeic acid, and C3 represents the group treated with 100% caffeic acid.
-
No. Component Inflammation target UniProt ID AGE-RAGE pathway 1 Tyranton Prostaglandin G_H synthase 1 COX1 No 2 Tyranton Ornithine carbamoyltransferase, mitochondrial OTC No 3 Caffeic acid Beta-2 adrenergic receptor ADRB2 No 4 Caffeic acid Tumor necrosis factor TNF Yes 5 Luteolin-7-o-glucoside Nitric oxide synthase, inducible NOS2 No 6 Methyl 5-hydroxyphenylacetate Thrombin F2 No 7 Palmitic acid Interleukin-10 IL10 No 8 Palmitic acid Phosphatidylinositol-3,4,5-trisphosphate 3-phosphatase and dual-specificity protein phosphatase PTEN PTEN No 9 Quercetin Phosphatidylinositol-4,5-bisphosphate 3-kinase catalytic subunit, gamma isoform PIK3CG No 10 Quercetin Interleukin-6 IL6 Yes 11 Quercetin Heme oxygenase 1 HMOX1 No 12 Quercetin Tissue factor F3 Yes 13 Quercetin Intercellular adhesion molecule 1 ICAM1 Yes 14 Quercetin Interleukin-1 beta IL1B Yes 15 Quercetin C-C motif chemokine 2 CCL2 Yes 16 Quercetin E-selectin SELE Yes 17 Quercetin Interleukin-8 CXCL8 Yes 18 Quercetin Thrombomodulin THBD Yes 19 Quercetin Plasminogen activator inhibitor 1 SERPINE1 Yes 20 Quercetin Interferon gamma IFNG No 21 Quercetin Interleukin-1 alpha IL1A Yes 22 Quercetin Nuclear factor erythroid 2-related factor 2 NFE2L2 No 23 Quercetin Nuclear receptor subfamily 1 group I member 3 NR1I3 No 24 Quercetin C-reactive protein CRP No 25 Quercetin Osteopontin SPP1 No 26 Beta-sitosterol Glucocorticoid receptor NR3C1 No 27 Rutin C5a anaphylatoxin chemotactic receptor C5AR1 No 28 Rutin C5a anaphylatoxin chemotactic receptor C5AR2 No 29 Rutin Integrin beta-2 ITGB2 No Note: The AGE-RAGE pathway column indicates whether the inflammatory target is involved in the AGE-RAGE signaling pathway (Yes = involved, No = not involved). Table 1.
Dandelion active component-inflammatory target-gene information and AGE-RAGE pathway enrichment of target-effective fraction.
-
Gene ID Gene Name Control vs AGE AGE vs C1 AGE vs C2 AGE vs C3 C1 vs C2 C1 vs C3 C2 vs C3 ENSG00000117525 F3 Nodiff Downregulation Downregulation Nodiff Nodiff Upregulation Upregulation ENSG00000090339 ICAM1 Nodiff Downregulation Downregulation Upregulation Nodiff Upregulation Upregulation ENSG00000115008 IL1A Upregulation Downregulation Downregulation Upregulation Nodiff Upregulation Upregulation ENSG00000125538 IL1B Upregulation Downregulation Downregulation Upregulation Nodiff Upregulation Upregulation ENSG00000136244 IL6 − − Nodiff Nodiff Nodiff Nodiff Nodiff ENSG00000169429 CXCL8 Upregulation Upregulation Upregulation Upregulation Nodiff Downregulation Downregulation ENSG00000106366 SERPINE1 Nodiff Downregulation Downregulation Nodiff Downregulation Upregulation Upregulation ENSG00000108691 CCL2 Nodiff Downregulation Downregulation Upregulation Nodiff Upregulation Upregulation ENSG00000007908 SELE − Nodiff Upregulation Nodiff Nodiff Nodiff Downregulation ENSG00000178726 THBD Nodiff Downregulation Downregulation Upregulation Nodiff Upregulation Upregulation ENSG00000232810 TNF Upregulation Nodiff Nodiff Upregulation Nodiff Upregulation Upregulation Control is the untreated control group, AGE refers to the group treated with AGEs, C1 represents the group treated with 100% quercetin, C2 represents the group treated with 50% quercetin + 50% caffeic acid, and C3 represents the group treated with 100% caffeic acid. Table 2.
Differential expression trends of target genes in the AGE-RAGE pathway.
-
Protein Protein name Gene name AGE/
controlp
valueC1/AGE p
valueC2/AGE p
valueC3/AGE p
valueC2/C1 p
valueC3/C1 p
valueC3/C2 p
valueENSP00000264832 Intercellular adhesion
molecule 1ICAM1 1.07 0.3359 0.76 0.0036 0.84 0.0164 1.31 0.0024 1.11 0.0240 1.71 0.0001 1.54 0.0002 ENSP00000263341 Interleukin 1 beta IL1B 1.18 0.5024 0.34 0.0293 0.43 0.0493 1.46 0.0881 1.28 0.0987 4.28 0.0001 3.33 0.0002 ENSP00000385908 C-X-C motif chemokine
ligand 8CXCL8 1.25 0.4547 5.59 0.0007 6.24 0.0007 1.71 0.0735 1.11 0.3910 0.30 0.0013 0.27 0.0012 ENSP00000366307 Thrombomodulin THBD 0.83 0.0762 0.71 0.0041 0.73 0.0126 1.13 0.2486 1.02 0.7265 1.57 0.0105 1.53 0.0162 Control is the untreated control group, AGE refers to the group treated with AGEs, C1 represents the group treated with 100% quercetin, C2 represents the group treated with 50% quercetin + 50% caffeic acid, and C3 represents the group treated with 100% caffeic acid. Table 3.
Differential expression of target proteins in the AGE-RAGE pathway.
-
Control vs AGE Transcriptomics Proteomics AGE/control p value IL1B Upregulation IL1B 1.18 0.502 CXCL8 Upregulation CXCL8 1.25 0.455 AGE vs C1 Transcriptomics Proteomics C1/AGE p value ICAM1 Downregulation ICAM1 0.76 0.004 IL1B Downregulation IL1B 0.34 0.029 CXCL8 Upregulation CXCL8 5.59 0.001 THBD Downregulation THBD 0.72 0.004 AGE vs C2 Transcriptomics Proteomics C2/AGE p value ICAM1 Downregulation ICAM1 0.85 0.016 IL1B Downregulation IL1B 0.44 0.049 CXCL8 Upregulation CXCL8 6.24 0.001 THBD Downregulation THBD 0.73 0.013 AGE vs C3 Transcriptomics Proteomics C3/AGE p value ICAM1 Upregulation ICAM1 1.31 0.002 IL1B Upregulation IL1B 1.46 0.088 CXCL8 Upregulation CXCL8 1.71 0.074 THBD Upregulation THBD 1.13 0.249 C1 vs C3 Transcriptome Proteomics C3/C1 p value ICAM1 Upregulation ICAM1 1.71 0.000 IL1B Upregulation IL1B 4.28 0.000 CXCL8 Downregulation CXCL8 0.30 0.001 THBD Upregulation THBD 1.57 0.011 C2 vsC3 Transcriptomics Proteomics C3/C2 p value ICAM1 Upregulation ICAM1 1.54 0.000 IL1B Upregulation IL1B 3.33 0.000 CXCL8 Downregulation CXCL8 0.27 0.001 THBD Upregulation THBD 1.53 0.016 Control is the untreated control group, AGE refers to the group treated with AGEs, C1 represents the group treated with 100% quercetin, C2 represents the group treated with 50% quercetin + 50% caffeic acid, and C3 represents the group treated with 100% caffeic acid. Table 4.
Omics joint analysis of the differential expression of targets in the AGE-RAGE pathway.
Figures
(3)
Tables
(4)