-
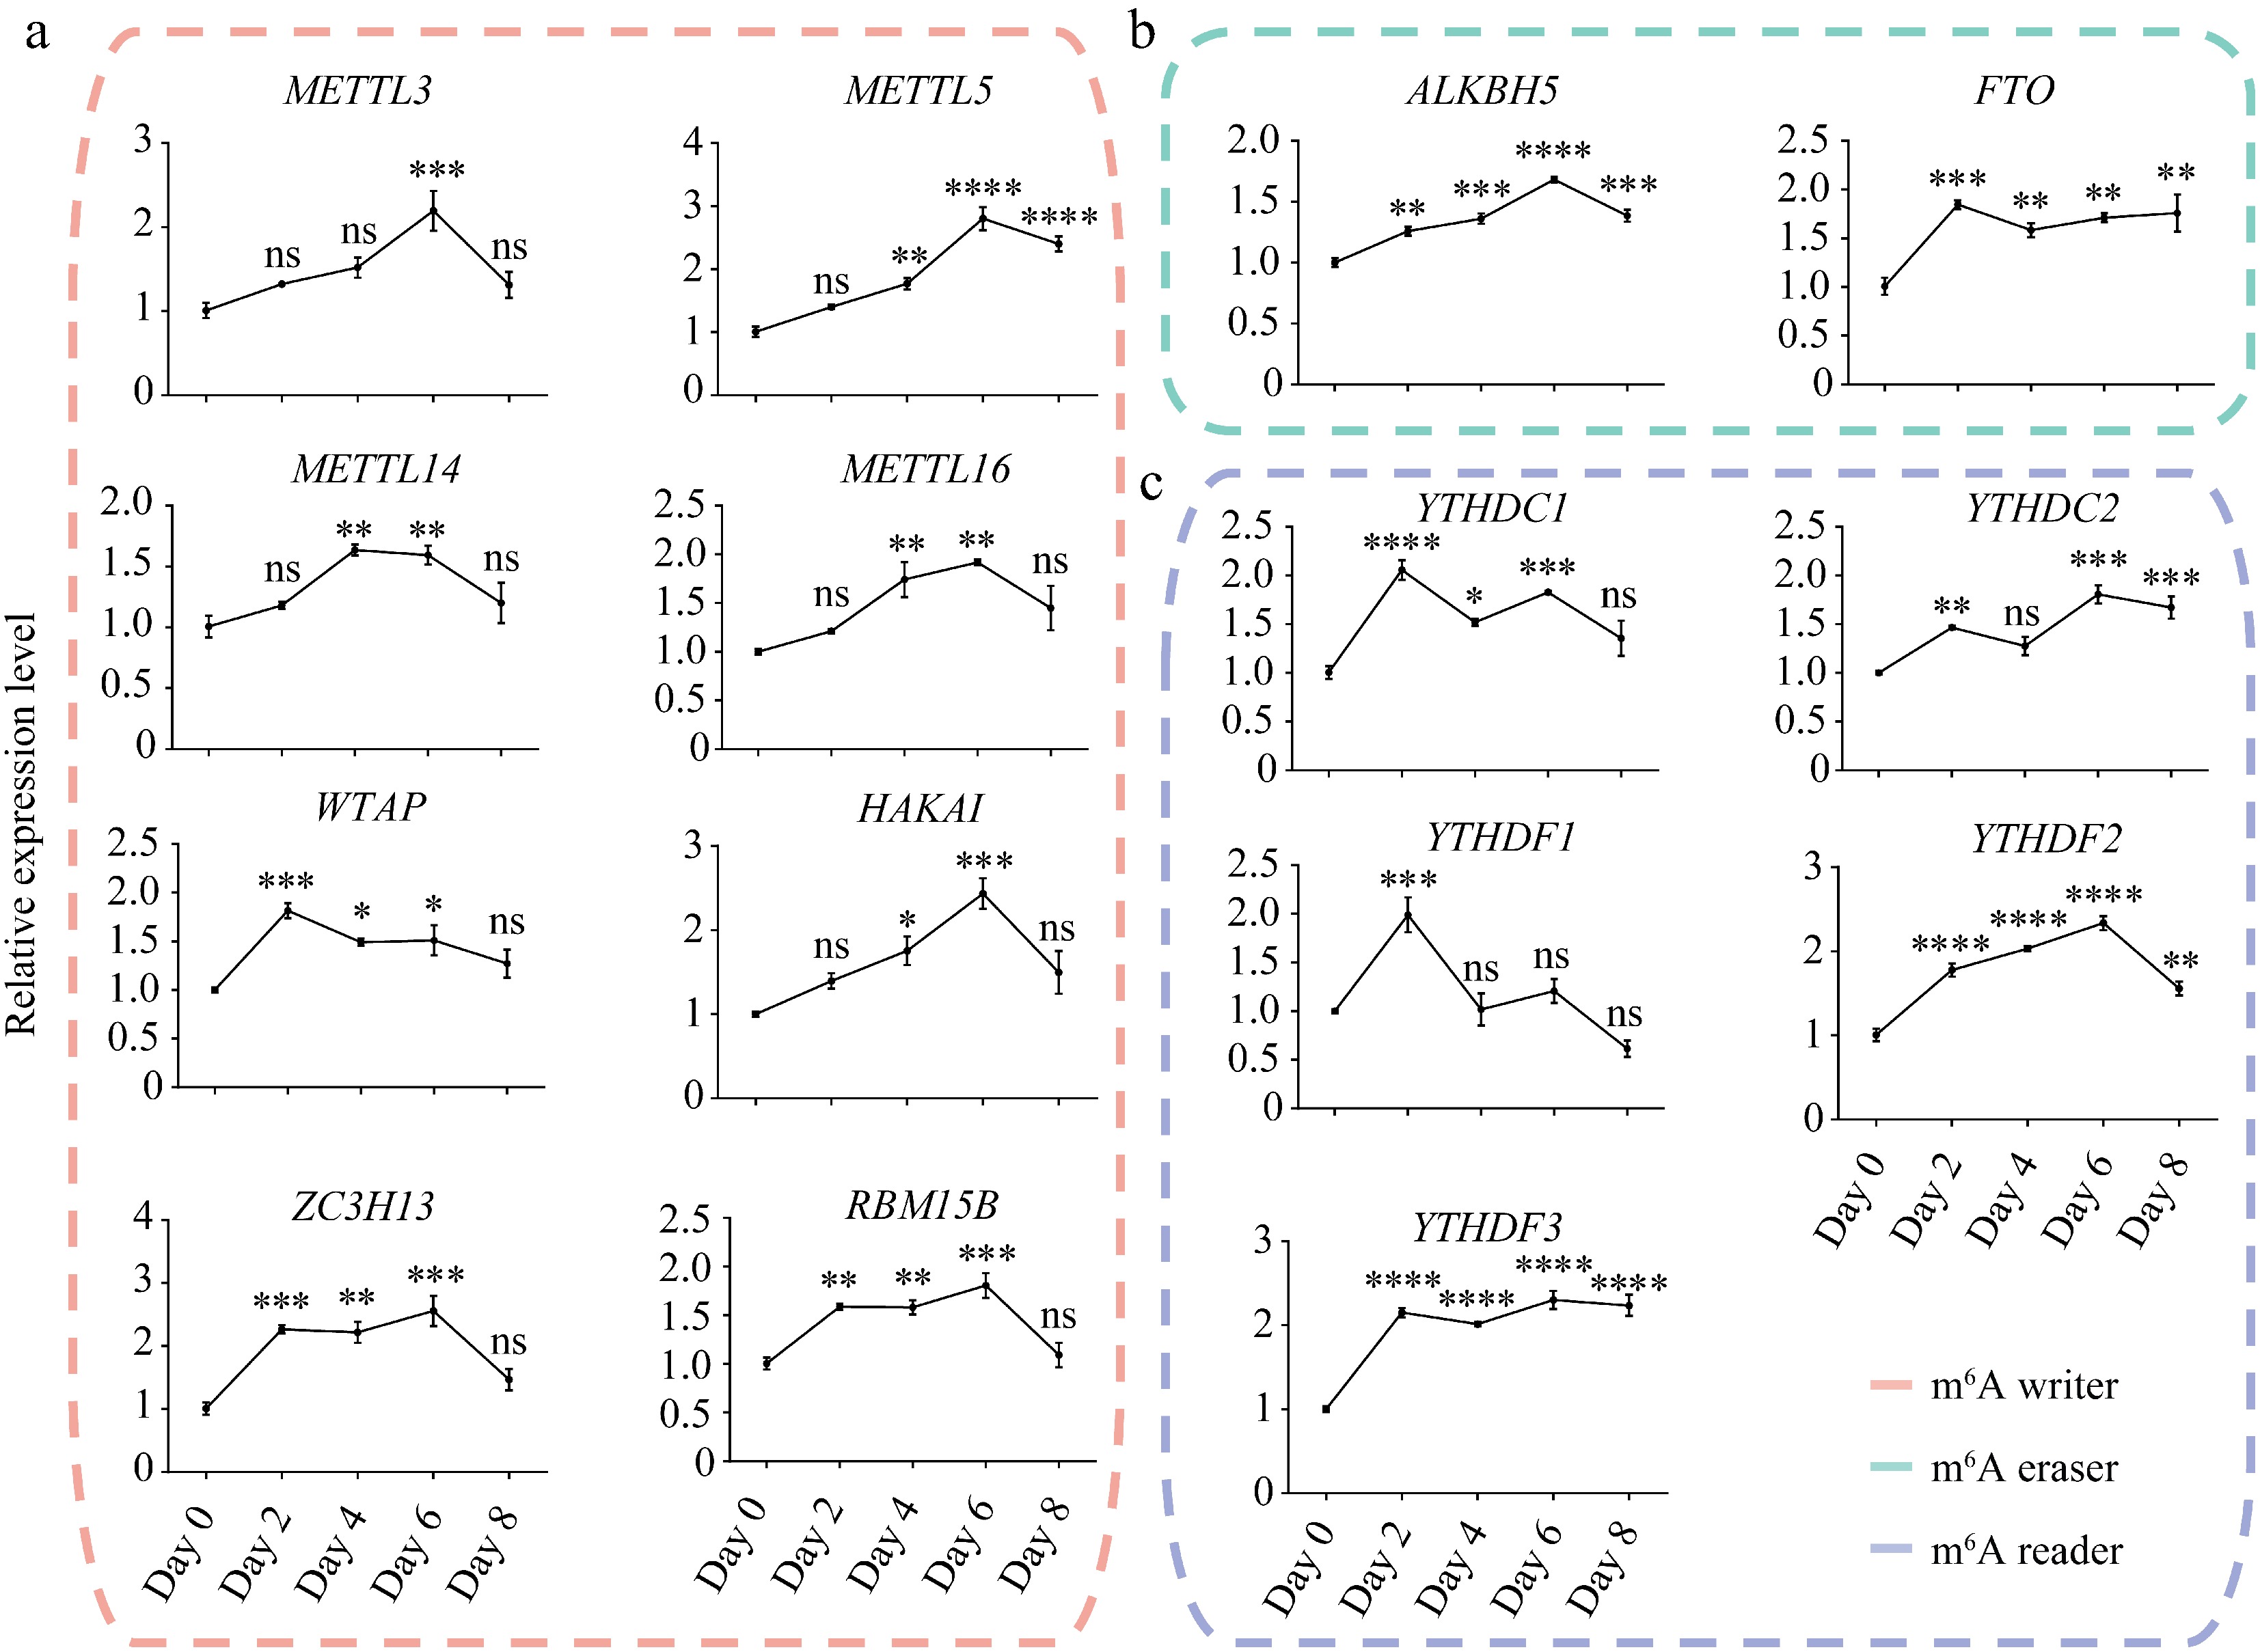
Figure 1.
Expression dynamics of m6A writers, erasers, and readers during porcine adipocyte differentiation. Relative mRNA expression levels of m6A (a) writers, (b) erasers, and (c) readers during SVF adipogenesis. 18S rRNA was used as the internal reference gene. Data are presented as mean ± s.d (n = 3). Statistical significance was determined by ANOVA with a post-hoc test. * p < 0.05; ** p < 0.01; *** p < 0.001; **** p < 0.0001; ns, not significant (p ≥ 0.05).
-
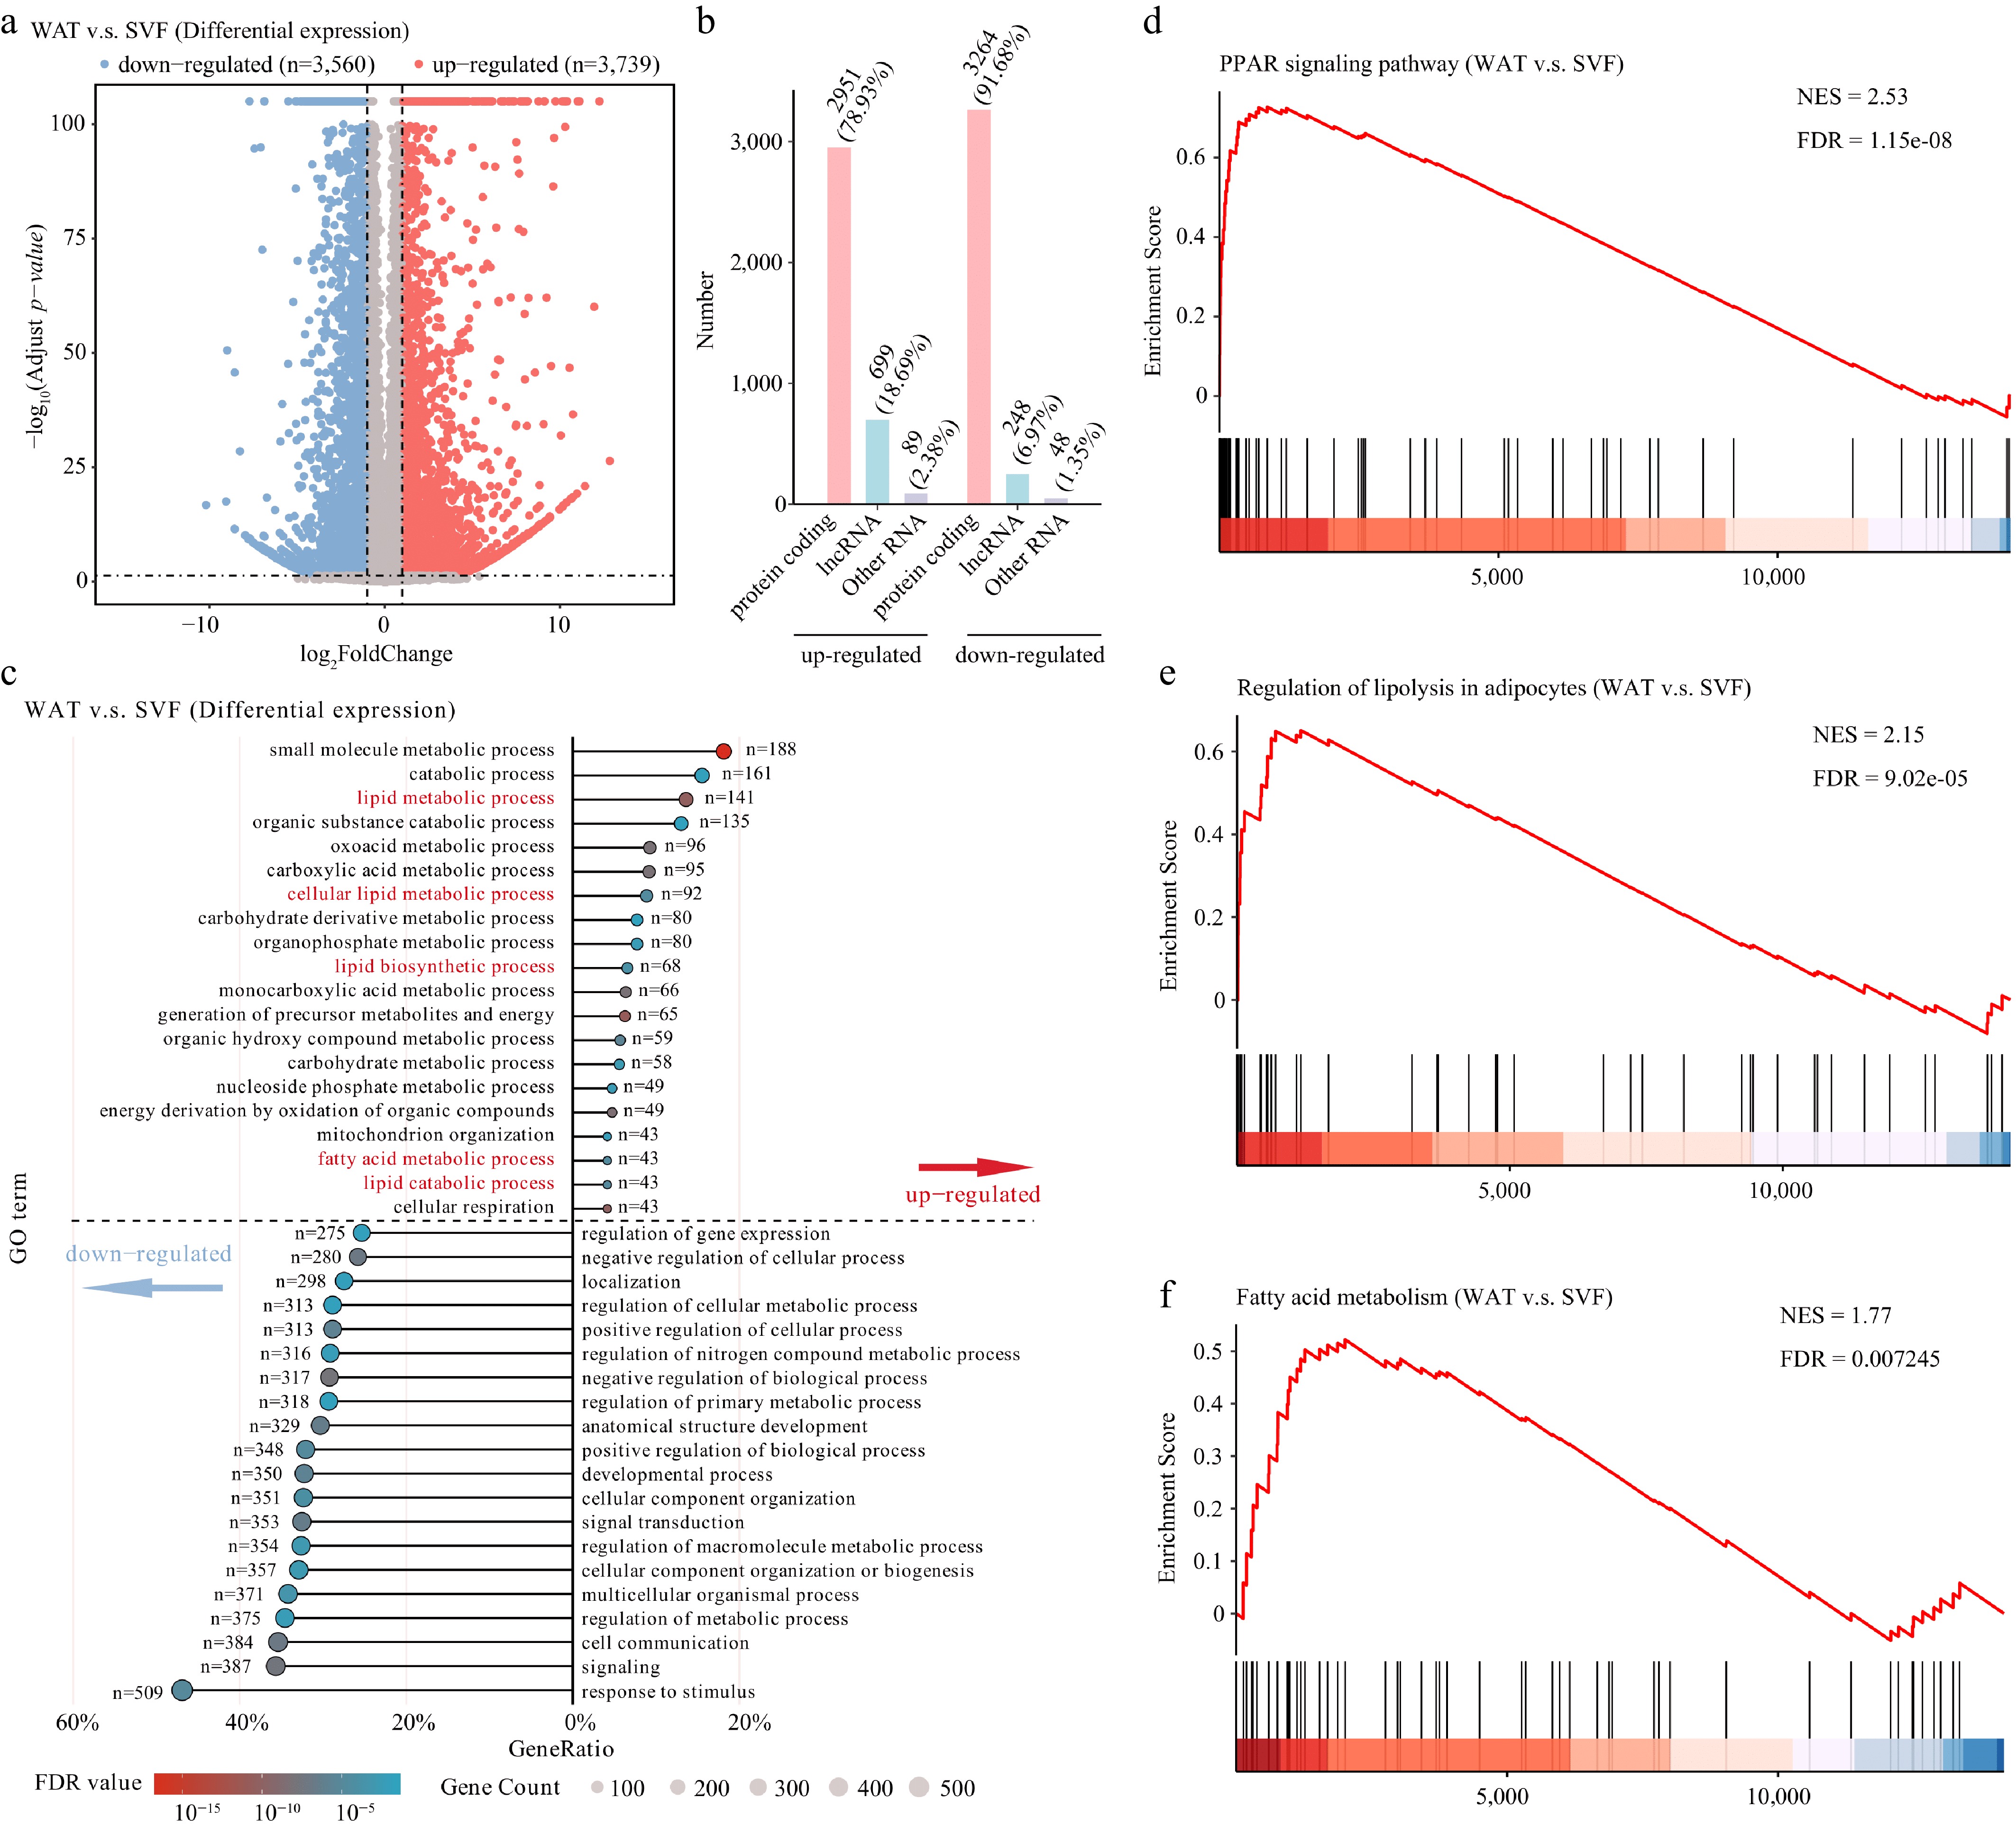
Figure 2.
Transcriptomic reprogramming during porcine adipocyte differentiation. (a) Volcano plot of differentially expressed genes (thresholds: |fold change| > 2, FDR < 0.05). (b) Classification of differentially expressed genes into protein-coding genes, lncRNAs, and other RNA types (including snRNA, snoRNA, miRNA, etc.). (c) GO enrichment analysis of biological processes. Enriched pathways above the dashed line correspond to up-regulated genes, while those below represent down-regulated genes. Terms were considered significantly enriched with an FDR < 0.05. Gene Set Enrichment Analysis (GSEA) of key metabolic pathways. Pathways showing significant enrichment include the (d) PPAR signaling pathway, (e) regulation of lipolysis in adipocytes, and (f) fatty acid metabolism. Normalized enrichment scores (NES) and FDR are indicated for each pathway.
-
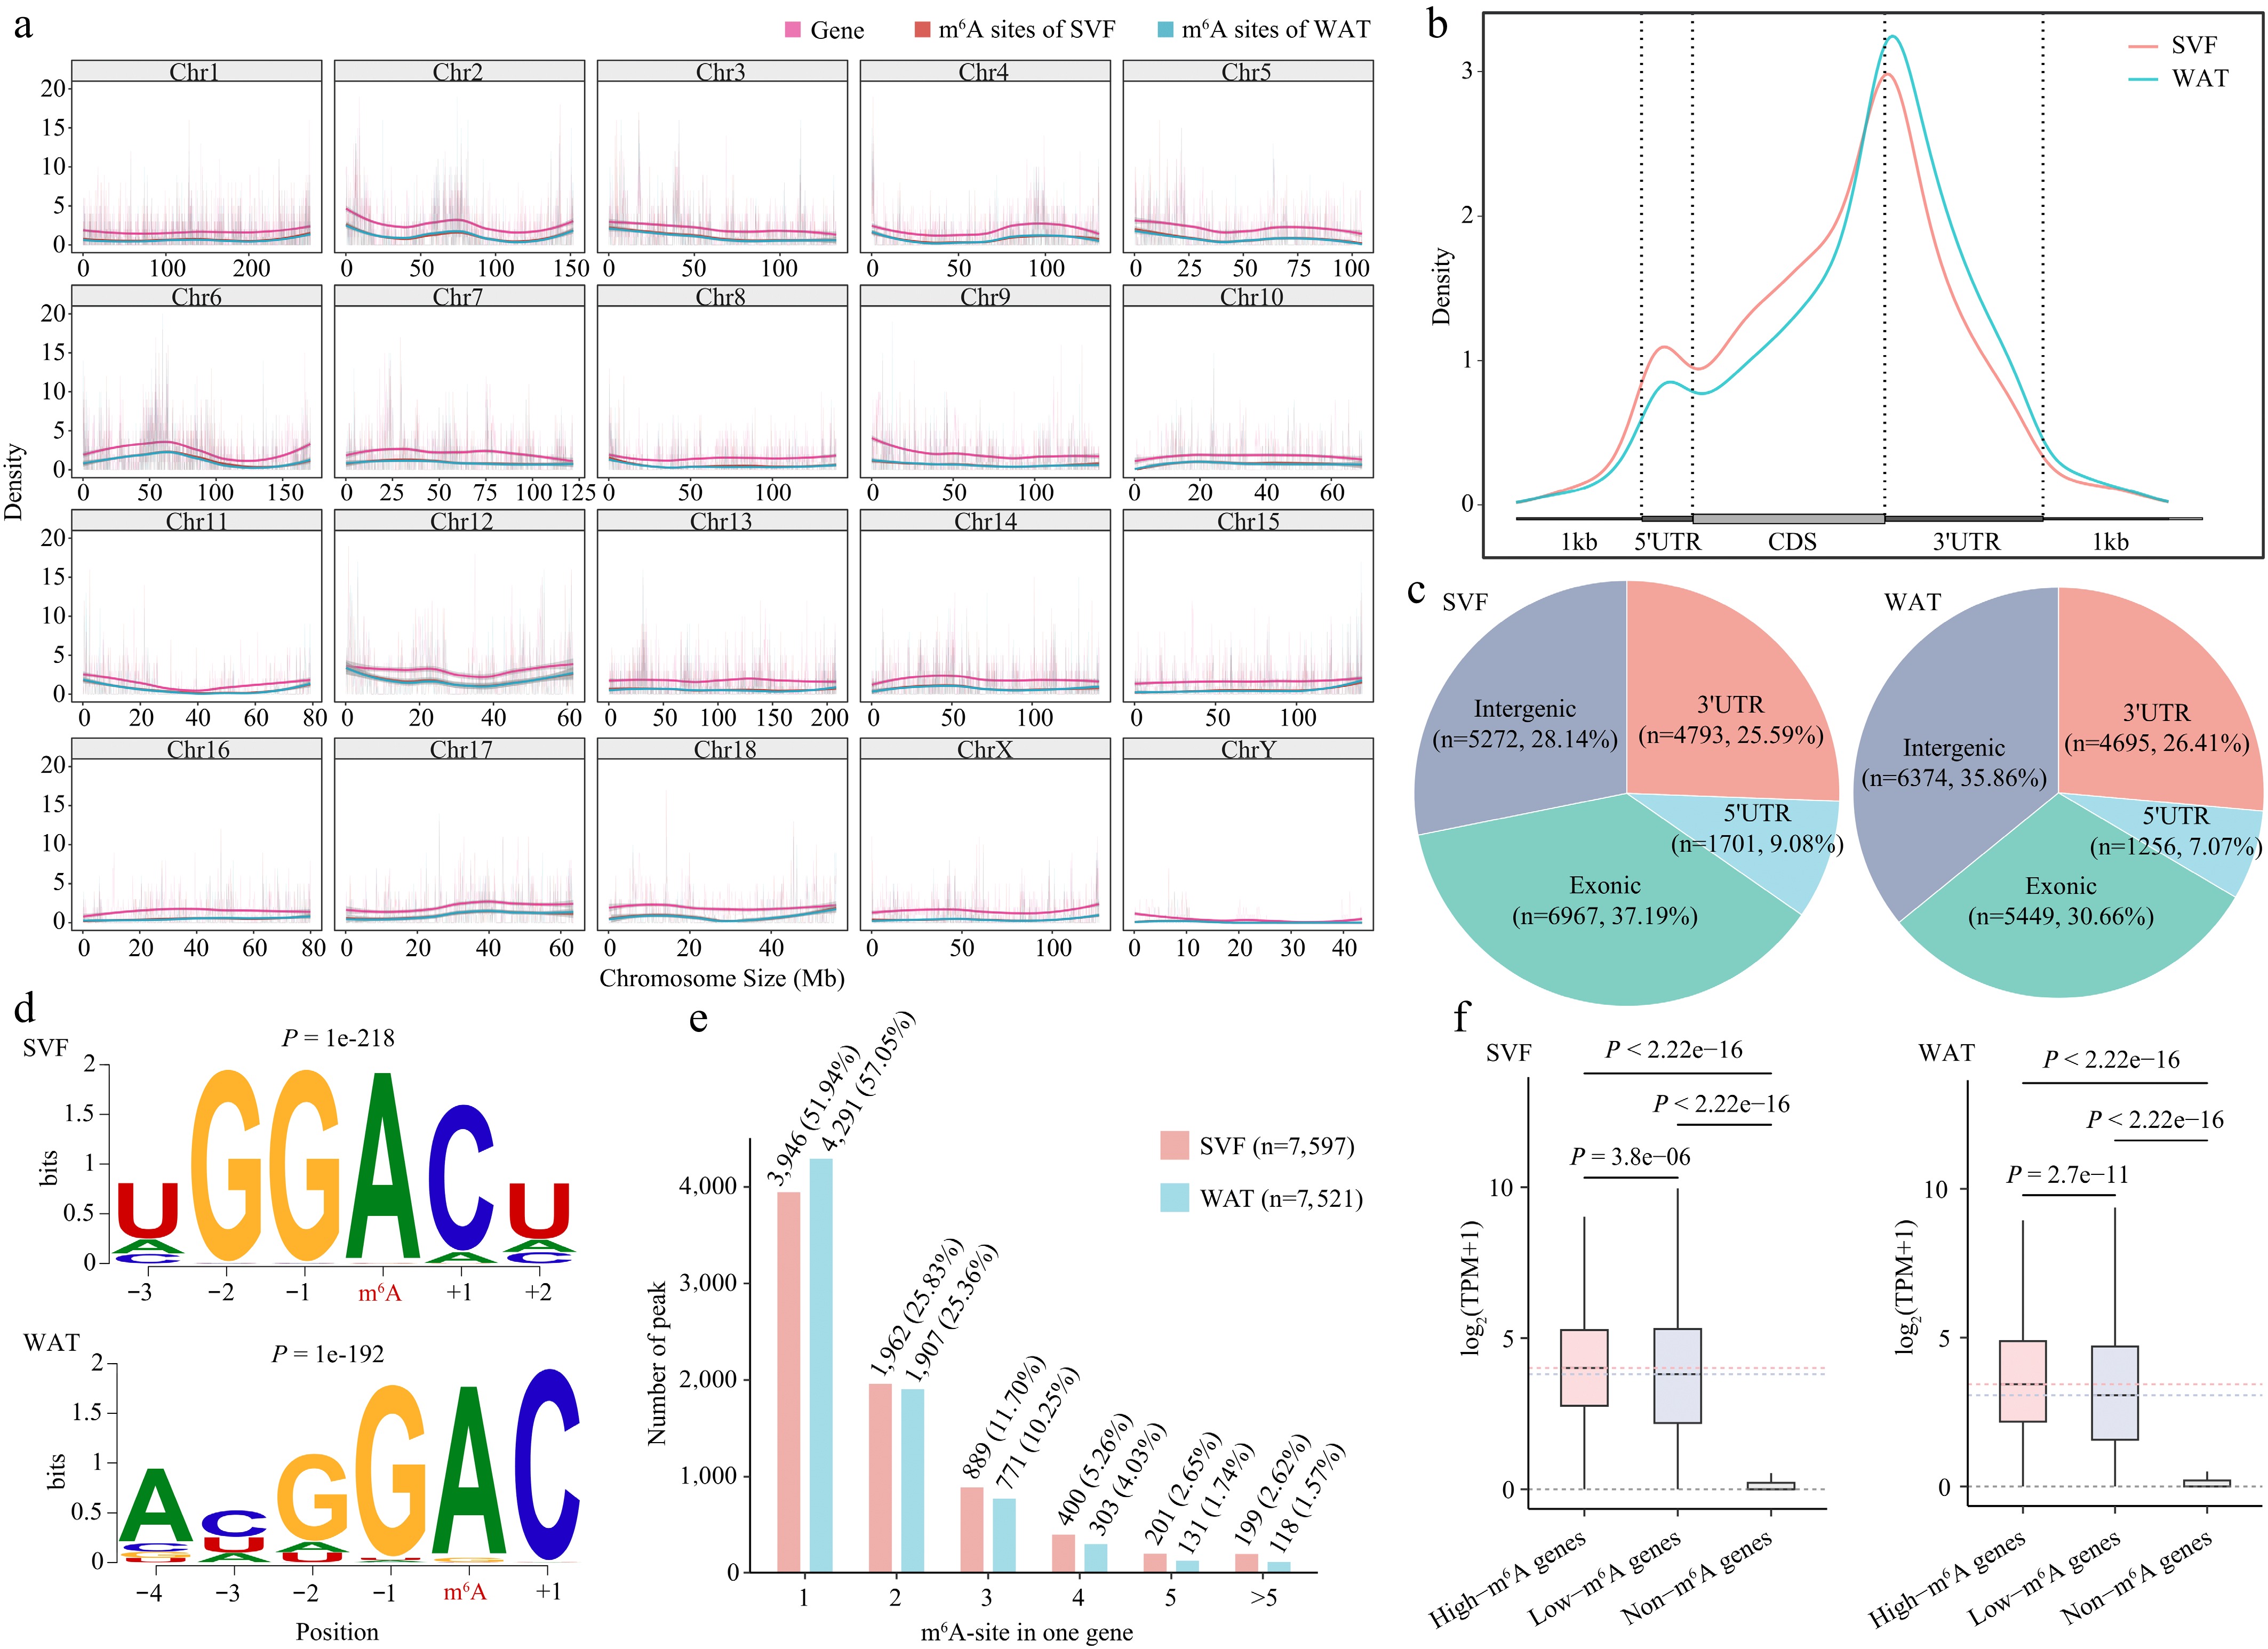
Figure 3.
Transcriptome-wide distribution and features of m6A in porcine adipocytes. (a) Distribution of m6A peaks and gene density across 20 chromosomes in SVF and WAT. (b) Metagene profile of m6A peak distribution across normalized mRNA transcripts, divided into three regions: 5′UTR, coding sequence (CDS), and 3′UTR. Exons are shown as thick boxes and introns as thin lines. (c) Genomic annotation of m6A peaks in SVF and WAT. (d) Consensus sequence motifs of m6A peaks identified by HOMER; red letters indicate the methylated adenine. (e) Abundance of m6A peaks per transcript. The bar chart shows the proportion of transcripts containing different numbers of m6A peaks. (f) Boxplot comparison of expression levels of m6A-modified versus non-m6A-modified transcripts in SVF and WAT. Statistical significance was determined using Student's t-test.
-
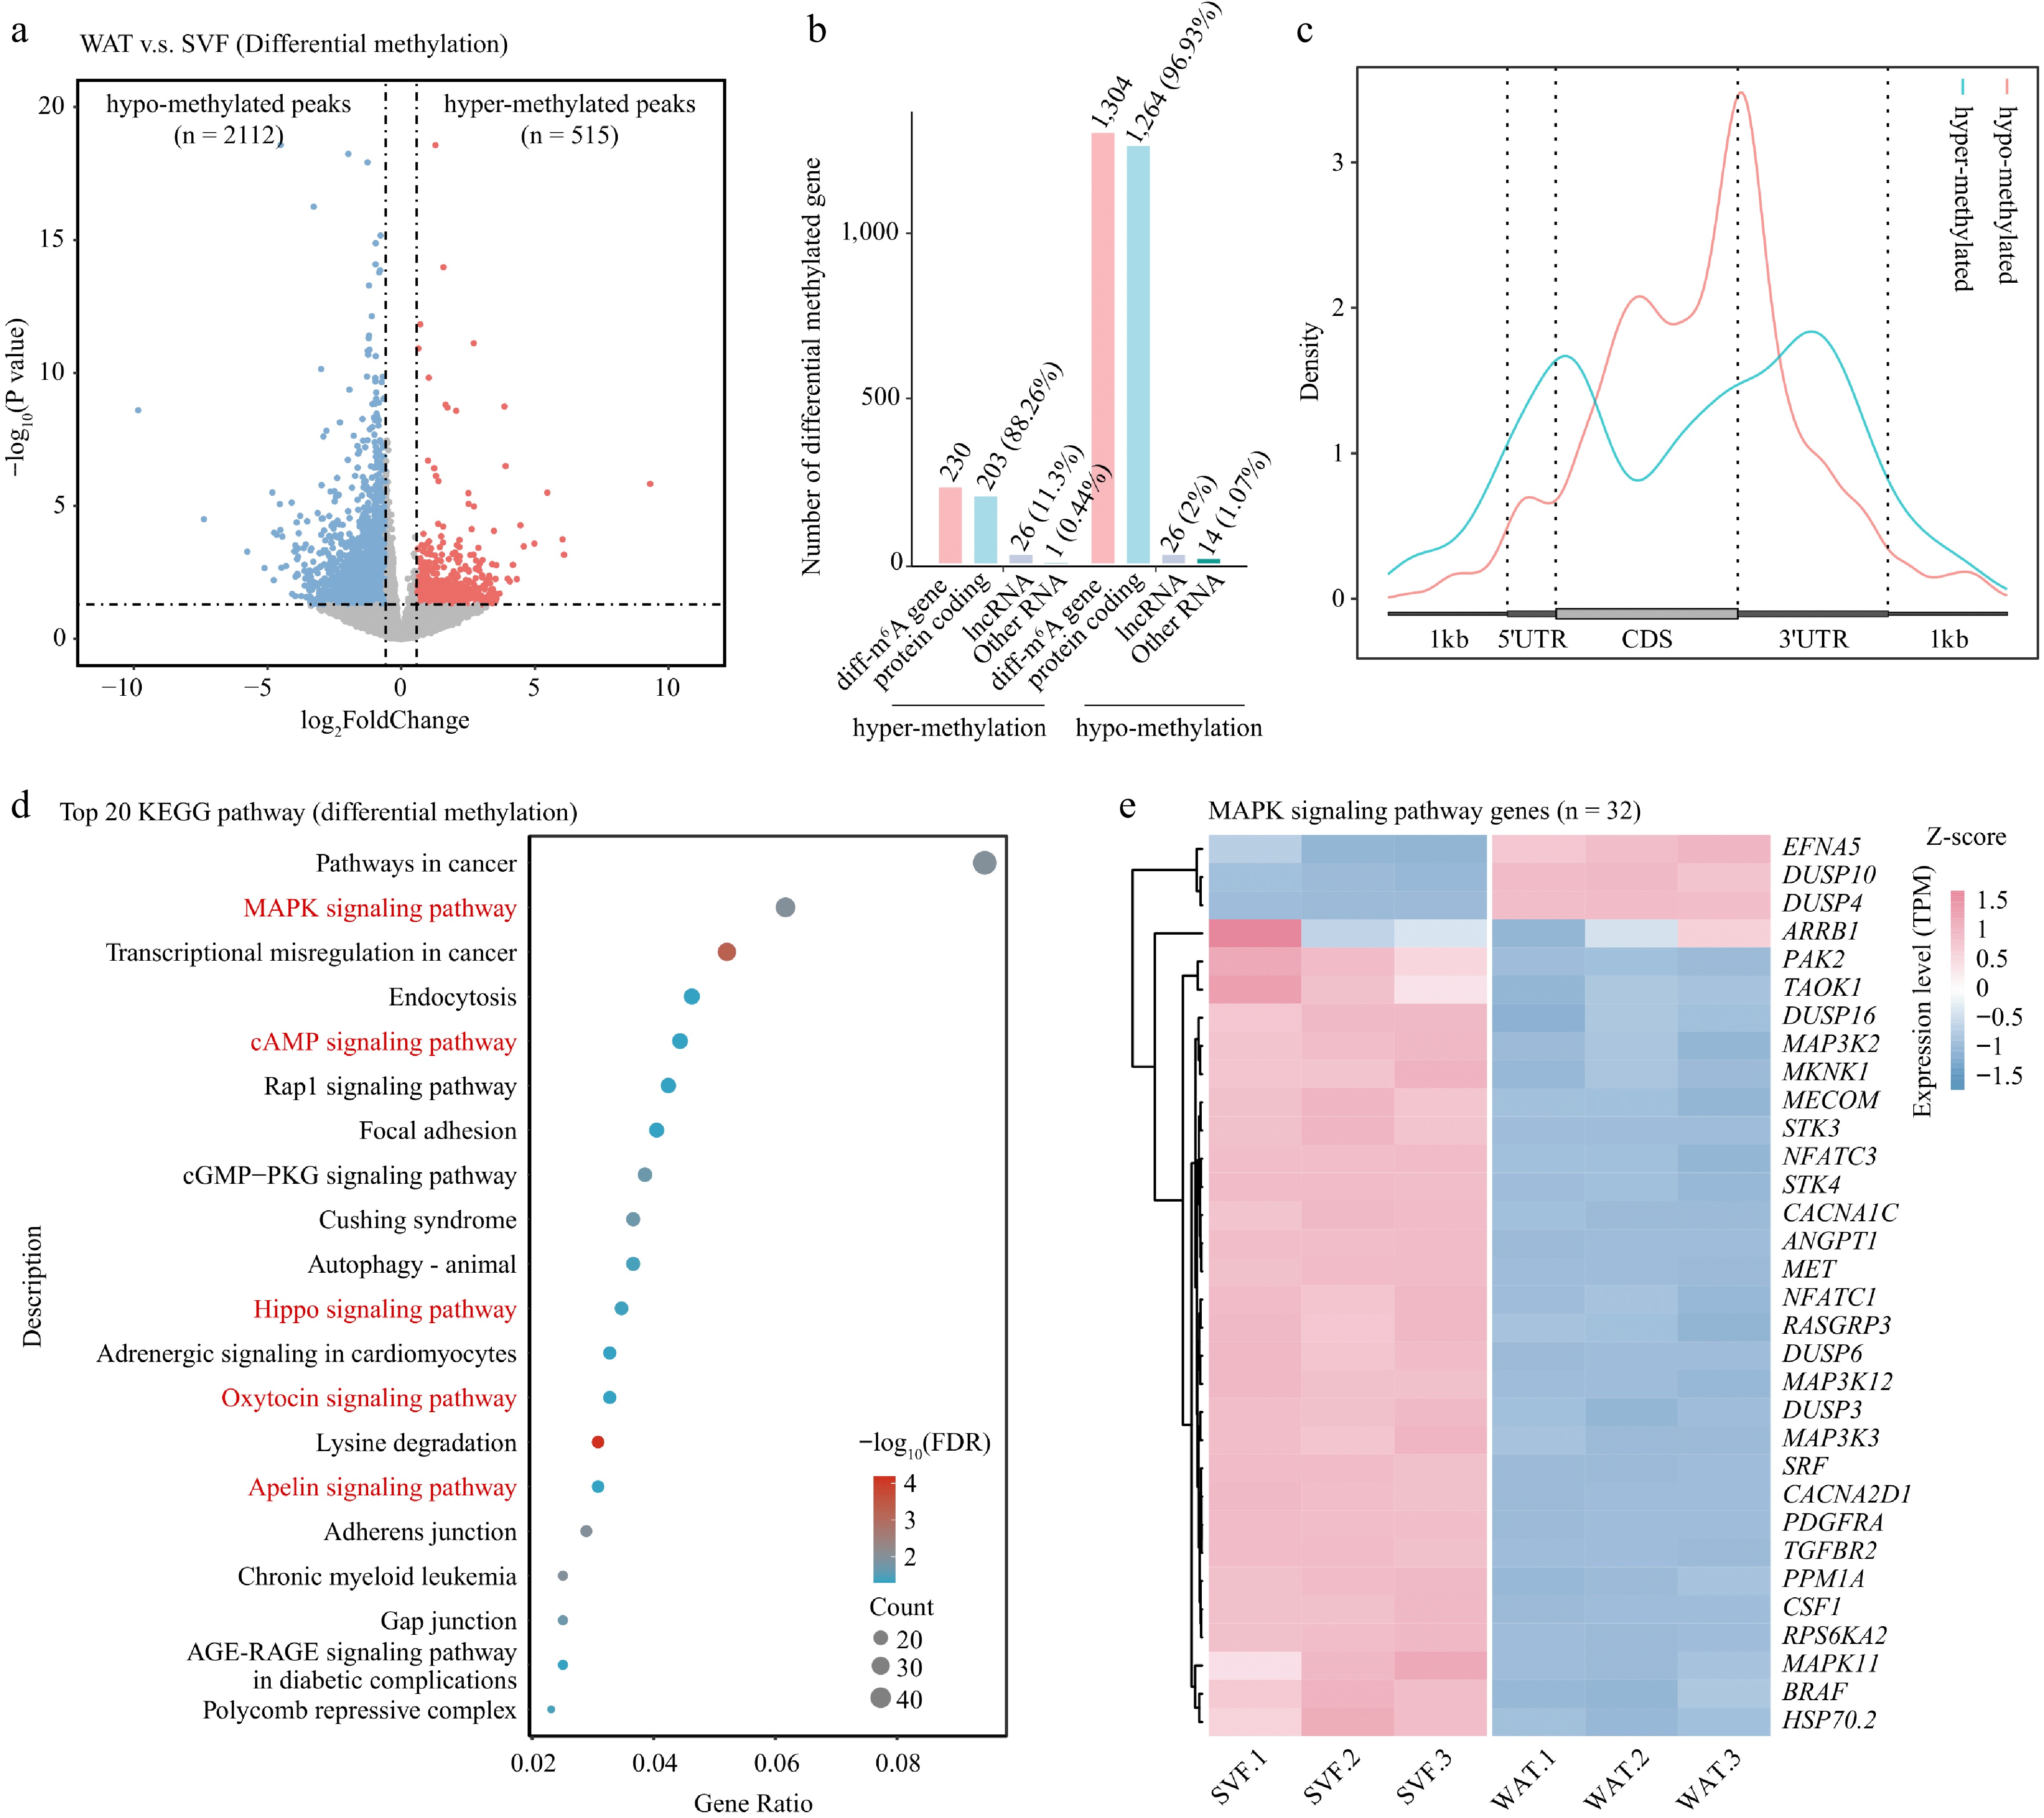
Figure 4.
Differential m6A methylation during porcine adipocyte differentiation. (a) Volcano plot showing differentially methylated m6A peaks between SVF and WAT. Hypermethylated peaks (red) and hypomethylated peaks (blue) represent significant changes, while non-significant peaks are shown in gray. Dashed lines indicate thresholds for fold change and p-value. (b) Bar plot showing the numbers and types of genes annotated from differentially methylated peaks. (c) Metagene profile of differential m6A peak distribution across normalized mRNA transcripts. (d) KEGG pathway enrichment analysis of differentially methylated genes presented as a bubble plot. (e) Heatmap of expression levels of MAPK signaling pathway genes in SVF and WAT.
-
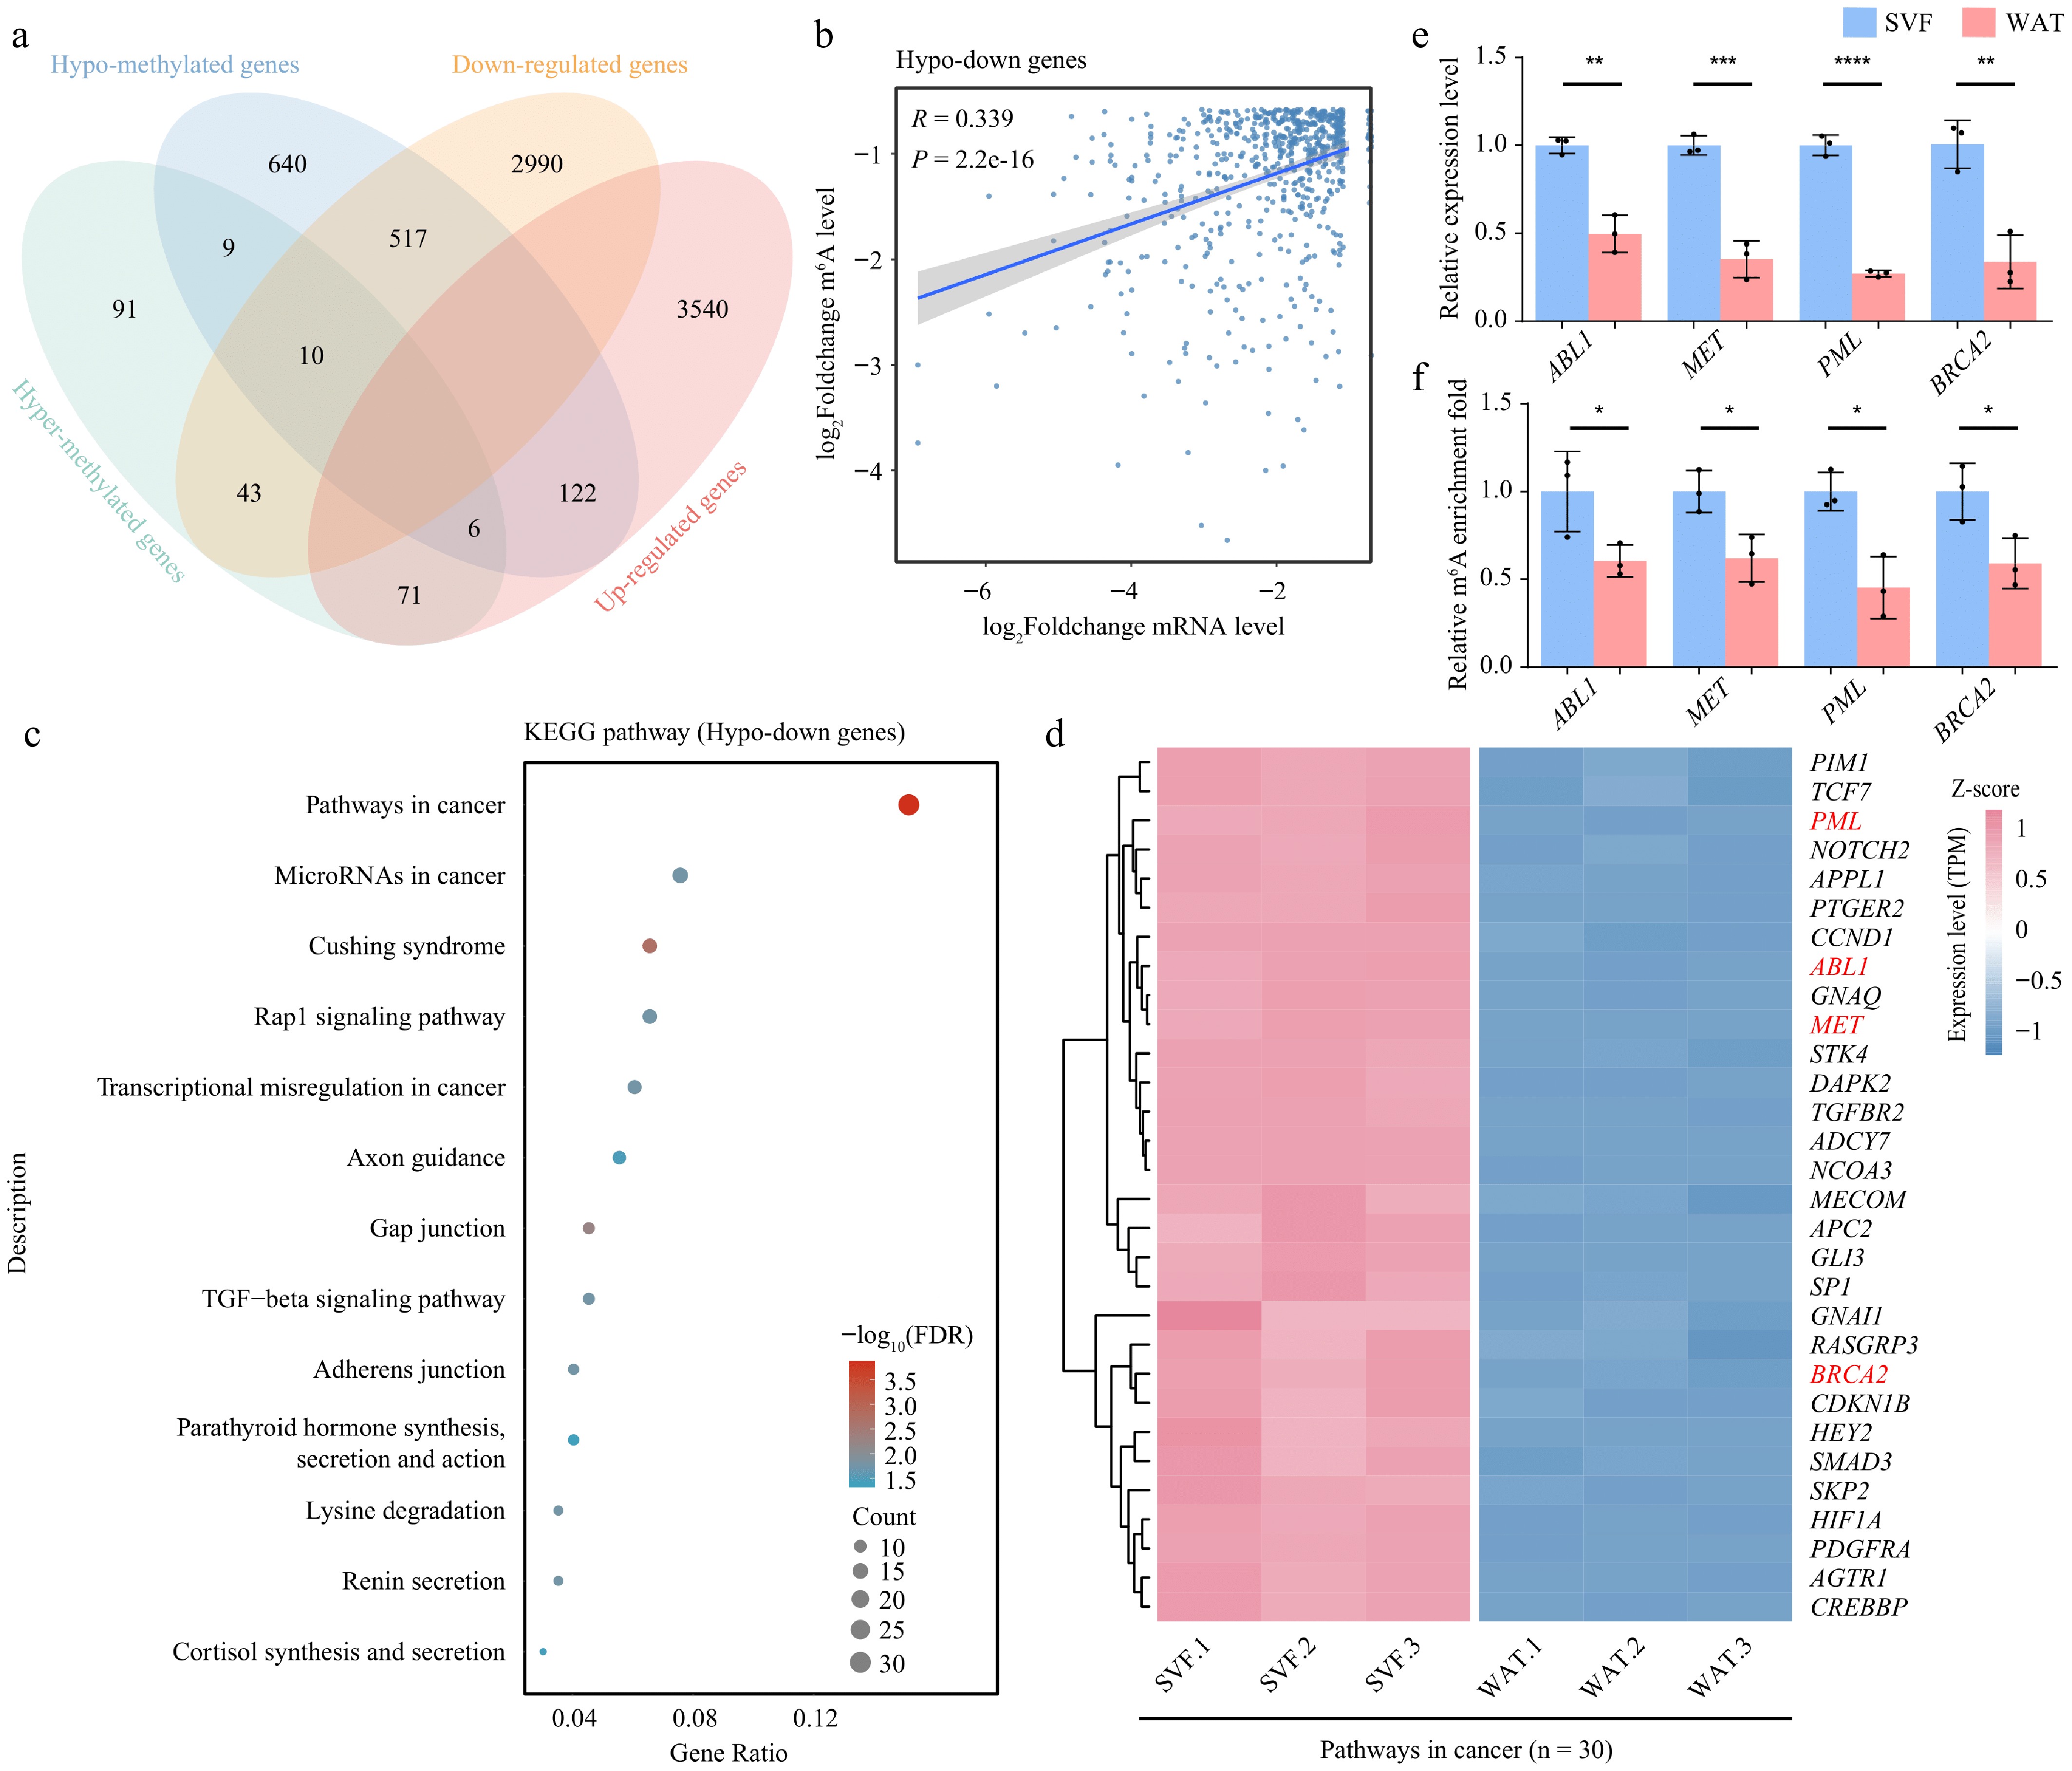
Figure 5.
m6A demethylation correlates with transcriptome reprogramming during adipocyte differentiation. (a) Venn diagram showing the overlap between differentially methylated genes and differentially expressed genes. (b) Scatter plot illustrating the correlation between fold changes in m6A modification levels and gene expression levels in hypo-down genes. Correlation was assessed using Pearson's method. (c) KEGG pathway enrichment analysis of hypo-down genes displayed as a bubble plot. (d) Heatmap of expression levels of cancer signaling pathway genes in SVF and WAT.(e) Expression levels, and (f) m6A modification levels of selected hypo-down genes. β-actin was used as the internal reference gene. Error bars represent mean ± s.d. (n = 3). Statistical significance was determined using Student's t-test relative to day 0. p < 0.05; * p < 0.01; ** p < 0.001; *** p < 0.0001; ns, not significant (p ≥ 0.05).
-
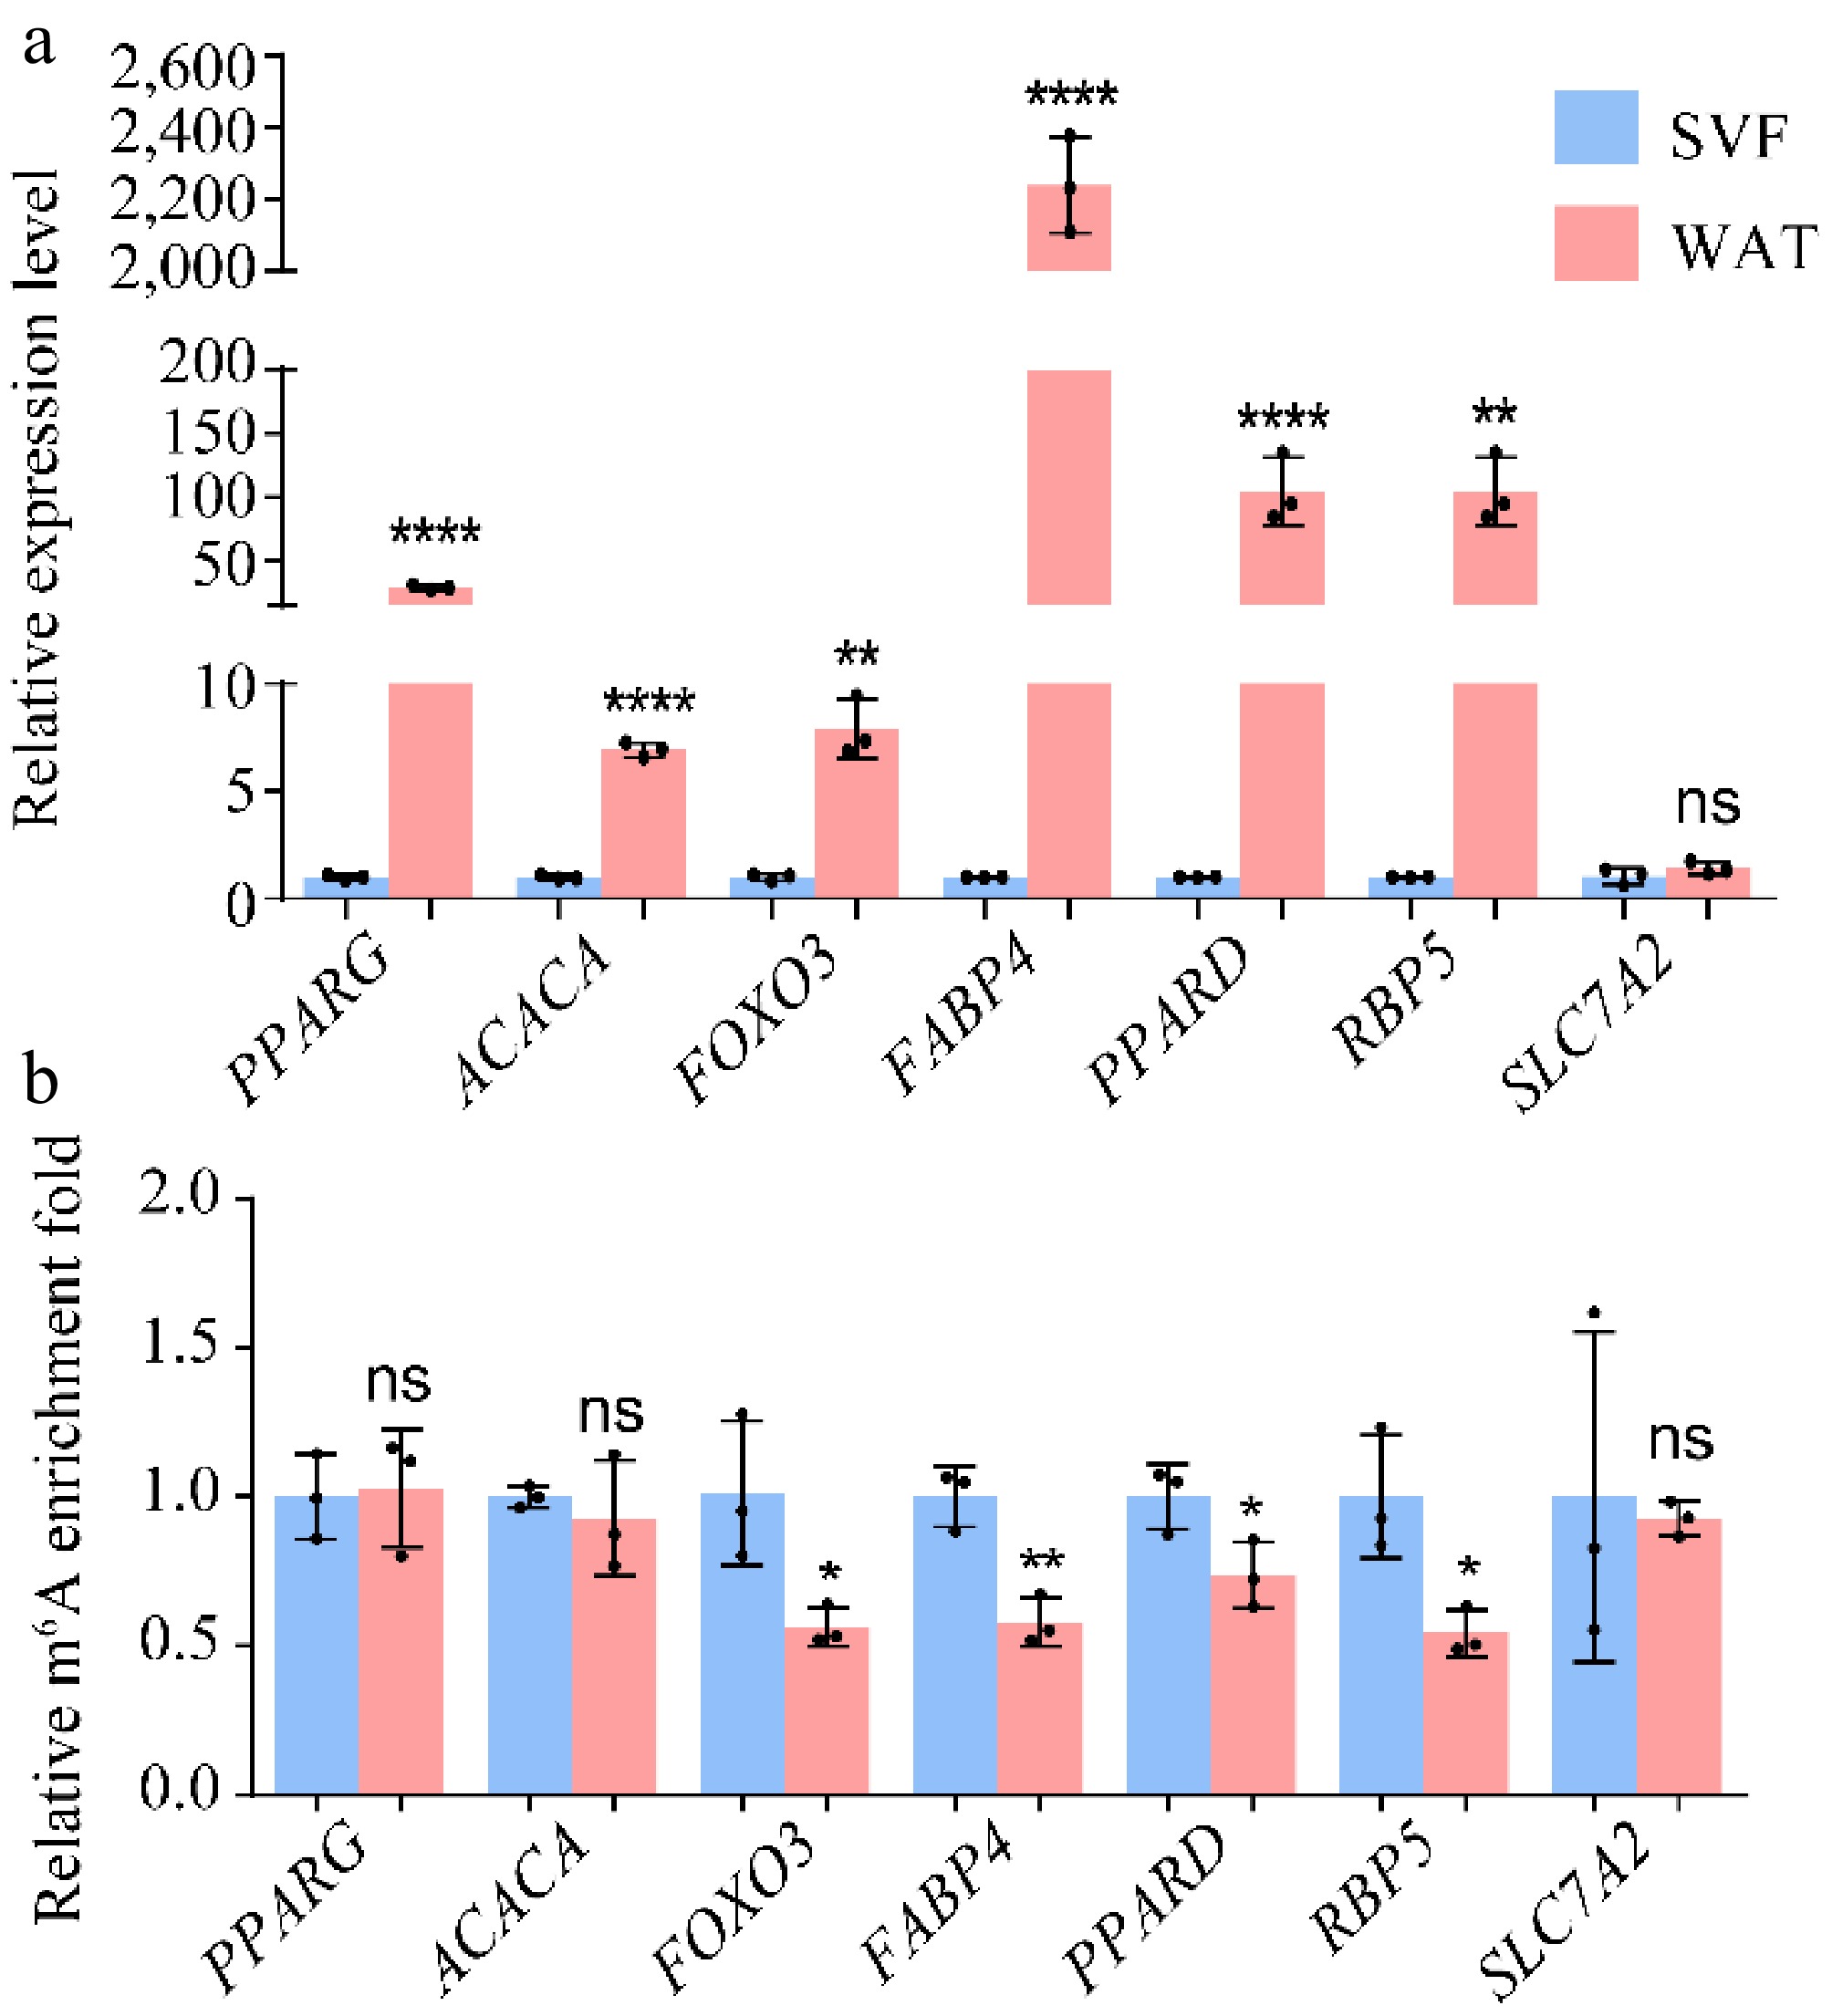
Figure 6.
(a) Expression levels and (b) m6A modification levels of hypo-up genes. β-actin was used as the internal reference gene. Error bars represent mean ± s.d. (n = 3). Statistical significance was assessed using Student's t-test relative to day 0. * p < 0.05; ** p < 0.01; *** p < 0.001; **** p < 0.0001; ns, p ≥ 0.05.
Figures
(6)
Tables
(0)