


-
Pigs (Sus scrofa domesticus) are a major source of high-quality, nutritious meat worldwide. However, excessive fat deposition adversely affects pork quality, production efficiency, and growth performance[1,2]. Beyond agriculture, pigs are also an invaluable animal model for studying human diseases[3,4]. With the increasing prevalence of obesity and fatty liver disease globally[5,6], elucidating the mechanisms underlying porcine fat deposition has both agricultural and biomedical significance.
N6-methyladenosine (m6A) is the most abundant internal modification in eukaryotic mRNAs and long non-coding RNAs, playing a dynamic role in post-transcriptional regulation[7,8]. This reversible modification occurs at the nitrogen-6 position of adenosine, predominantly within the consensus RRACH motif (where R represents A or G, and H represents A, C, or U), with a preference for the GAC context[9,10]. Methyltransferase 'writers', such as METTL3 and METTL14 catalyzed m6A site deposition[11,12], m6A is removed by demethylase 'erasers' such as FTO and ALKBH5[13,14], and interpreted by m6A 'readers' including YTHDF1/2/3, YTHDC1/2, and IGF2BP1/2/3[15−20]. Together, these regulators orchestrate the functional landscape of the epitranscriptome.
The m6A modification plays an important role in regulating multiple pivotal processes of RNA metabolism, including mRNA translation efficiency[15], mRNA stability[16], alternative splicing[21], nuclear export[22], and secondary structure remodeling[23,24]. In adipogenesis, m6A modification modulates the stability of genes associated with autophagy and glycolysis, thereby influencing adipocyte development[25,26]. Among m6A-related enzymes, FTO plays a critical role by promoting early adipocyte differentiation through demethylation of JAK2 mRNA, which stabilizes the transcript and activates the JAK2–STAT3–C/EBPβ pathway[27]. Conversely, FTO suppresses thermogenesis and the white-to-beige transition by reducing the m6A level of Hif1a mRNA, and inhibiting its translation[28]. In pigs, METTL3 was shown to inhibit adipogenic differentiation by methylating PHKG1 and enhancing its stability[29]. Although several m6A-modified targets have been identified in adipocyte differentiation, the transcriptome-wide role of m6A regulators in porcine adipogenesis remains incompletely understood.
Here, transcriptome-wide m6A methylation dynamics were systematically profiled during porcine adipocyte differentiation. The present results uncovered that genes involved in adipogenic differentiation and lipid metabolism undergo coordinated changes in both expression and m6A modification. A strong positive correlation was observed in hypo-methylated and downregulated genes, highlighting a central role for m6A erasers in regulating gene expression in white adipose tissue (WAT). Moreover, enrichment of cancer-related pathways among these genes suggests potential crosstalk between lipid metabolism and oncogenic signaling. Collectively, these findings demonstrate the pivotal function of m6A erasers in porcine adipocyte differentiation, and identify potential m6A-regulated targets relevant to both metabolic regulation and disease.
-
For cell culture, adipose tissue samples were obtained from 2-week-old piglets, minced, and subsequently digested for 60 min at 37 °C. The digestion was carried out using 2 mg/mL collagenase type I (Sigma) in DMEM/F12 medium supplemented with 1% fatty acid-free bovine serum albumin (BSA, Sigma). Stromal vascular fraction (SVF) cells were filtered through a 70-µm cell strainer and cultured in DMEM/F12 (Gibco) medium containing 10% fetal bovine serum (FBS, Sigma), and 1% penicillin–streptomycin[30].
For white adipocyte differentiation, SVF cells were first grown to confluence. Following confluence, the cells were induced for 5 d with human WAT induction medium. This medium consisted of DMEM/H supplemented with 0.1 µM dexamethasone, 66 nM insulin (Sigma), 0.25 mM isobutylmethylxanthine, 17 µM pantothenate, 20 mM HEPES (pH 7.4), 0.5% FBS, and 33 µM biotin. On day 5, half of the induction medium was replaced with human WAT maturation medium. This medium consisted of DMEM/H supplemented with 0.1 µM dexamethasone, 66 nM insulin (Sigma), 0.25 mM isobutylmethylxanthine, 17 µM pantothenate, 20 mM HEPES (pH 7.4), 10% FBS, and 33 µM biotin. After one day, cells were transferred to complete maturation medium and cultured for an additional 2 d. Fully differentiated adipocytes (day 8) were collected for subsequent experiments.
Total RNA extraction, reverse transcription, and qPCR
-
Total RNA was extracted using TRIzol reagent (Invitrogen) according to the manufacturer's protocol[30]. First-strand cDNA synthesis was performed with the First-Strand cDNA Synthesis Mix with DNase (Genesand, SR511). Quantitative PCR was performed using SYBR Green Fast Mix (Genesand, SQ410). Relative expression levels were normalized to 18S rRNA as the internal reference. The sequences for RT-qPCR primers can be found in Supplementary Table S1.
m6A RNA immunoprecipitation sequencing (MeRIP-seq), and MeRIP-qPCR
-
MeRIP-seq and MeRIP-qPCR were performed as previously described[16] with some modifications. Briefly, total RNA was isolated with TRIzol reagent (Invitrogen) following the manufacturer's instructions. Poly(A)+ RNA was purified using the Dynabeads™ mRNA Purification Kit (Thermo Fisher, 61006), and fragmented into ~200 nt fragments with the RNA Fragmentation Reagent (Thermo Fisher, AM8740). Approximately 100 ng of fragmented RNA was reserved as an input control. For immunoprecipitation, 1 µg of fragmented poly(A)+ RNA was incubated with 2 µg of anti-m6A antibody (Synaptic Systems, 202003) at 4 °C for 3 h, followed by capture with Dynabeads™ Protein A (Thermo Fisher, 10002D) for 2 h at 4 °C. Beads were washed three times with IPP buffer (150 mM NaCl, 0.1% NP-40, 10 mM Tris-HCl, pH 7.4). m6A-enriched RNA was competitively eluted using free m6A nucleotides, precipitated with ethanol, and further purified with the RNeasy MinElute Cleanup Kit (Qiagen, 74204). Libraries were prepared using the KAPA Stranded RNA-Seq Kit (KAPA Biosystems, KK8401) and sequenced on an Illumina NovaSeq 6000 platform (ANOROAD, Beijing, China).
To assess the methylation level of specific transcripts in SVF and WAT cells, MeRIP-qPCR was performed. The m6A-IP procedure was identical to that used for MeRIP-seq. Enriched RNA was eluted with DEPC-treated water, reverse-transcribed using the First-Strand cDNA Synthesis Mix with DNase (Genesand, SR511), and quantified by qPCR. The fraction recovered was calculated relative to the input. A complete list of the MeRIP-qPCR primers used is provided in Supplementary Table S1.
Bioinformatic analysis of MeRIP-seq and RNA-seq data
-
The raw input RNA-seq and MeRIP-seq data were processed using fastp software (v0.22.0)[31] to remove adaptor contamination and low-quality bases. Fastp outputs were summarized using MultiQC (v1.13.dev0)[32]. Clean reads were mapped to the reference genome of the Sus scrofa (version Sscrofa11.1)[33] using HISAT2 (v2.2.1)[34], with the parameters '-k 5 --max-intronlen 317,503 --summary-file'. The unique mapping clean reads were quantified using featureCounts from the subread software (v2.0.1)[35], following analysis of differentially expressed genes was conducted using the R package DESeq2 (v1.38.3)[36]. Genes were considered differentially expressed if they had an absolute log2foldchange value > 1, and a false discovery rate (FDR) value < 0.05 in the input RNA-seq data. For Principal component analysis, gene expression patterns were calculated on the regularized normalized counts obtained from DESeq2, and visualization using plotPCA. Sample correlation analysis was performed using deeptools software (v3.5.1)[37], Gene Ontology (GO) and Kyoto Encyclopedia of Genes and Genomes (KEGG) functional enrichment analyses were carried out using Bioconductor clusterProfiler (v4.6.2) package[38]. Significantly enriched GO terms (FDR < 0.05) were selected, and visualization analysis using the R package ggplot2 (v3.5.1). Heatmap visualization was performed using the pheatmap (v1.0.12) package in R (v4.2.3) to represent the differentially expressed genes.
For m6A peak calling, the MASC2 peak calling algorithm (
https://github.com/macs3-project/MACS/wiki/Install-macs2 ) were used to identified m6A peaks with the input RNA-seq data as background, and the parameter q value was set to 0.05. For each biological replicate, m6A peaks that overlapped at least two of three biological replicates were merged as high confidence m6A peaks using the slice function (parameter set to lower = 2, ranges Only = TRUE) in the R package IRanges (https://bioconductor.org/packages/IRanges ). The GuitarPlot function was used to analyze each conditional high confidence m6A peaks distribution in the R package Guitar (https://github.com/lzcyzm/Guitar ). m6A peaks annotation analysis was performed using R package ChIPseeker (v1.34.1)[39]. QNB software (v1.1.11)[40] was used to identify the differential methylational sites. m6A peaks were considered differential methylated peaks if they had an absolute log2foldchange value > 0.58, and an adjusted p-value < 0.05.Identification of enriched motifs within m6A peaks
-
To identify significant enriched motifs, de novo analysis was conducted on the high-confidence m6A peaks using HOMER software (v4.11)[41], in brief, the sequences of high confidence m6A peaks were extracted as target sequences using the fastaFromBed function in BEDTools software (v2.26.0)[42], with background sequences generated using the shuffle function. De novo motif analysis was subsequently executed through HOMER's findMotifs.pl script.
Gene set enrichment analysis
-
GSEA was performed to identify biologically relevant pathways exhibiting coordinated expression changes in input RNA-seq data. In brief, KEGG pathway enrichment was analyzed using GSEA implemented with the gseKEGG function in clusterProfiler. Genes were ranked by log2foldchange values from differential expression analysis. The analysis utilized the KEGG database (v2.4.5)[43] with organism code 'ssc'. Significant pathways were identified at the absolute normalized enrichment score (NES) > 1.5, and FDR value < 0.05. Results were visualized using the gseaplot2 function in the R package enrichplot (
https://github.com/YuLab-SMU/enrichplot ) with GSEA enrichment score profiles. -
To investigate the role of m6A modification during the Sus scrofa adipocyte differentiation, the mRNA expression patterns of m6A regulator genes were examined, including m6A writers, erasers, and readers during the transition from SVF cells to WAT. Distinct temporal expression profiles were observed (Fig. 1).
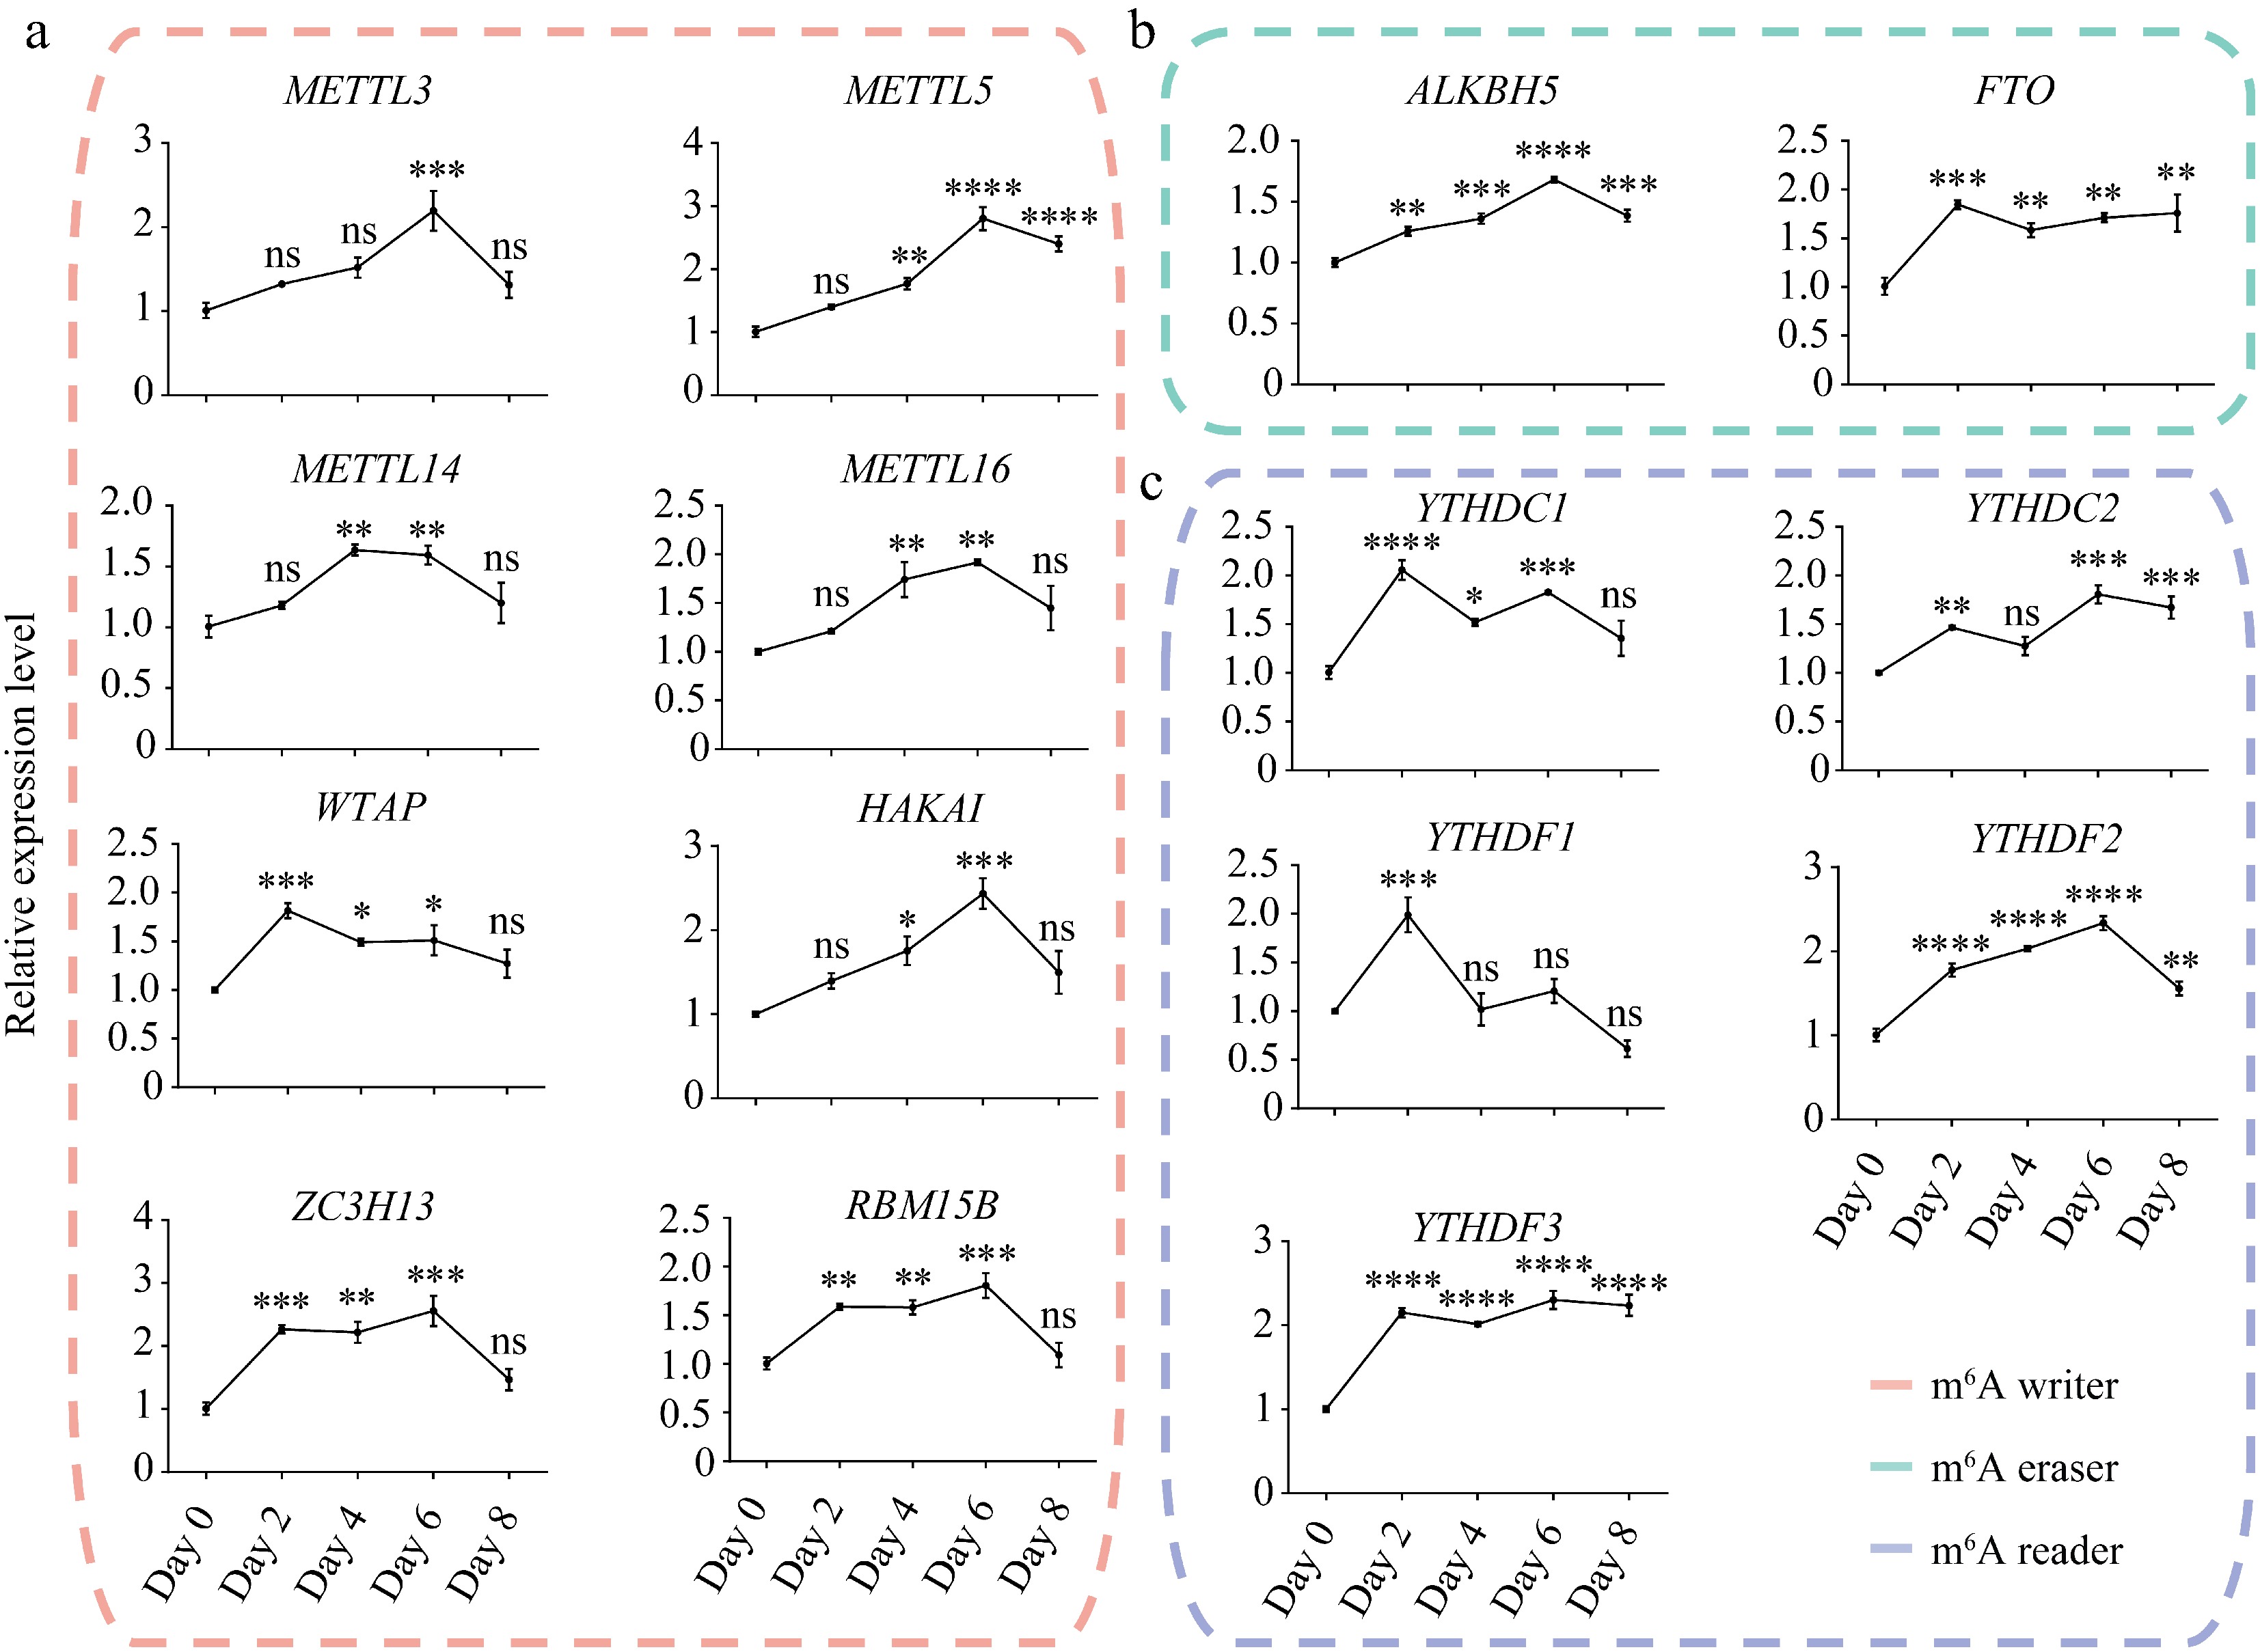
Figure 1.
Expression dynamics of m6A writers, erasers, and readers during porcine adipocyte differentiation. Relative mRNA expression levels of m6A (a) writers, (b) erasers, and (c) readers during SVF adipogenesis. 18S rRNA was used as the internal reference gene. Data are presented as mean ± s.d (n = 3). Statistical significance was determined by ANOVA with a post-hoc test. * p < 0.05; ** p < 0.01; *** p < 0.001; **** p < 0.0001; ns, not significant (p ≥ 0.05).
Most m6A writers' expression level gradually increased during the first 6 d of differentiation but declined sharply in mature WAT (day 8), except for WTAP, which peaked on day 2 (Fig. 1a). In contrast, the m6A erasers ALKBH5 and FTO maintained high expression levels in mature adipocytes (day 8) (Fig. 1b). Notably, FTO expression remained elevated from day 2 onward, corresponding with its pivotal role in adipogenesis and adipogenic differentiation[44]. These findings imply that m6A writers may function primarily during the early phase of adipogenesis, whereas m6A erasers were active throughout the entire differentiation process.
Corresponding to the elevated expression of m6A writers on day 2, m6A readers also showed high expression on day 2 but displayed divergent trajectories in subsequent stages (Fig. 1c). Among them, YTHDC1 and YTHDC2 exhibited a wave-like expression pattern throughout adipogenesis. On the other hand, YTHDF1 expression level significantly decreased after day 2, whereas YTHDC2 and YTHDF3 maintained high expression levels from day 2 to day 8. Together, these regulators cooperate to modulate m6A methylation of target genes during adipogenesis.
WAT enhances lipid metabolism while suppressing stress responses
-
Transcriptional changes were next characterized by RNA sequencing of SVF cells (pre-differentiation) and WAT cells (post-differentiation), each with three biological replicates (Supplementary Table S2). Pearson correlation analysis, sample-to-sample distance metrics, and principal component analysis (PCA) confirmed high reproducibility (Supplementary Fig. S1).
Differential expression analysis (absolute fold change > 2, FDR < 0.05) identified 3,739 upregulated and 3,560 downregulated genes (Fig. 2a). Among these, lncRNAs accounted for 18.69% of upregulated, and 6.97% of downregulated transcripts (Fig. 2b), suggesting regulatory roles in adipogenesis.
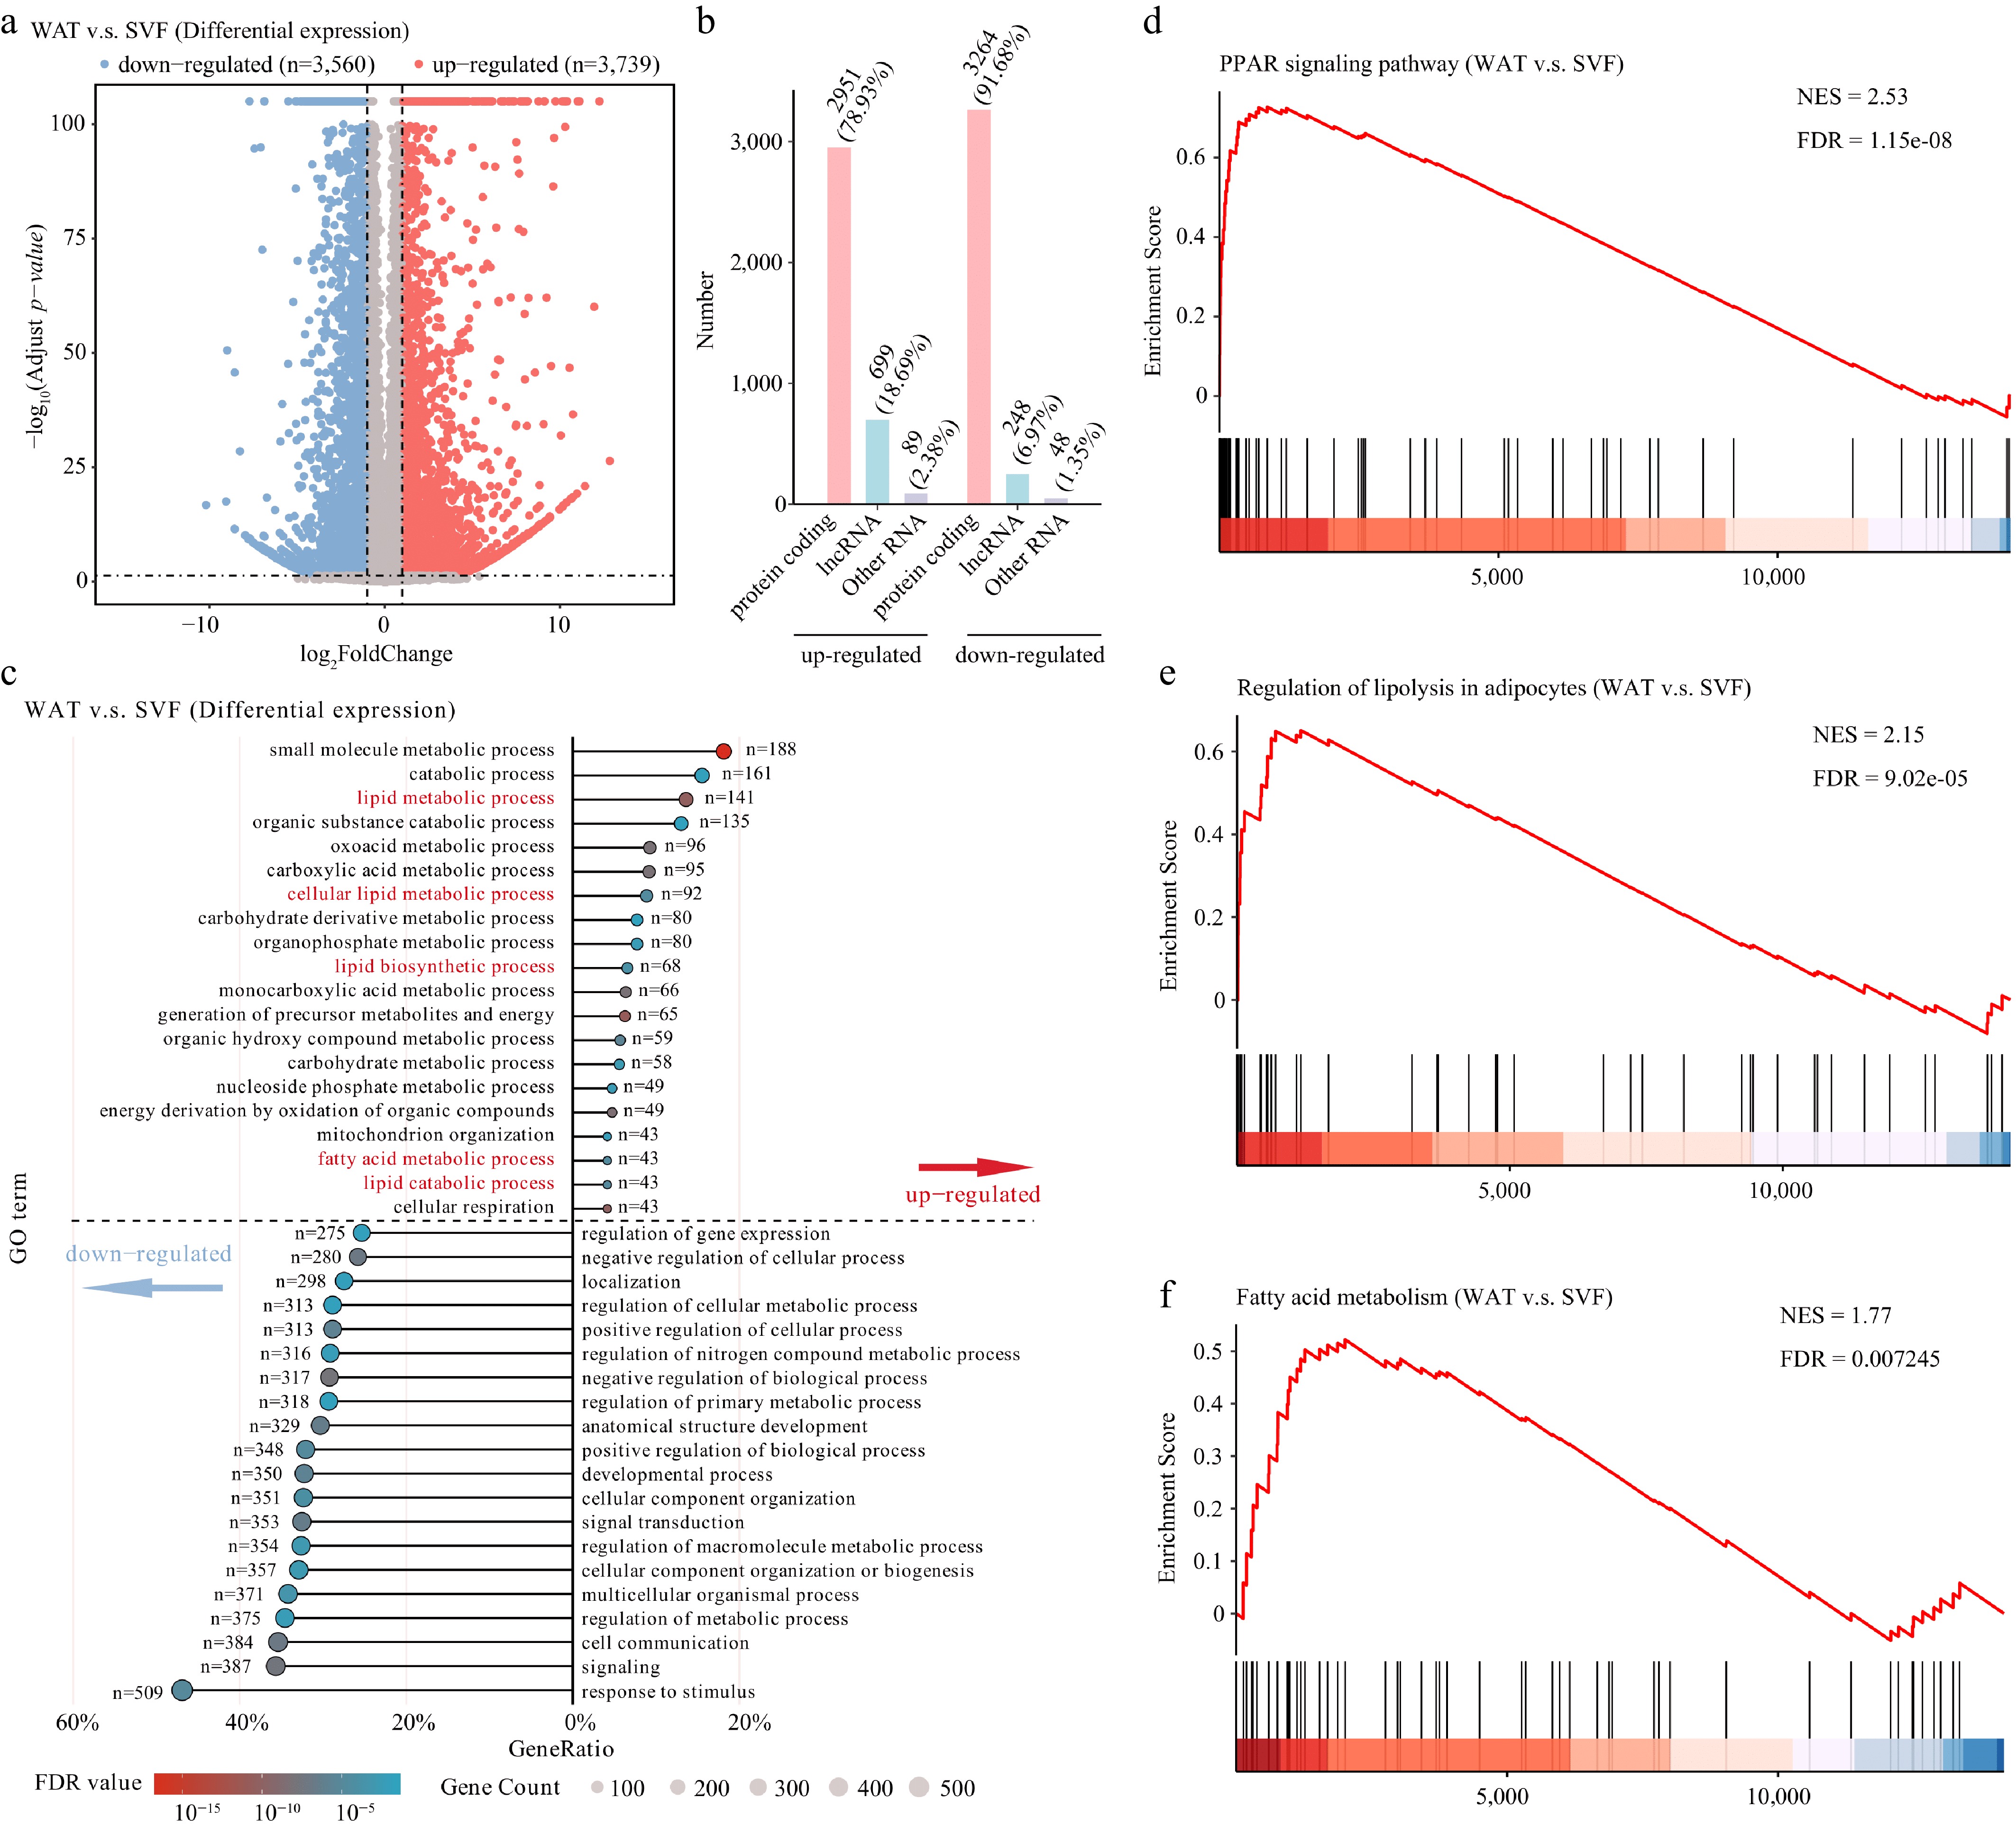
Figure 2.
Transcriptomic reprogramming during porcine adipocyte differentiation. (a) Volcano plot of differentially expressed genes (thresholds: |fold change| > 2, FDR < 0.05). (b) Classification of differentially expressed genes into protein-coding genes, lncRNAs, and other RNA types (including snRNA, snoRNA, miRNA, etc.). (c) GO enrichment analysis of biological processes. Enriched pathways above the dashed line correspond to up-regulated genes, while those below represent down-regulated genes. Terms were considered significantly enriched with an FDR < 0.05. Gene Set Enrichment Analysis (GSEA) of key metabolic pathways. Pathways showing significant enrichment include the (d) PPAR signaling pathway, (e) regulation of lipolysis in adipocytes, and (f) fatty acid metabolism. Normalized enrichment scores (NES) and FDR are indicated for each pathway.
GO and KEGG enrichment revealed that upregulated genes were strongly enriched in lipid metabolism, lipogenesis, and fatty acid synthesis, supporting their roles in adipogenesis and lipid accumulation. Conversely, downregulated genes were enriched in stimulus response and regulatory pathways, indicating reduced stress-related activity in mature adipocytes (Fig. 2c).
KEGG further highlighted enrichment of PPAR signaling among upregulated genes (Supplementary Fig. S2)[45], along with fatty acid metabolism and regulation of lipolysis. In contrast, downregulated genes were enriched in PI3K-Akt and MAPK signaling (Supplementary Fig. S2). GSEA confirmed consistent upregulation of PPAR signaling, fatty acid metabolism, and lipolysis-related gene sets in WAT (Fig. 2d–f). Together, these data show that WAT is characterized by enhanced lipid metabolism and reduced stress and signaling activity during differentiation.
Transcriptome-wide mapping reveals positional and functional features of m6A
-
To profile global m6A changes, MeRIP-seq was performed. Using MACS2 peak calling and requiring overlap in at least two replicates, 18,743 peaks in SVF and 17,790 peaks in WAT were identified (Supplementary Fig. S3a, S3b). m6A peaks were unevenly distributed across chromosomes (Fig. 3a).
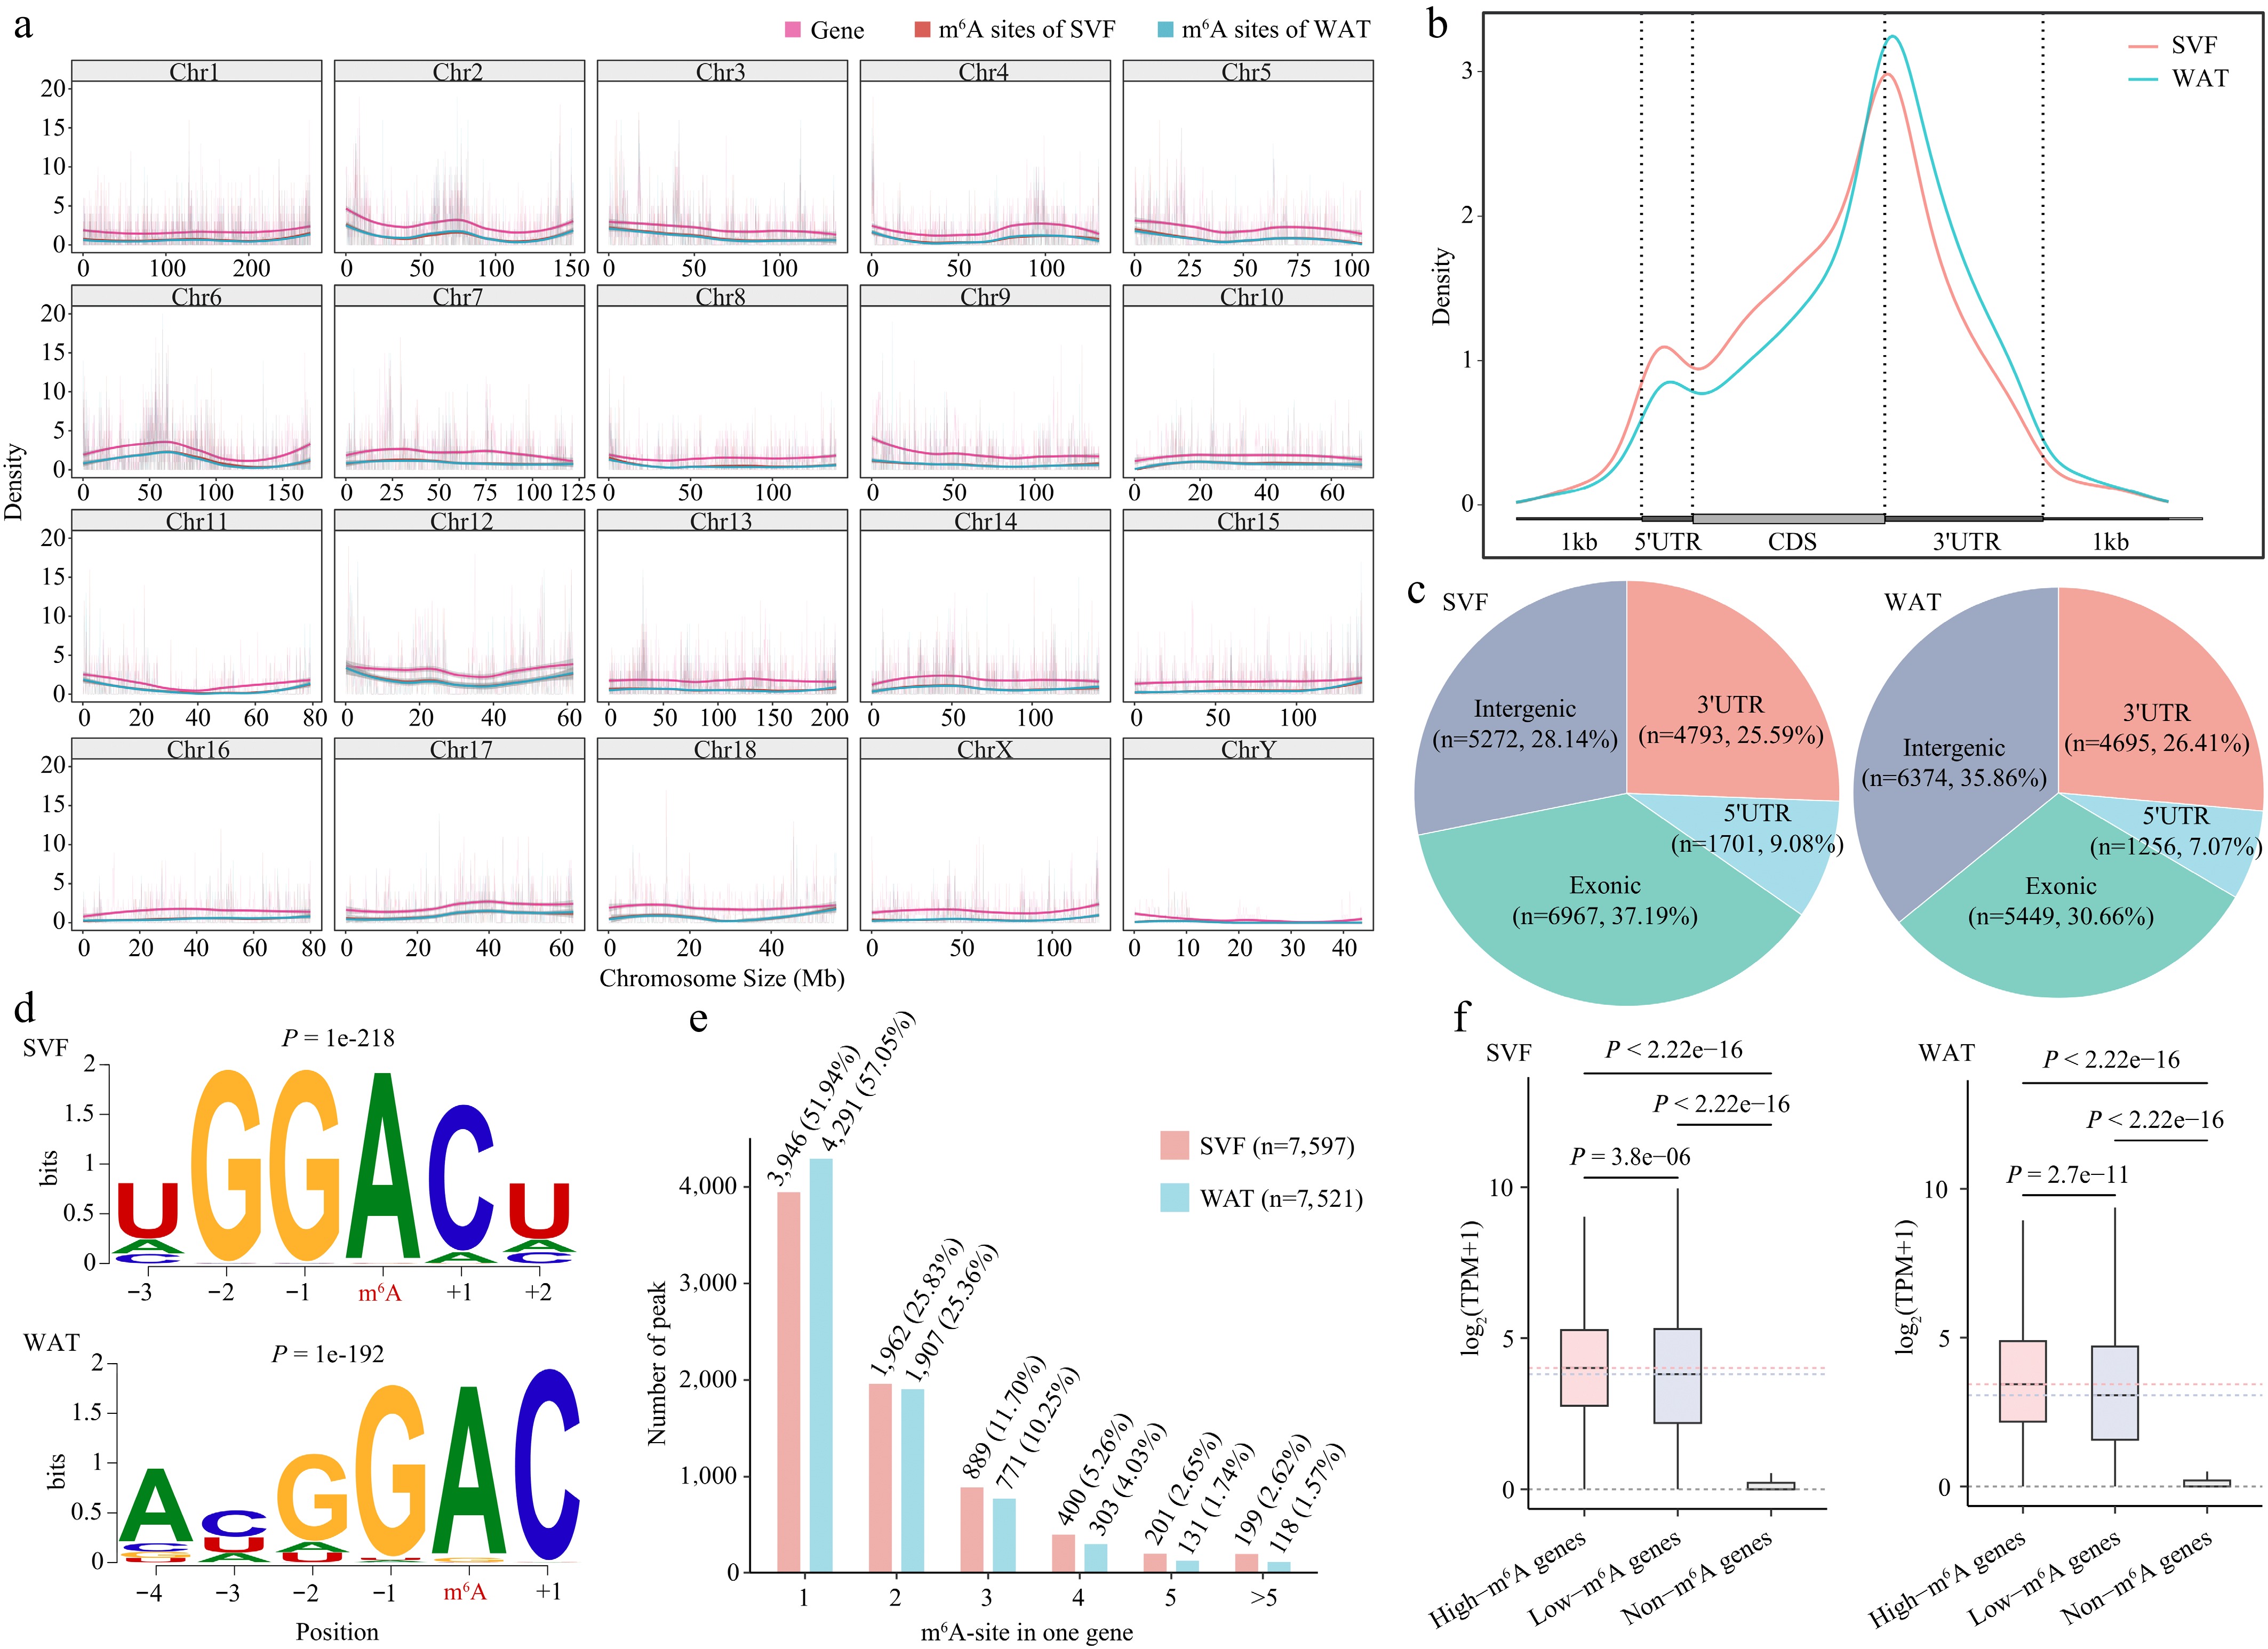
Figure 3.
Transcriptome-wide distribution and features of m6A in porcine adipocytes. (a) Distribution of m6A peaks and gene density across 20 chromosomes in SVF and WAT. (b) Metagene profile of m6A peak distribution across normalized mRNA transcripts, divided into three regions: 5′UTR, coding sequence (CDS), and 3′UTR. Exons are shown as thick boxes and introns as thin lines. (c) Genomic annotation of m6A peaks in SVF and WAT. (d) Consensus sequence motifs of m6A peaks identified by HOMER; red letters indicate the methylated adenine. (e) Abundance of m6A peaks per transcript. The bar chart shows the proportion of transcripts containing different numbers of m6A peaks. (f) Boxplot comparison of expression levels of m6A-modified versus non-m6A-modified transcripts in SVF and WAT. Statistical significance was determined using Student's t-test.
At the transcript level, m6A peaks were predominantly enriched in 3′UTRs and CDS regions in both stages, consistent with previous reports (Fig. 3b, c)[46,47]. HOMER motif analysis identified enrichment of GGACH (H = A/C/U) and DGAC (D = A/G/U) motifs, confirming successful enrichment of m6A-modified sequences (Fig. 3d)[29,46,48].
Mapping peaks to transcripts revealed 7,597 and 7,521 m6A-modified genes in SVF and WAT, respectively, with more than half containing a single m6A site (Fig. 3e). Approximately 200 lncRNAs carried m6A peaks (Supplementary Fig. S3c). Importantly, transcripts with m6A sites showed significantly higher expression levels than non-m6A-modified transcripts, and those with multiple sites were expressed at higher levels than those with a single site (Fig. 3f), consistent with the role of multiple m6A modifications in stabilizing mRNAs via IGF2BP proteins[20]. Collectively, these results highlight positional enrichment of m6A in CDS and 3′UTRs and its positive association with transcript expression.
m6A demethylation predominates in WAT and targets functional pathways
-
To assess changes in m6A methylation during porcine adipocyte differentiation, differentially methylated peaks (DMPs) between SVF and WAT (absolute fold change > 1.5, p < 0.05) were analyzed. This analysis identified 515 hyper-methylated peaks and 2,112 hypo-methylated peaks (Fig. 4a), corresponding to 230 and 1,304 genes, respectively (Fig. 4b). The predominance of hypo-methylated genes in WAT is consistent with the elevated expression of the m6A erasers FTO and ALKBH5 (Fig. 1). More than 88% of the differentially methylated genes were protein-coding, with a minority being lncRNAs (Fig. 4b). Peak annotation further revealed that hyper-methylated sites were mainly enriched in 5′UTRs, whereas hypo-methylated sites were concentrated in CDS and 3′UTR regions (Fig. 4c).
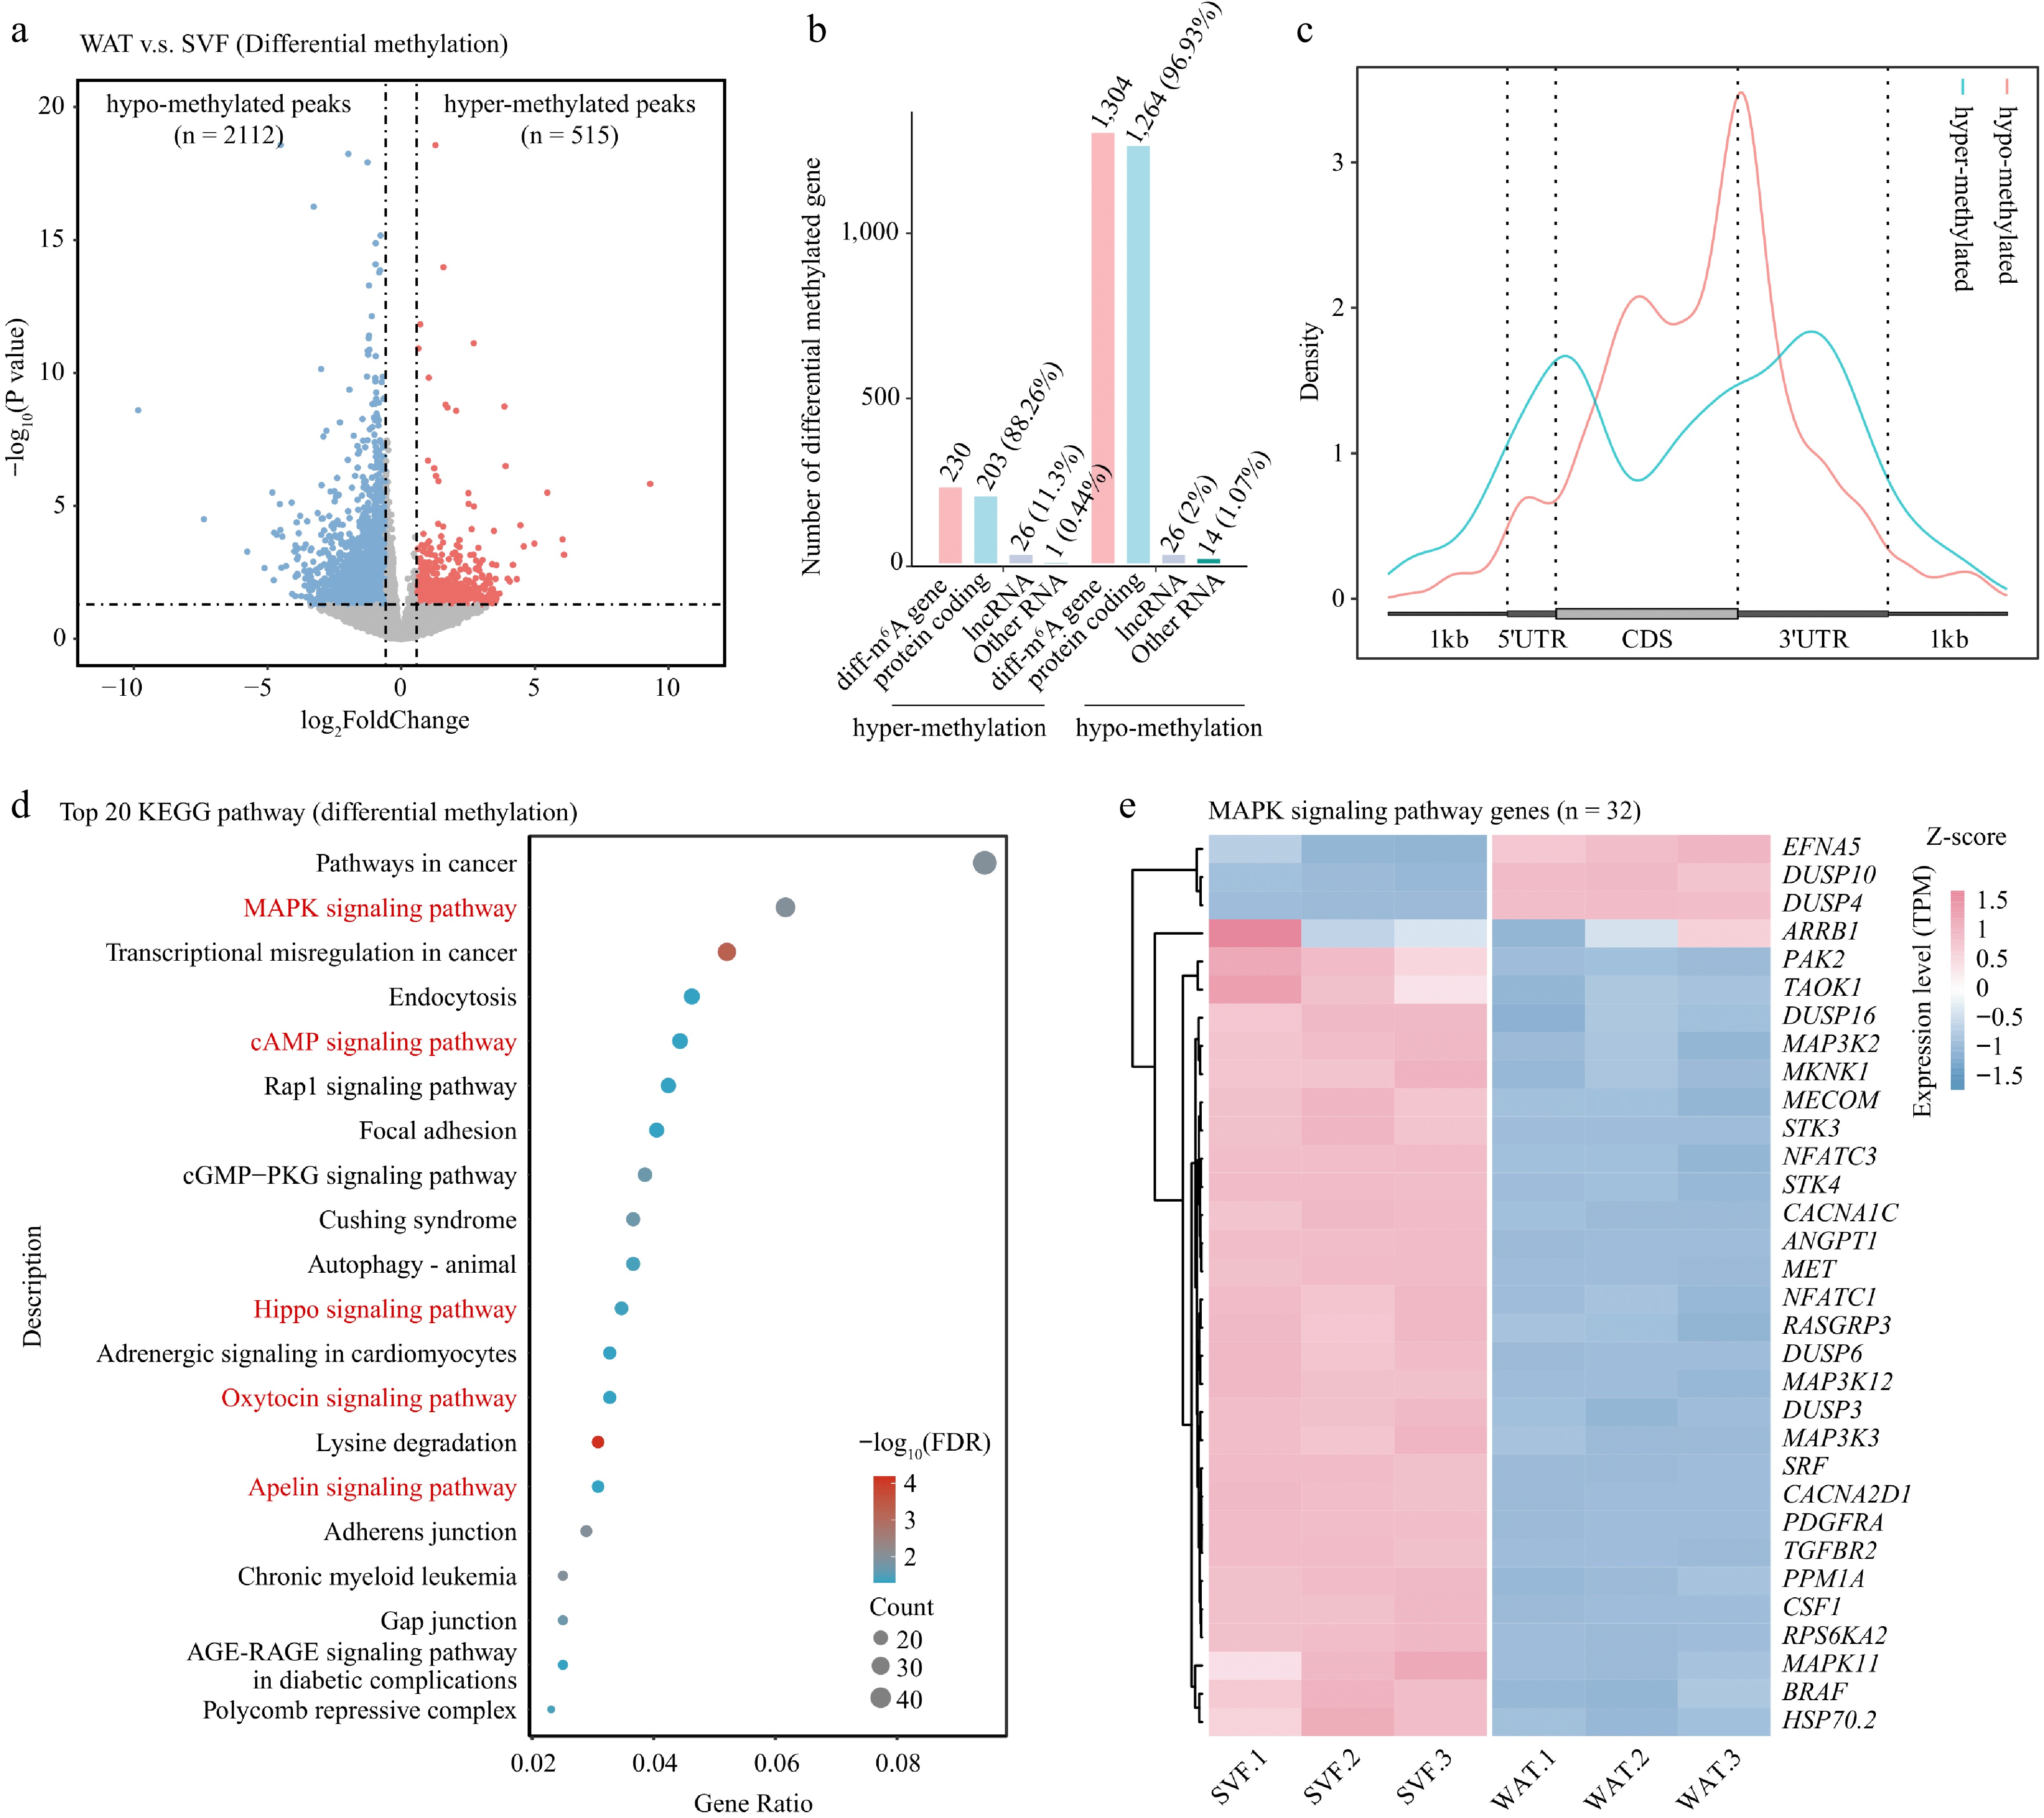
Figure 4.
Differential m6A methylation during porcine adipocyte differentiation. (a) Volcano plot showing differentially methylated m6A peaks between SVF and WAT. Hypermethylated peaks (red) and hypomethylated peaks (blue) represent significant changes, while non-significant peaks are shown in gray. Dashed lines indicate thresholds for fold change and p-value. (b) Bar plot showing the numbers and types of genes annotated from differentially methylated peaks. (c) Metagene profile of differential m6A peak distribution across normalized mRNA transcripts. (d) KEGG pathway enrichment analysis of differentially methylated genes presented as a bubble plot. (e) Heatmap of expression levels of MAPK signaling pathway genes in SVF and WAT.
KEGG functional enrichment analysis revealed differentially methylated genes were enriched in pathways including cancer, MAPK signaling, endocytosis, cAMP signaling, Hippo signaling, oxytocin signaling, and apelin signaling (Fig. 4d, e; Supplementary Fig. S4). Notably, MAPK signaling—critical in adipogenesis and lipid metabolism[49,50]—was among the most enriched categories. These results demonstrate that m6A demethylation predominates in WAT and involves pathways central to adipocyte differentiation.
m6A demethylation represses regulators of metabolism and transcription, including lipogenic genes
-
To further explore the functional impact of m6A during porcine adipocyte differentiation, transcript abundance and m6A methylation levels were cross-analyzed. Integration of methylation and expression data identified 71 hyper-up, 517 hypo-down, 43 hyper-down, and 122 hypo-up genes (Fig. 5a, Supplementary Table S3). Among 1,304 hypo-methylated genes, 39.6% were downregulated, and only 9.35% were upregulated, suggesting that demethylation destabilizes transcripts in WAT.
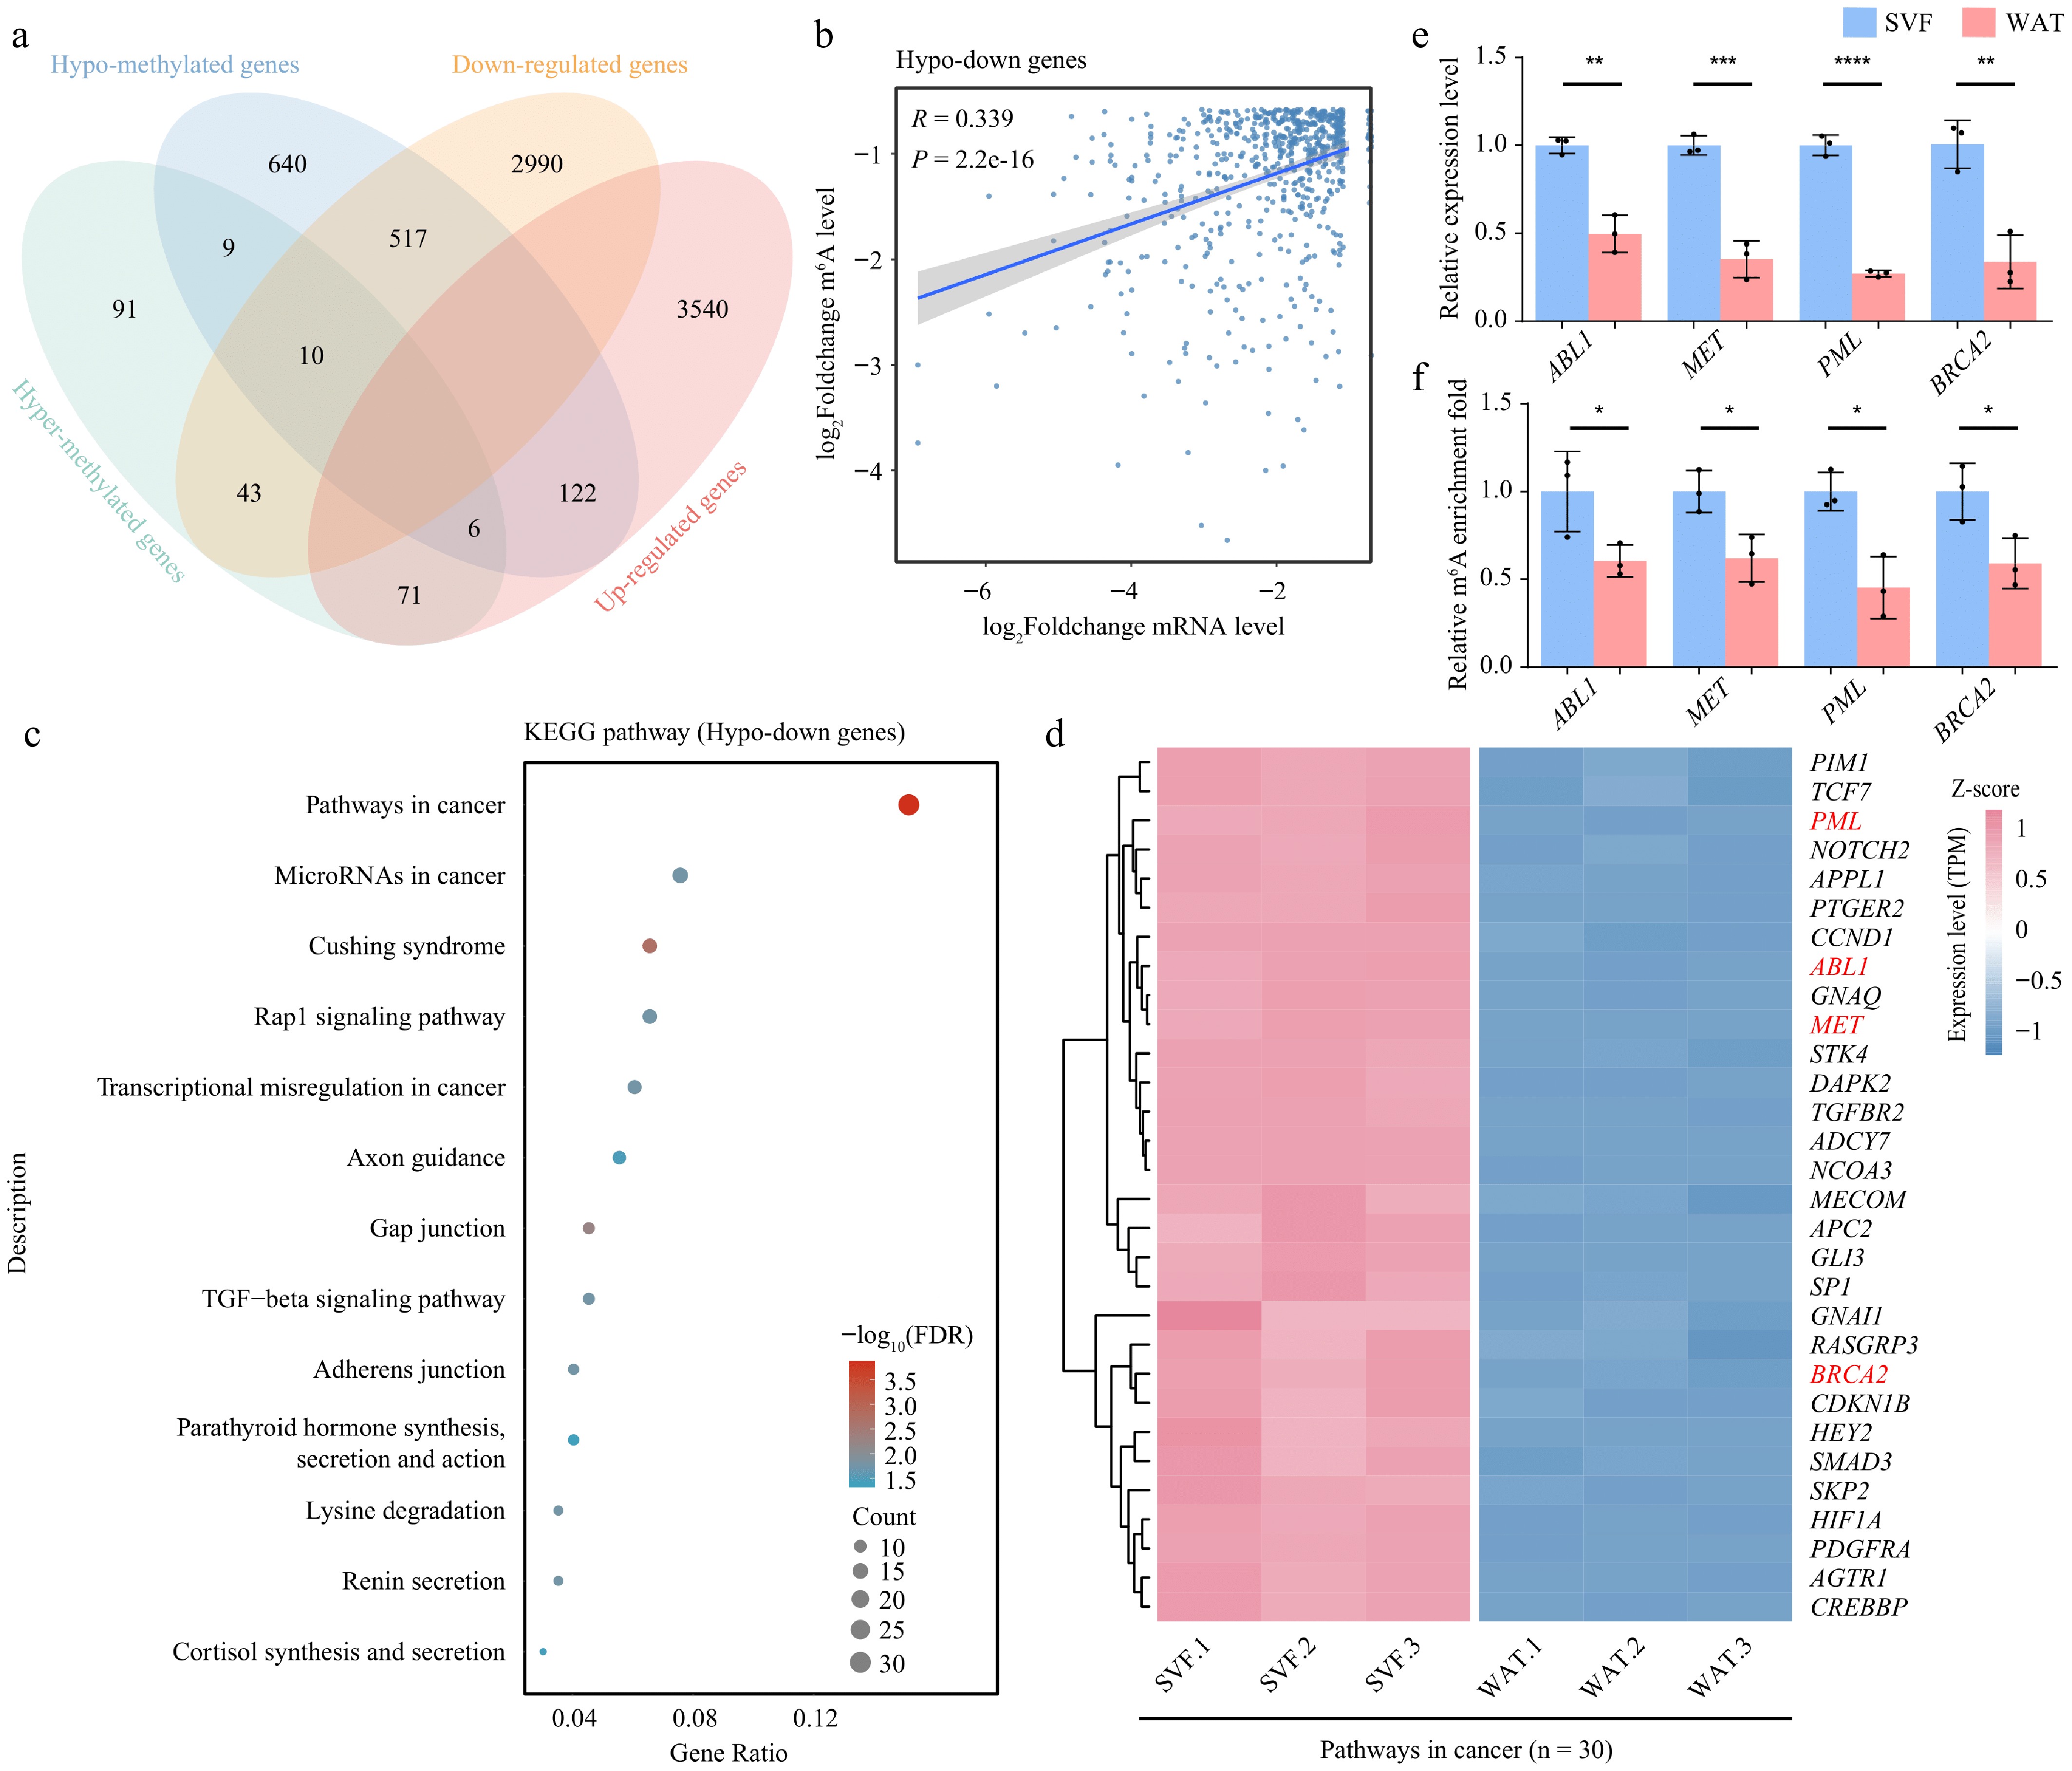
Figure 5.
m6A demethylation correlates with transcriptome reprogramming during adipocyte differentiation. (a) Venn diagram showing the overlap between differentially methylated genes and differentially expressed genes. (b) Scatter plot illustrating the correlation between fold changes in m6A modification levels and gene expression levels in hypo-down genes. Correlation was assessed using Pearson's method. (c) KEGG pathway enrichment analysis of hypo-down genes displayed as a bubble plot. (d) Heatmap of expression levels of cancer signaling pathway genes in SVF and WAT.(e) Expression levels, and (f) m6A modification levels of selected hypo-down genes. β-actin was used as the internal reference gene. Error bars represent mean ± s.d. (n = 3). Statistical significance was determined using Student's t-test relative to day 0. p < 0.05; * p < 0.01; ** p < 0.001; *** p < 0.0001; ns, not significant (p ≥ 0.05).
Correlation analysis revealed a significant positive association between expression and methylation changes, specifically in hypo-down genes (n = 517). In contrast, no significant correlation was observed in the hypo-up (n = 122), hyper-up (n = 71), and hyper-down (n = 43) categories (Fig. 5b, Supplementary Fig. S5a–S5c). The association between reduced expression and demethylation in hypo-down genes, together with elevated FTO and ALKBH5 expression, underscores the role of m6A erasers in repressing gene expression during terminal adipocyte differentiation. GO enrichment of hypo-down genes revealed enrichment in regulators of metabolic processes and DNA transcription (Supplementary Fig. S5d).
KEGG pathway analysis further showed that many hypo-down genes were enriched in cancer-related pathways. Within this cluster, genes such as ABL proto-oncogene 1 (ABL1), mesenchymal to epithelial transition factor (MET), promyelocytic leukemia nuclear body scaffold (PML), and breast cancer susceptibility gene 2 (BRCA2)—established oncogenes or therapeutic targets—were downregulated and hypo-methylated in WAT (Fig. 5c, d, Supplementary Table S3). MeRIP-qPCR and RT-qPCR validation confirmed consistent trends between expression and m6A modification levels, supporting the reliability of our sequencing data (Fig. 5e, f).
Further analysis identified several lipogenesis-related genes with altered methylation patterns. Genes such as forkhead box O3 (FOXO3), peroxisome proliferator-activated receptor delta (PPARD), fatty acid binding protein 4 (FABP4), retinol binding protein 5 (RBP5), and solute carrier family 7 member 2 (SLC7A2) were classified as hypo-up category. Two lipid metabolism genes, acetyl-CoA carboxylase alpha (ACACA), and peroxisome proliferator-activated receptor gamma (PPARG), which showed no change in m6A modification in MeRIP-seq, were used as controls. Validation by MeRIP-qPCR and RT-qPCR confirmed that FOXO3, FABP4, PPARD, and RBP5 showed reduced m6A modification, consistent with MeRIP-seq data, whereas SLC7A2 did not (Fig. 6a, b). Although some lipogenesis-related genes displayed hypo-methylation, most upregulated lipid metabolic genes did not exhibit significant changes in m6A modification. Thus, while m6A may contribute to the regulation of specific lipogenic genes, it is unlikely to be the dominant driver of their increased expression during adipocyte differentiation.
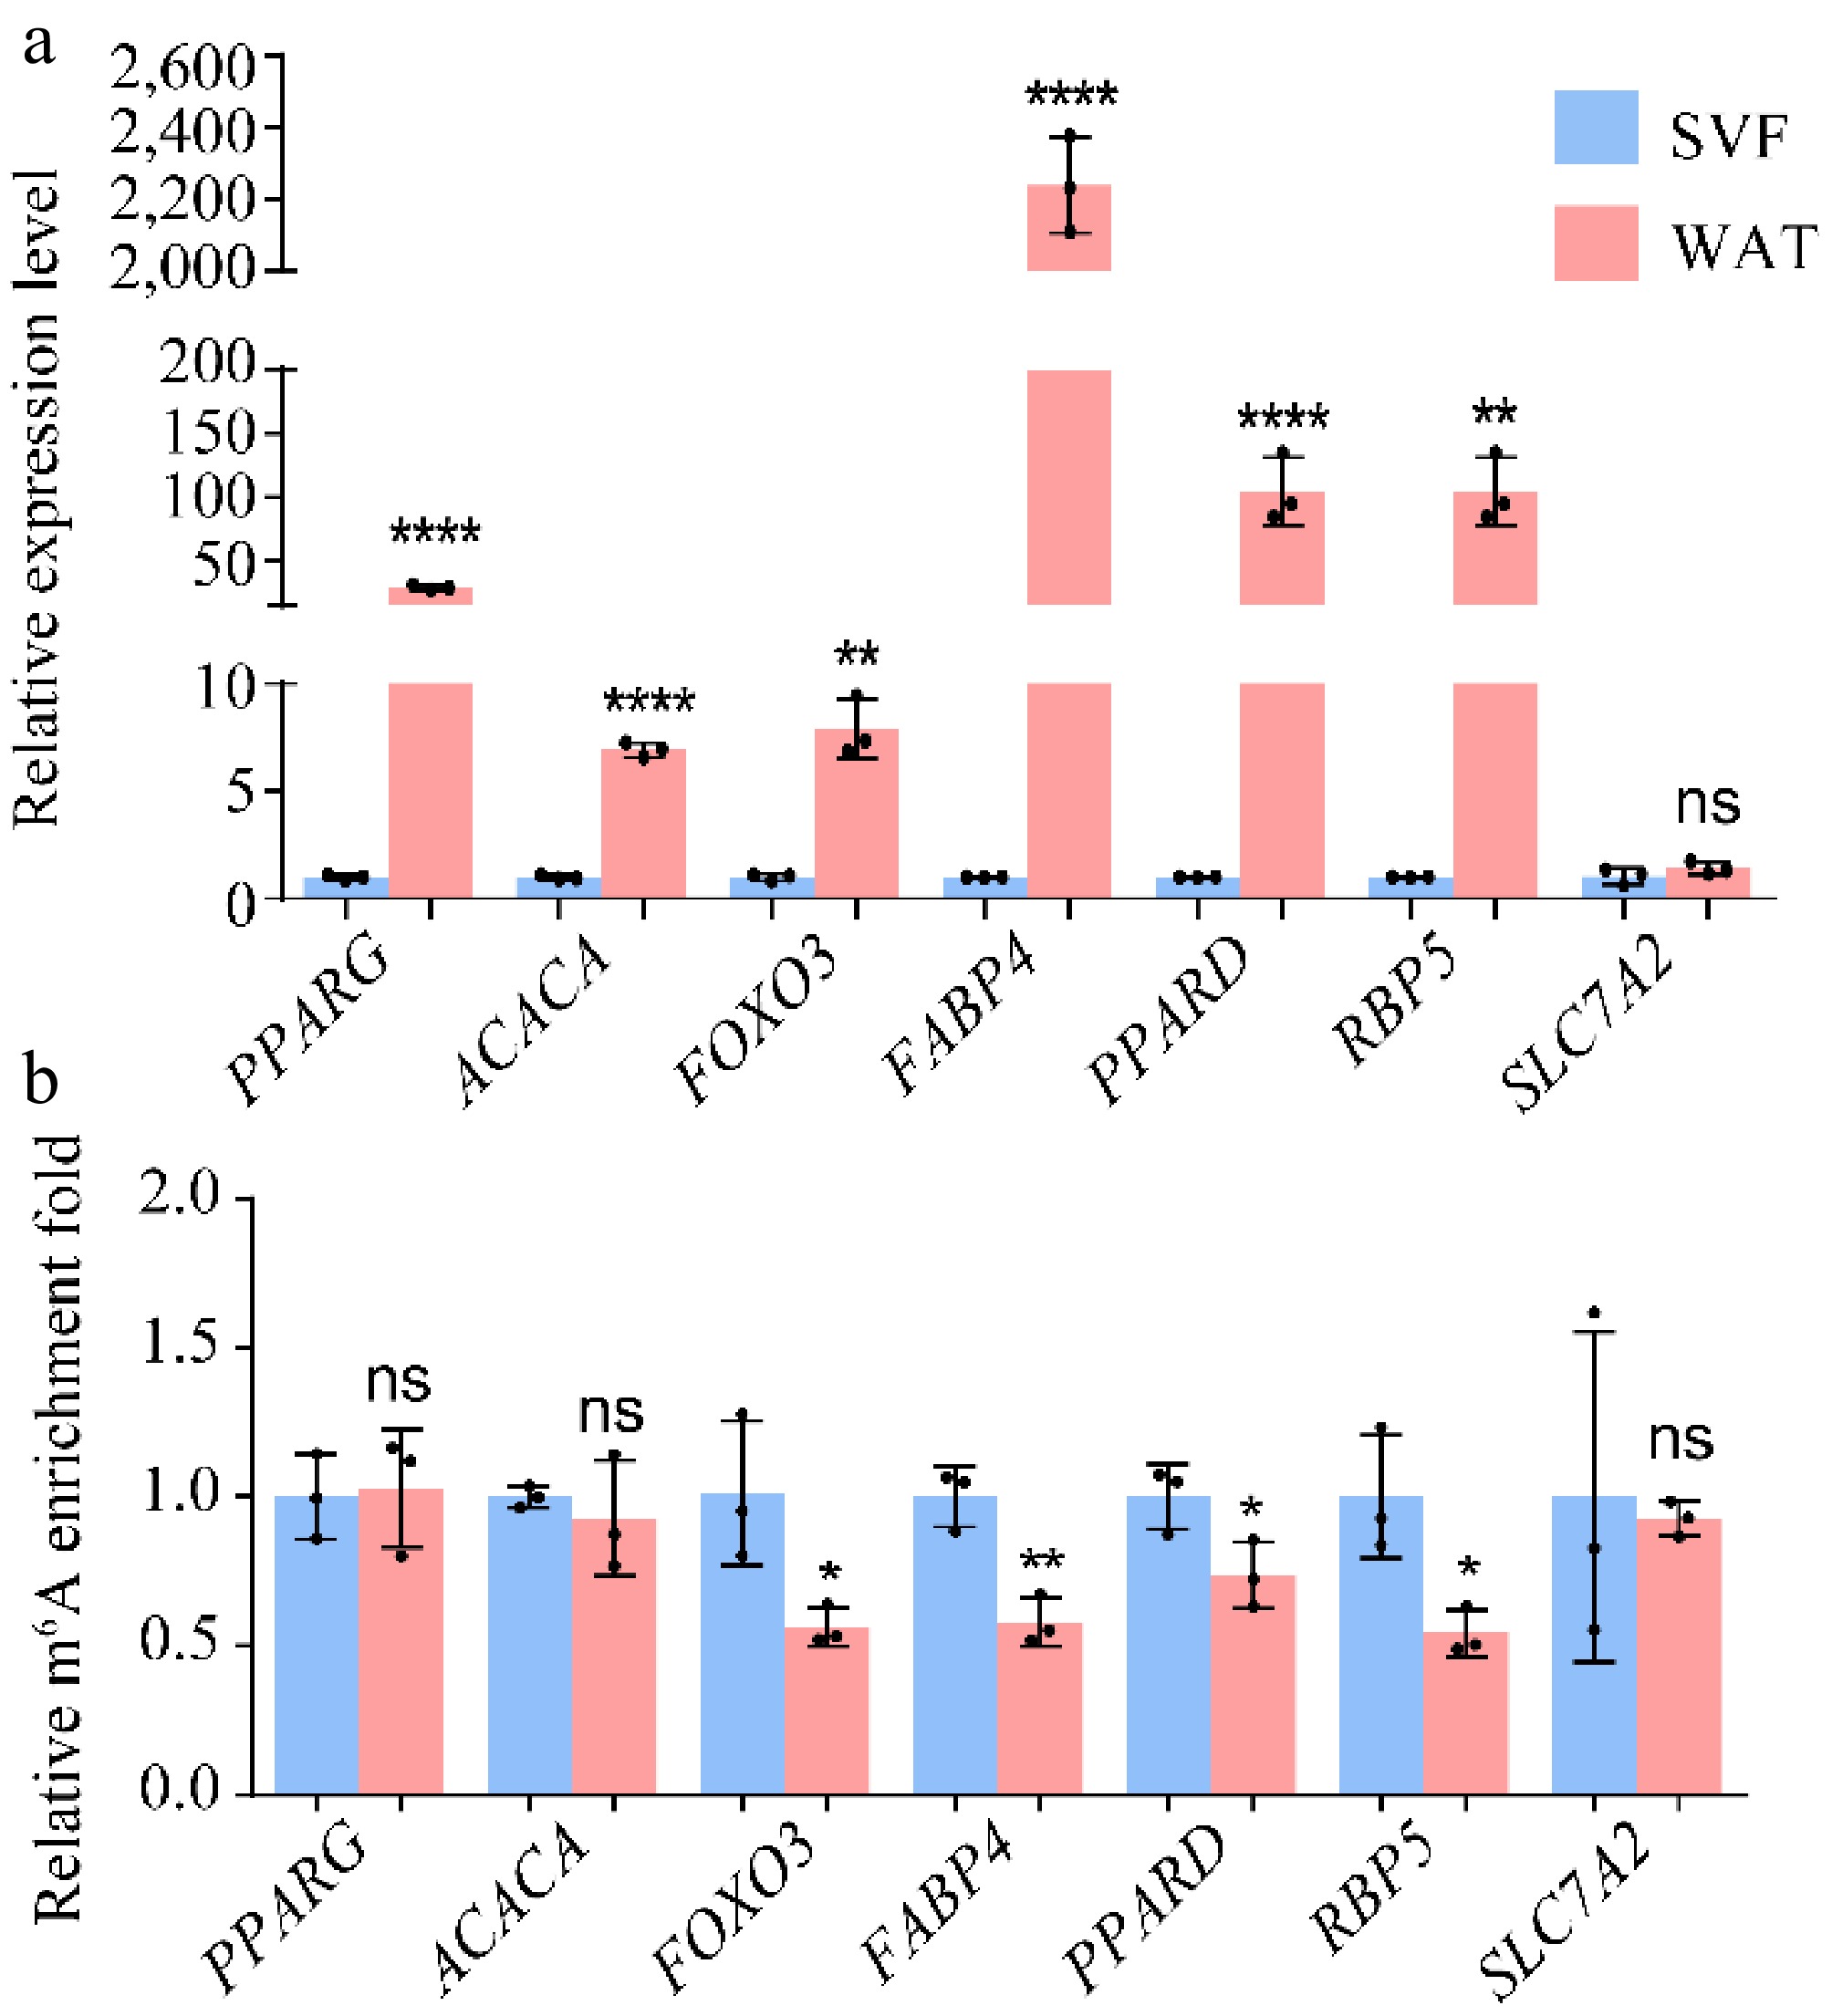
Figure 6.
(a) Expression levels and (b) m6A modification levels of hypo-up genes. β-actin was used as the internal reference gene. Error bars represent mean ± s.d. (n = 3). Statistical significance was assessed using Student's t-test relative to day 0. * p < 0.05; ** p < 0.01; *** p < 0.001; **** p < 0.0001; ns, p ≥ 0.05.
Together, these findings indicate that m6A demethylation by erasers represses regulators of metabolism and transcription in WAT, selectively affects lipogenic genes, and links adipocyte differentiation to oncogenic pathways.
-
Adipocyte differentiation and lipid metabolism are coordinated by complex transcriptional and post-transcriptional networks. The nuclear receptor peroxisome proliferator-activated receptor gamma (PPARγ), together with CCAAT/enhancer-binding protein alpha (C/EBPα) and other transcription factors, orchestrates the adipogenic transcriptional program required for terminal differentiation[45,51,52]. While numerous transcriptional regulators of adipogenesis have been identified[53], post-transcriptional regulation by m6A has recently emerged as a key layer of control. In this study, we observed stage-specific dynamics of m6A regulators: Mettl14 expression increased during adipocyte differentiation, consistent with its essential role in maintaining adipocyte viability and metabolic homeostasis[54], whereas the demethylases FTO and ALKBH5 remained highly expressed throughout differentiation, in line with their established functions in adipogenesis and lipid metabolism[55,56]. Transcriptome-wide analysis revealed that WAT is characterized by extensive m6A hypo-methylation, correlating with reduced expression of genes involved in metabolic regulation and transcription. These findings highlight m6A demethylation as a central mechanism shaping the transcriptome during porcine adipocyte differentiation, and provide mechanistic insight into adipose biology and metabolic regulation. Beyond adipogenesis, it was found that hypo-methylated and downregulated genes were significantly enriched in cancer-related pathways. Adipocytes are major stromal components that actively contribute to the tumor microenvironment by supplying energy substrates, regulating metabolism, and releasing adipokines. Cancer-associated adipocytes (CAAs) engage in reciprocal crosstalk with tumor cells, fueling growth and metastasis through free fatty acid release, fatty acid oxidation, and adipokine signaling[57−59]. The present results suggest that m6A-dependent regulation of adipogenesis may influence the abundance and activity of adipocytes in the tumor microenvironment, thereby affecting cancer progression.
To further validate the positive correlation between m6A demethylation and reduced expression of genes involved in the adipogenesis regulatory pathway and cancer-related pathway, the expression levels of these potential target genes should be quantified in FTO- or ALKBH5-knockdown cells. Moreover, assessing the adipogenic differentiation capacity of FTO- or ALKBH5-knockdown cells could further elucidate the critical regulatory role of m6A demethylation in adipogenic differentiation. In addition, overexpressing m6A methyltransferases (e.g., METTL14 or METTL16) in cells to restore the m6A levels of hypomethylated lipid metabolism-associated genes-followed by evaluating the expression of adipogenesis/metabolism-related genes and the status of adipogenic differentiation under this condition, would provide additional evidence to support the notion that m6A demethylation drives adipogenesis and metabolic reprogramming.
With the advancement of m6A editing tools, precise m6A RNA editing systems have been developed by fusing catalytically dead Cas (dCas) proteins with m6A methyltransferases (e.g., METTL3 and METTL14) or m6A demethylases (e.g., ALKBH5 and FTO)[60,61], enabling the functional characterization of individual genes. Guided by a single-guide RNA (sgRNA) targeting the gene of interest, the m6A RNA editing system can precisely recognize the target gene and mediate site-specific m6A methylation or demethylation, either in the nucleus or cytoplasm, depending on the type of fused catalytic protein. Furthermore, emerging integrated m6A editing technologies, such as adenosine-to-inosine (A-to-I) editing and dCasRx-based editing, empower researchers to dissect the functional roles of individual m6A modifications[62,63]. The present study identified a certain number of genes that exhibit significant m6A modification changes during adipogenesis and may be involved in regulating porcine adipogenesis and cancer-related pathways. These genes could serve as ideal targets for m6A RNA editing systems, providing a means to modulate porcine adipogenic differentiation or cancer cell differentiation. Targeted m6A editing of key regulators may therefore represent a promising approach for precision livestock breeding and therapeutic strategies targeting lipid metabolism in cancer.
-
m6A modification, a central mechanism of RNA epigenetic regulation in eukaryotes, plays a pivotal role in regulating physiological processes including growth, development, and metabolic homeostasis. Currently, research on m6A modification has been widely applied in the analysis of pathological mechanisms and the exploration of potential intervention targets for major human diseases, including obesity, diabetes, neurological disorders, and malignant tumors. In contrast, studies on the functional roles of m6A modification in livestock species remain limited. Using porcine adipocytes as a model, the present study systematically characterized the dynamic m6A modification landscape and reveal key candidate targets within the m6A-mediated regulatory network governing porcine fat deposition, filling the knowledge gap about m6A role in porcine adipogenesis, and implicates m6A in the functional interplay between adipose tissue and cancer, which could be used in developing m6A-based precision editing tools for trait improvement in agricultural animals and supports the advancement of epigenetic breeding strategies in animal agriculture.
This work was supported by Biological Breeding-National Science and Technology Major Project (2024ZD04077), the National Natural Science Foundation of China (NSFC U25A20678 and 32325042), Beijing Municipal Natural Science Foundation (6262020) and the Initiative Scientific Research Program, the Institute of Zoology, Chinese Academy of Sciences (2023IOZ0203 and 2024IOZ0106).
-
All procedures were reviewed and approved in advance by the Institutional Animal Care and Use Committee of the Institute of Zoology, Chinese Academy of Sciences (Beijing, China) (Approval ID: IOZ-IACUC-2021-080, Approval date: 2021.08.03). The study adhered to the principles of Replacement, Reduction, and Refinement to minimize animal suffering. Detailed information on animal housing, care, and pain management is provided to ensure that the welfare of the animals was maintained throughout the experiment.
-
The authors confirm their contributions to the paper as follows: study conception and design: Zhang X, Zhao J; methodology: Xie L, Huang J, Liu T, Liu Y; investigation: Huang J, Liu T, Liu Y; formal analysis: Xie L, Chen J; draft manuscript preparation: Xie L, Huang J, Liu T, Liu Y; writing − review and editing: Zhang X, Zhao J, Wang Q, Wang M, Chen J; funding acquisition: Zhang X, Huang J; supervision: Zhang X, Zhao J, Wang Q, Wang M, Chen J. All authors reviewed the results and approved the final version of the manuscript.
-
All data generated or analyzed in this study are included in this published article and its supplementary information files. Raw datasets are available from the corresponding authors upon reasonable request.
-
The authors declare that they have no conflict of interest.
-
# Authors contributed equally: Liqiang Xie, Juan Huang, Tianxia Liu, Yang Liu
- Supplementary Table S1 Primers used in this study.
- Supplementary Table S2 Sequencing reads statistics of MeRIP-Seq in SVF and WAT.
- Supplementary Table S3 List of diff_methylated-diff_expressed genes.
- Supplementary Fig. S1 Expression dynamics of m6A writers, erasers, and readers during porcine adipocyte differentiation.
- Supplementary Fig. S2 Transcriptomic reprogramming during porcine adipocyte differentiation.
- Supplementary Fig. S3 Transcriptome-wide distribution and features of m⁶A in porcine adipocytes.
- Supplementary Fig. S4 Differential m6A methylation during porcine adipocyte differentiation.
- Supplementary Fig. S5 m6A demethylation correlates with transcriptome reprogramming during adipocyte differentiation.
- Copyright: © 2026 by the author(s). Published by Maximum Academic Press, Fayetteville, GA. This article is an open access article distributed under Creative Commons Attribution License (CC BY 4.0), visit https://creativecommons.org/licenses/by/4.0/.
-
About this article
Cite this article
Xie L, Huang J, Liu T, Liu Y, Wang Q, et al. 2026. m6A-mediated epitranscriptomic remodeling coordinates lipid metabolism and transcriptional networks during porcine adipocyte differentiation. Epigenetics Insights 19: e002 doi: 10.48130/epi-0025-0016 

m6A-mediated epitranscriptomic remodeling coordinates lipid metabolism and transcriptional networks during porcine adipocyte differentiation
- Received: 25 September 2025
- Revised: 10 November 2025
- Accepted: 02 December 2025
- Published online: 27 January 2026
Abstract: N6-methyladenosine (m6A) is the predominant internal modification occurring within RNA molecules, but its role in porcine adipogenesis remains poorly understood. A high-quality transcriptome-wide m6A methylation map was therefore generated, and the m6A regulator expression pattern profiled during the differentiation of stromal vascular fraction cells into white adipocytes. It was found that the demethylases FTO and ALKBH5 were highly expressed in mature adipocytes, accompanied by widespread m6A hypo-methylation. The hypo-methylated gene set was enriched with regulators of metabolism and transcription, and their downregulation suggests that demethylation contributes to transcriptional repression during terminal differentiation. Notably, many hypo-methylated and downregulated genes overlapped with cancer-related pathways, including therapeutic targets such as ABL1, BRCA2, MET, and PML. MeRIP-qPCR and RT-qPCR validation confirmed these trends. Together, the present findings demonstrate that m6A demethylation reshapes gene expression to regulate porcine adipocyte differentiation and provides insights into the potential crosstalk between lipid metabolism and oncogenic signaling.
-
Key words:
- m6A /
- Porcine adipocyte differentiation /
- White adipose tissue /
- Transcriptome /
- RNA methylation