-
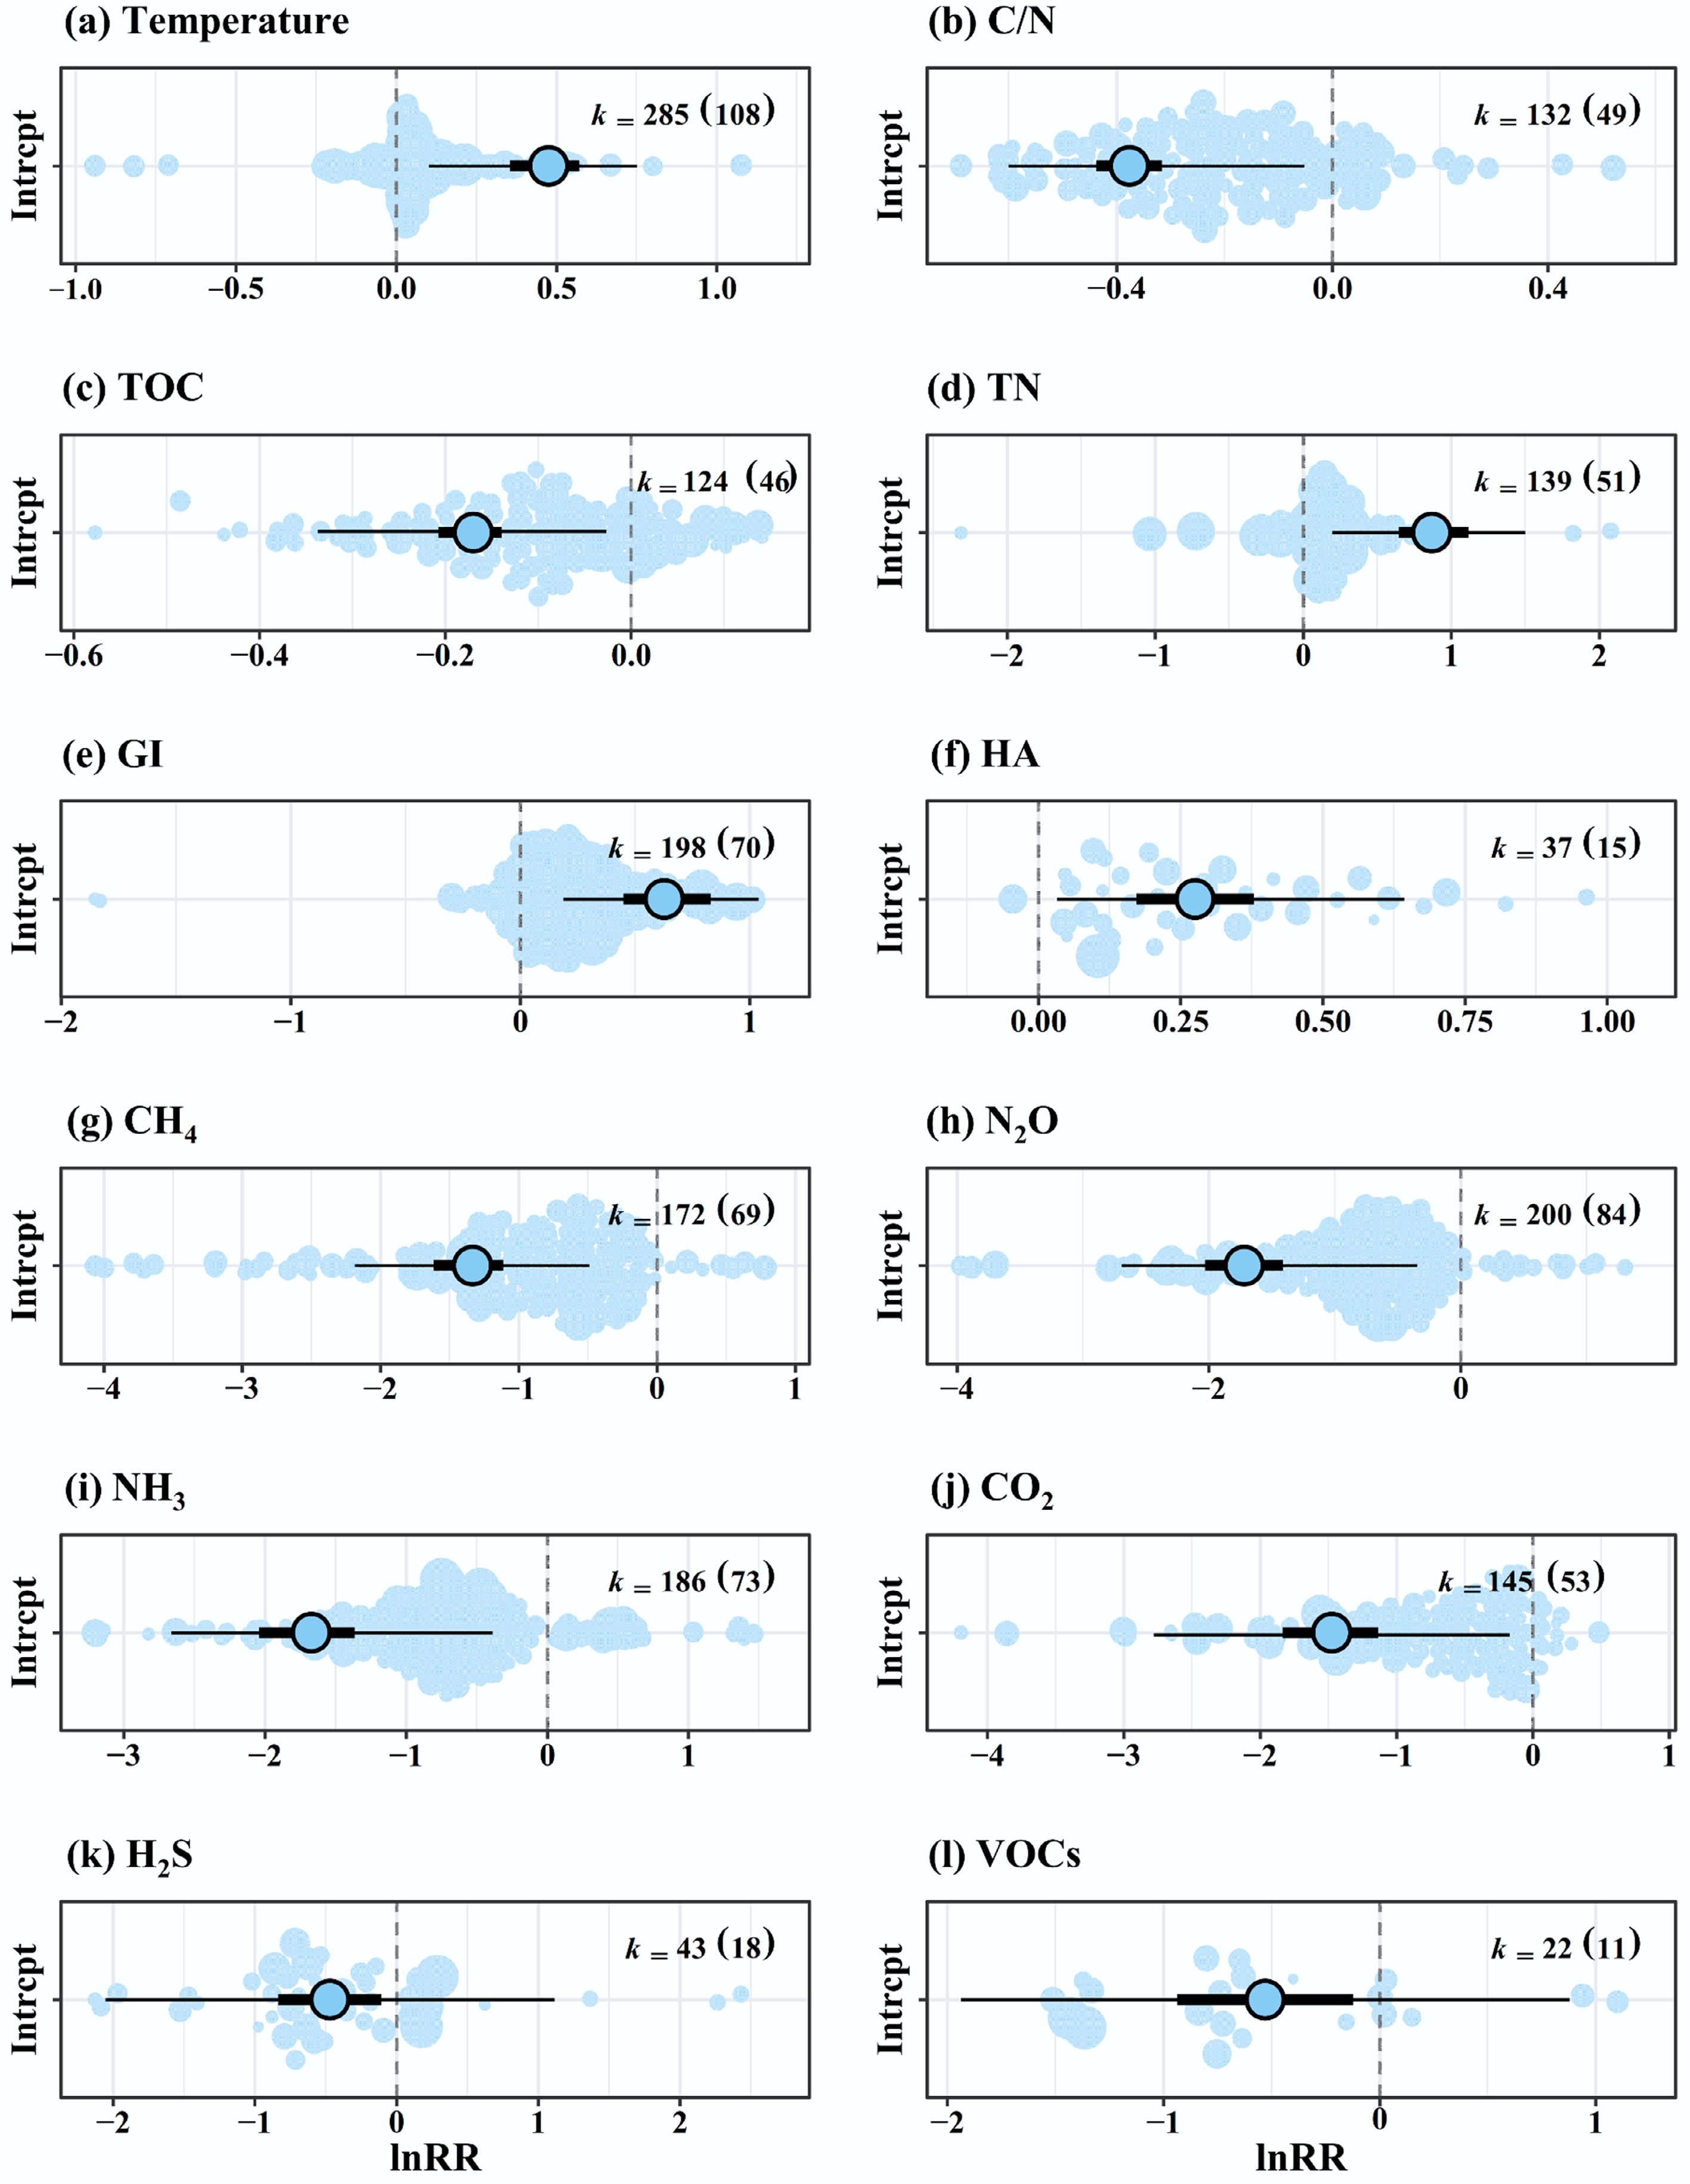
Figure 1.
Orchard plots showing the mean log response ratios (InRR), 95% prediction intervals (PIs) (fine line), 95% confidence intervals (CIs) (bold line), and individual effect sizes (black dots) for various moderator categories of physicochemical parameters (temperature, C : N ratio, and TOC), organic fertilizer quality (TN, GI, and HA), and GHGs (CH4, N2O, NH3, CO2, and H2S), and VOC emissions following different control measures. k indicates the number of effect sizes per estimate, with the number of related studies in brackets. A 95% CI that does not cross zero indicates a statistically significant difference between the treatment and control groups in composting.
-
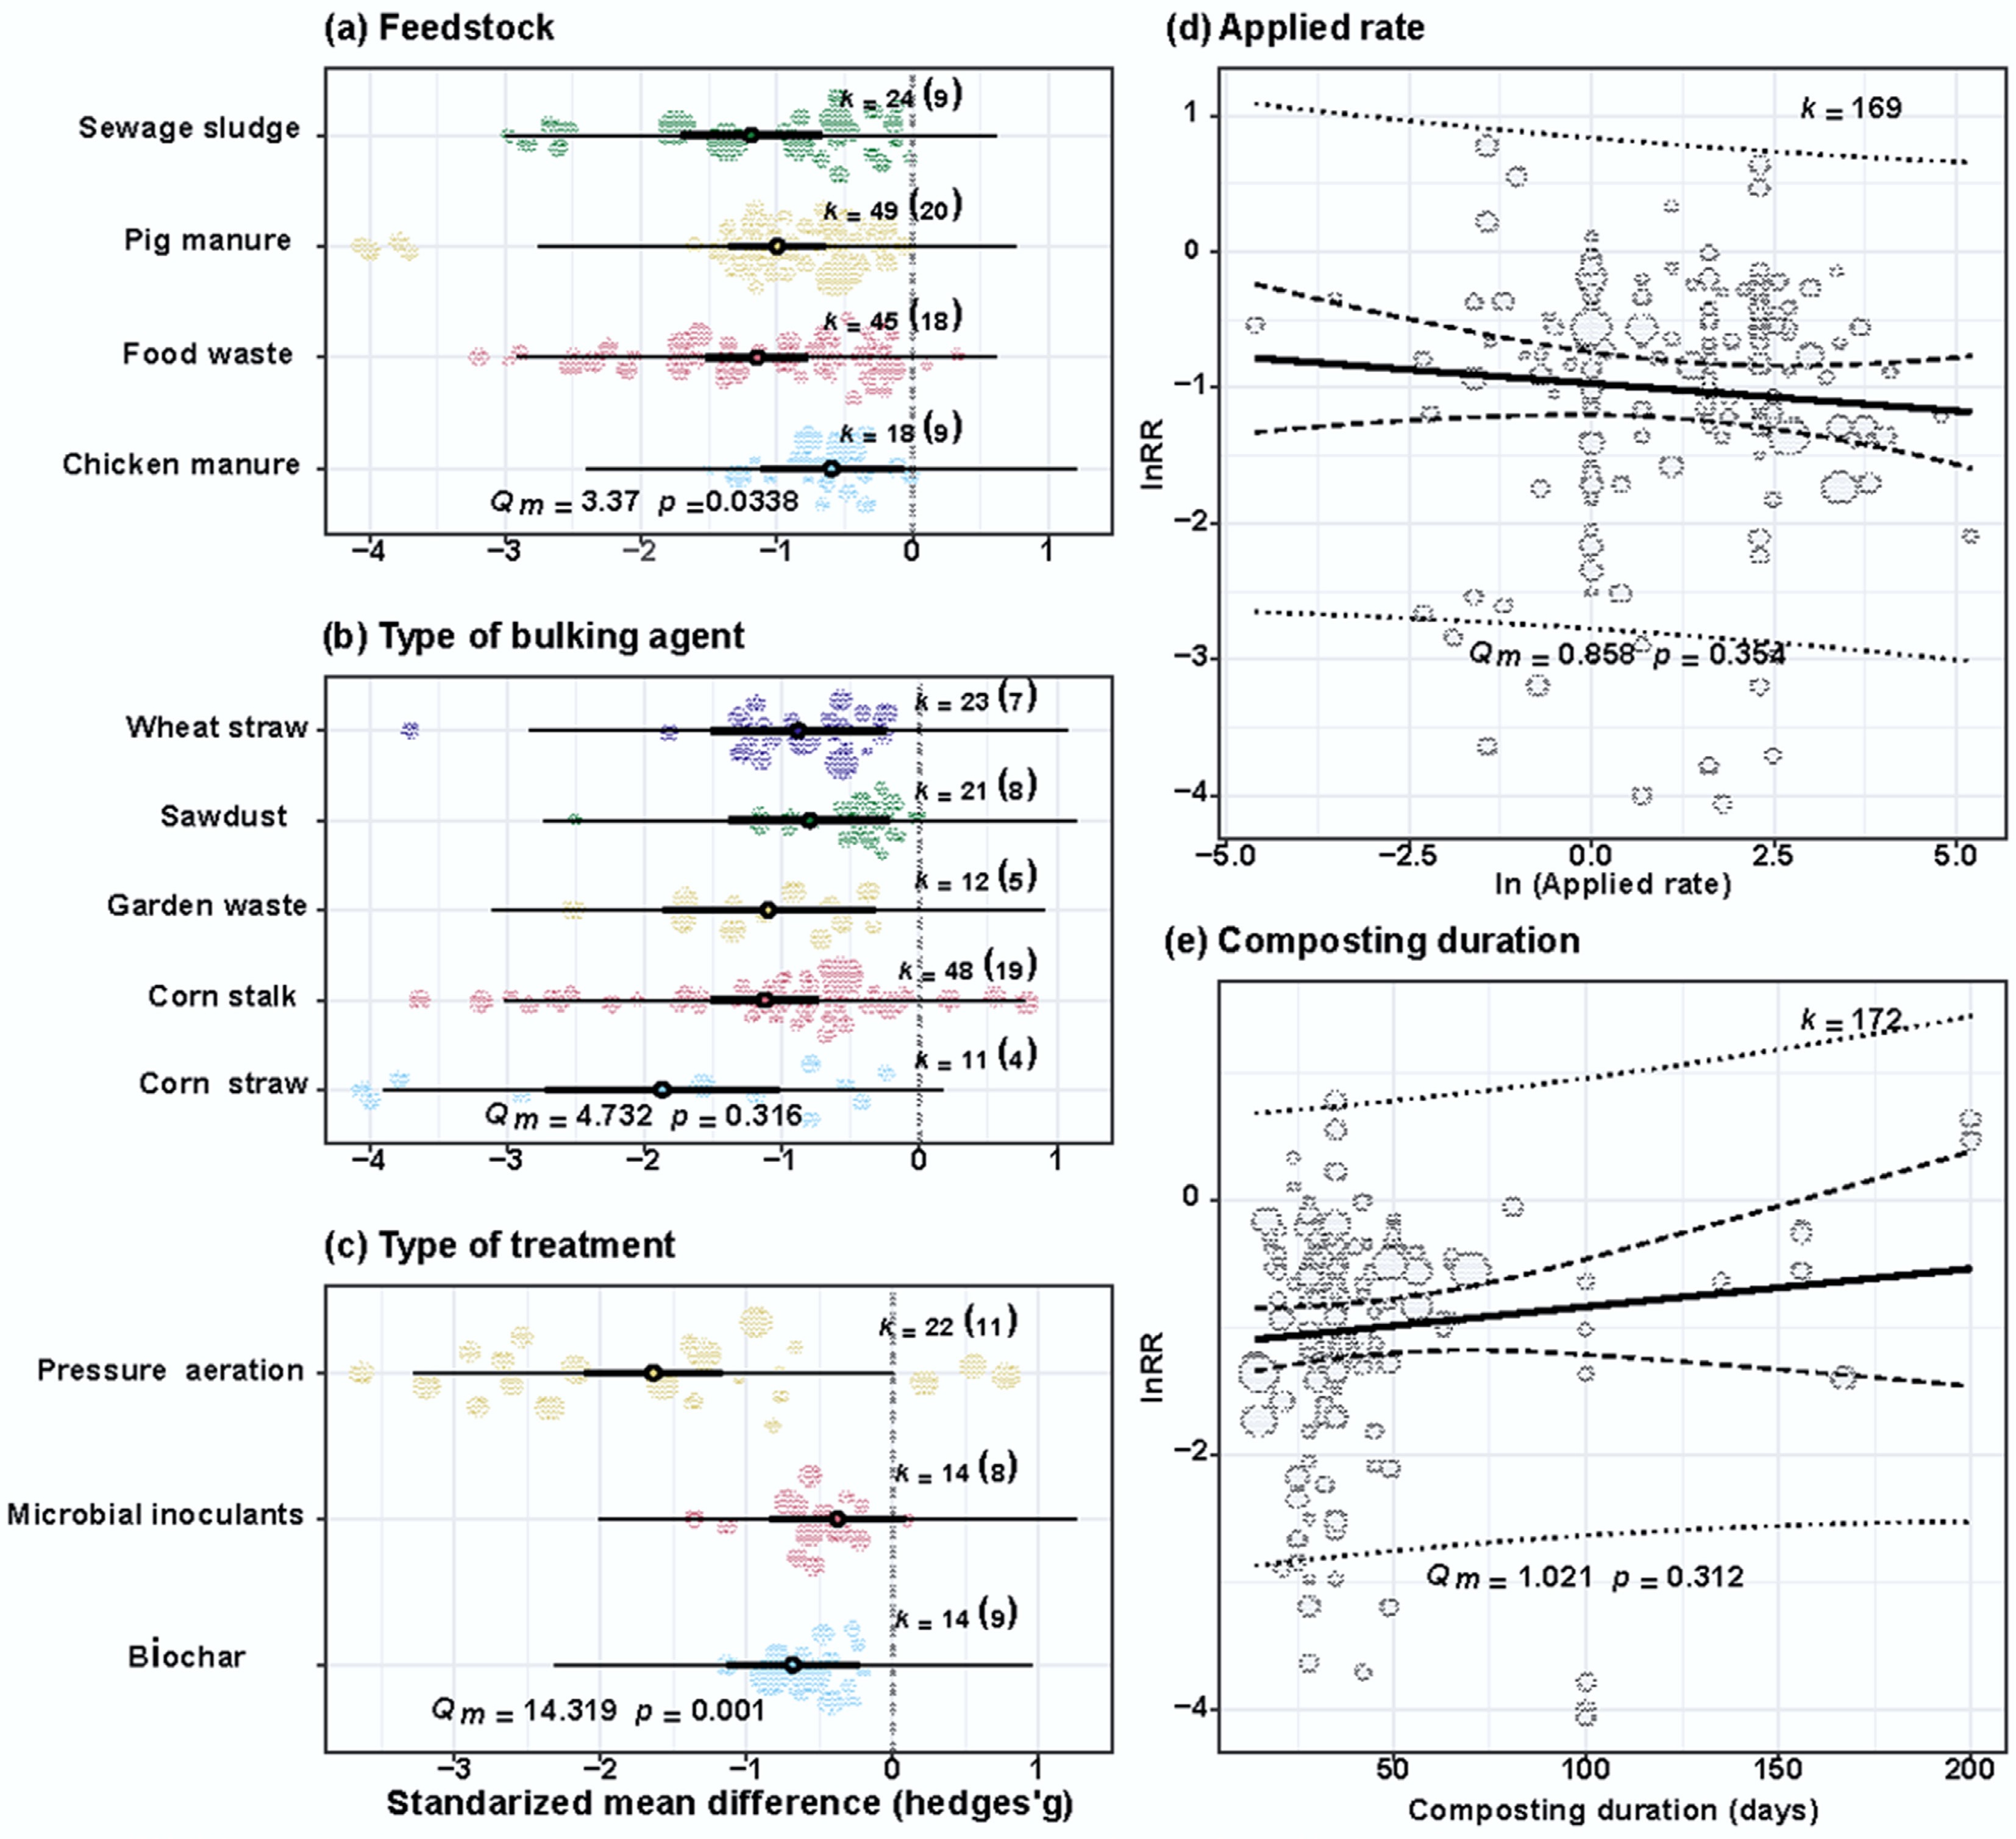
Figure 2.
Impact of moderators on CH4 emission reduction during composting, demonstrating significant mitigation effects (95% CI not overlapping with zero). This figure presents standardized mean differences (Hedges' g) across (a) composting feedstock, (b) bulking agent types, and (c) treatment types, along with the predicted response of effect size to (d) applied rate, and (e) composting duration. k: number of effect sizes; brackets: number of articles; p < 0.05 for significance.
-
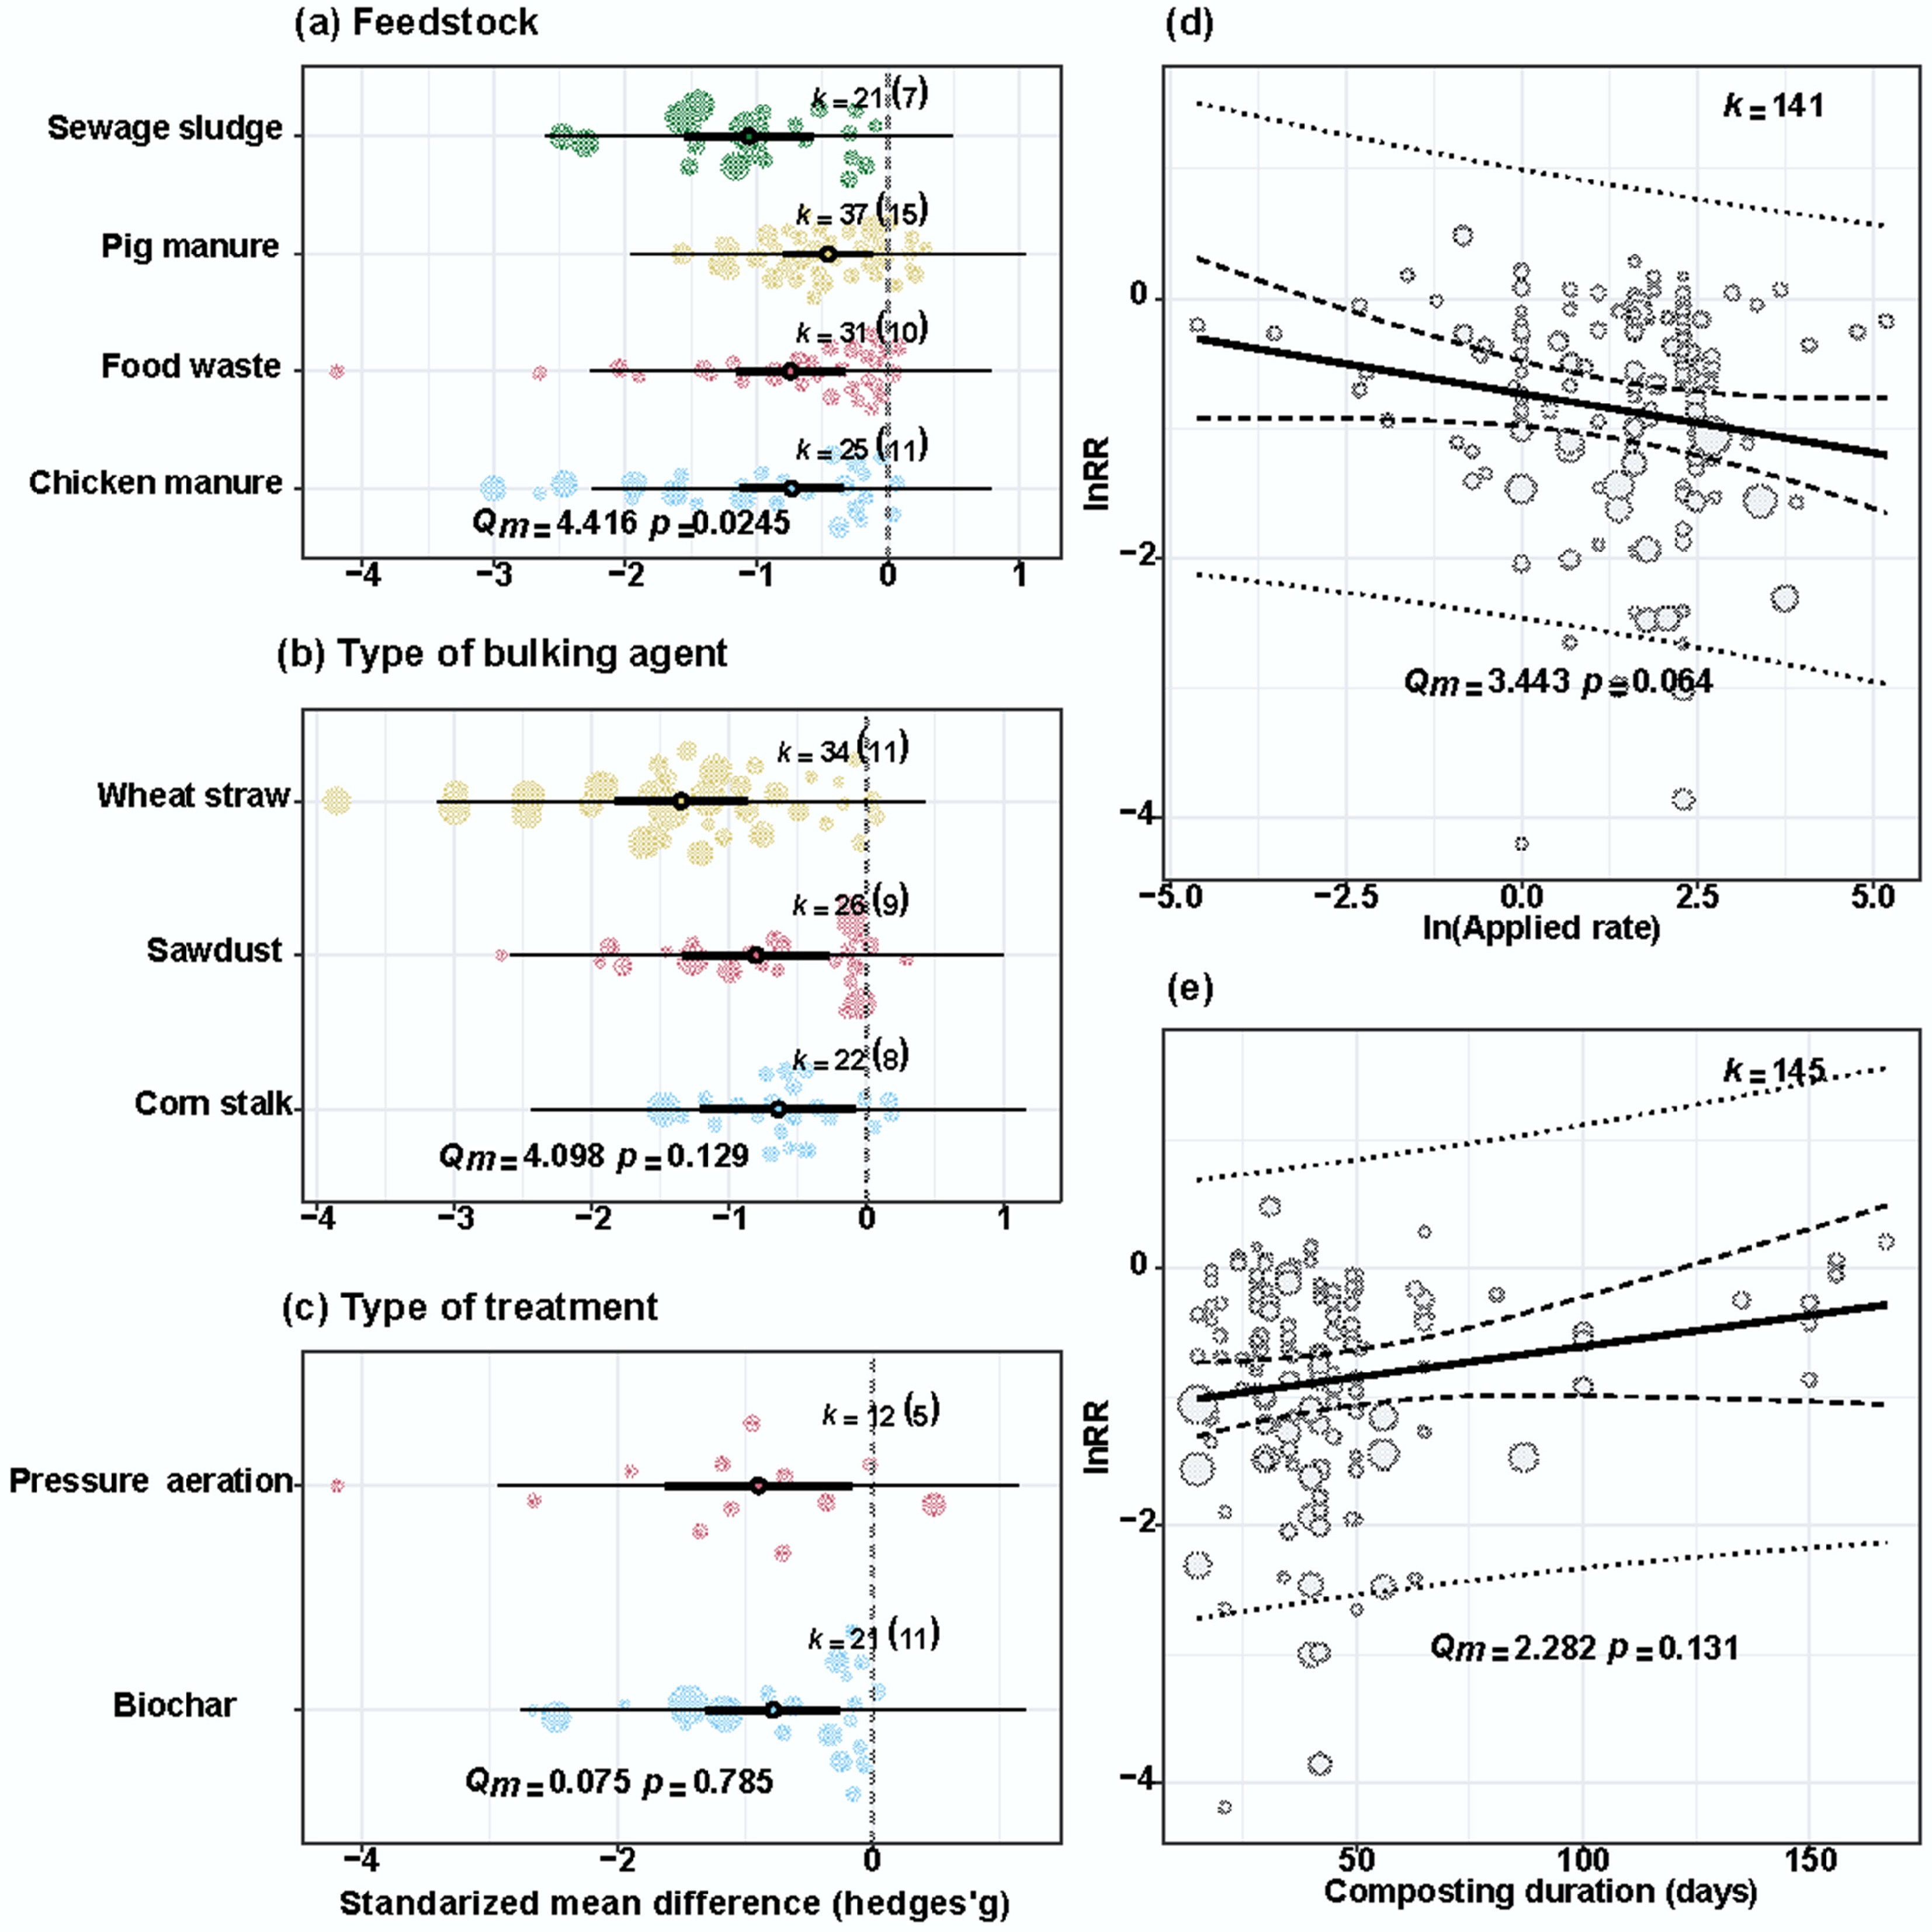
Figure 3.
Impact of moderators on CO2 emission reduction during composting, demonstrating significant mitigation effects (95% CI not overlapping with zero). This figure presents standardized mean differences (Hedges' g) across (a) composting feedstock, (b) bulking agent types, and (c) treatment types, along with the predicted response of effect size to (d) applied rate, and (e) composting duration. k: number of effect sizes; brackets: number of articles; p < 0.05 for significance.
-
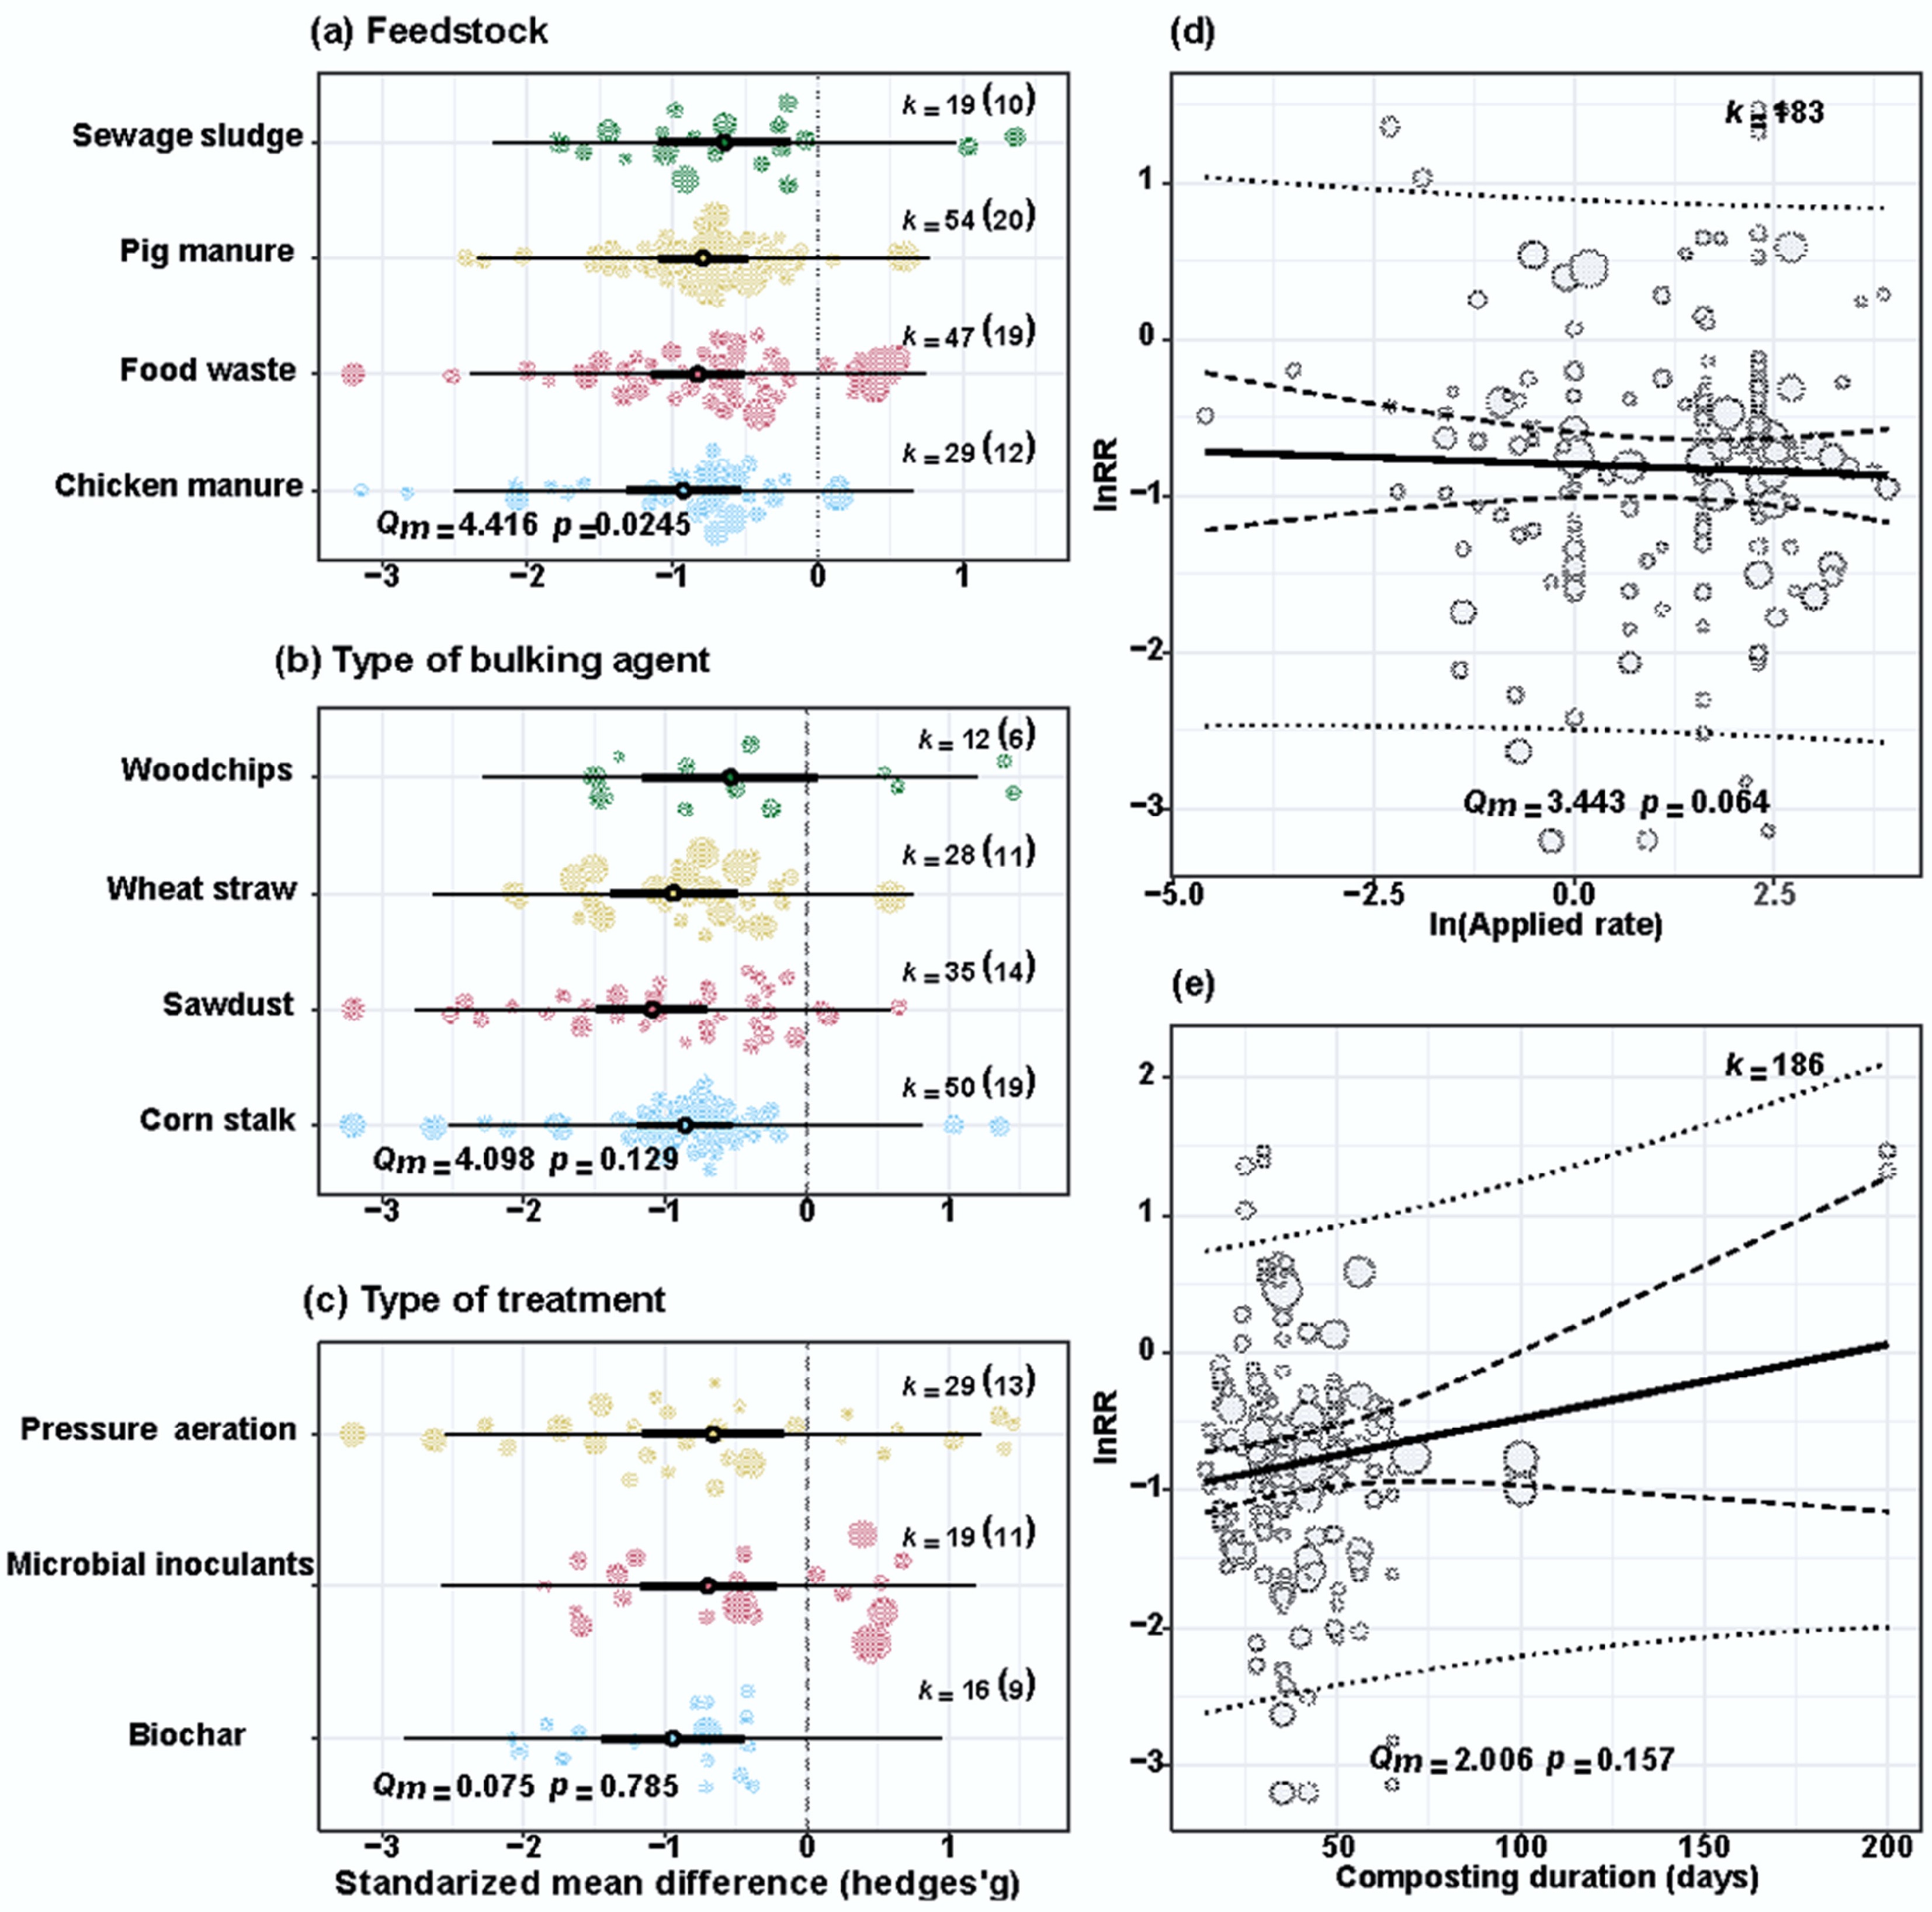
Figure 4.
Impact of moderators on NH3 emission reduction during composting, demonstrating significant mitigation effects (95% CI not overlapping with zero). This figure presents standardized mean differences (Hedges' g) across (a) composting feedstock, (b) bulking agent types, and (c) treatment types, along with the predicted response of effect size to (d) applied rate, and (e) composting duration. k: number of effect sizes; brackets: number of articles; p < 0.05 for significance.
-
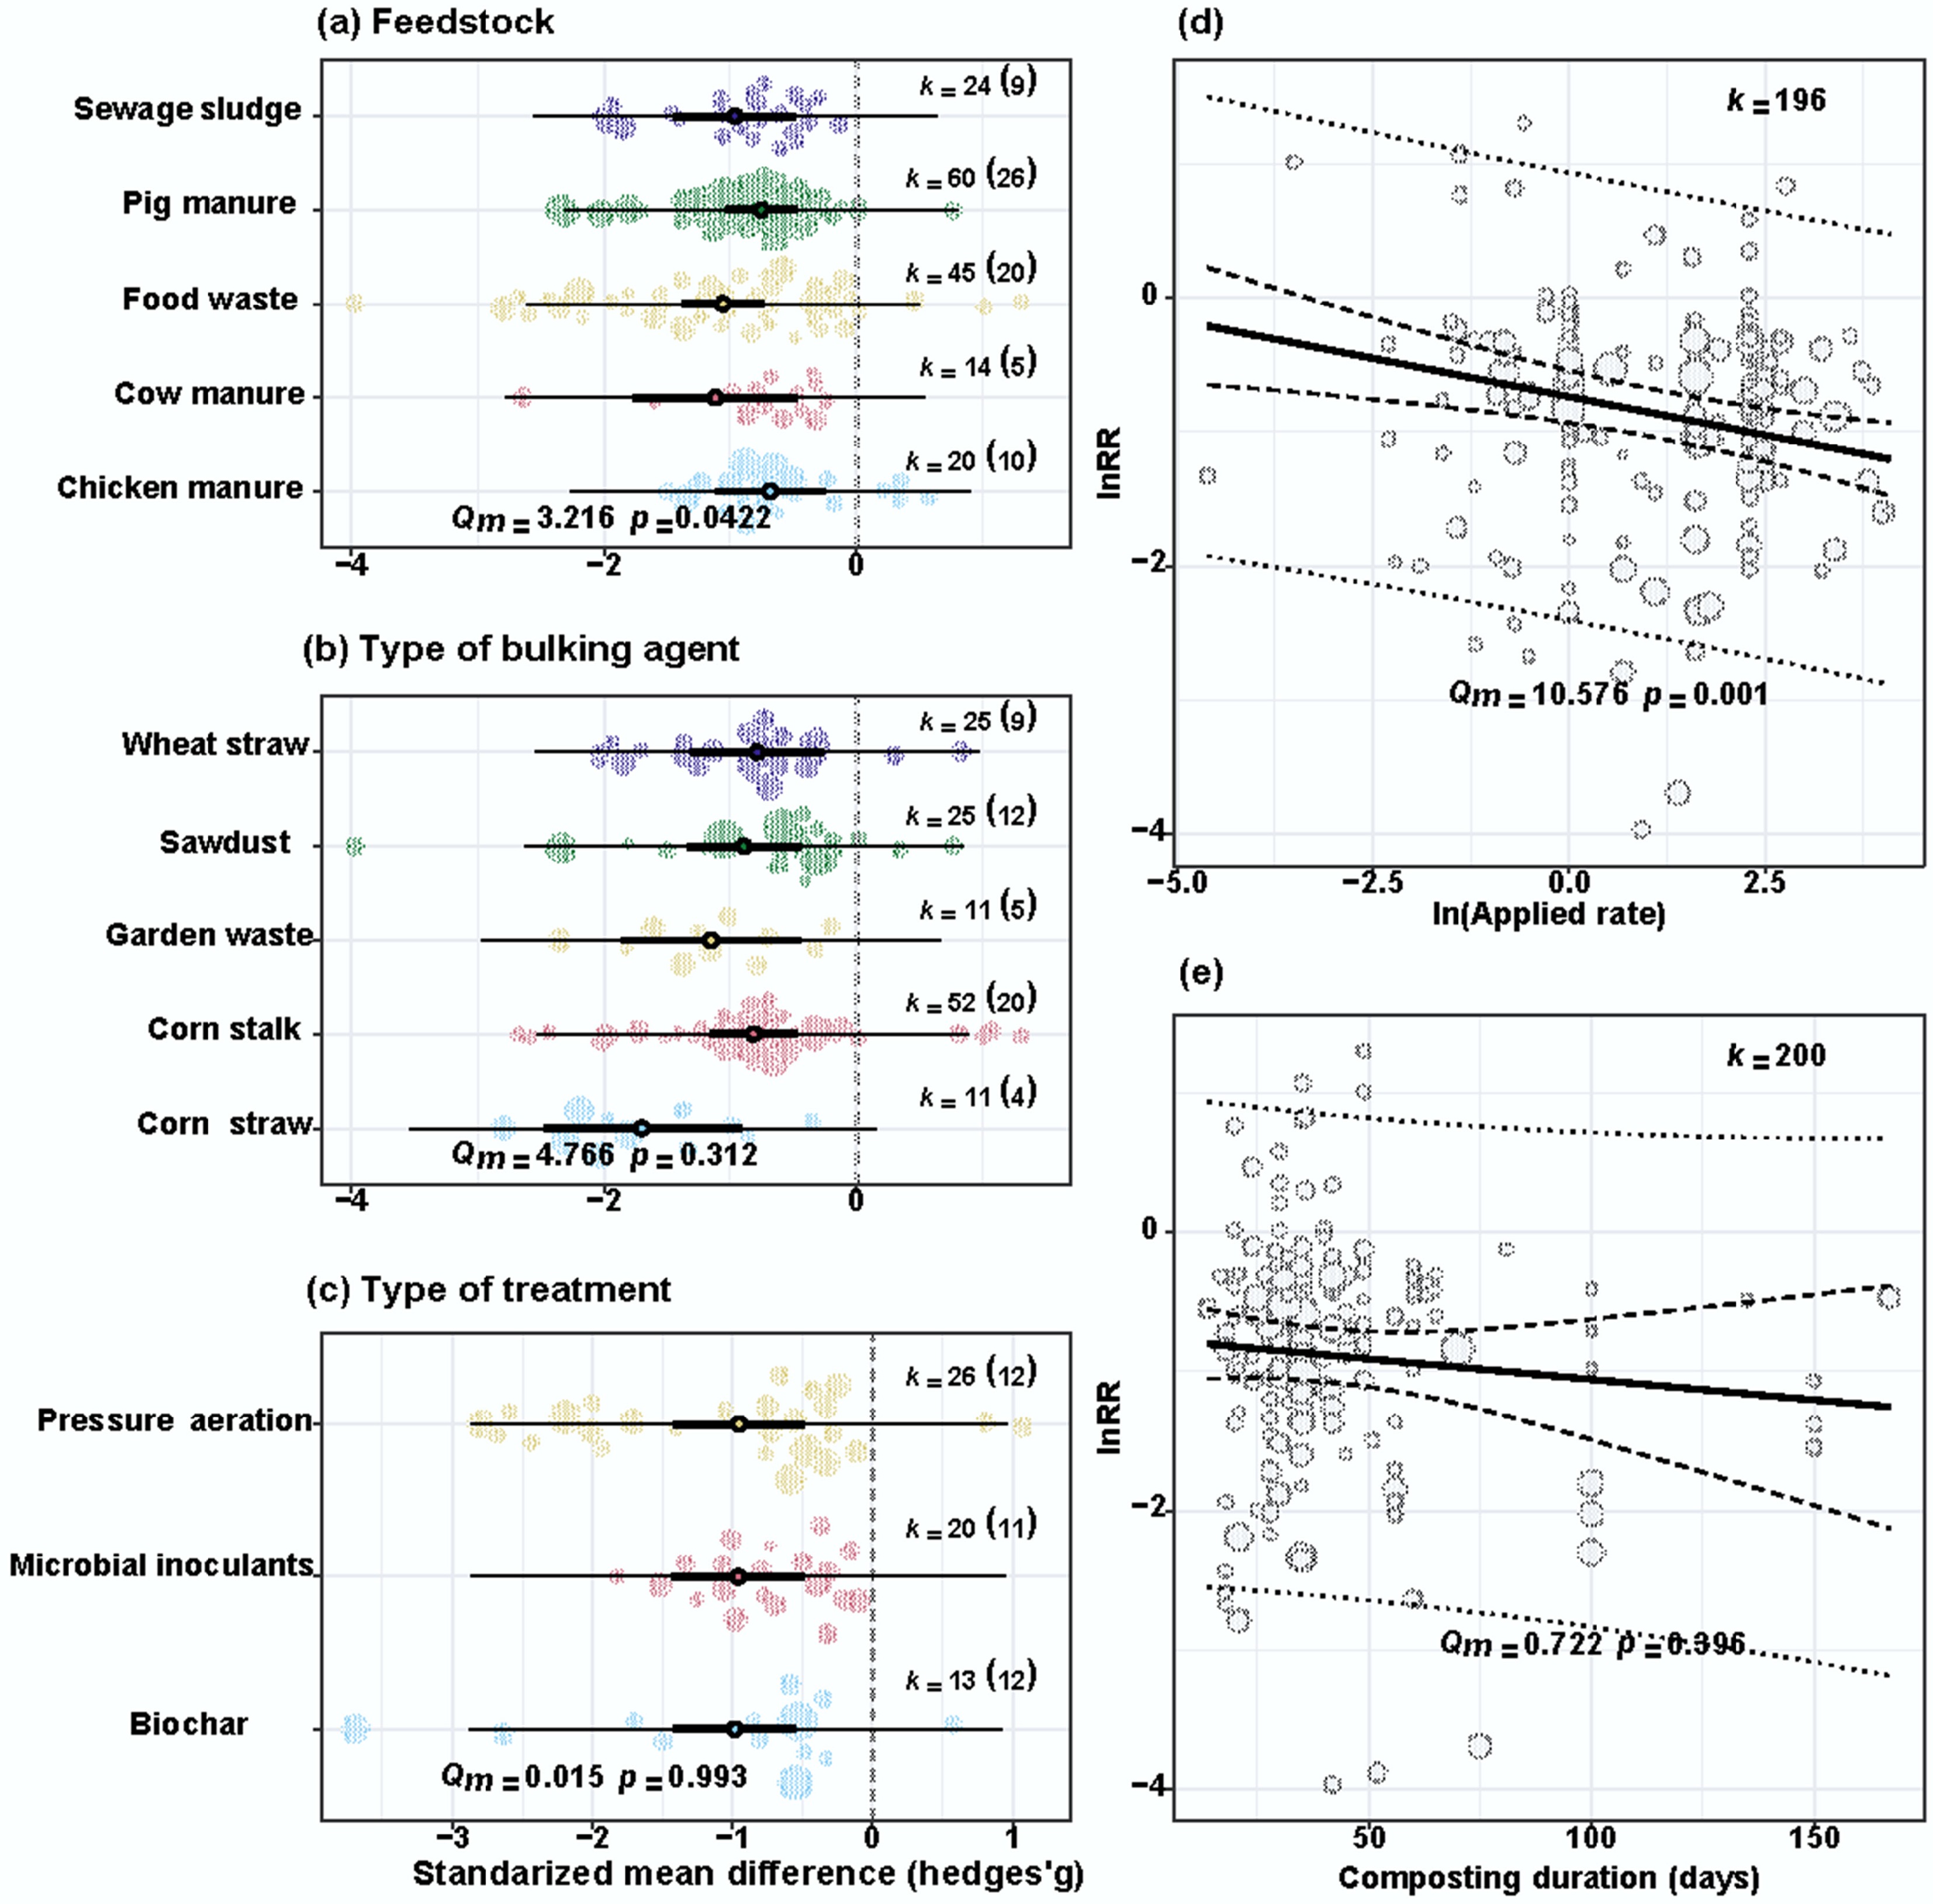
Figure 5.
Impact of moderators on N2O emission reduction during composting, demonstrating significant mitigation effects (95% CI not overlapping with zero). This figure presents standardized mean differences (Hedges' g) across (a) composting feedstock, (b) bulking agent types, and (c) treatment types, along with the predicted response of effect size to (d) applied rate, and (e) composting duration. N2O often shows the most significant mitigation effects, underscoring its importance. k: number of effect sizes; brackets: number of articles; p < 0.05 for significance.
-
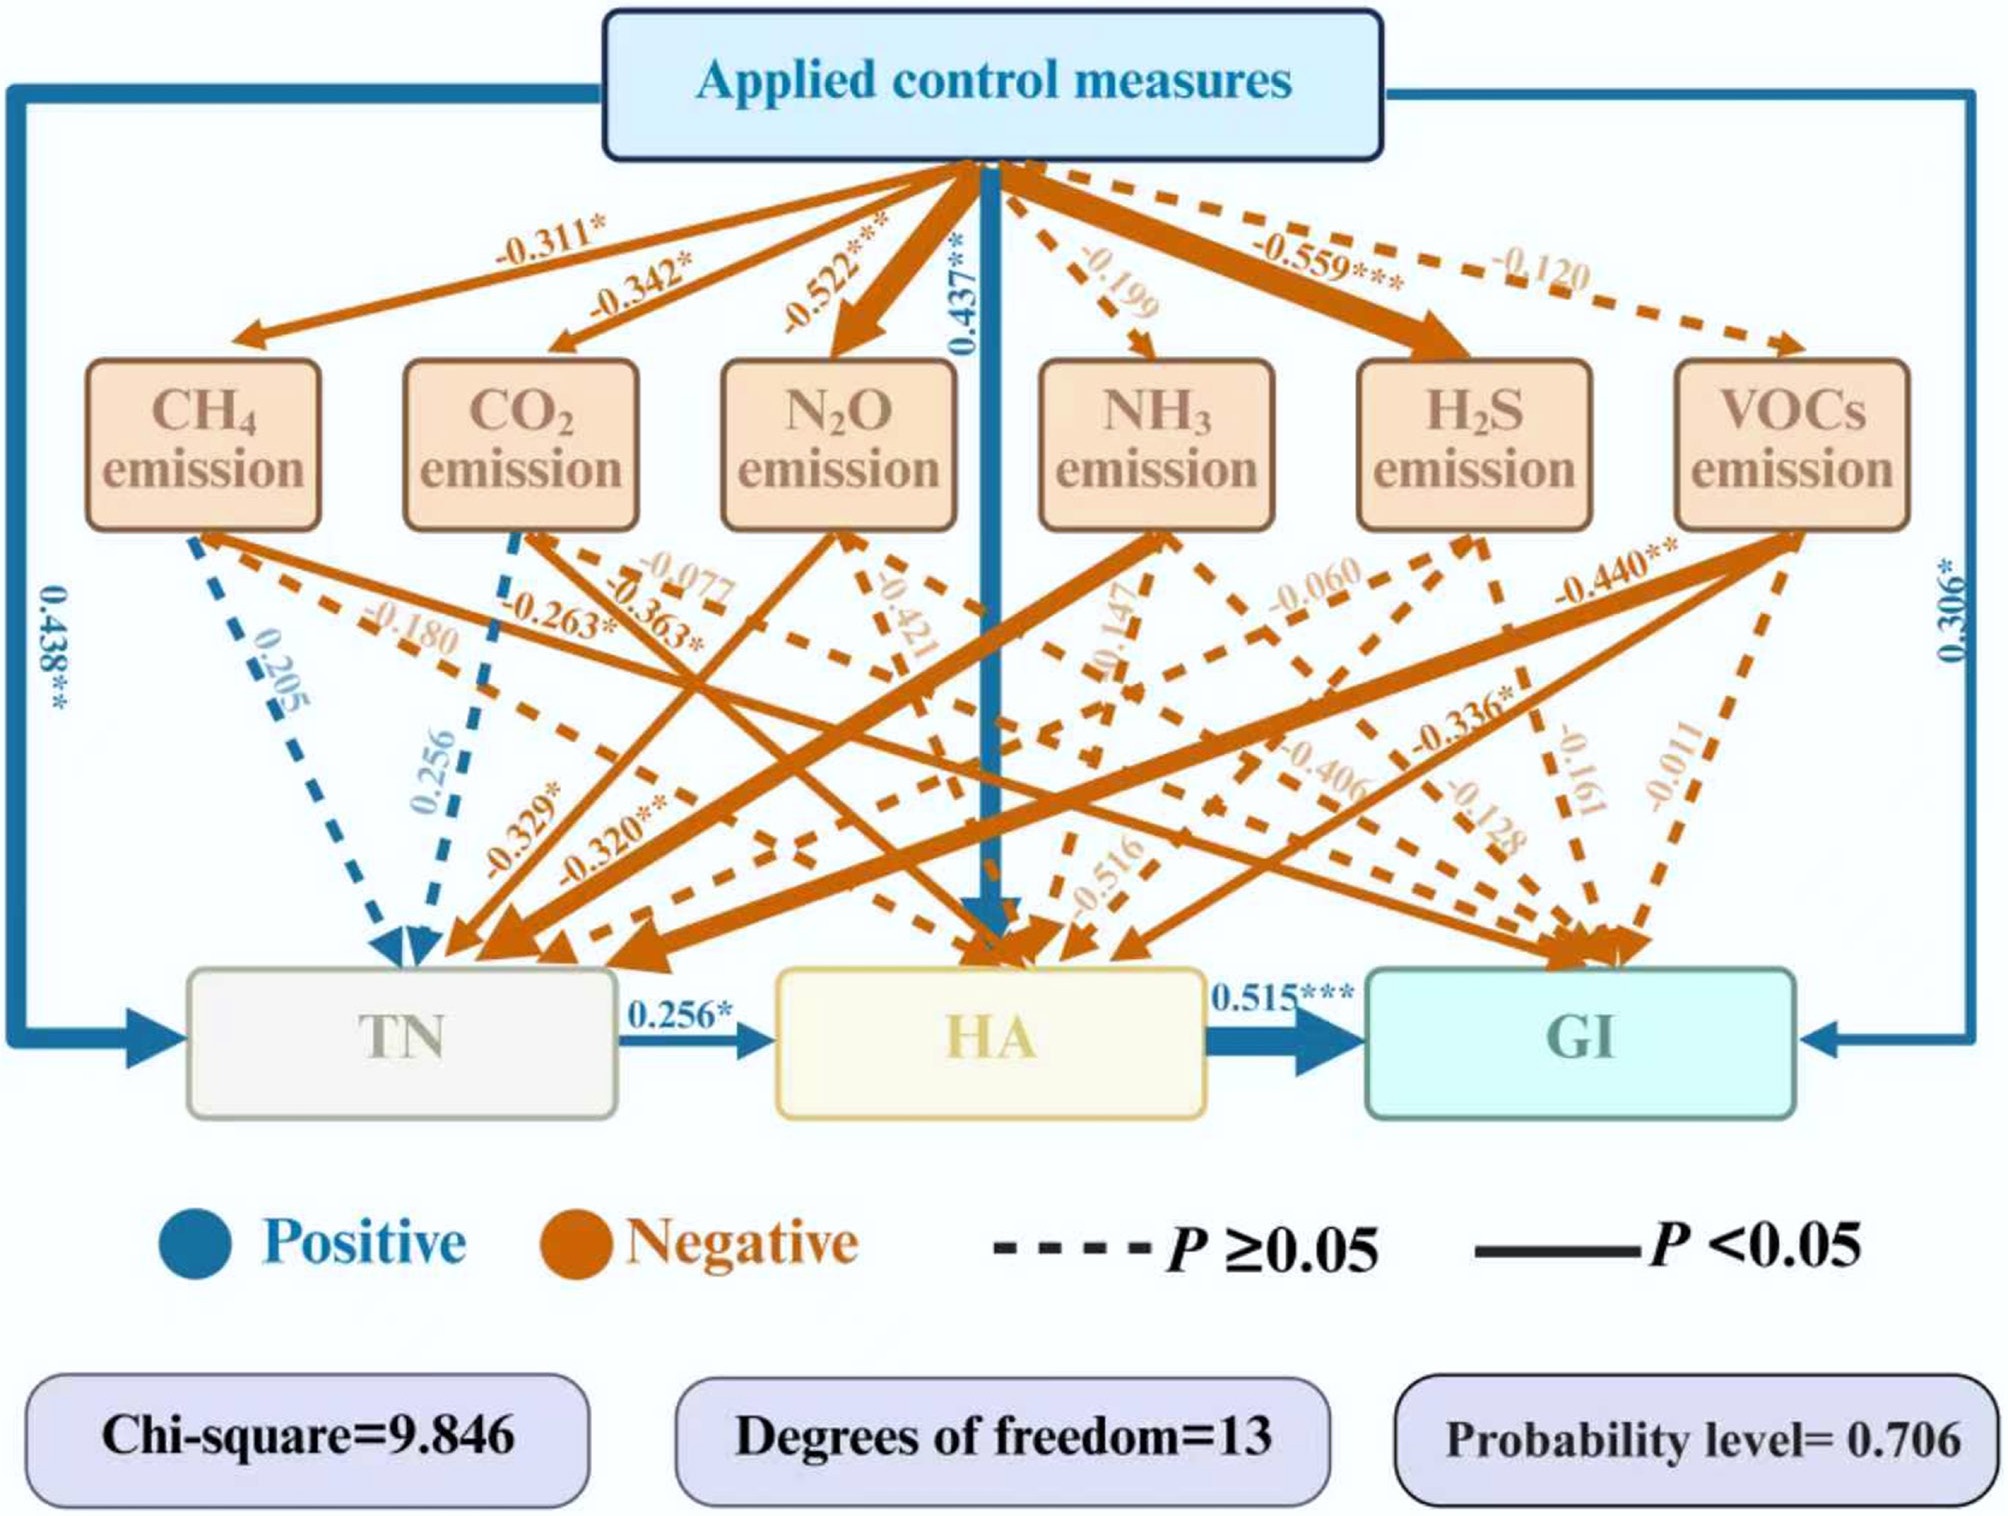
Figure 6.
Structural equation modelling (SEM) illustrates how the applied air pollution mitigation measures influence the emission of GHGs, VOCs, and organic fertilizer quality enrichment. Positive and negative associations are denoted by red and blue arrows, respectively. Solid and thick arrows indicate significant effect sizes (p < 0.05, p < 0.01, and p < 0.001). The numbers after the arrows denote standardized path coefficients (* p < 0.05, ** p < 0.01, *** p < 0.001).
Figures
(6)
Tables
(0)