-
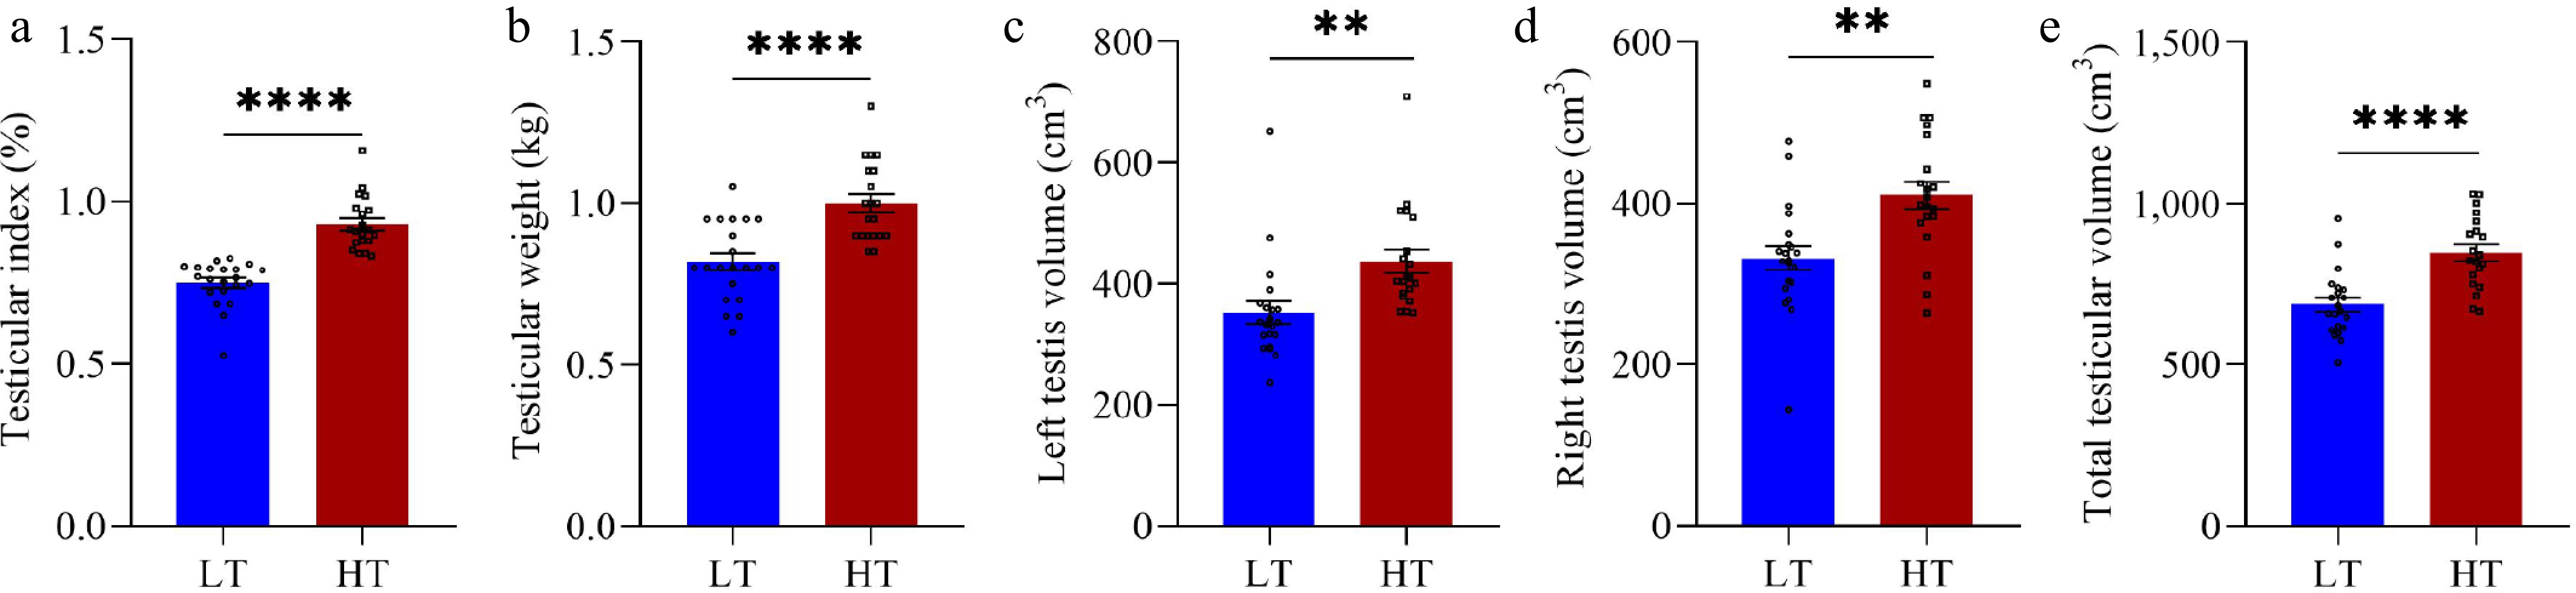
Figure 1.
Testicular development indices between boars in the low testicular index (LT, n = 21) and high testicular index (HT, n = 20) groups. Testicular index (a), testicular weight (b), left testicular volume (c), right testicular volume (d), and total testicular volume (e) were measured on the final day of the experiment. The vertical bars represent the means ± SEMs. ** p < 0.01 and **** p < 0.0001 indicate significant differences between the LT and HT groups.
-
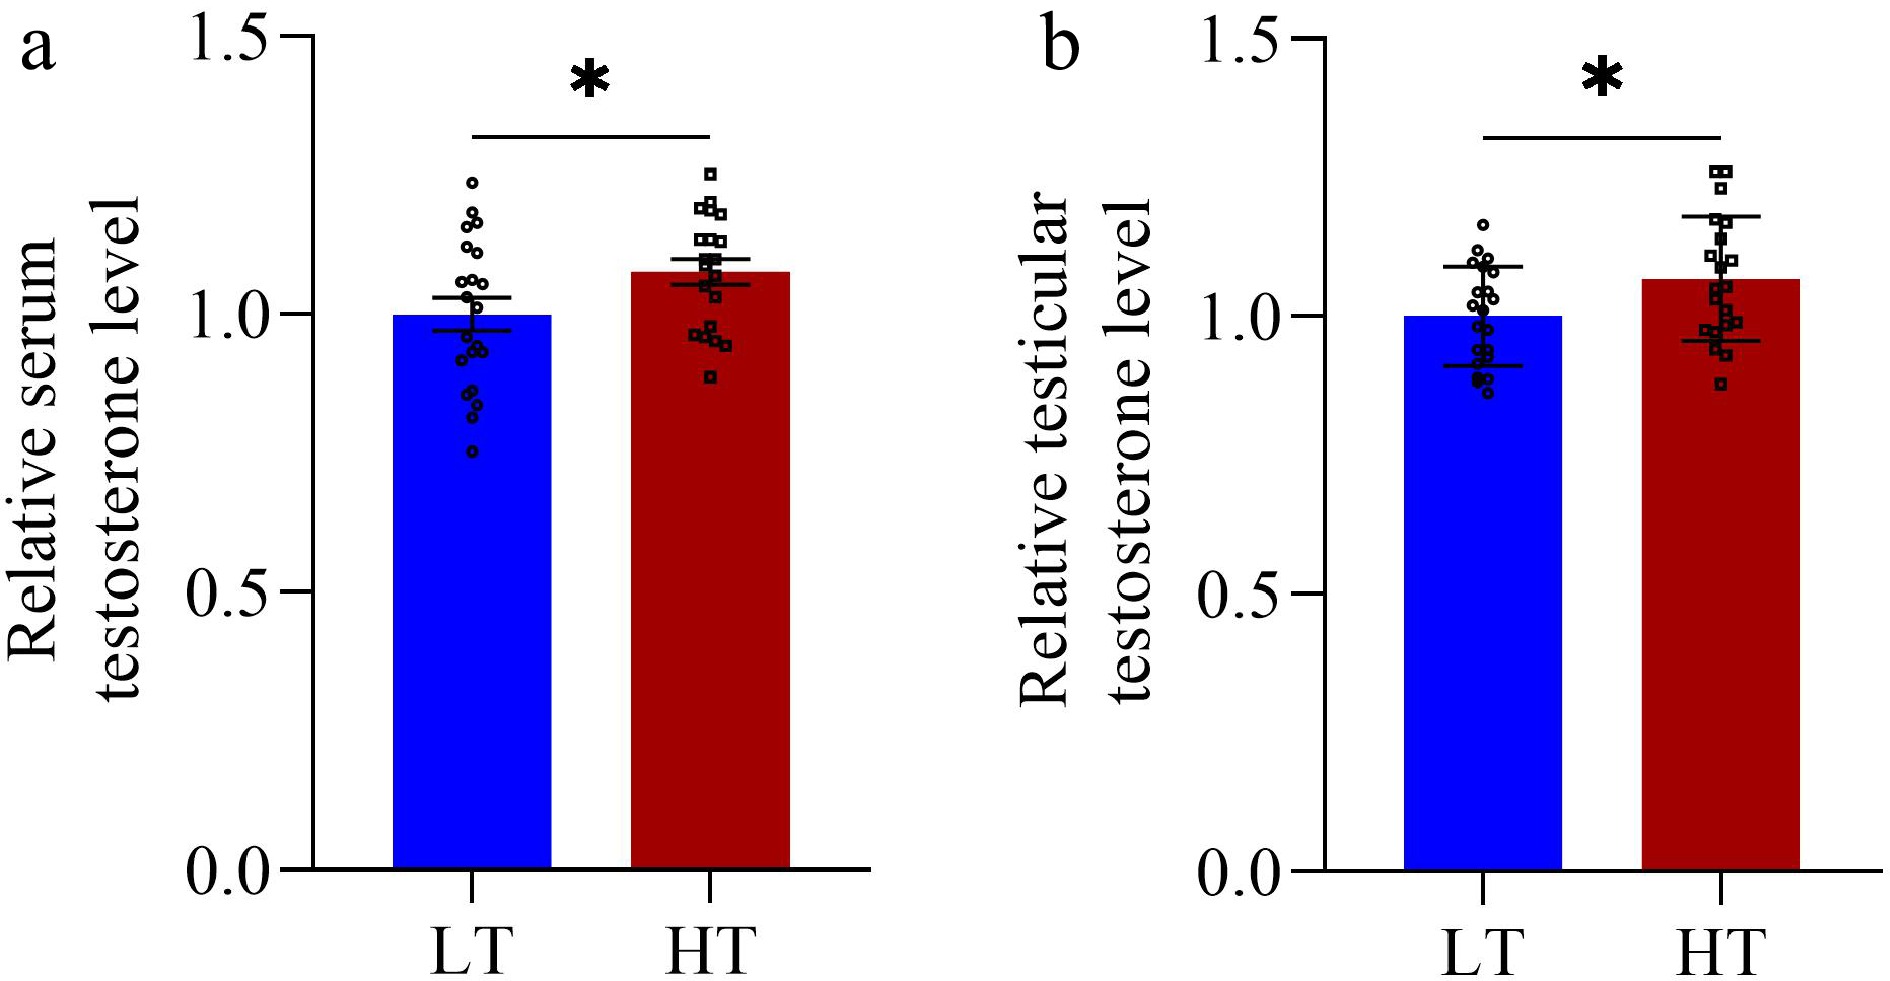
Figure 2.
Testosterone levels between boars in the low testicular index (LT, n = 21) and high testicular index (HT, n = 20) groups. The relative levels of serum testosterone (a) and testicular testosterone (b) were measured on the final day of the experiment. The vertical bars represent the means ± SEMs. * p < 0.05 indicates a significant difference between the LT and HT groups.
-
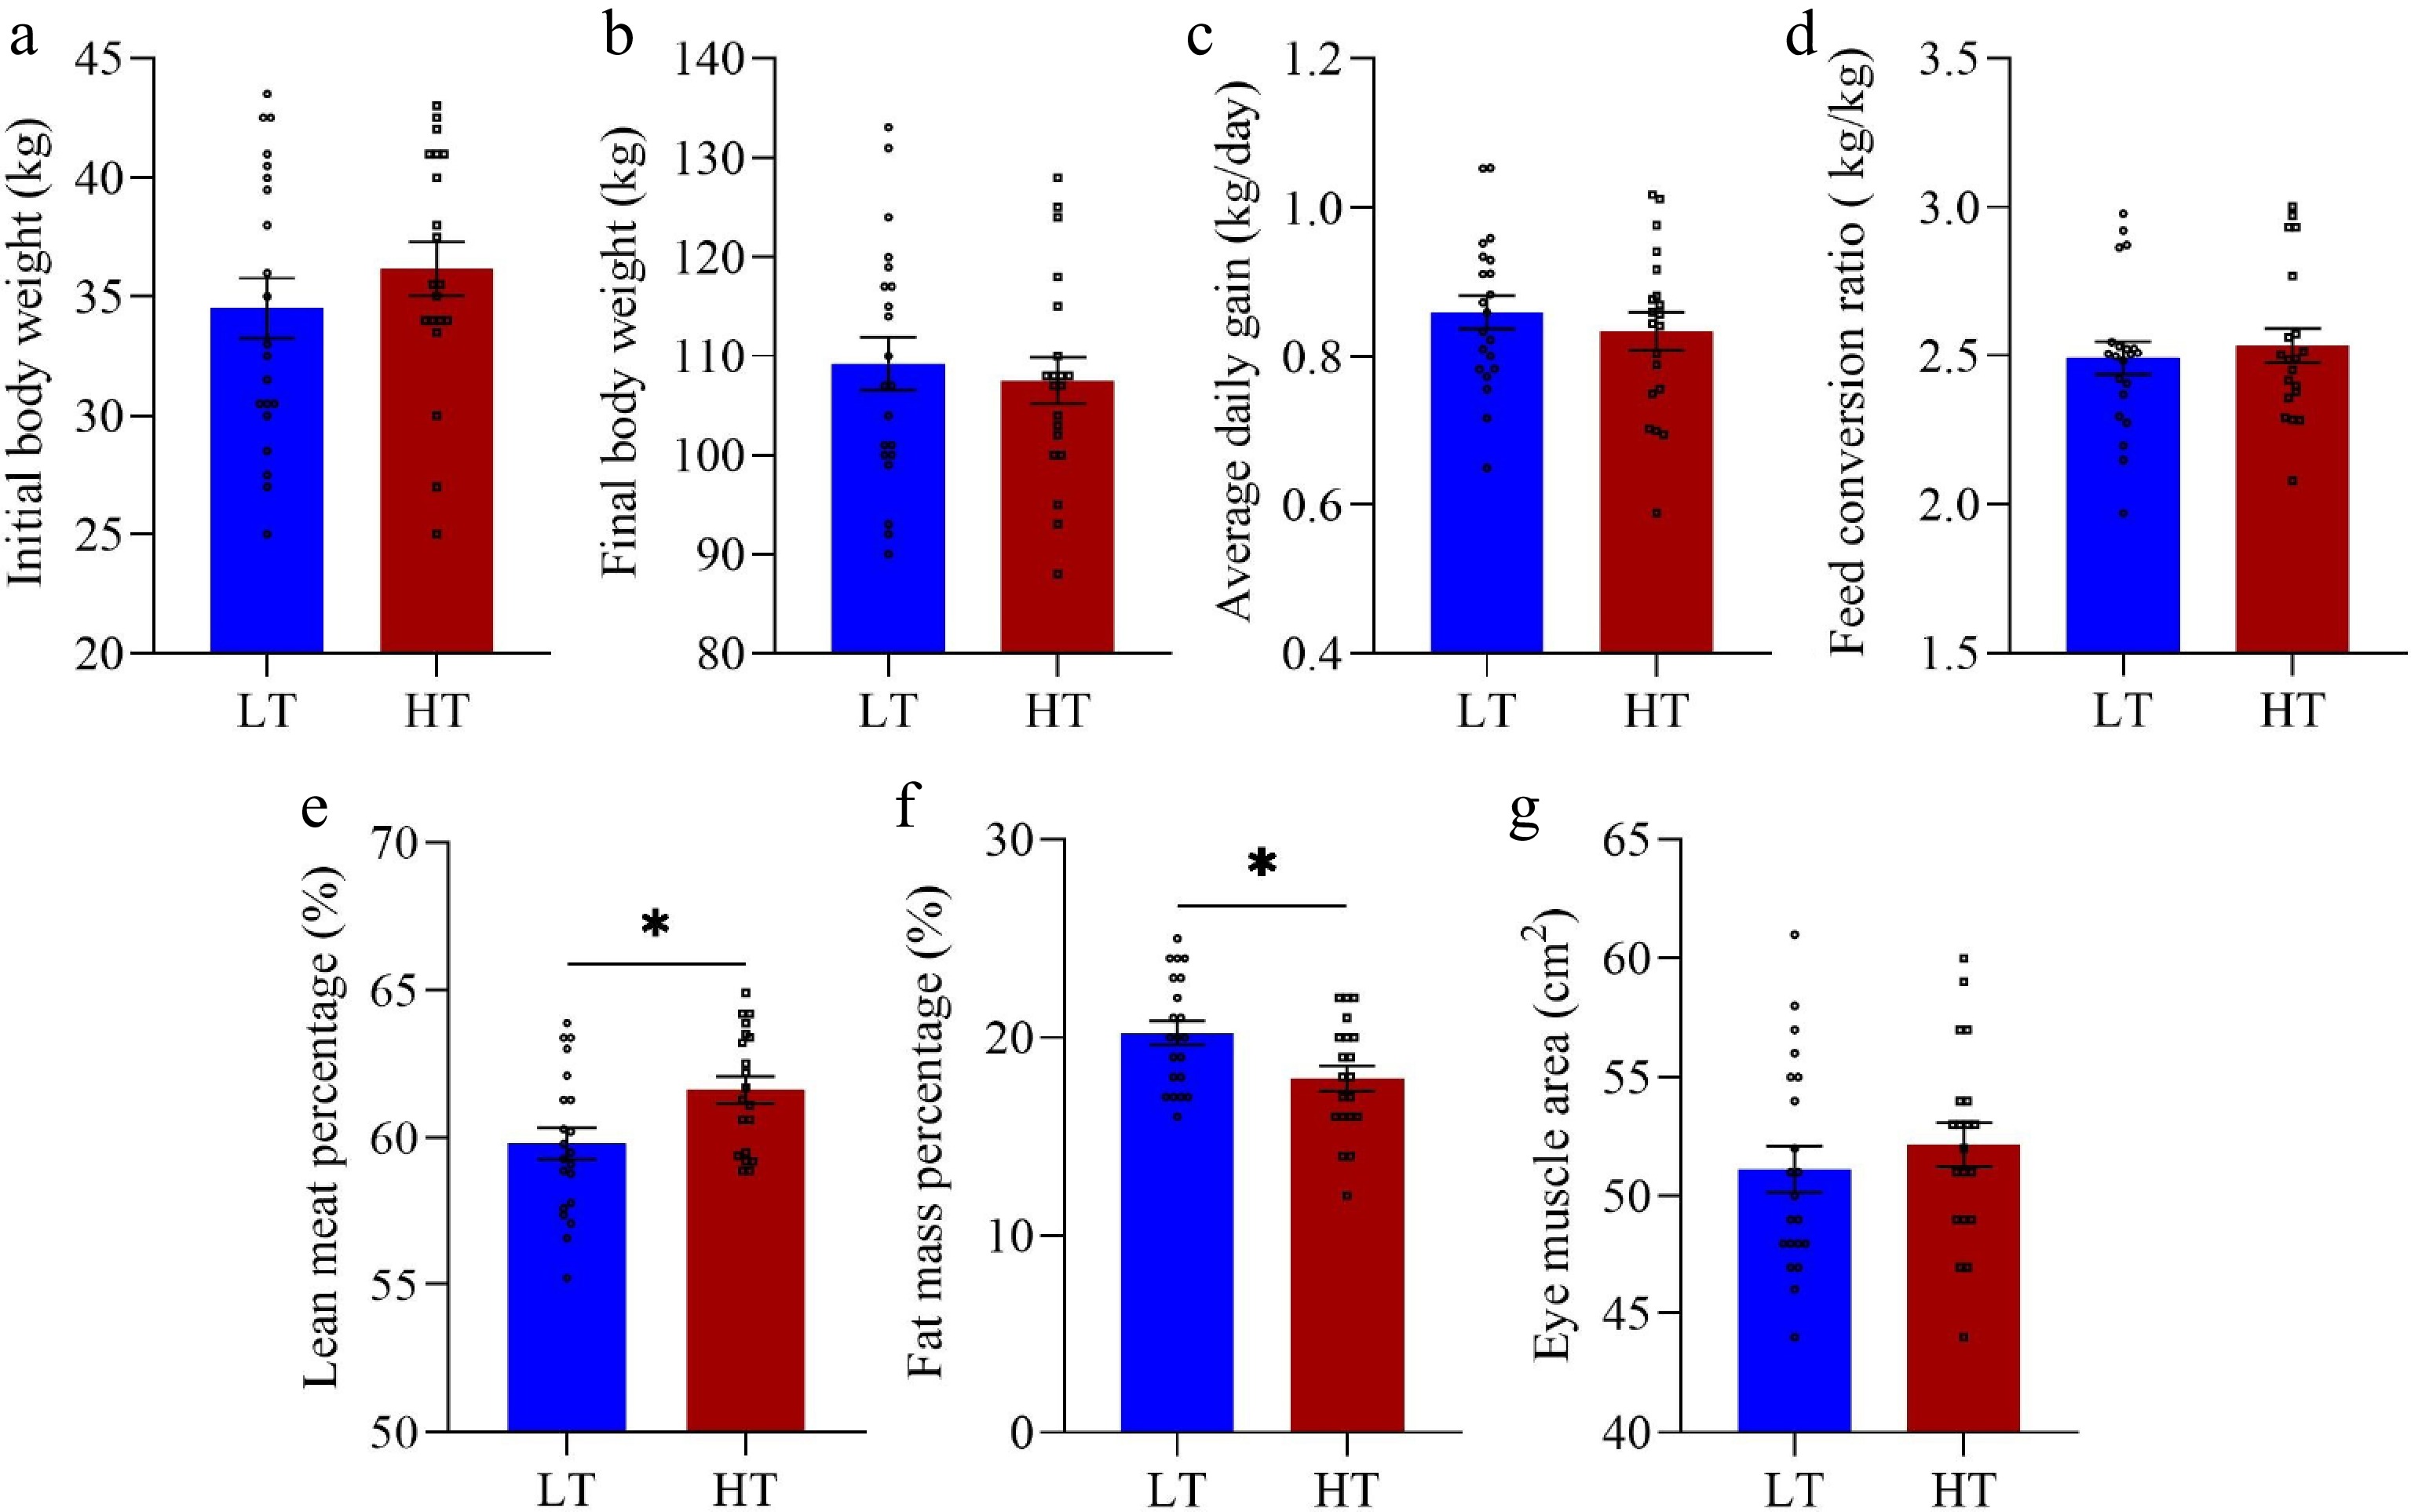
Figure 3.
Differences in production performance between the low testicular index (LT, n = 21) and high testicular index (HT, n = 20) groups of boars. Initial body weight (a), final body weight (b), average daily gain (c), feed conversion ratio (d), lean meat percentage (e), fat mass percentage (f), and eye muscle area (g) were measured on the final day of the experiment. The vertical bars represent the means ± SEMs. * p < 0.05 indicates a significant difference between the LT and HT groups.
-
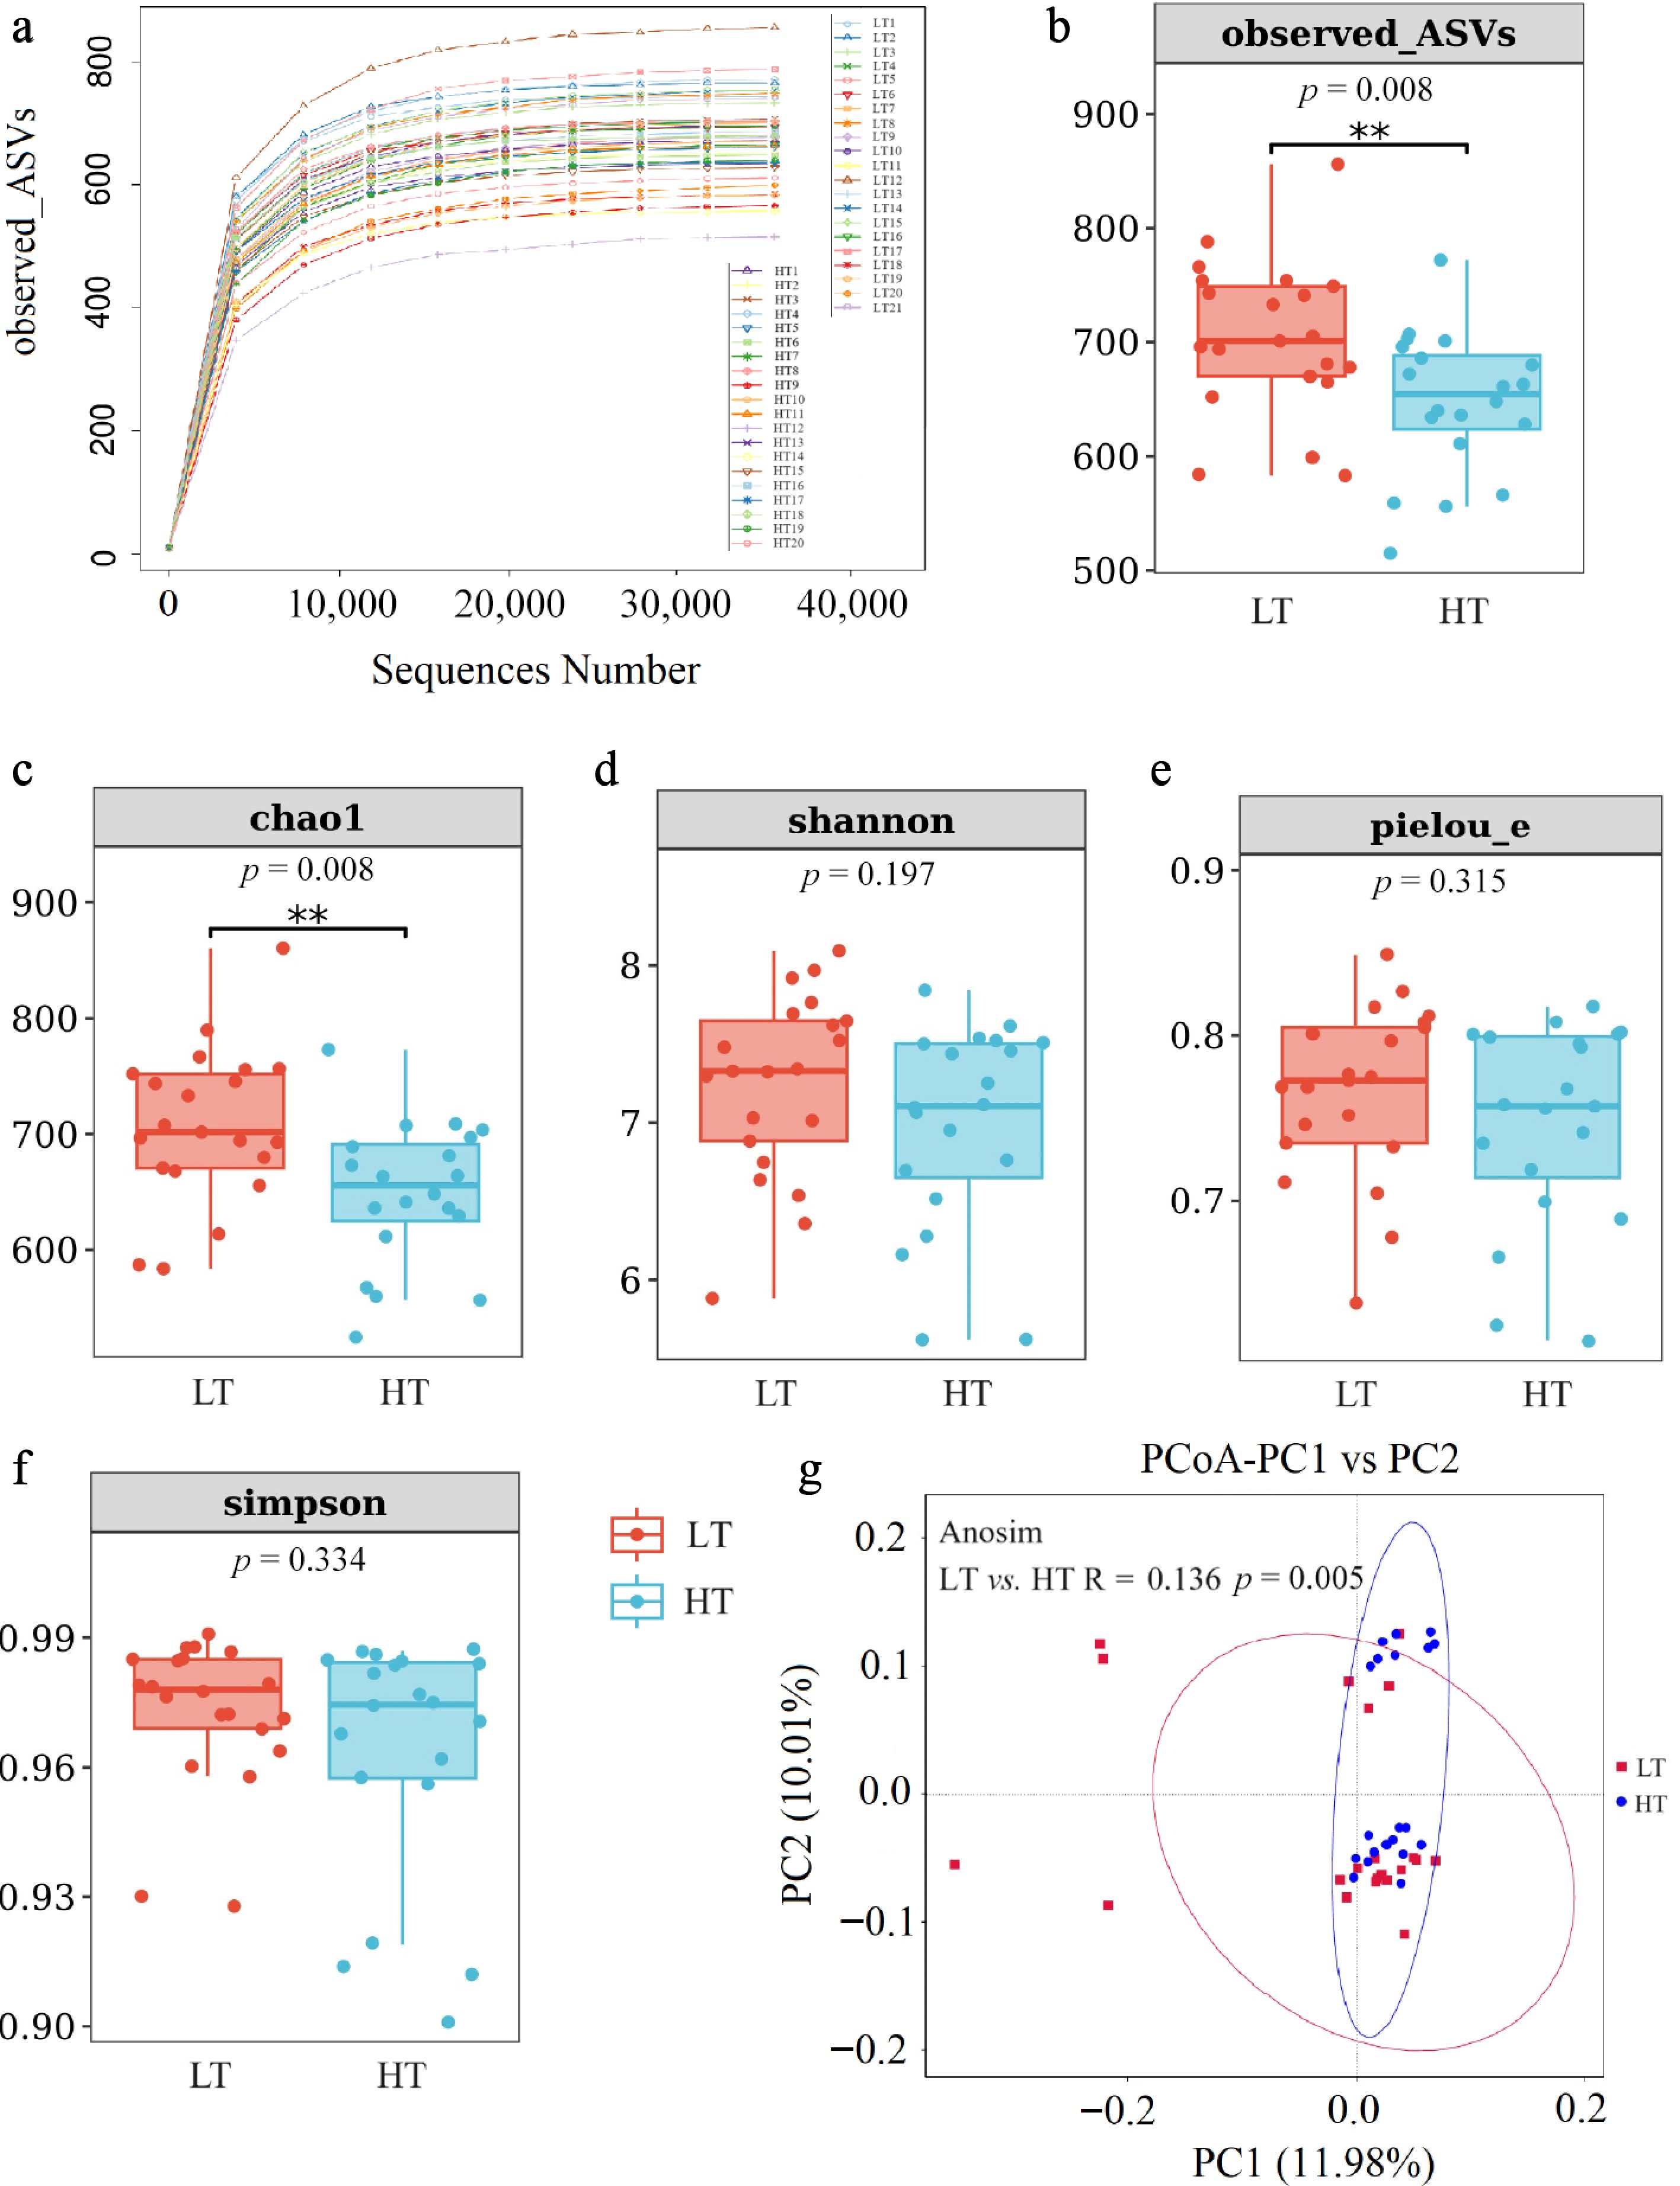
Figure 4.
Comparison of microbial diversity in feces between boars in the low testicular index (LT) (n = 21) and high testicular index (HT) (n = 20) groups. The curve shows the relationship between the total number of ASVs and the sequence number (a). Bar chart of the number of ASVs (b) and alpha diversity measured by the Chao1 (c), Shannon (d), Pielou_e (e) and Simpson (f) indices. Beta diversity, as depicted by the principal coordinate analysis (PCoA) plot based on unweighted UniFrac distance dissimilarities, revealed distinct fecal microbial compositional differences between the LT and HT groups (g). ** p < 0.01 indicates a significant difference between the LT and HT groups.
-
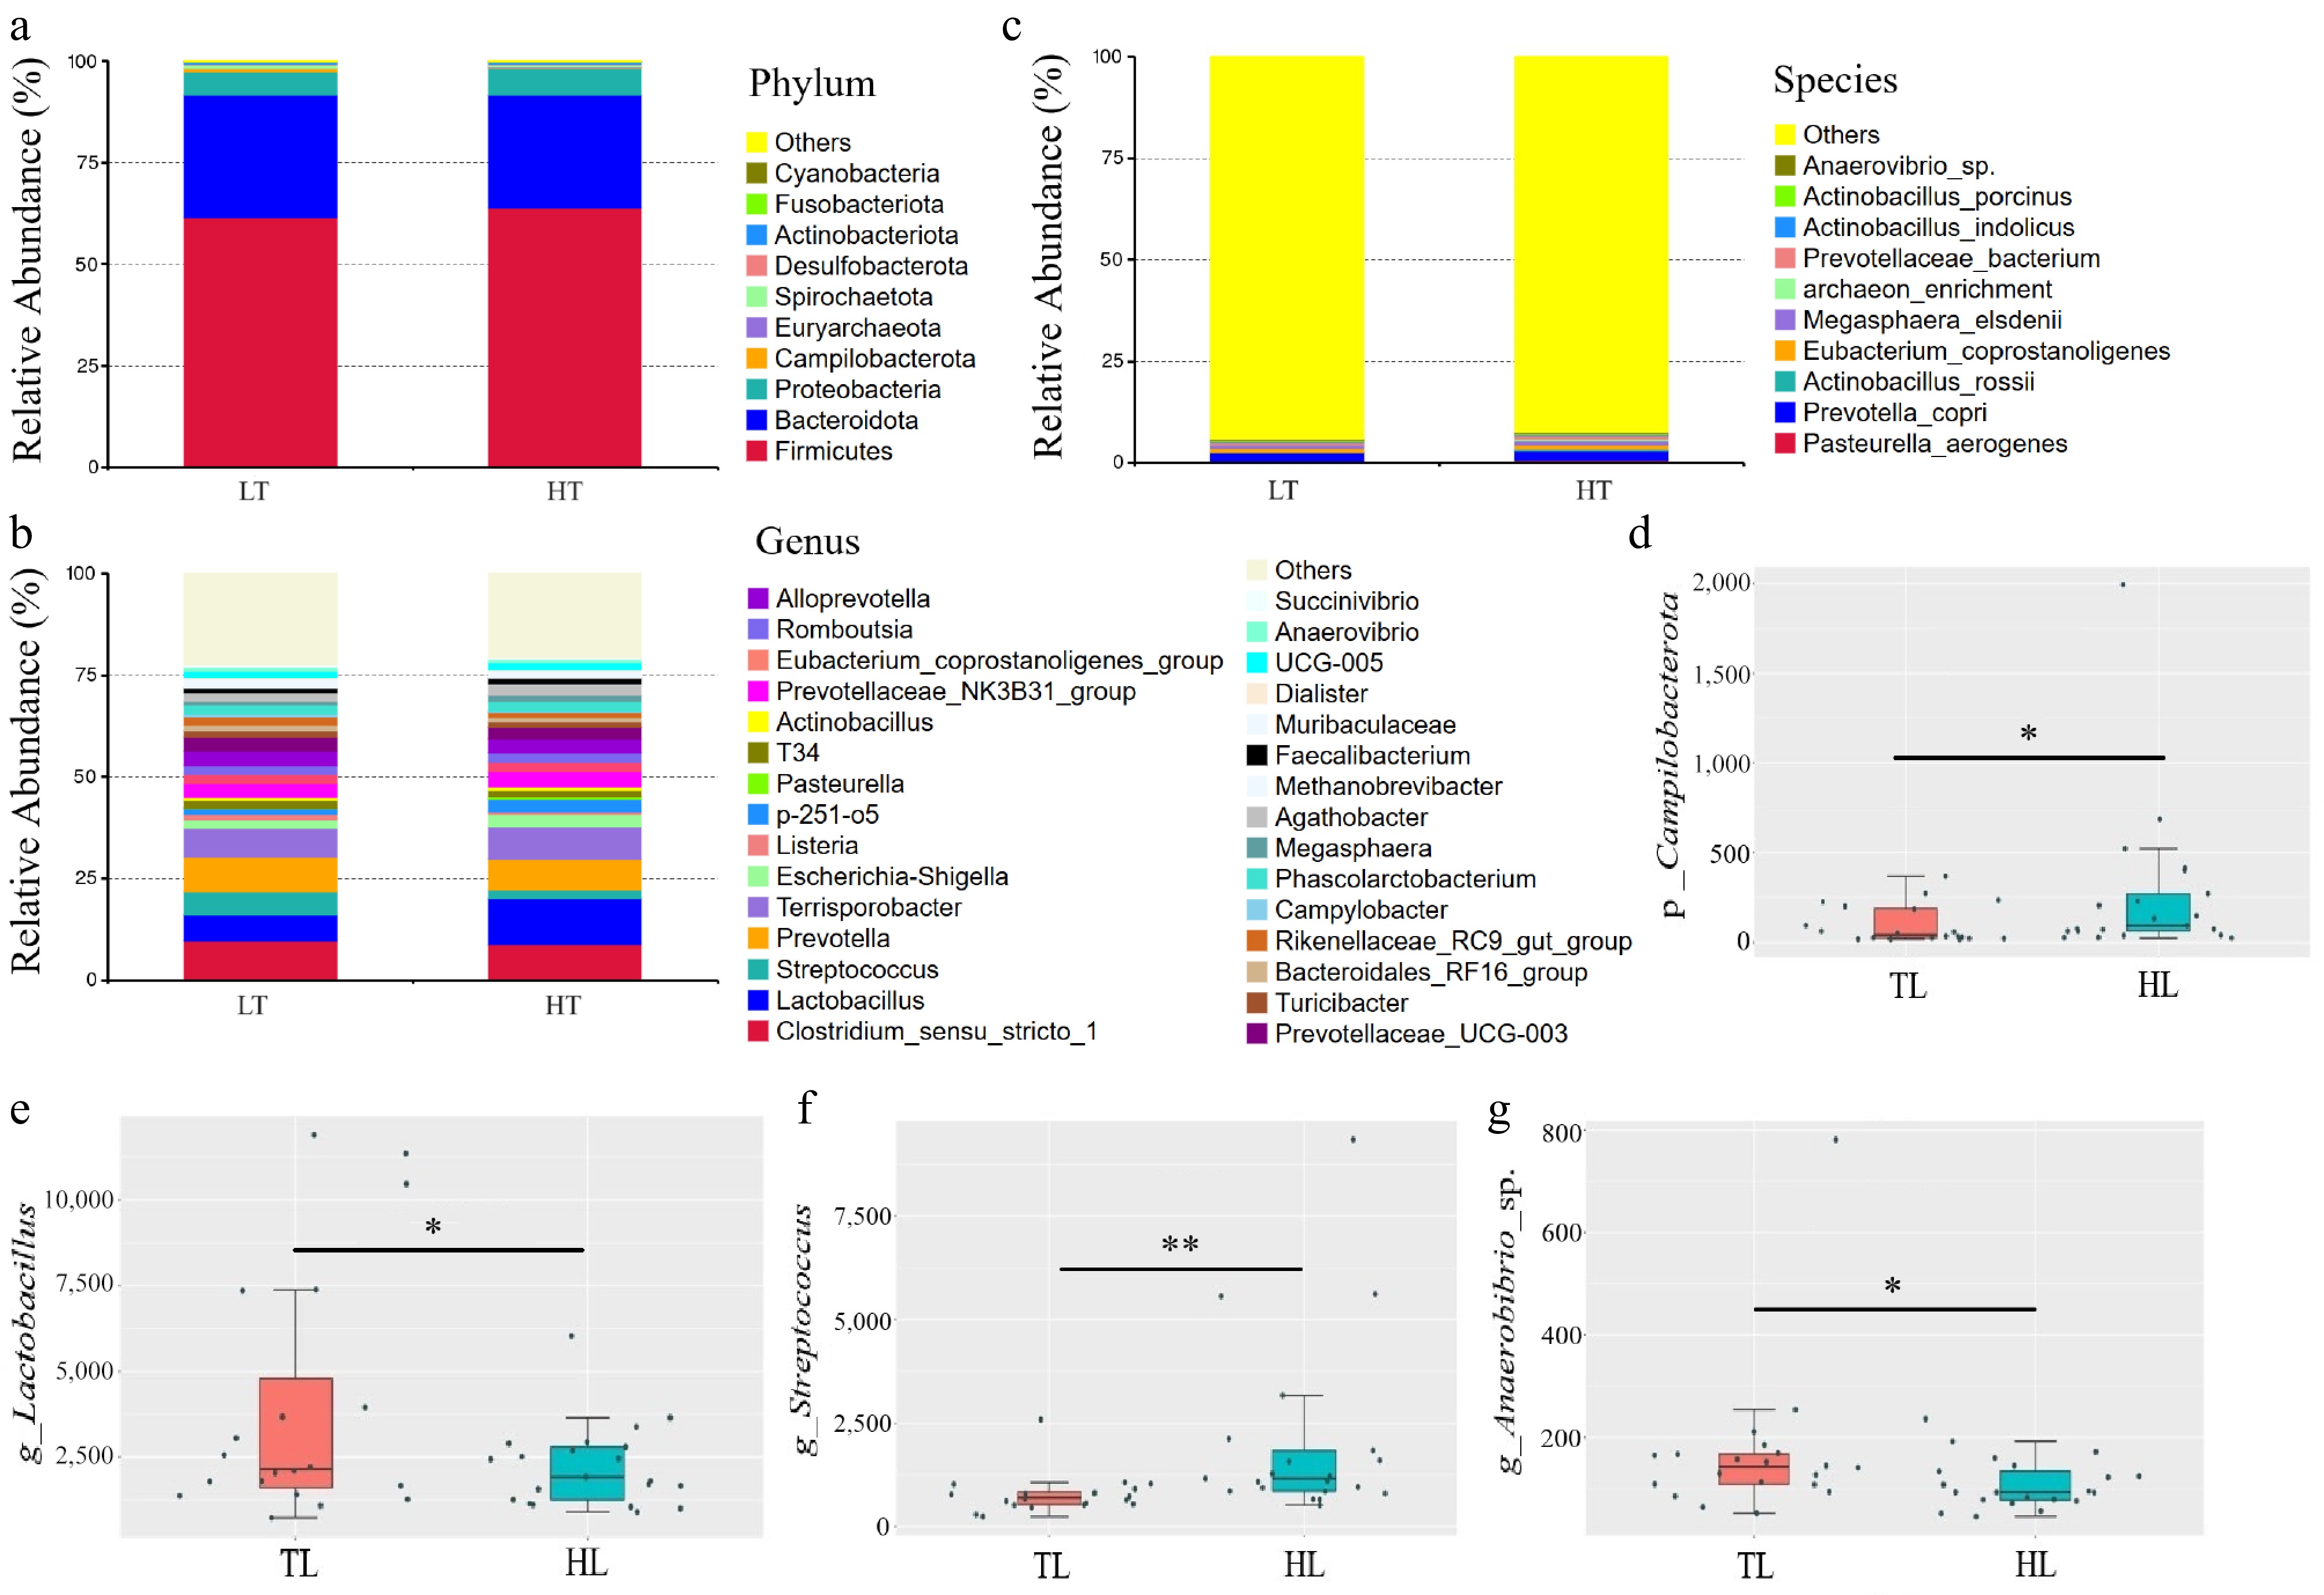
Figure 5.
The difference in the composition of the fecal microbiota between the low testicular index (LT, n = 21) and high testicular index (HT, n = 20) groups was assessed. The relative abundances of major (a) phyla, (b) genera, and (c) species are shown. The absolute abundances of the top 10 significantly different taxa at the phylum (d), genus (e, f), and species (g) levels are presented. * p < 0.05 and ** p < 0.01 indicate significant differences between the LT and HT groups.
-
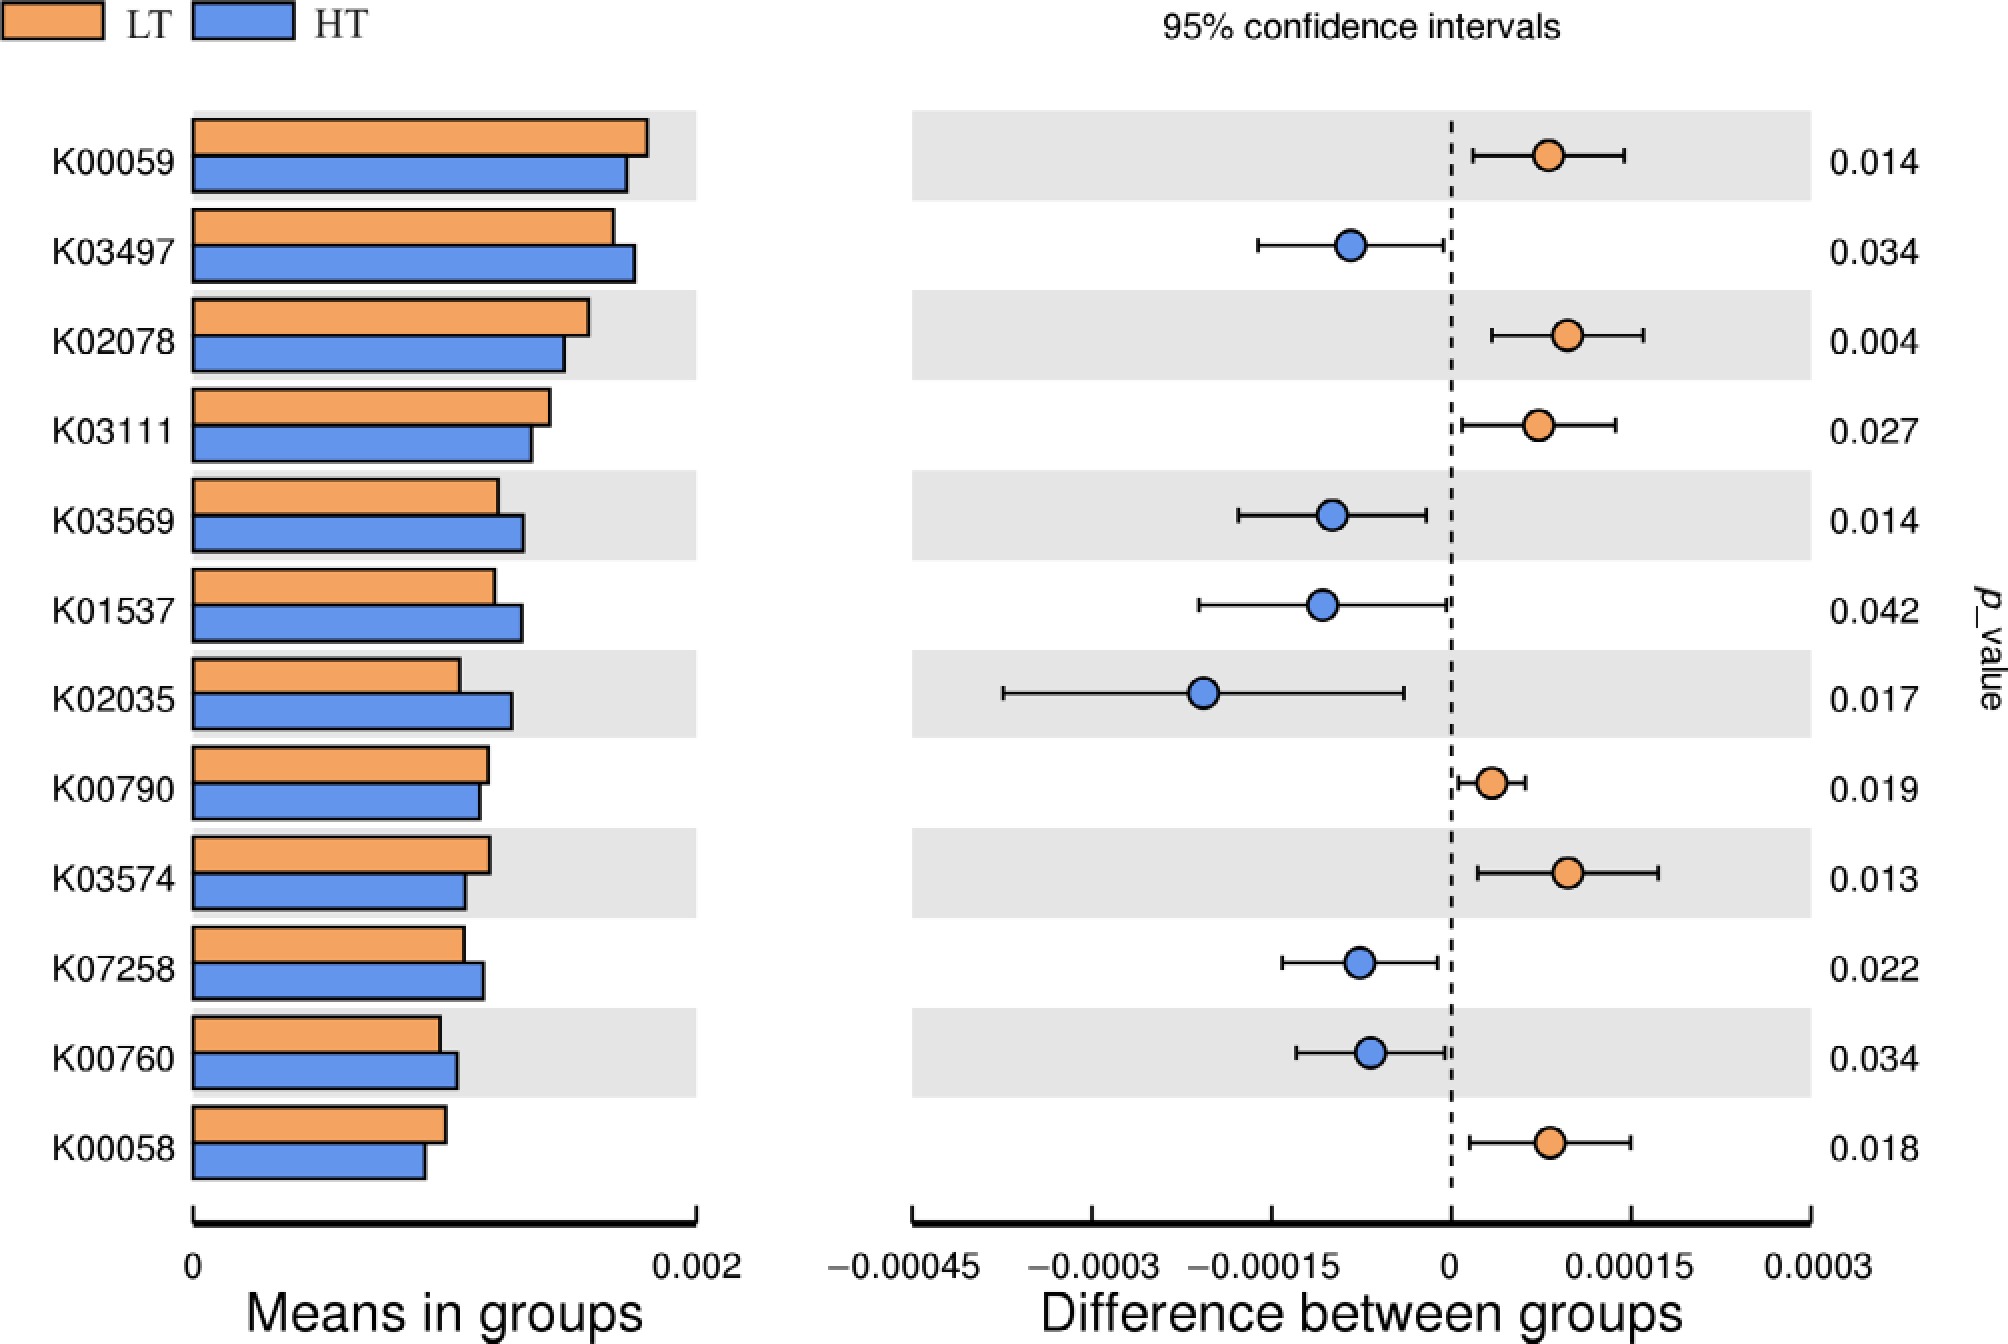
Figure 6.
Differences in predicted fecal microbial functional profiles between boars in the low testicular index (LT, n = 21) and high testicular index (HT, n = 20) groups.
-
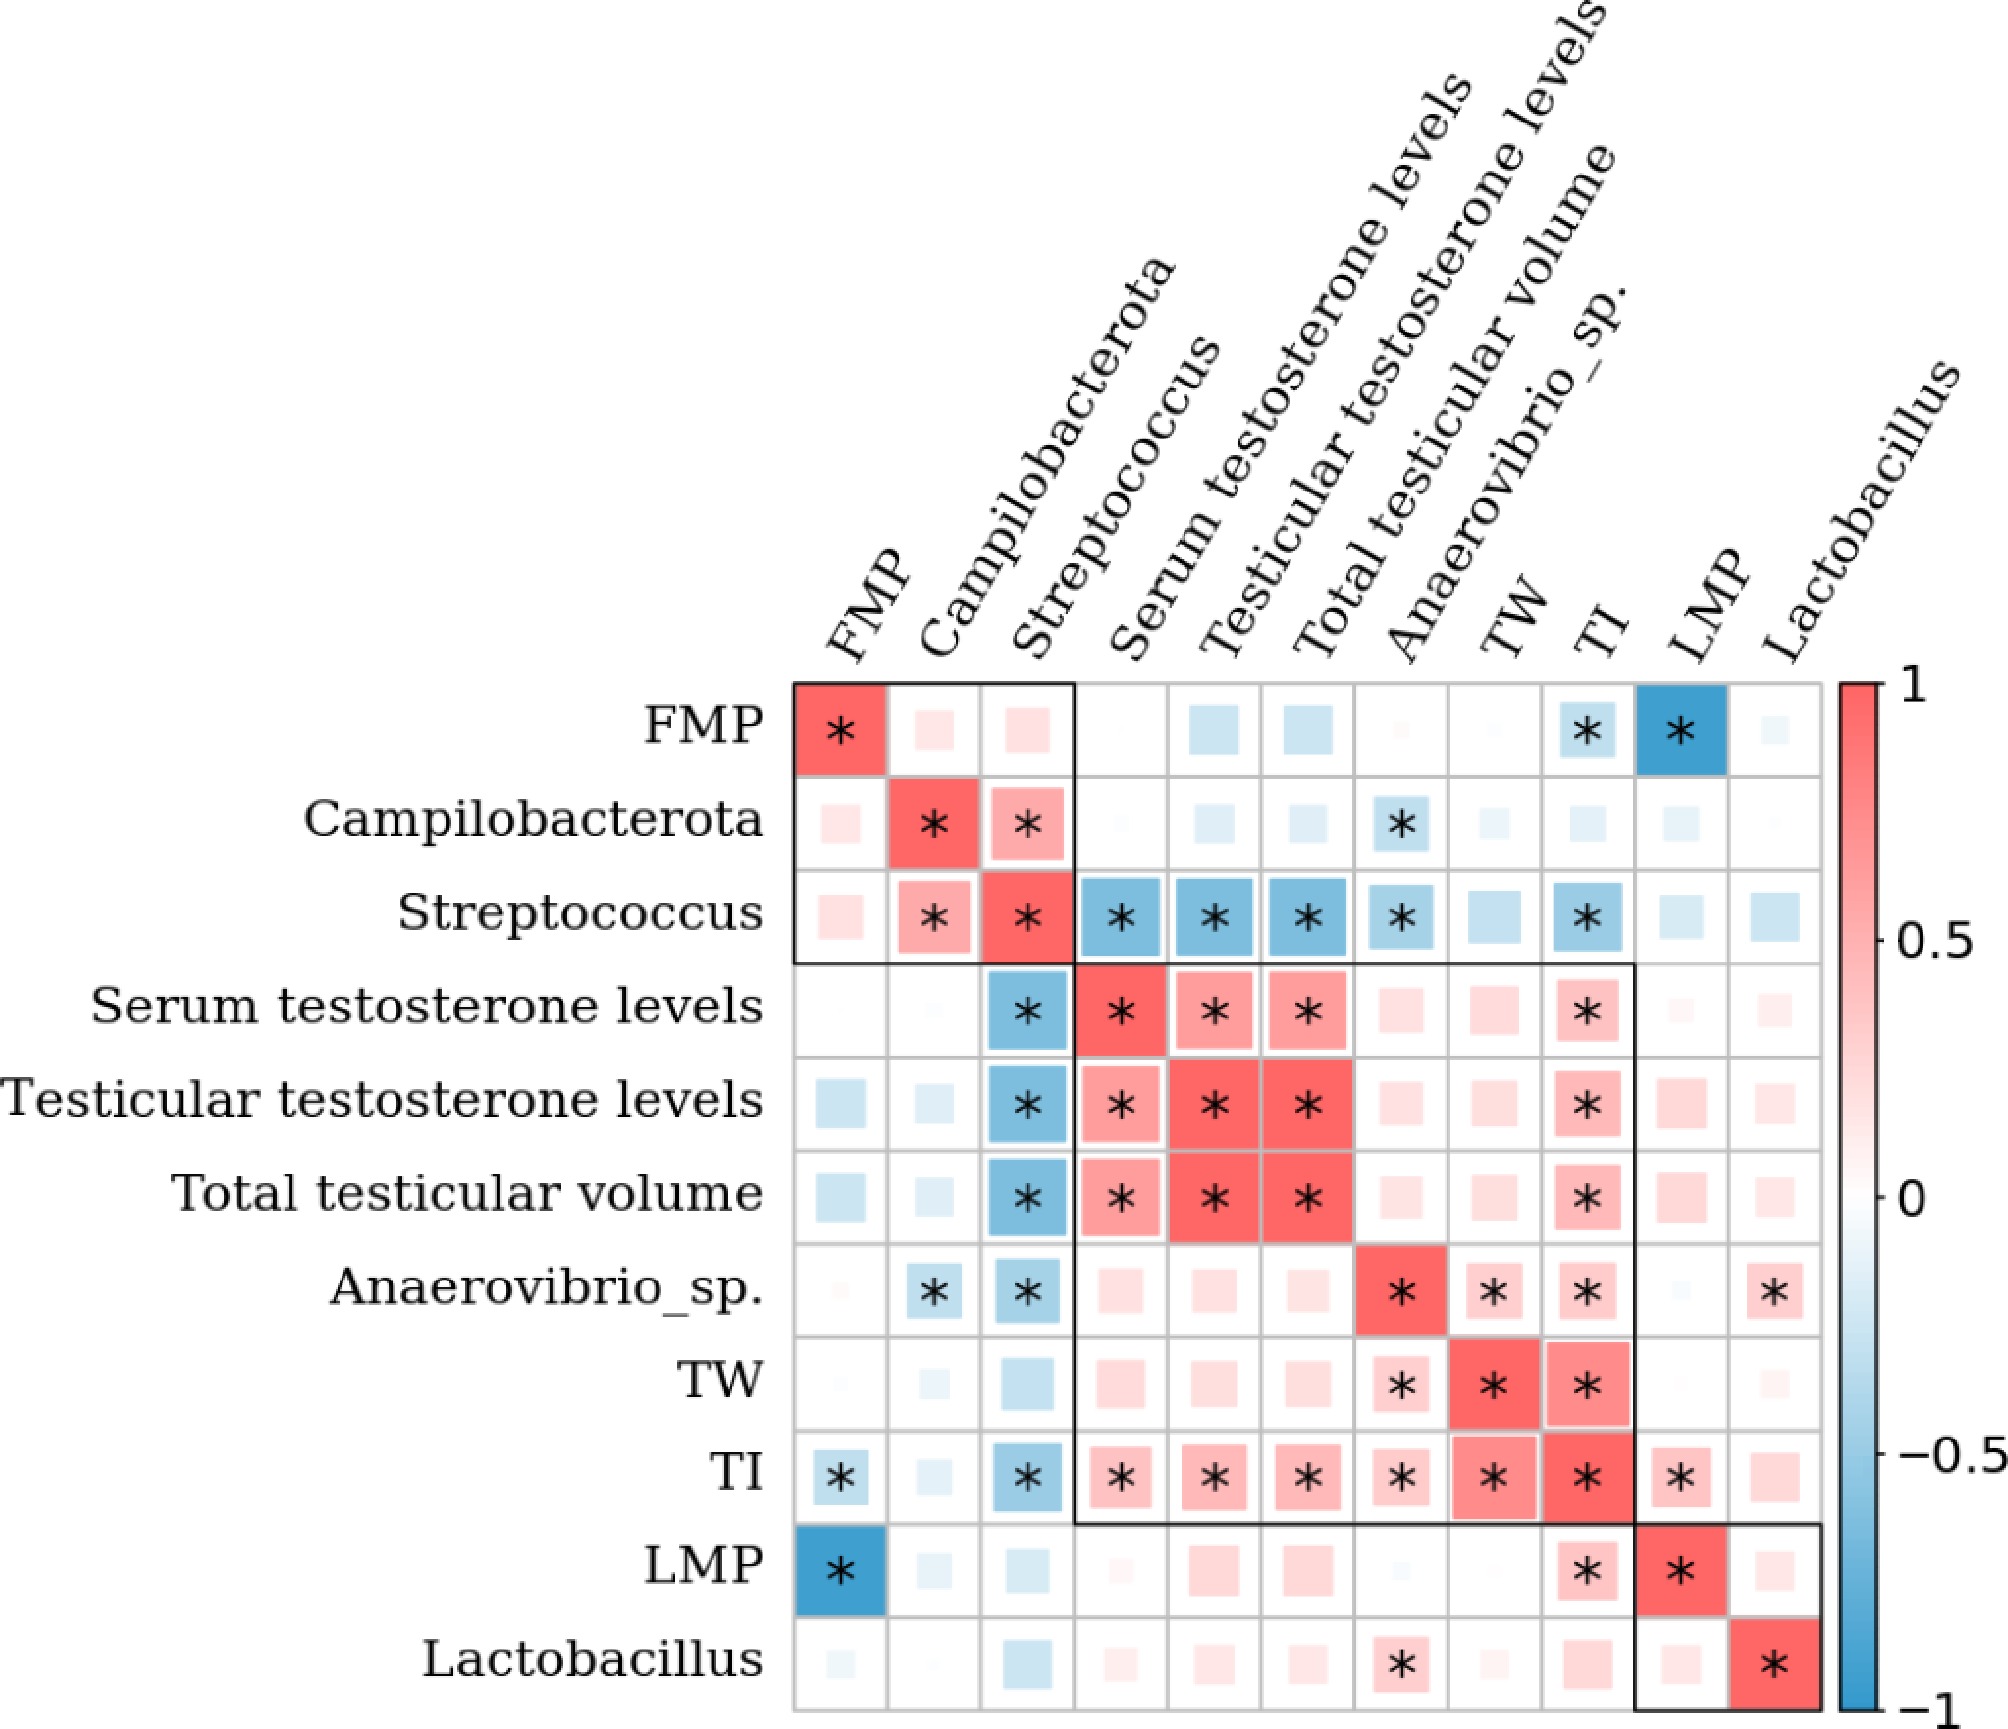
Figure 7.
Heatmap of Spearman's correlation analysis between the fecal microbial microbiota, testicular development indices, and production performance indices of boars in the low testicular index (LT, n = 21) and high testicular index (HT, n = 20) groups. Red represents a positive correlation, whereas blue represents an inverse correlation. * p < 0.05.
-
Item Body weight (kg) 30–60 > 60 Ingredients Corn (%) 61.00 65.00 Soybean meal (%) 15.30 7.50 Wheat bran (%) 15.00 15.00 Corn gluten meal (%) 5.00 9.00 Limestone powder (%) 1.50 1.50 Calcium hydrogen phosphate (%) 0.90 0.70 Sodium chloride (%) 0.30 0.30 Premix compound (%)a 1.00 1.00 Total (%) 100 100 Nutrient
compositionDigestible energy (MJ/kg)b 13.17 13.33 Crude protein (%) 16.15 14.16 Calcium (%) 0.81 0.79 Total phosphorus (%) 0.56 0.49 Total lysine (%) 0.65 0.49 Total methionine + cystine (%) 0.42 0.35 a The premix provided the following per kilogram of diet: Vitamin A, 8,000 IU; Vitamin B1, 4 mg; Vitamin B2, 3.6 mg; Vitamin B5, 40 mg; Vitamin B6, 4 mg; Vitamin B12, 0.02 mg; Vitamin D3, 3,000 IU; Vitamin E, 20 IU; Vitamin K3, 2 mg; biotin, 0.15 mg; folic acid, 1 mg; nicotinic acid, 10 mg; D-pantothenic acid, 11 mg; antioxidant, 100 mg; Cu, 10 mg (as copper sulfate); Fe, 80 mg (as ferrous sulfate); Mn, 30 mg (as manganese sulfate); Zn, 75 mg (as zinc sulfate); I, 0.4 mg (as potassium iodide); and Se, 0.3 mg (as sodium selenite). b The digestible energy was calculated, while the others were analyzed. Table 1.
Ingredients and nutrient composition of the commercial diet provided to the boars.
Figures
(7)
Tables
(1)