-
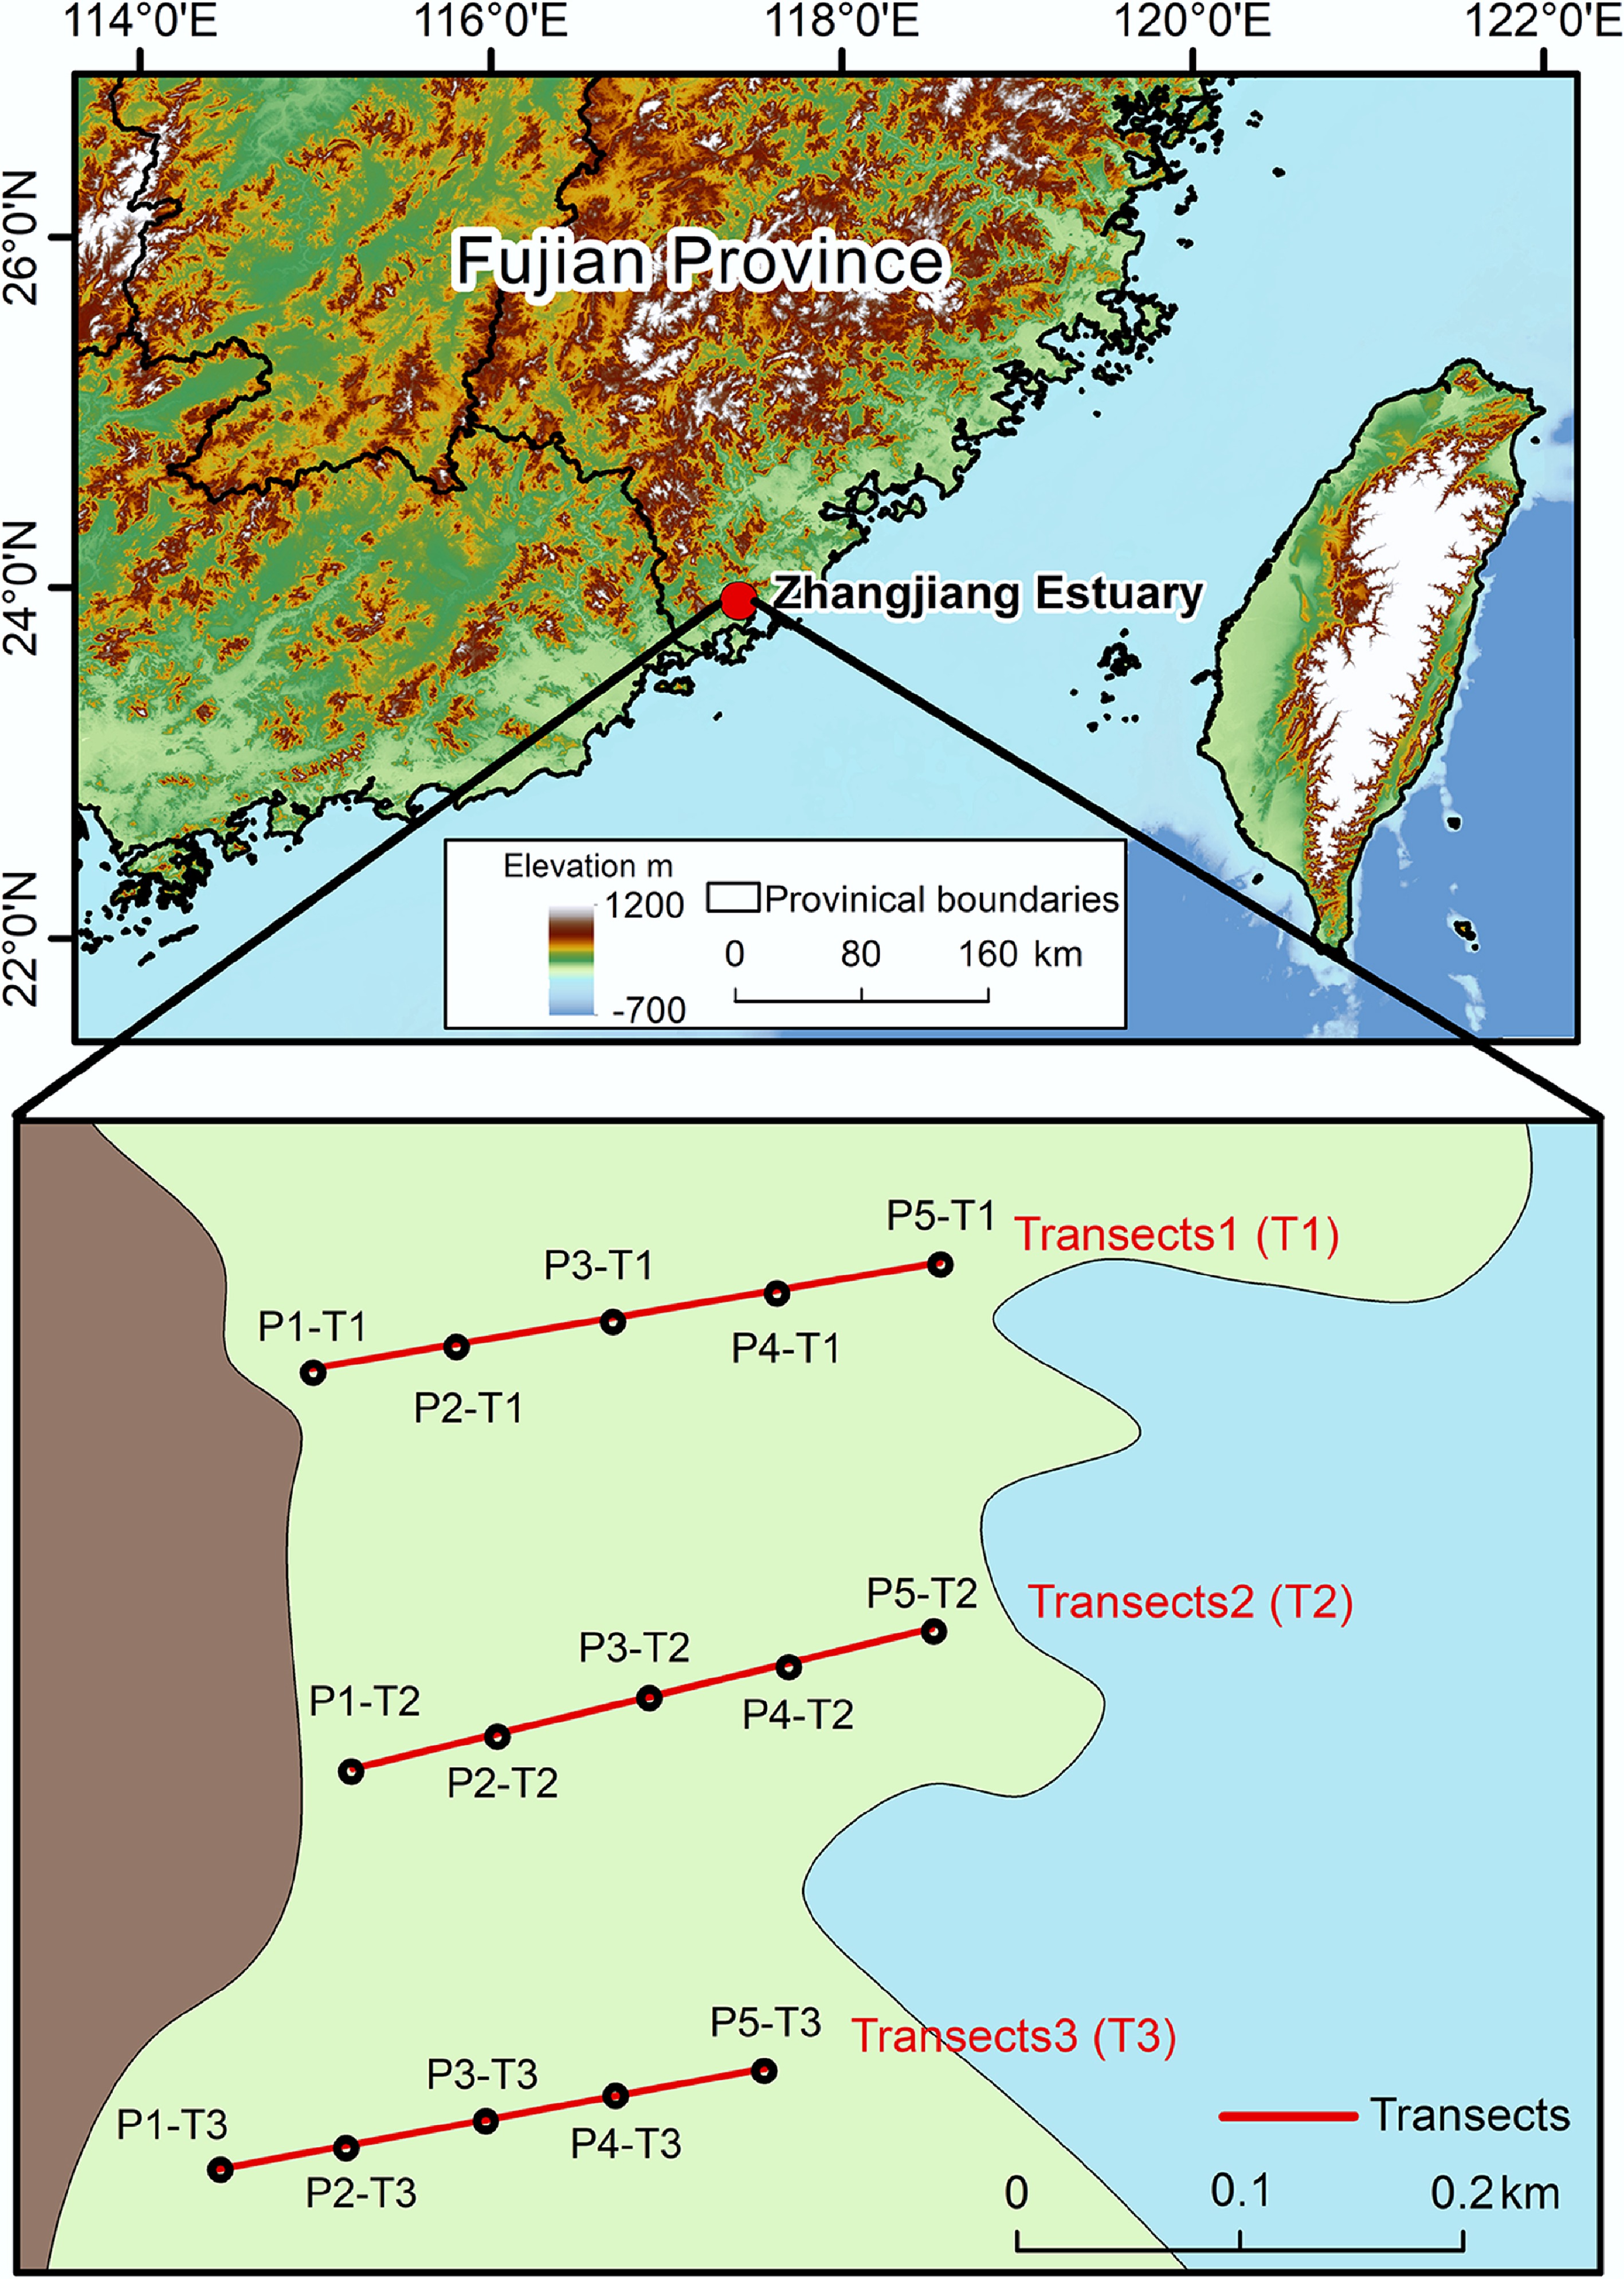
Figure 1.
Transects of mangrove soil in Zhangjiang Estuary, including 15 sampling sites.
-
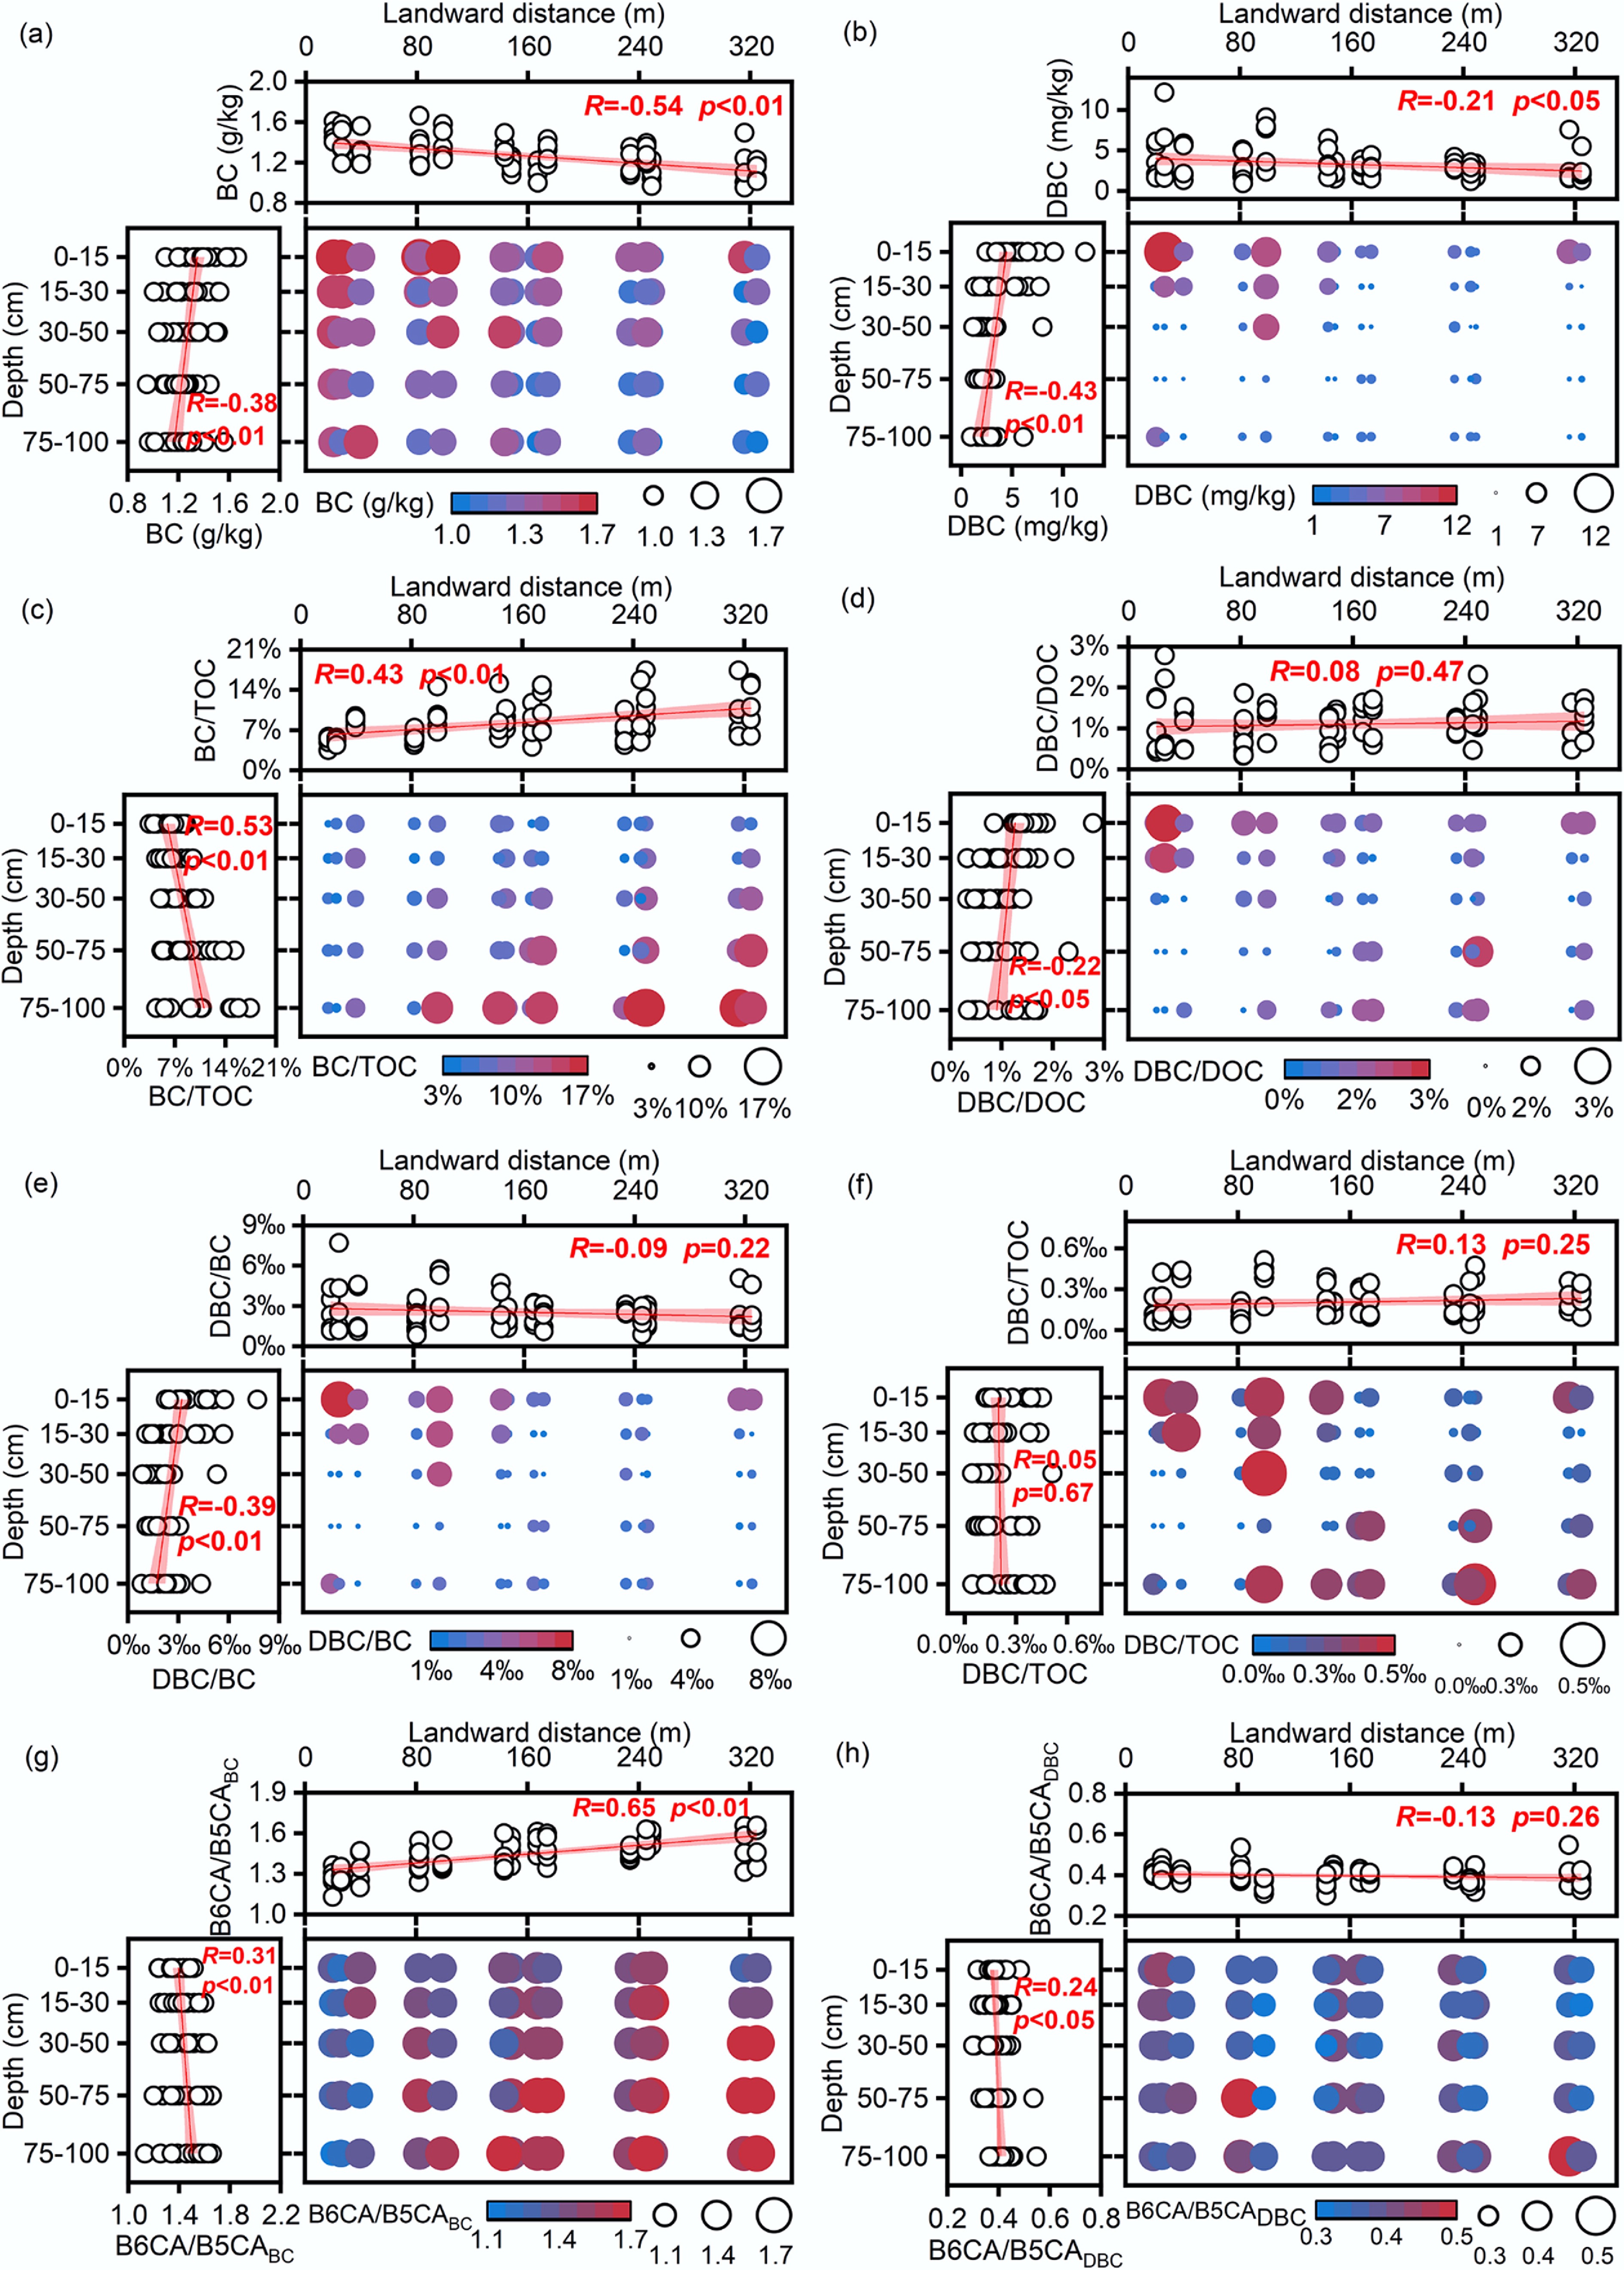
Figure 2.
Spatial distribution characteristics of soil carbon fractions. (a) Black carbon (BC); (b) dissolved black carbon (DBC); (c) black carbon/total organic carbon (BC/TOC); (d) dissolved black carbon/dissolved organic carbon (DBC/DOC); (e) DBC/BC; (f) DBC/TOC; (g) The ratio of B6CA to B5CA monomers in BC (B6CA/B5CABC); (h) The ratio of B6CA to B5CA monomers in DBC (B6CA/B5CADBC).
-
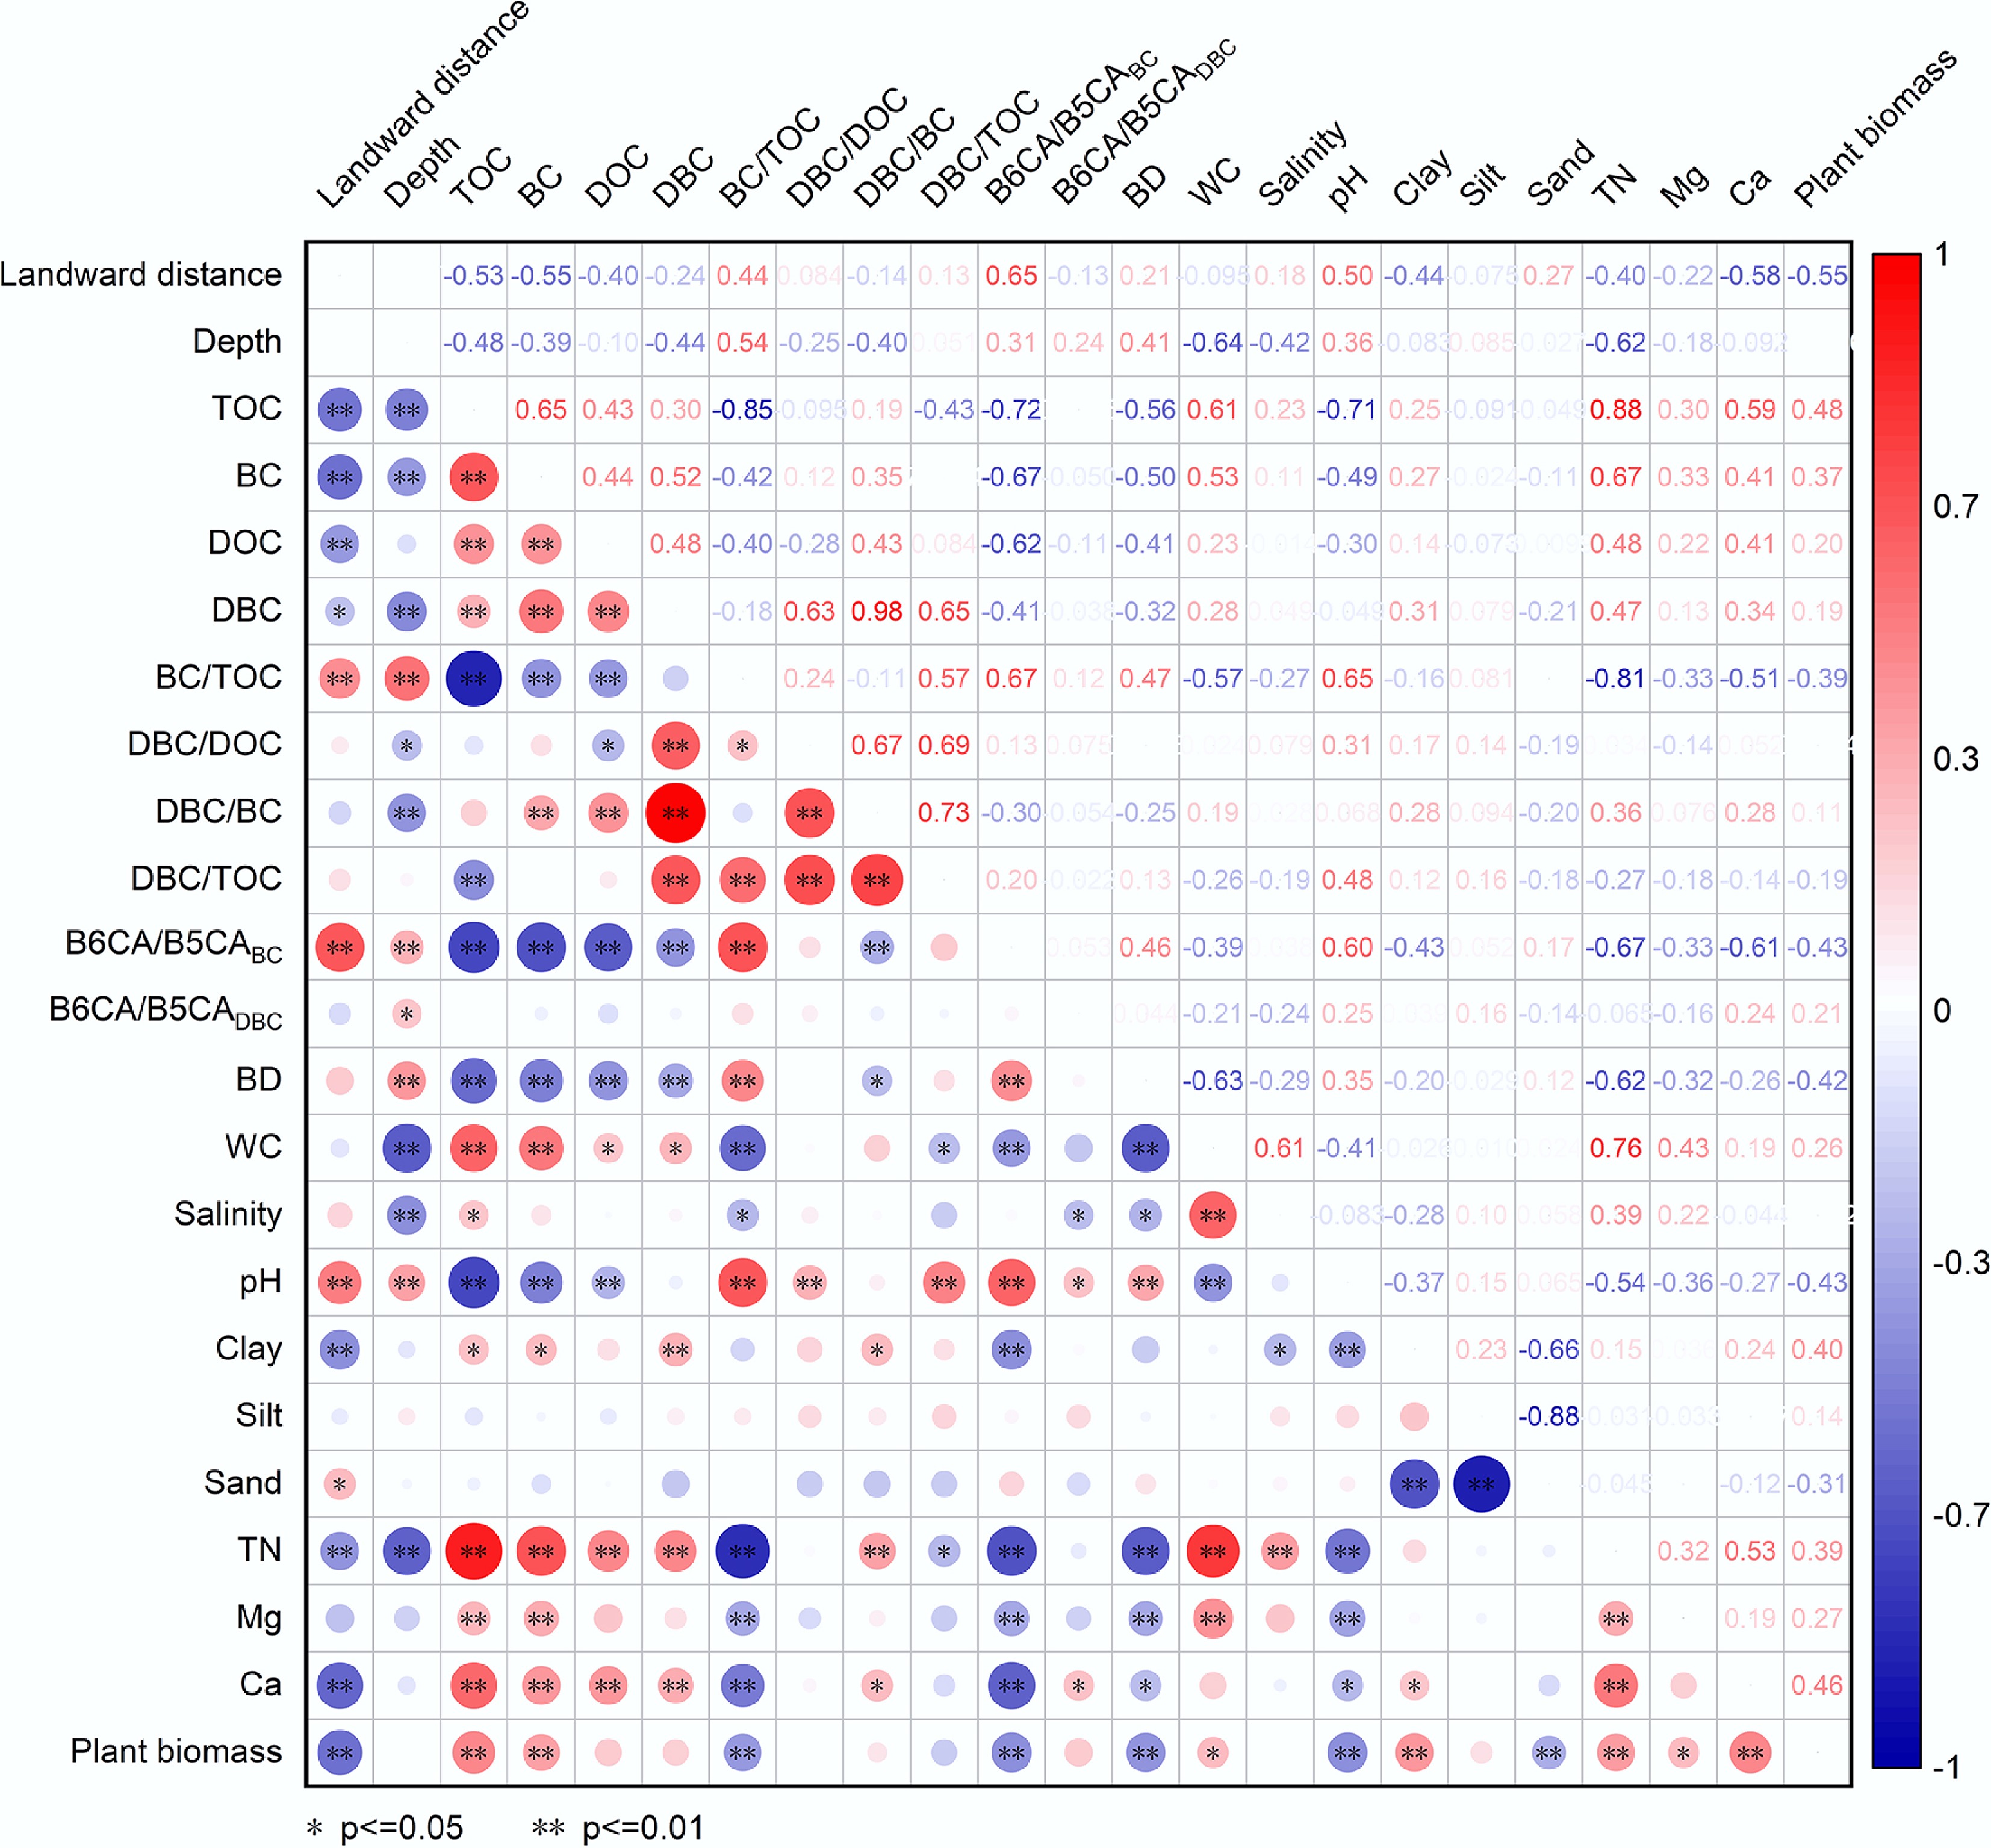
Figure 3.
Relationships among landward distance and depth and soil properties and plant biomass and soil carbon fractions. Abbreviations are the same as those in Fig. 2. BD: bulk density; WC: water content; TN: total nitrogen content. * and ** represent significance of p < 0.05 and p < 0.01, respectively. The size and color of the circles represent the values of the correlation coefficients.
-
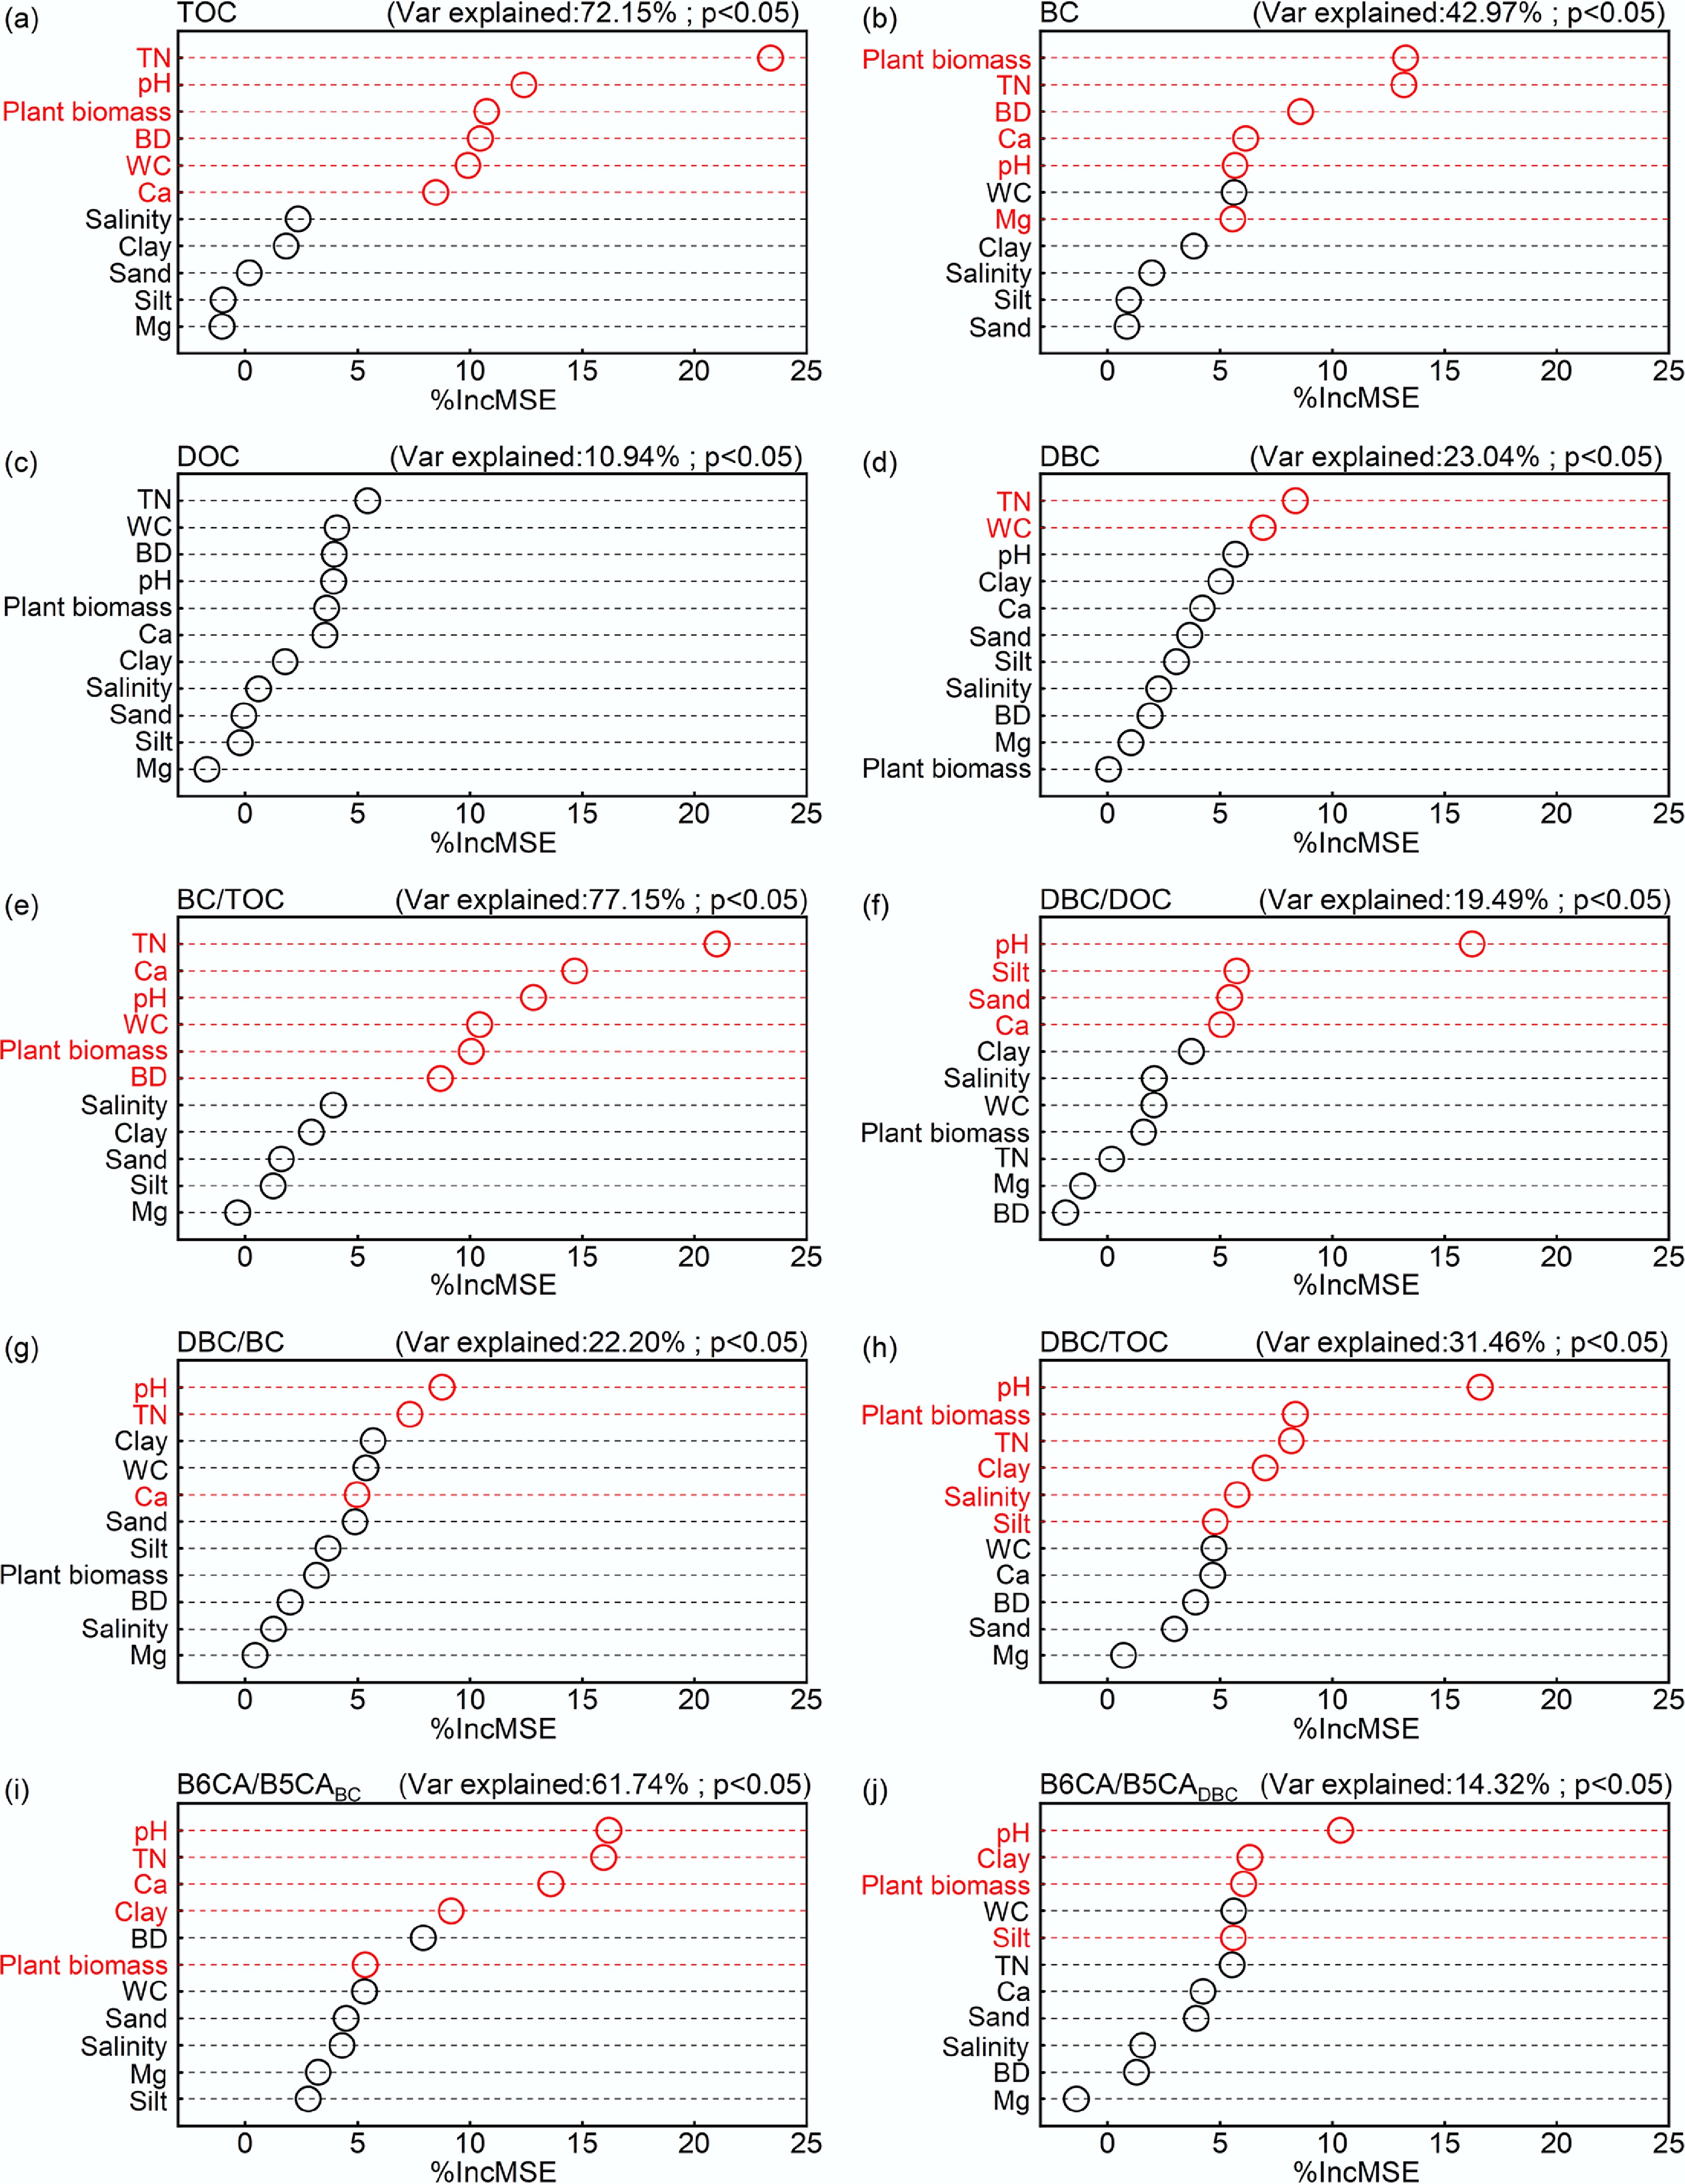
Figure 4.
Relative contributions of environmental variables to soil carbon fractions. Red color represents a significant effect. (a) Total organic carbon (TOC); (b) black carbon (BC); (c) dissolved organic carbon (DOC); (d) dissolved black carbon (DBC); (e) BC/TOC; (f) DBC/DOC; (g) DBC/BC; (h) DBC/TOC; (i) The ratio of B6CA to B5CA monomers in BC (B6CA/B5CABC); (j) The ratio of B6CA to B5CA monomers in DBC (B6CA/B5CADBC).
-
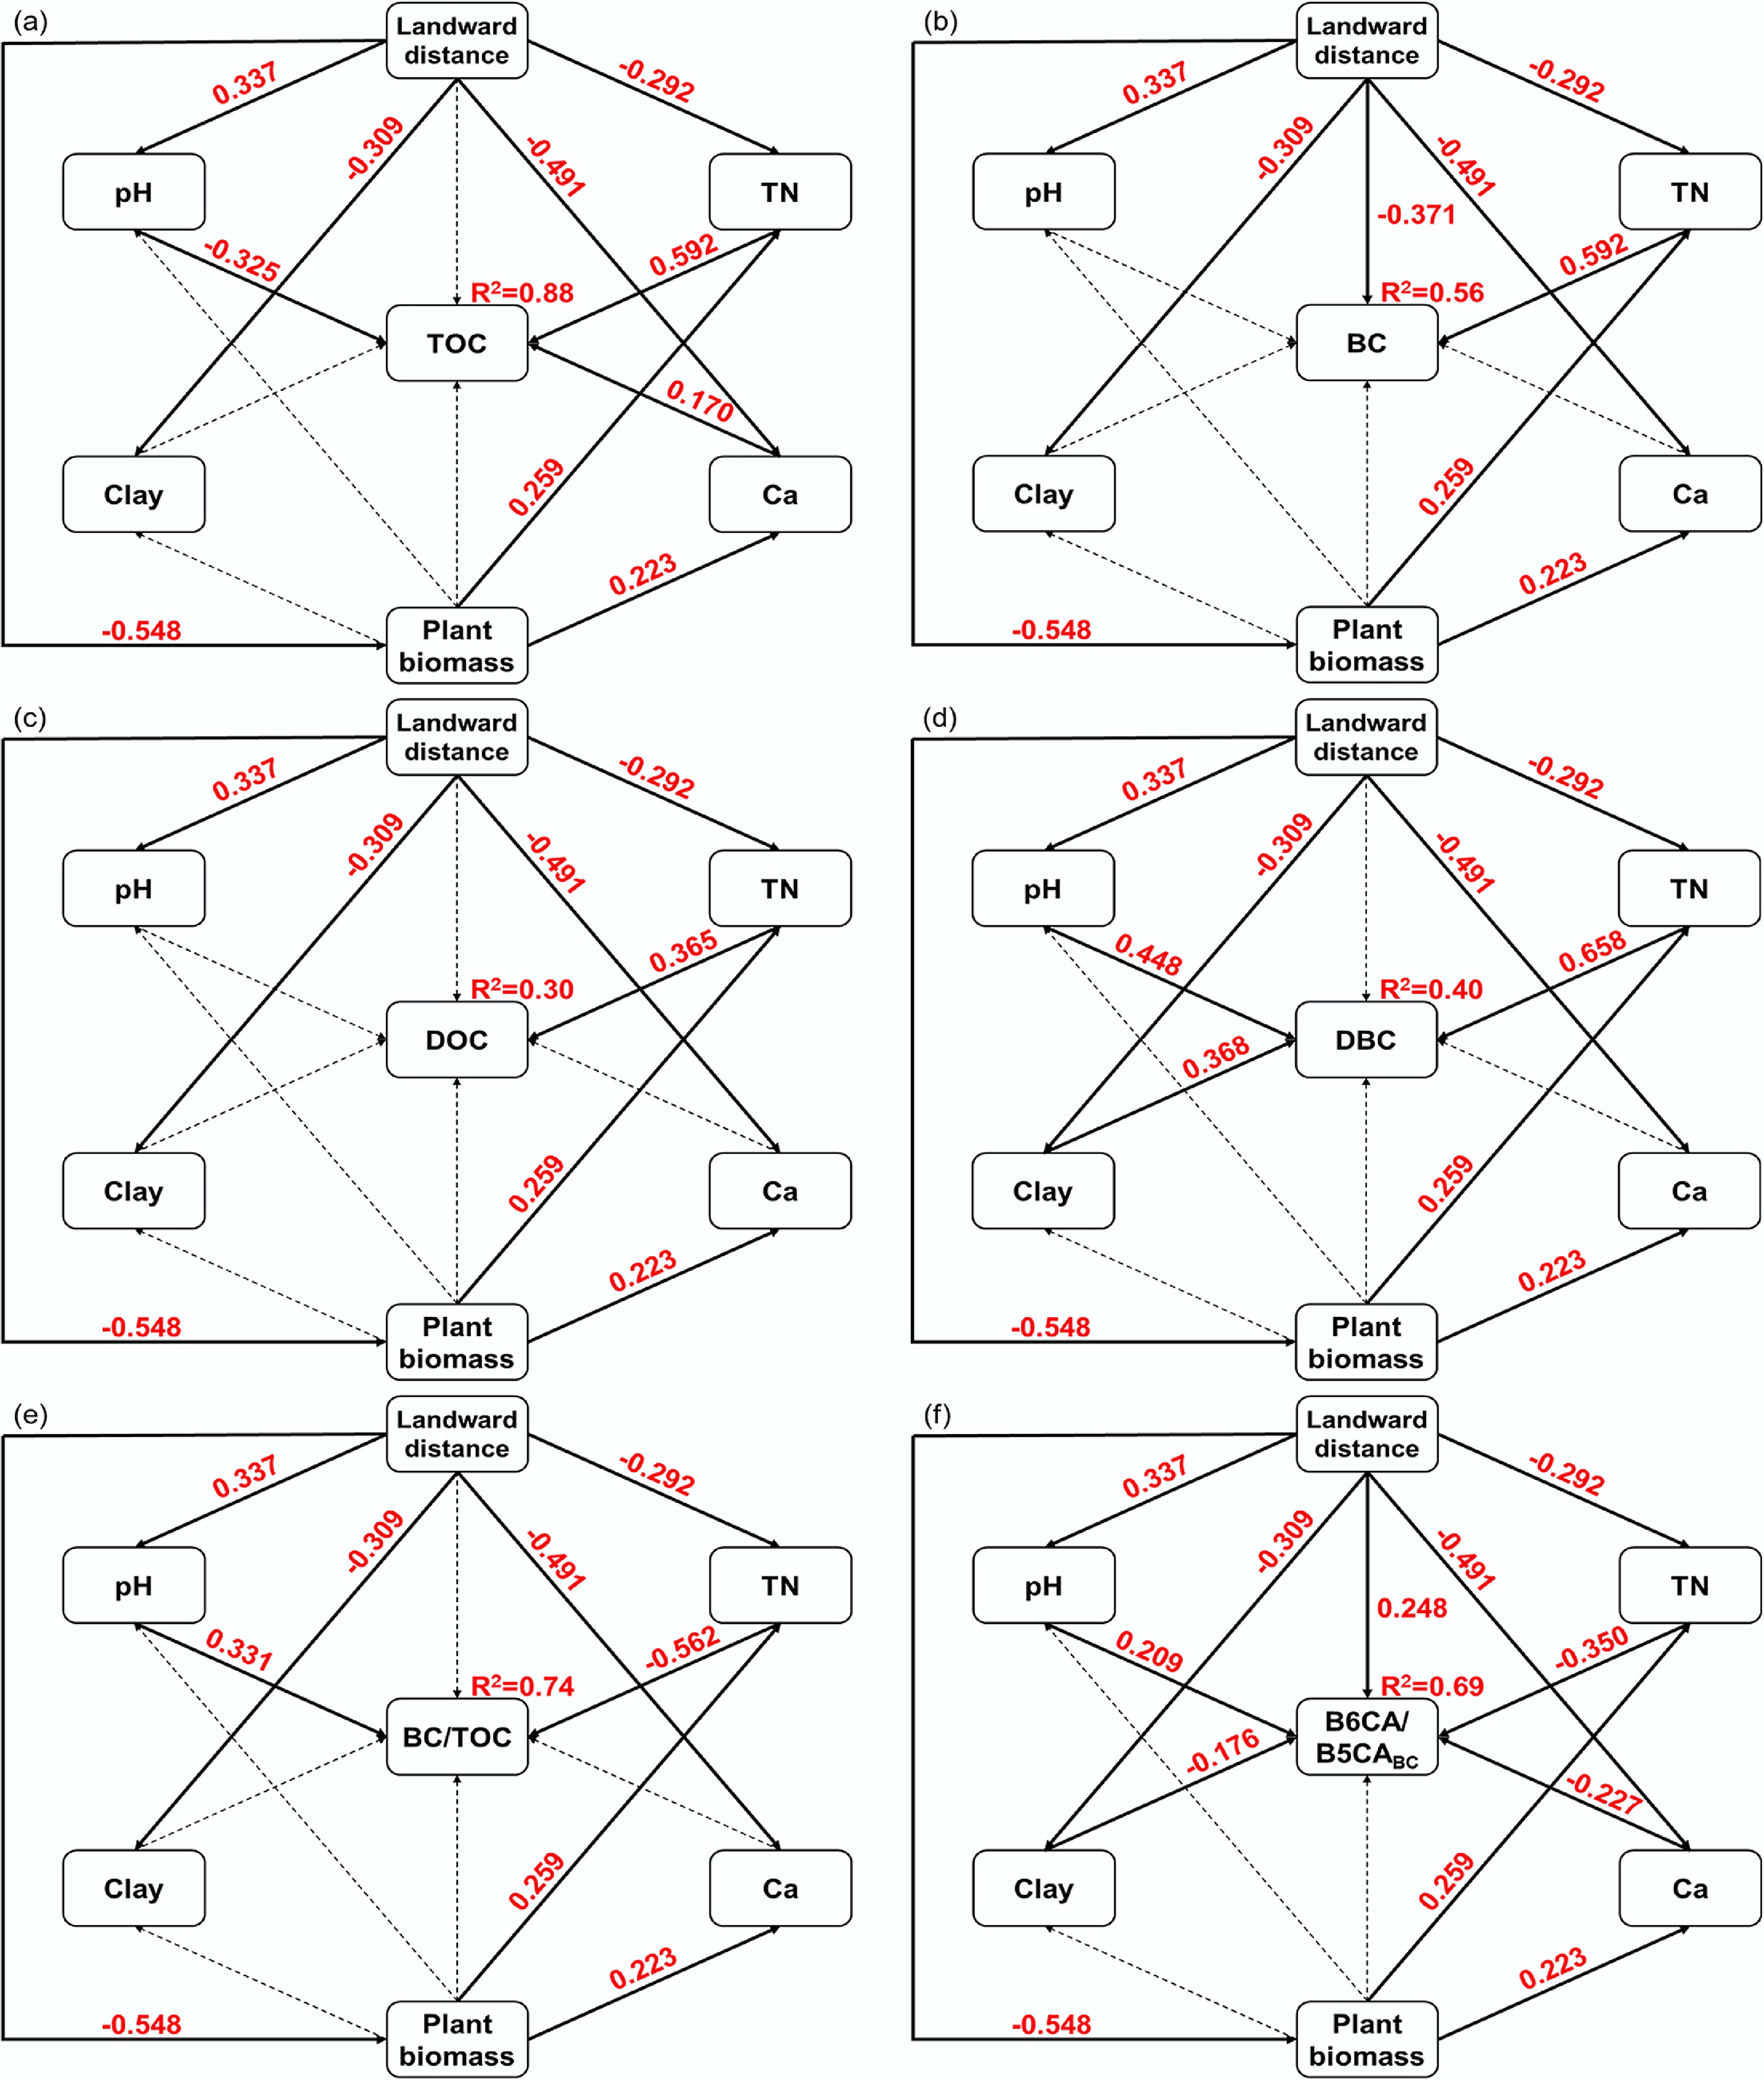
Figure 5.
Structural equation model diagram of the effects of landward distance on soil carbon fractions. (a) Total organic carbon (TOC); (b) black carbon (BC); (c) dissolved organic carbon (DOC); (d) dissolved black carbon (DBC); (e) BC/TOC; (f) The ratio of B6CA to B5CA monomers in BC (B6CA/B5CABC). Each box represents an observed variable. The values on the arrows (solid arrows and red numbers indicate significant effects; dotted arrows indicate insignificant effects) represent the path coefficients. Model fit indices: χ2 = 0.432, p = 0.511, df = 1, root mean square error of approximation = 0.00, normed fit index = 0.998−0.999, comparative fit index = 1.00.
-
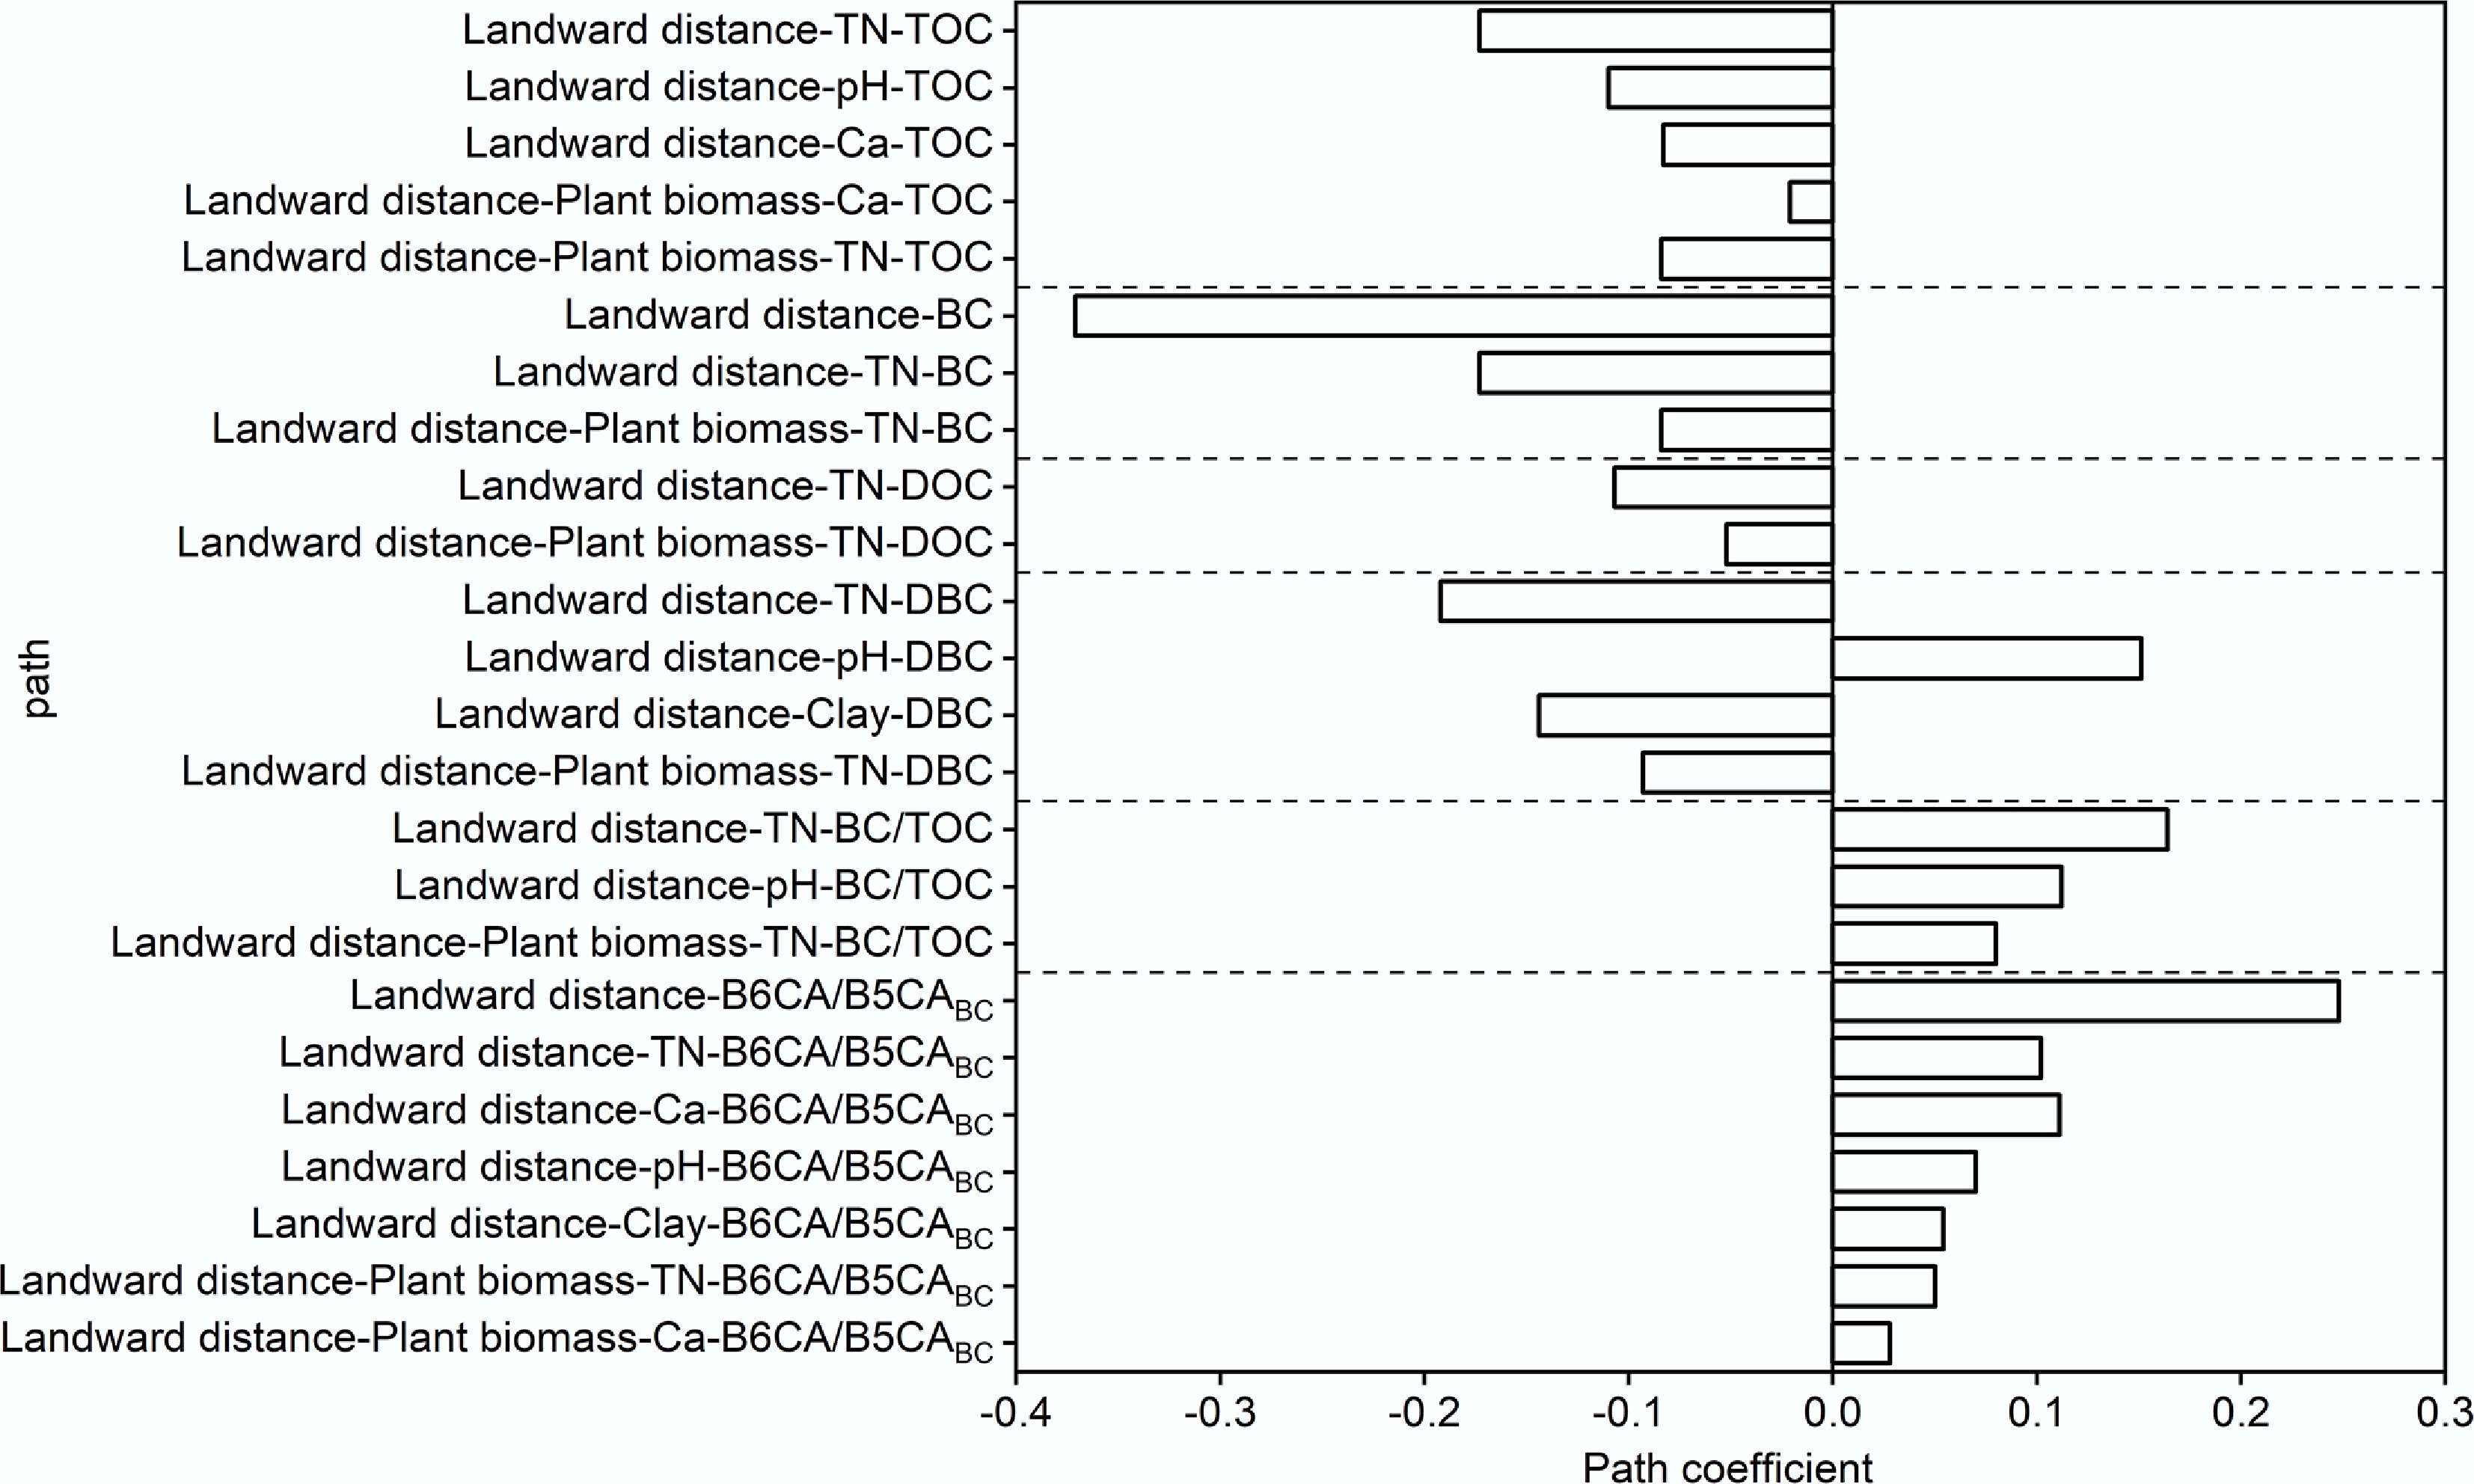
Figure 6.
Direct and indirect effects of landward distance on the soil carbon fraction contents.
-
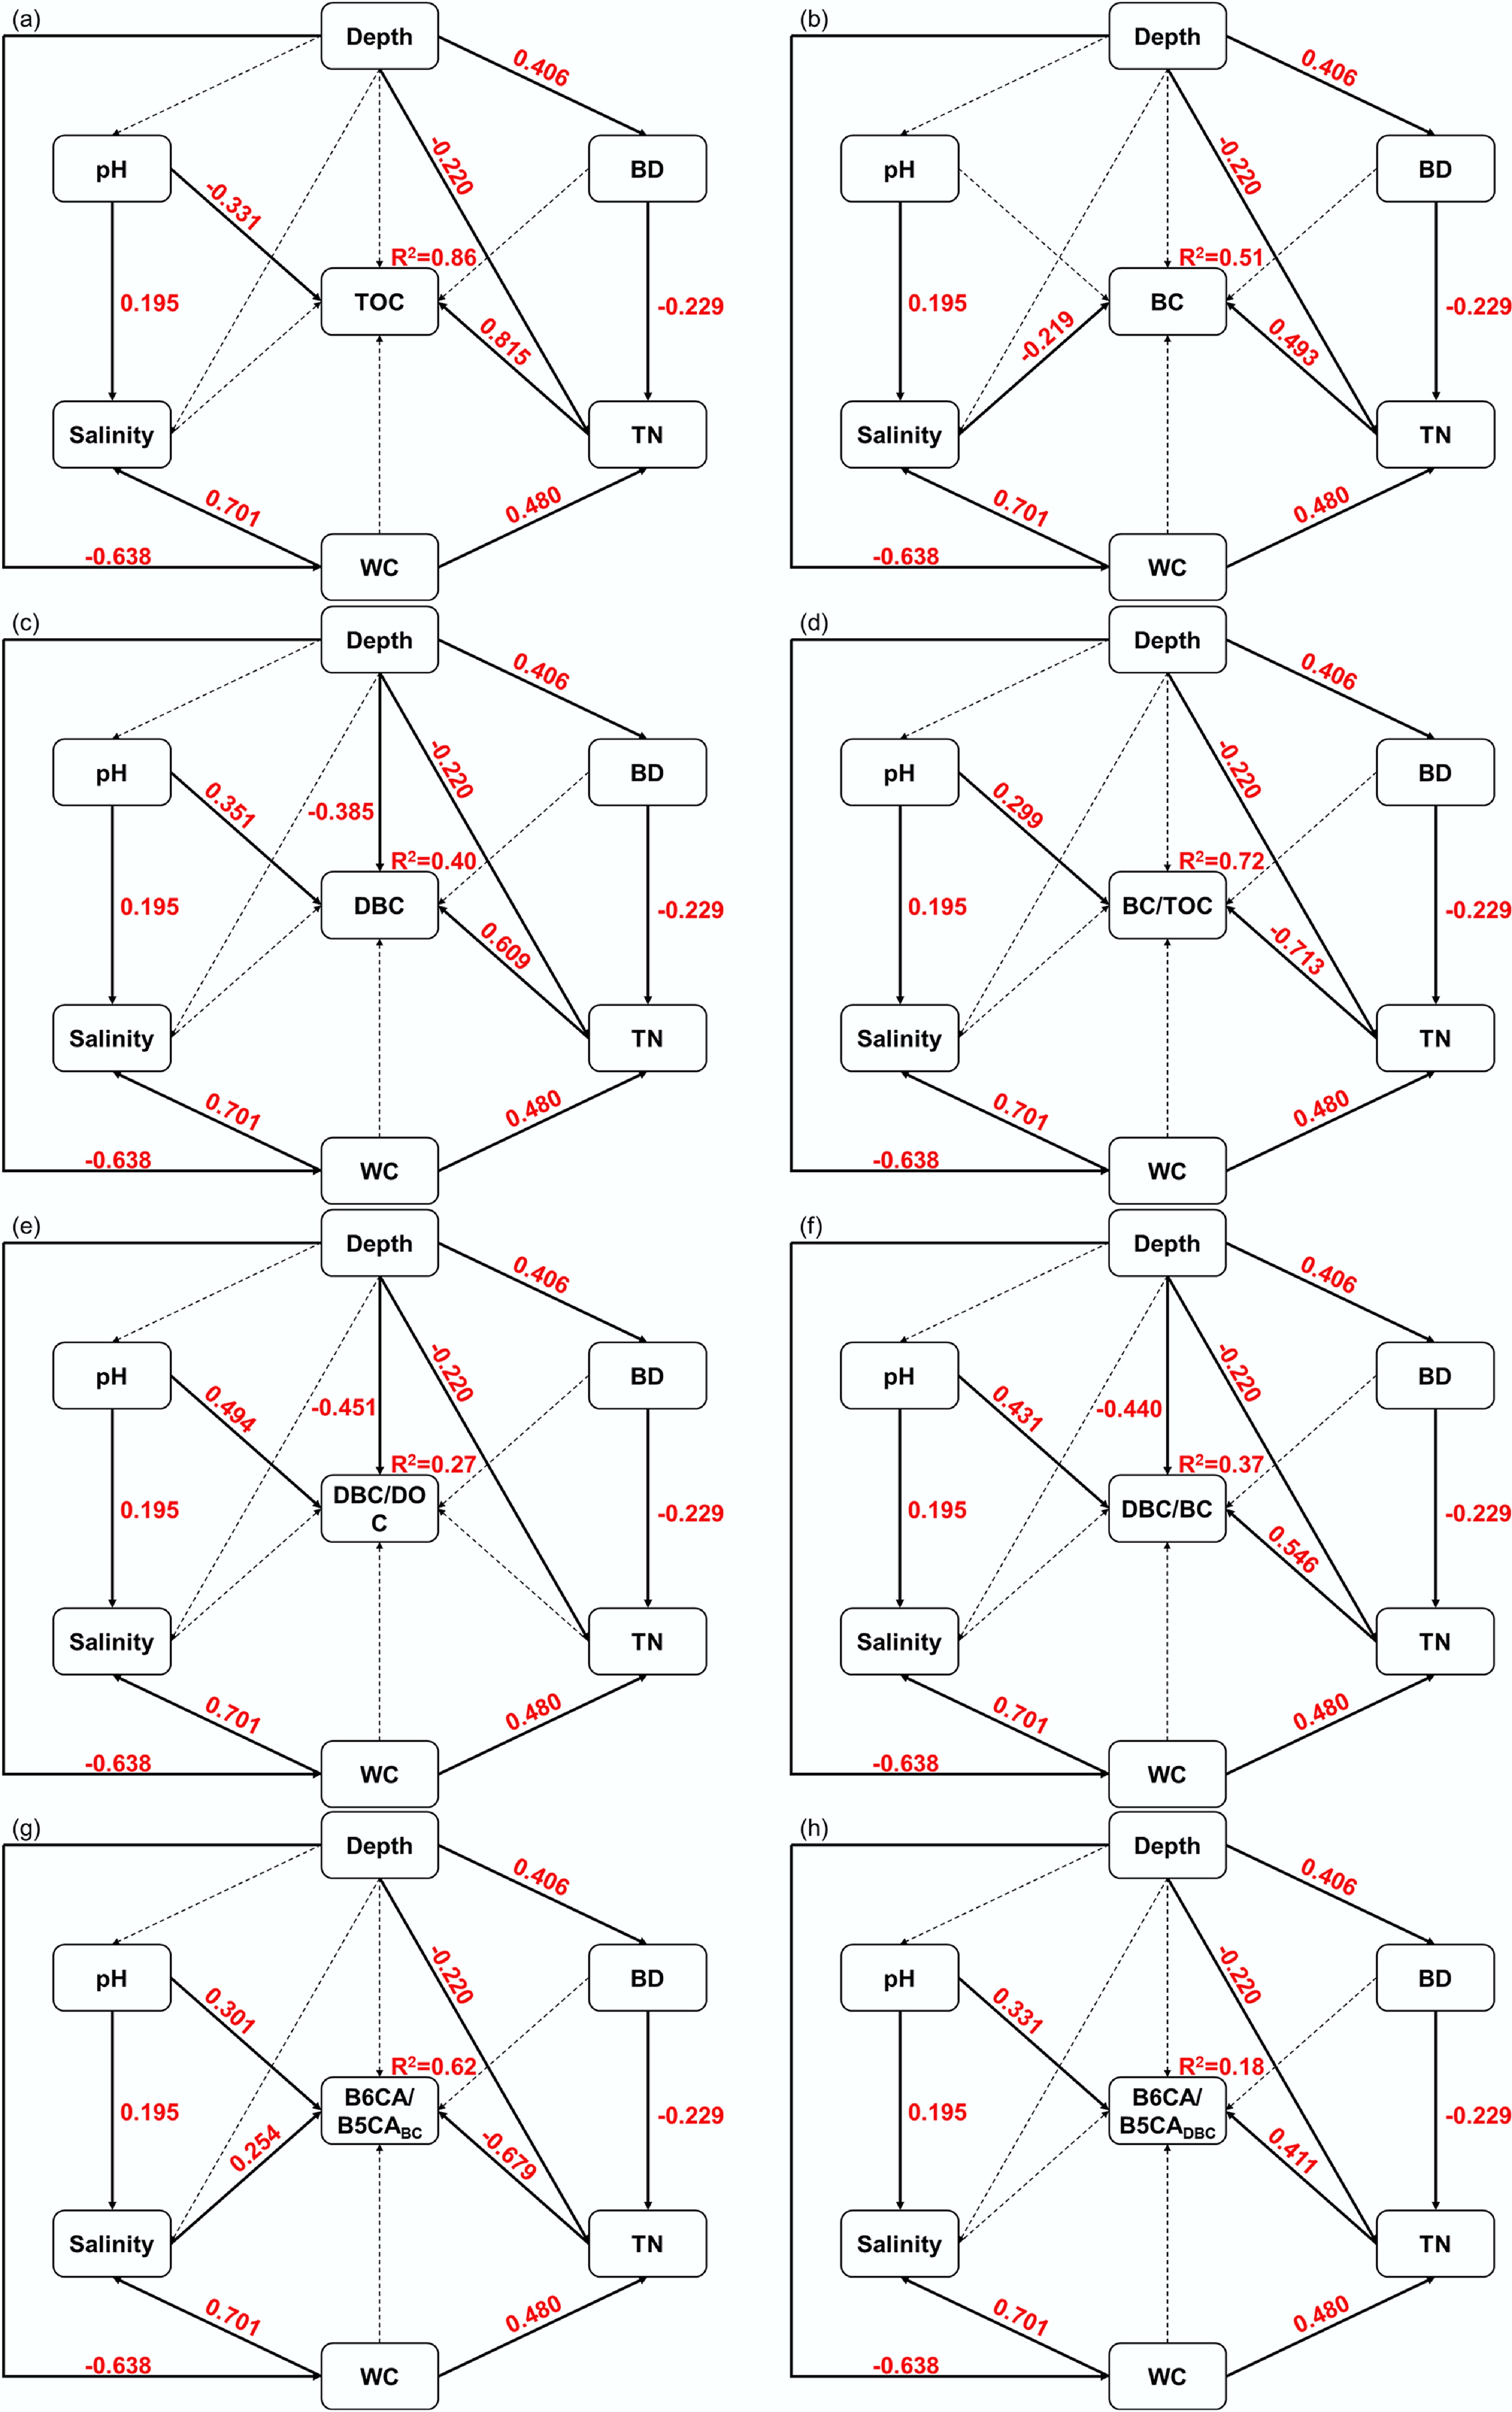
Figure 7.
Structural equation model diagram of the effects of depth on soil carbon fractions. (a) Total organic carbon (TOC); (b) black carbon (BC); (c) dissolved black carbon (DBC); (d) BC/TOC; (e) DBC/DOC; (f) DBC/BC; (g) The ratio of B6CA to B5CA monomers in BC (B6CA/B5CABC); (h) the ratio of B6CA to B5CA monomers in DBC (B6CA/B5CADBC). Each box represents an observed variable. The values on the arrows (solid arrows and red numbers indicate significant effects; dotted arrows indicate insignificant effects) represent the path coefficients. Model fit indices: χ2 = 0.382, p = 0.536, df = 1, root mean square error of approximation = 0.00, normed fit index = 0.998−0.999, comparative fit index = 1.00.
-
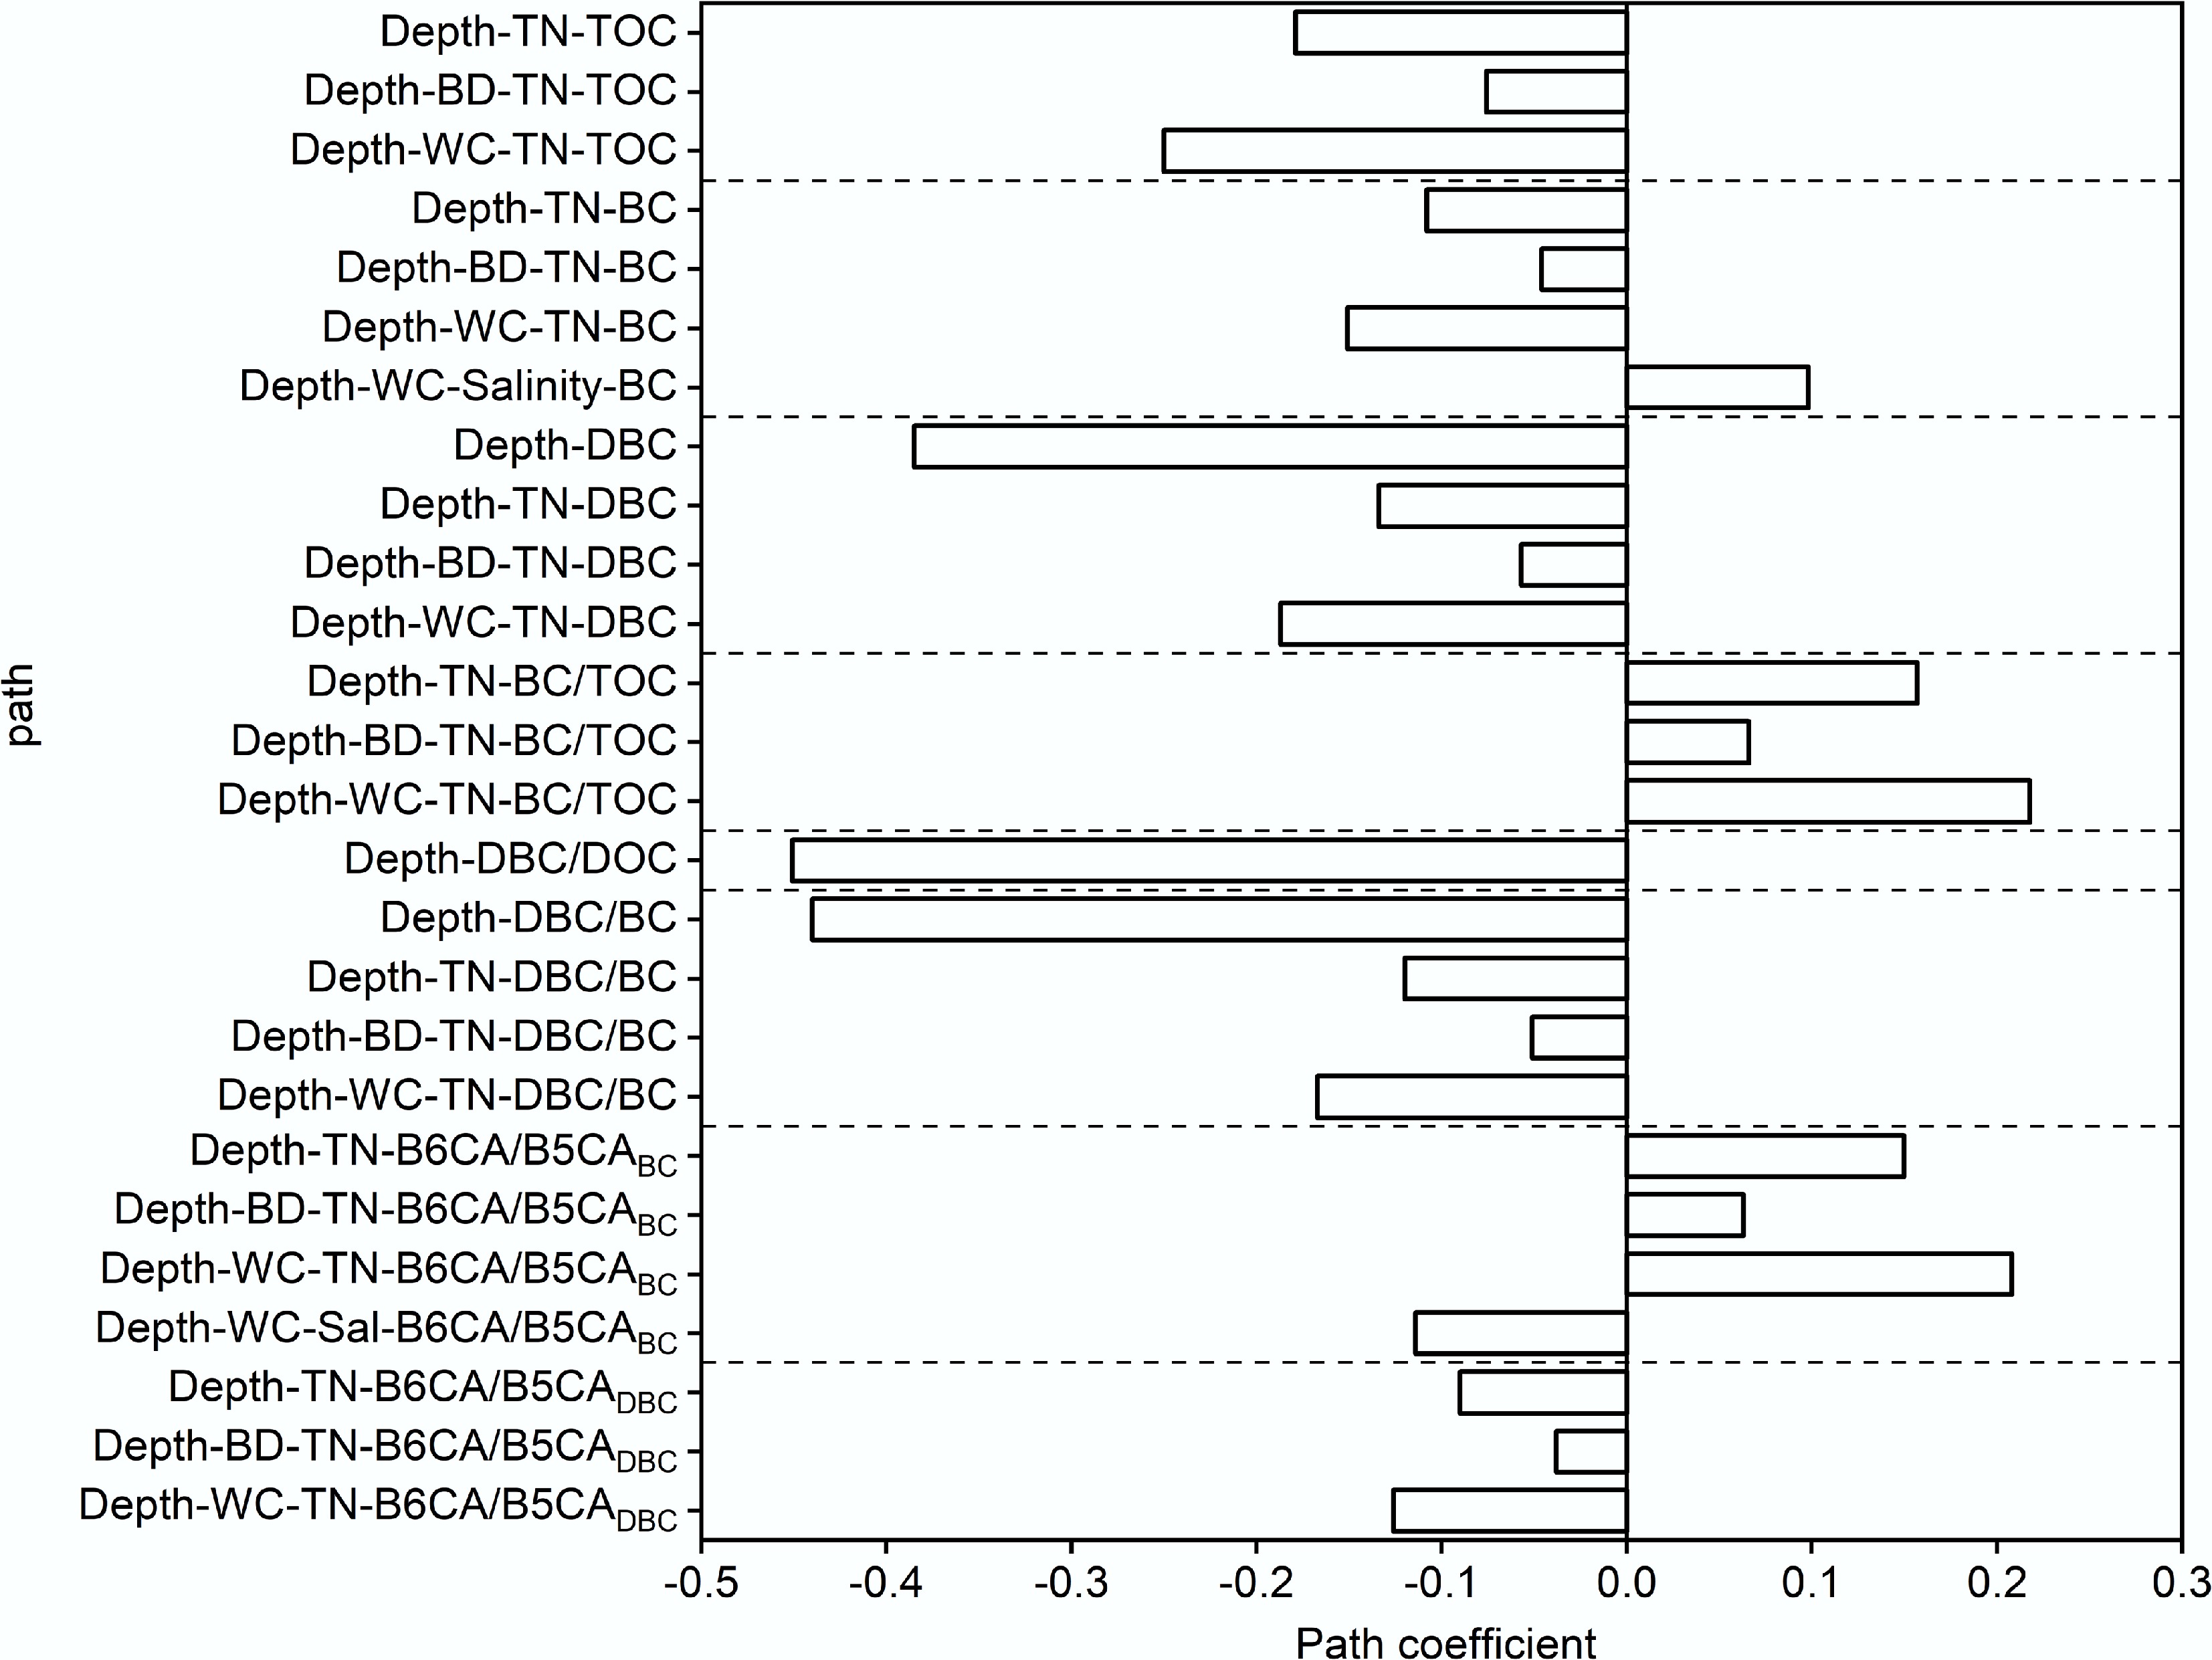
Figure 8.
Direct and indirect effects of soil depth on the soil carbon fraction content.
-
Parameter Mean ± SD CV (%) P1 0–15 cm P1 75–100 cm P5 0–15 cm P5 75–100 cm TOC (g/kg) 17.98 ± 7.70 42.8 30.07 23.18 20.92 7.08 BC (g/kg) 1.27 ± 0.16 13.0 1.50 1.39 1.36 1.13 DOC (g/kg) 0.29 ± 0.16 53.6 0.36 0.59 0.31 0.20 DBC (mg/kg) 3.29 ± 2.07 63.1 7.90 3.76 5.51 2.29 TOC density (kg/m3) 15.10 ± 5.49 36.4 22.24 18.12 16.46 6.71 BC density (kg/m3) 1.10 ± 0.18 16.6 1.10 1.16 1.07 1.07 DOC density (kg/m3) 0.25 ± 0.11 44.2 0.26 0.41 0.25 0.19 DBC density (g/m3) 2.78 ± 1.53 54.9 5.61 2.80 4.44 2.18 BC/TOC (%) 8.26 ± 3.34 40.5 5.85 6.35 6.51 16.00 DBC/DOC (%) 1.21 ± 0.56 46.4 2.17 0.82 1.73 1.33 DBC/BC (‰) 2.53 ± 1.34 52.8 5.22 2.75 4.04 2.02 DBC/TOC (‰) 0.21 ± 0.12 58.3 0.31 0.16 0.26 0.32 B6CA/B5CABC 1.44 ± 0.12 8.6 1.35 1.24 1.38 1.62 B6CA/B5CADBC 0.40 ± 0.04 11.2 0.43 0.40 0.38 0.45 Mean ± SD stands for the mean ± standard deviation; CV represents the coefficient of variation; P1 is the mean of data from three sampling points P1-T1, P1-T2, and P1-T3; P5 is the mean of data from three sampling points P5-T1, P5-T2, and P5-T3. Table 1.
Statistics for soil carbon fractions and ratios
Figures
(8)
Tables
(1)