


-
Black carbon (BC), a byproduct of incomplete biomass and fossil fuel combustion, encompasses a continuum of carbon-rich organic materials ranging from charcoal to soot[1,2]. Due to its condensed aromatic structure, BC is highly recalcitrant and can persist in the atmosphere, soil, and aquatic environments for centuries, making it a substantial carbon sink[3,4]. Wildfires are the dominant natural source of BC, with over 80% retained in terrestrial soils[5]. Globally, BC is deposited in soils at a rate of 56–123 Tg yr−1, with soil BC accounting for roughly 13.7% of total soil organic carbon[2,6]. Over time, BC undergoes oxidative aging, and produces a water-soluble fraction, known as dissolved black carbon (DBC). The recognition of DBC has reshaped our understanding of BC stability and turnover, as it represents a mobile form capable of long-range transport[7]. Soils export an estimated 27 Tg of DBC annually to rivers, where it constitutes ~10.6% of the dissolved organic carbon (DOC) flux in rivers, playing a critical role in the global carbon cycle[8].
Mangrove forests, typically found in tropical and subtropical coastal intertidal zones, are characterized by evergreen shrubs and trees that are adapted to tidal inundation[9]. Their waterlogged and anoxic conditions slow organic carbon decomposition, making them one of the most important 'blue carbon' ecosystems[10,11]. Although mangroves cover only ~0.5% of global coastlines, they account for 10%–15% of coastal sediment carbon storage, with 49%–98% of total ecosystem carbon retained in soils[10]. Additionally, mangroves account for approximately 10% of the global particulate terrestrial carbon flux to the ocean[12]. The spatial heterogeneity of total organic carbon (TOC) in mangrove soils is influenced by soil nutrients, pH, and clay content across both land-ocean and soil depth transects[13]. As a recalcitrant component of TOC, BC likely plays a crucial role in the global coastal blue carbon budget[14−16]. Yet, BC remains underrepresented in global carbon models[6], and poorly studied in coastal ecosystems, particularly mangrove soils[17]. Previous studies have reported strong correlations between BC and TOC, both showing decreasing trends with increasing distance from land and soil depth[18−20]. Moreover, BC tends to accumulate in fine-grained sediments within mangrove environments, underscoring its potential contribution to long-term carbon sequestration[21]. Understanding BC distribution and its controlling factors in mangrove soils is therefore vital for assessing and managing blue carbon storage.
Mangrove soils are also an important source of DBC exported to coastal waters via surface runoff and groundwater discharge, representing a major pathway of BC loss from terrestrial systems[22−24]. In the coastal wetlands of the Everglades, DBC concentrations were positively correlated with DOC concentrations, suggesting that both fractions share similar geochemical behaviors[17]. Radiocarbon measurements indicate that DBC is generally older than DOC but younger in coastal rivers than in marine environments, reflecting its relative resistance to microbial degradation and its gradual aging during transport[25,26]. Despite growing recognition of DBC as a link between terrestrial and marine carbon cycles, its spatial distribution and environmental drivers in mangrove ecosystems remain poorly understood. Investigating DBC variations along land–sea and soil depth gradients is thus crucial to clarify its transformation and transport processes.
Research on BC in mangroves has largely focused on tropical ecosystems, with BC dynamics in high-latitude mangroves remaining poorly understood. As a naturally distributed high-latitude subtropical mangrove wetland in China, the mangrove forest in the Zhangjiang Estuary plays a crucial role in carbon sequestration and emissions reduction[27]. Unlike previous assessments that largely examined BC or DBC in isolation, this study integrates the analysis of both solid BC and water-extractable DBC within the soil matrix across two gradients: land-to-sea distance and soil depth. The objectives were to: (1) characterize the spatial distribution of BC and DBC in mangrove soils; (2) explore the influence of soil physicochemical properties on BC and DBC distribution; and (3) analyze the potential pathways through which environmental factors regulate BC and DBC variations along land-to-sea and soil depth gradients. The findings would enhance our understanding of BC and DBC cycling in mangrove soils, and provide a scientific basis for optimizing mangrove carbon management and sequestration strategies.
-
The study was conducted in the Zhangjiang Estuary Mangrove National Nature Reserve, Fujian Province, China (23°53′45″–23°56′00″ N, 117°24′07″–117°30′00″ E; Fig. 1). This reserve is a naturally distributed high-latitude mangrove ecosystem in China[28]. Covering an area of 2,360 ha, it is located in the northwest of Dongshan Bay and experiences a subtropical monsoon climate, with a mean annual temperature of 14.1–28.5 °C and precipitation of 15–330 mm[29]. The tidal regime is irregular semi-diurnal, with an average tidal range of 2.32 m (ranging from 0.43 to 4.67 m). The highest and lowest tidal levels are 2.80 m and −2.00 m, respectively, while the mean sea level is 0.46 m[30]. The dominant mangrove species in this region include Kandelia obovata, Avicennia marina, Acanthus ilicifolius, Aegiceras corniculatum, and Derris trifoliata[31], with canopy heights typically ranging from 3 to 5 m. The surface sediment beneath the mangrove canopy is subjected to tidal inundation twice daily.
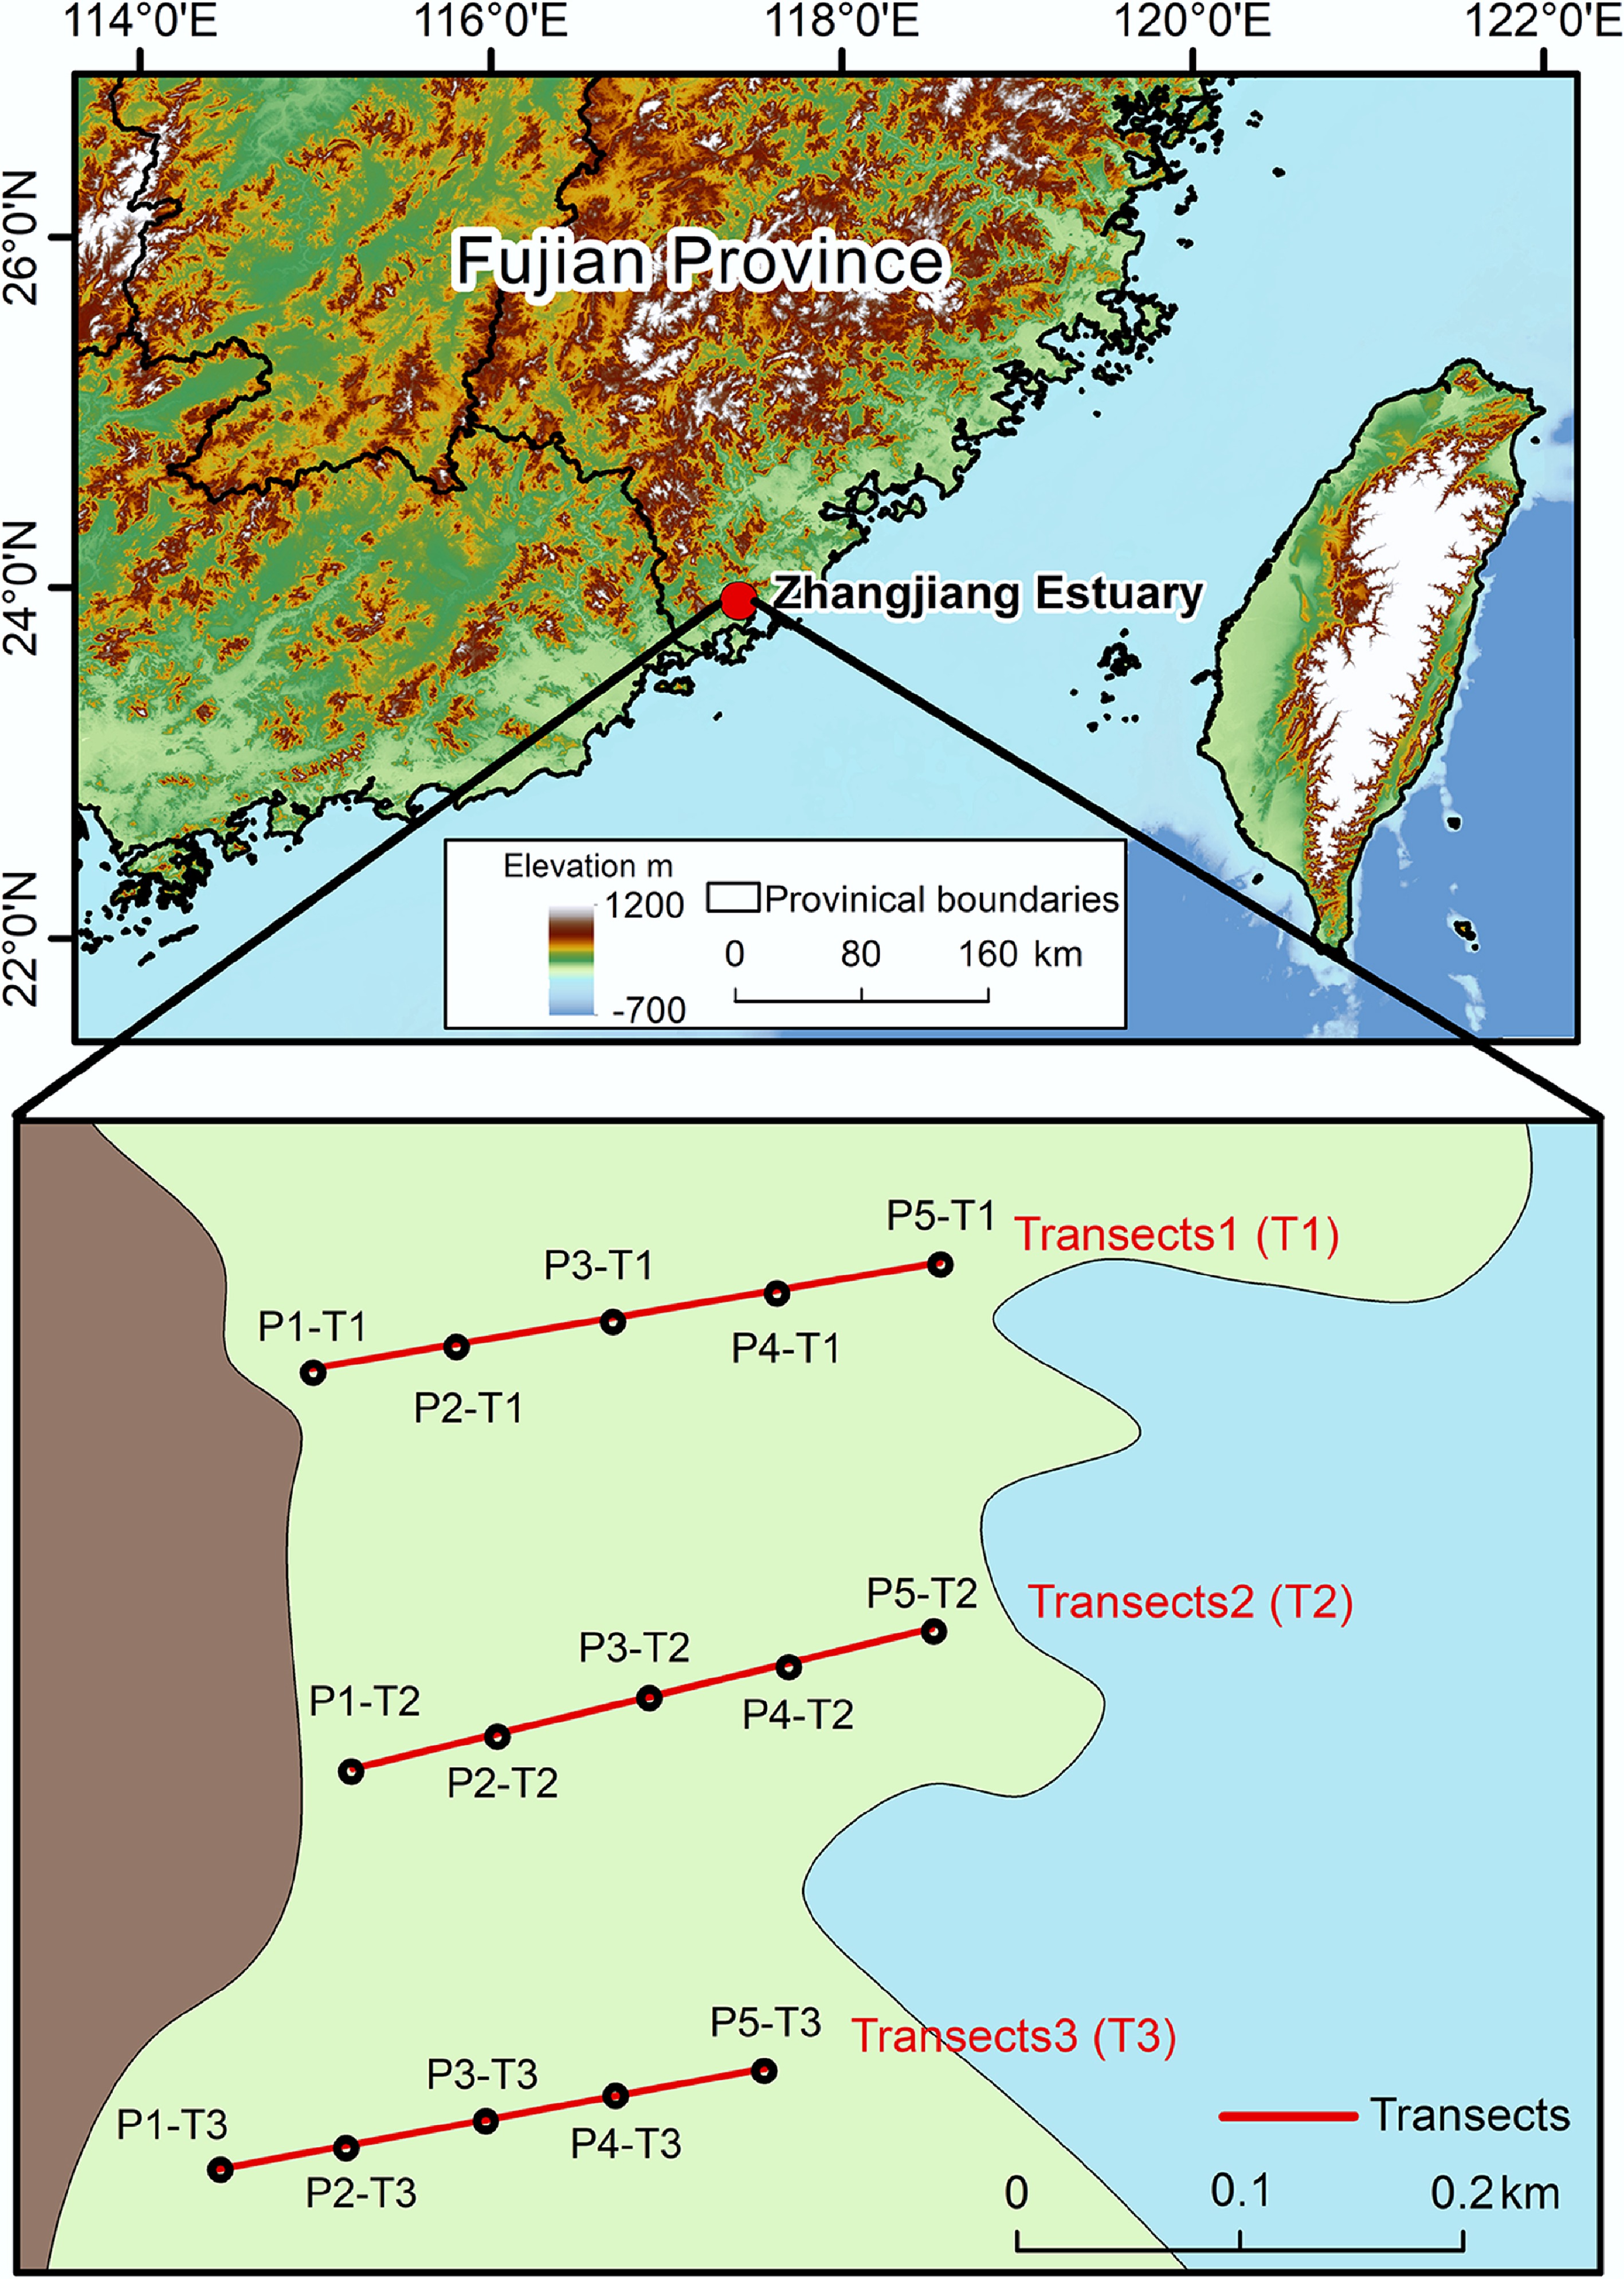
Figure 1.
Transects of mangrove soil in Zhangjiang Estuary, including 15 sampling sites.
Sampling methods
-
To investigate the spatial distribution of BC and DBC, three transects (T1–T3) were established along a land-to-sea gradient (Fig. 1). Each transect covered a total length of 200–300 m, and the transects were approximately parallel to each other. Five sampling points (P1–P5) were placed along each transect, with an interval of approximately 50 m between adjacent points, resulting in a total of 15 sampling locations. Soil cores were collected using an Eijkelkamp gouge auger and sectioned into five depth intervals: 0–15, 15–30, 30–50, 50–75, and 75–100 cm, and the soil from each depth interval was thoroughly mixed to reflect the average characteristics of the sample. A total of 75 soil samples were obtained. Samples were sealed in airtight bags, transported to the laboratory in ice-cooled containers, and stored at 4 °C for further analysis.
Soil properties measurements
-
Soil samples were dried at 60 °C to a constant weight to determine bulk density (BD) and water content (WC). Grain size distribution was analyzed using a laser particle size analyzer (Malvern Mastersizer 3000). After removing plant roots, litter, and potential stones, samples were ground and manually sieved through a 100-mesh sieve. This pretreatment homogenizes the soil aggregates and minimizes the potential bias caused by variations in original soil bulk density or structure across different depths. Soil pH and salinity were measured in a 1:5 soil-to-water suspension. Exchangeable calcium (Ca) and magnesium (Mg) were extracted with 0.1 M BaCl2 solution and quantified via atomic absorption spectrophotometry[32]. Inorganic carbon was removed by acidifying samples with hydrochloric acid (HCl), followed by repeated washing with deionized water. The treated samples were oven-dried, homogenized, and analyzed for TOC using an elemental analyzer (Vario EL Elemental Analyzer). DOC was extracted by mixing 3 g of air-dried soil with 60 mL of ultrapure water, shaking at 150 rpm and 25 °C for 24 h, and centrifuging at 2,000 rpm for 10 min. The supernatant was filtered through a 0.45-μm polyethersulfone membrane (Millipore Express® PLUS). DOC concentration was measured using a total organic carbon analyzer (TOC-L CSH/CSN, Shimadzu, Japan), and the remaining filtrate was preserved for subsequent DBC analysis.
Soil black carbon measurements
-
BC in soil and DBC in aqueous extracts were quantified using the benzene polycarboxylic acid (BPCA) marker method[33−35]. For BC analysis, 50 mg of soil was placed in a 5 mL ampoule, mixed with 2 mL of 65% concentrated nitric acid (GR grade, Sinopharm), sealed, and digested in a reaction vessel at 170 °C for 8 h. For DBC analysis, an aliquot of aqueous extract containing 5–10 μmol carbon was dried at 60 °C to concentrate the sample. The residue was eluted in three steps using 1.5 mL of 65% nitric acid, transferred to a 5 mL ampoule, and sealed for high-temperature digestion at 170 °C for 8 h.
Following digestion, ampoules were cooled to room temperature. The resulting solution was dried at 50 °C under a nitrogen stream, reconstituted in 1 mL of ultrapure water, and filtered through a 0.45 μm polytetrafluoroethylene (PTFE) membrane. The filtrate was analyzed using a high-performance liquid chromatograph with a photodiode array detector (HPLC-PAD; U3000, ThermoFisher, USA). Separation was performed on a Poroshell 120 SB-C18 column (100 mm × 4.6 mm, 2.7 μm; Agilent Technologies, Santa Clara, USA) using a gradient of two mobile phases: (A) a mixture of 20 mL 85% phosphoric acid (Sigma Aldrich) and 980 mL ultrapure water; and (B) high-performance liquid chromatography-grade acetonitrile (Sigma Aldrich). The UV detection range was 190–400 nm, with quantification at 240 nm. Column temperature was maintained at 30 °C, with an injection volume of 10 μL and a flow rate of 0.4 mL/min.
The mixed BPCA standard solution contained three benzene tricarboxylic acid isomers (B3CA, including hemimellitic, trimesic, and trimellitic acids), one benzene tetracarboxylic acid isomer (B4CA, including pyromellitic, prehnitic, and mellophanic acids), one benzene pentacarboxylic acid (B5CA), and one benzene hexacarboxylic acid (B6CA). Due to the unavailability of prehnitic and mellophanic acids, quantification was based on the pyromellitic acid calibration curve[34,35]. Quantification of BC was performed using a nine-point external calibration curve with concentrations of 1, 2, 5, 10, 20, 40, 80, 100, and 200 mg/L, yielding coefficients of determination (R2) greater than 0.999. Similarly, DBC quantification utilized an eight-point external calibration curve (1, 2, 4, 8, 10, 20, 40, and 80 mg/L), with R2 values also exceeding 0.999 to ensure data accuracy. Procedural blanks were included in each analytical batch and were consistently below the detection limit for individual BPCAs. Blank values were therefore negligible relative to sample concentrations, and were not subtracted. Replicate BPCA analyses (n = 3) showed relative standard deviations generally below 5%, indicating high analytical reproducibility. Typical BPCA recoveries were within the range of 95%−100%, confirming the robustness of the oxidation and analytical procedure.
BC concentration was calculated from BPCA-derived carbon using the conversion factor[33,35]:
$ \text{[BC]}=2.27\times(\left[\text{B6CA-C}\right]+\left[\text{B5CA-C}\right]+\left[\text{B4CA-C}\right]+\left[\text{B3CA-C}\right]) $ (1) where, [BC] is the BC concentration in soil (mg/g), and [B6CA-C], [B5CA-C], [B4CA-C], and [B3CA-C] are the carbon concentrations of the respective BPCA monomers (mg/g).
DBC concentration was estimated from the relationship between DBC and B5CA, and B6CA content[36,37]:
$ \left[\text{DBC}\right]={0.0891\times \left(\left[\text{B6CA}\right] +\left[\text{B5CA}\right]\right)}^{0.9175} $ (2) where, DBC concentration in water extract ([DBC]) is expressed in μmol/L, and B6CA and B5CA concentrations in water extract ([B6CA] and [B5CA], respectively) are in nmol/L. Soil DBC content (mg/g) was calculated based on the soil-to-water extraction ratio. The B6CA-to-B5CA ratios for BC (B6CA/B5CABC) and DBC (B6CA/B5CADBC) were calculated to indicate the condensed aromaticity degree of BC and DBC, respectively.
Statistical analyses
-
Data processing was performed using Microsoft Excel 2010. Results are presented as mean ± standard deviation. Statistical analyses were conducted using Origin 2021, and IBM SPSS Statistics 25. Pearson correlation was applied to examine relationships between soil TOC, BC, DOC, and DBC, and their ratios with landward distance (i.e., distance from land), soil depth, and physicochemical properties. Random forest (RF) models were developed in RStudio using the 'randomForest' and 'rfPermute' packages to assess the relative influence of environmental variables on soil carbon fractions. Variables exhibiting significant correlations with landward distance and depth were respectively selected and incorporated into the construction of the structural equation model (SEM), which was performed using IBM SPSS Amos to assess direct and indirect pathways among environmental factors and carbon pools.
-
The TOC, BC, DOC, and DBC contents, along with their stoichiometric ratios in mangrove soils, are presented in Table 1 and Fig. 2. The coefficients of variation for TOC, BC, DOC, and DBC were 42.8%, 13.0%, 53.6%, and 63.1%, respectively, indicating lower spatial heterogeneity in BC than in TOC but greater variability in DBC than in DOC. The average BC content in the studied mangrove soils was 1.27 ± 0.16 g/kg (range: 0.95–1.67 g/kg). This value is lower than those reported for surface soils in Hainan mangroves (1.83 g/kg) and sediments from the more urbanized western and southern coasts of Peninsular Malaysia (2.7 ± 0.8 g/kg, range: 0.40–3.60 g/kg)[19,20,38]. However, it is slightly higher than those in East China Sea surface sediments (0.86 ± 0.31 g/kg, range: 0.30–1.52 g/kg) and in the relatively pristine eastern coast of Peninsular Malaysia (1.1 ± 0.5 g/kg, range: 0.2–2.0 g/kg)[18,19].
Table 1. Statistics for soil carbon fractions and ratios
Parameter Mean ± SD CV (%) P1 0–15 cm P1 75–100 cm P5 0–15 cm P5 75–100 cm TOC (g/kg) 17.98 ± 7.70 42.8 30.07 23.18 20.92 7.08 BC (g/kg) 1.27 ± 0.16 13.0 1.50 1.39 1.36 1.13 DOC (g/kg) 0.29 ± 0.16 53.6 0.36 0.59 0.31 0.20 DBC (mg/kg) 3.29 ± 2.07 63.1 7.90 3.76 5.51 2.29 TOC density (kg/m3) 15.10 ± 5.49 36.4 22.24 18.12 16.46 6.71 BC density (kg/m3) 1.10 ± 0.18 16.6 1.10 1.16 1.07 1.07 DOC density (kg/m3) 0.25 ± 0.11 44.2 0.26 0.41 0.25 0.19 DBC density (g/m3) 2.78 ± 1.53 54.9 5.61 2.80 4.44 2.18 BC/TOC (%) 8.26 ± 3.34 40.5 5.85 6.35 6.51 16.00 DBC/DOC (%) 1.21 ± 0.56 46.4 2.17 0.82 1.73 1.33 DBC/BC (‰) 2.53 ± 1.34 52.8 5.22 2.75 4.04 2.02 DBC/TOC (‰) 0.21 ± 0.12 58.3 0.31 0.16 0.26 0.32 B6CA/B5CABC 1.44 ± 0.12 8.6 1.35 1.24 1.38 1.62 B6CA/B5CADBC 0.40 ± 0.04 11.2 0.43 0.40 0.38 0.45 Mean ± SD stands for the mean ± standard deviation; CV represents the coefficient of variation; P1 is the mean of data from three sampling points P1-T1, P1-T2, and P1-T3; P5 is the mean of data from three sampling points P5-T1, P5-T2, and P5-T3. 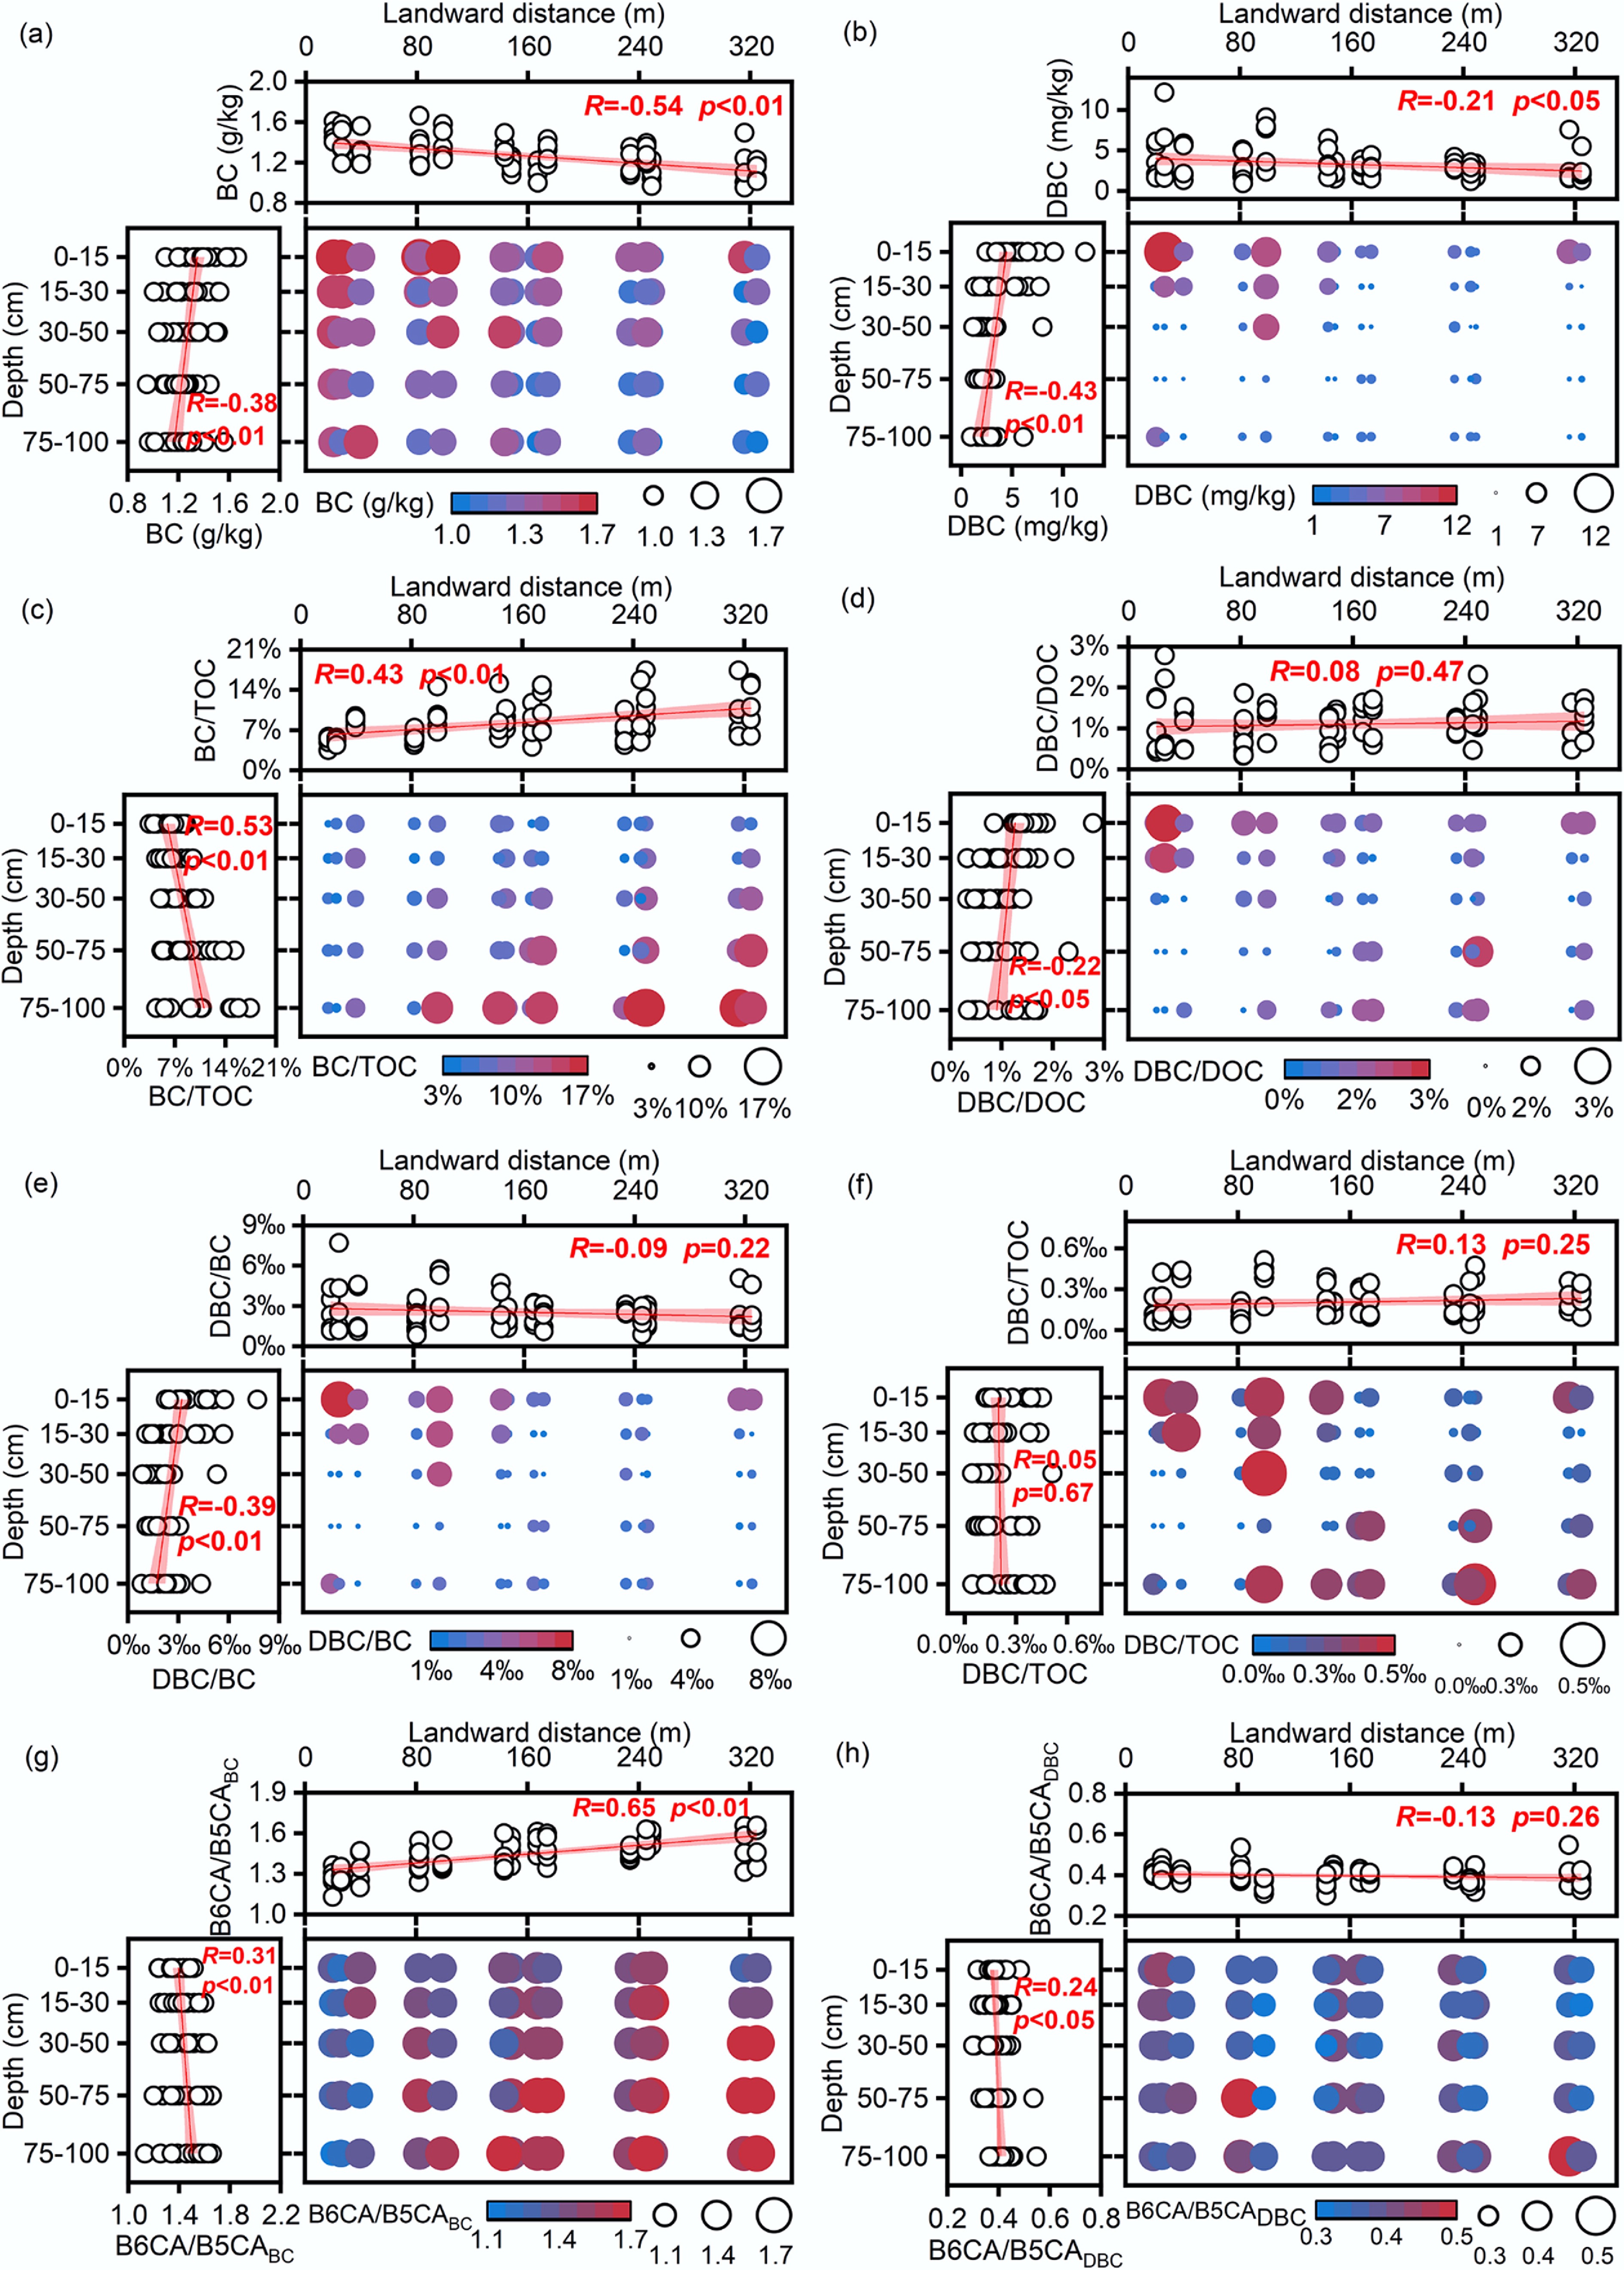
Figure 2.
Spatial distribution characteristics of soil carbon fractions. (a) Black carbon (BC); (b) dissolved black carbon (DBC); (c) black carbon/total organic carbon (BC/TOC); (d) dissolved black carbon/dissolved organic carbon (DBC/DOC); (e) DBC/BC; (f) DBC/TOC; (g) The ratio of B6CA to B5CA monomers in BC (B6CA/B5CABC); (h) The ratio of B6CA to B5CA monomers in DBC (B6CA/B5CADBC).
The BC/TOC ratio averaged 8.26% ± 3.34% (range: 3.50%–17.41%), lower than the range for East China Sea sediments (12%–65%)[18], slightly below the global forest soil average (9.7%)[6], and lower than those in coastal sediments in the Yangtze River Estuary (13.3% ± 4.9%)[39], the Yellow River Estuary (15.4% ± 6.1%)[39], and the Bohai Bay (16.8% ± 7.5%)[40]. Although BC content significantly decreased with increasing distance from land and increasing soil depth, the proportion of BC in TOC increased. This can be attributed to BC's greater stability compared to other TOC components[6,41], allowing it to be preferentially retained during seaward and vertical transport. Additionally, rapid accumulation of organic matter from plant litter in surface soils may dilute the BC in TOC[21].
A significant linear correlation was observed between BC and TOC (r = 0.65, p < 0.01; Supplementary Fig. S1), consistent with global coastal soils and riverine sediments[8,14]. This relationship likely reflects the role of TOC in protecting and adsorbing BC[19], as well as the higher likelihood of biomass burning in organic matter-rich environments[42]. The BC/TOC ratios may be modulated by depositional and transport processes. Due to its condensed aromatic structure, the higher stability of BC allows for its preferential preservation and enrichment[43]. Furthermore, owing to differences in density, particle size, and shape between BC and other organic matter, hydrodynamic sorting may lead to the differential settling and accumulation of BC in specific sedimentary environments[44]. Studies have also pointed out that BC/TOC ratios below 10% typically indicate atmospheric deposition, whereas ratios exceeding 10% suggest stronger anthropogenic input[45,46]. The generally low ratios observed here likely imply minimal human disturbance, indicating that this mangrove system largely retains its natural characteristics, thereby providing an ideal setting for studying BC and DBC cycling under near-pristine conditions.
Surface soil DBC contents were more than twice those of deeper layers (Table 1 and Fig. 2). The DBC/DOC ratio ranged from 0.36% to 3.07%, averaging 1.21% ± 0.56%, which was lower than the values reported for porewater in Yangtze River Estuary and Yellow River Estuary sediments (5.6% ± 2.3%, range: 3.2%–8.9%)[39], streams in the experimental forest wetlands of Hokkaido University (4.8% ± 0.7%) and forested streams (4.3% ± 0.5%)[47], as well as the global riverine average (10.6% ± 0.7%)[8]. DBC and DOC were positively correlated (r = 0.48, p < 0.01; Supplementary Fig. S1). This correlation is attributed mainly to shared transport pathways in aquatic environments[8,48]. However, biological and chemical mechanisms may also be involved. Specifically, DOC-mediated dissolution enhances BC mobility, as amphiphilic molecules within DOC act as surfactants to facilitate the solubility and release of DBC[8,49,50]. Furthermore, microbial processing not only decomposes bulk organic matter but also degrades particulate BC, simultaneously releasing DOC and DBC into the soil solution[51].
The molecular composition of BC and DBC, as indicated by BPCA analysis, also varied. BPCA composition could serve as an indicator of BC sources. In this study, B6CA and B5CA monomers accounted for 78.3% of total BPCA compounds in BC (Supplementary Fig. S2), suggesting a high proportion of highly condensed aromatic BC, such as soot and graphite-derived BC[25]. Given the relatively low degree of urbanization near the study area, BC likely originates from biomass or fossil fuel burning and long-range atmospheric deposition[3]. The B6CA/B5CA ratio, an indicator of BC condensation and stability, was higher in BC than in DBC (1.44 vs 0.40; Table 1). This aligns with previous studies showing that less condensed BC structures preferentially dissolve into DBC, whereas more stable BC fractions are retained in the solid phase[49,52,53].
In addition, hydrodynamic processes such as sediment resuspension and porewater exchange represent significant internal drivers of BC cycling. As previously highlighted, tidal systems act as efficient reactors where DBC can be released from sediments via porewater exchange[23]. Second, local anthropogenic activities are likely contributing to the BC pool. The study area is subject to coastal development, aquaculture, and shipping traffic. Emissions from marine vessels are a known source of fossil-fuel-derived soot, which is characterized by high aromatic condensation[54]. The input of soot from local shipping lanes or diesel-powered machinery used in aquaculture could contribute to the highly condensed BC signatures found in certain offshore or near-port samples. Future studies incorporating dual-carbon isotopes or specific molecular markers are needed to rigorously quantify the relative contributions of these diverse sources.
Spatial patterns of black carbon content and stoichiometric ratios
-
The stoichiometric ratios of soil carbon components exhibited distinct spatial distribution patterns (Fig. 2). TOC concentrations (17.98 ± 7.70 g/kg) significantly decreased with increasing distance from land and soil depth (p < 0.01). This pattern likely reflects higher plant litter inputs near the shoreline, enhanced tidal erosion that removes organic matter in offshore zones, and reduced input of fresh organic carbon with depth as most plant-derived material accumulates in surface layers. Spatially, BC distribution closely mirrored that of TOC, with concentrations decreasing from land to sea and with increasing soil depth. A similar land–sea gradient has been reported in surface sediments along the Yangtze River Estuary and outer continental shelf[55]. The BC/TOC averaged 8.26% ± 3.34% and significantly increased with distance from land and soil depth (p < 0.01), reaching a maximum of 16.00% in deep soil at P5. DBC concentrations also exhibited a land-to-sea decreasing trend, consistent with spatial patterns observed in offshore and deep-sea waters of the northeastern Gulf of Mexico and in northern intertidal wetland streams[23,36], highlighting similarities in DBC transport and transformation across coastal ecosystems.
The DBC/BC ratio significantly decreased with soil depth, likely due to reduced microbial degradation of BC and consequently lower DBC production in deeper soils. Additionally, the strong positive correlation between DBC/BC and DOC suggests that DBC and DOC share similar dissolution mechanisms or that DOC enhances DBC release[8]. Together, these findings highlight the persistence of BC in subsoils, underscoring its long-term contribution to carbon sequestration and climate mitigation. The DBC/DOC (1.21% ± 0.56%) and DBC/BC (2.53‰ ± 1.34‰) ratios did not vary significantly with landward distance but decreased markedly with depth (p < 0.05). In contrast, the DBC/TOC ratio (0.21‰ ± 0.12‰) remained unaffected by either factor.
The B6CA/B5CABC significantly increased with both distance from land and soil depth, indicating that offshore and deeper soils contain more highly condensed and stable BC structures. This pattern suggests long-term retention of recalcitrant BC in subsoils and marine environments. Horizontally, BC from nearshore soils may be transported and deposited offshore by tidal action, thereby preferentially retaining the more condensed and stable BC fraction in offshore sediments[47]. B6CA/B5CABC negatively correlated with BC content and positively correlated with BC/TOC ratio. It further supports the notion that condensed BC components become increasingly dominant in the BC and TOC pools as degradation proceeds[56].
While the selective preservation of highly condensed structures could explain the increasing B6CA/B5CA ratio with depth, we cannot rule out the influence of source variations[57]. The degree of condensation is strongly dependent on the peak temperature of formation. For instance, high-temperature combustion byproducts such as soot inherently exhibit higher B6CA/B5CA ratios than low-temperature biomass chars[58]. Therefore, the observed enrichment of highly condensed BC in offshore and deeper layers may also reflect a historical shift in BC input sources rather than post-depositional processing alone. In the absence of independent age constraints, the BPCA method limits our ability to strictly decouple source signatures from degradation effects. Nevertheless, the dominance of highly condensed structures in these sinks suggests that the sequestered BC consists predominantly of aromatic moieties with high intrinsic resistance to biotic decomposition.
Relationships between black carbon content and environmental factors
-
Soil physicochemical properties displayed varying degrees of spatial heterogeneity, as indicated by the coefficient of variation (CV) spanning from 5.2% to 86.8%. Among these parameters, plant biomass showed the greatest variability, whereas silt content was the most stable (Supplementary Table S1). Correlation analysis and the random forest model (Figs 3 and 4) indicated that BC and TOC were governed by similar environmental factors, with TN, pH, plant biomass, BD, Ca, WC, and Mg being the most influential. TN was the primary factor regulating TOC and the second most critical factor for BC. The strong carbon-nitrogen coupling in mangrove soils means that higher TN promotes plant growth and organic matter input, thereby boosting TOC accumulation. Meanwhile, microbes in high-TN soils preferentially utilize readily available nitrogen rather than mining it from recalcitrant BC, thereby slowing BC degradation and facilitating its preservation[59]. Plant biomass emerged as the most pivotal driver of BC content, as elevated biomass contributed more organic inputs via photosynthesis and strengthened interactions between TOC and BC, thereby enhancing BC retention. In contrast, compacted soils with high BD impeded BC migration and increased its vulnerability to surface loss[60,61]. Higher pH accelerated microbial decomposition of BC and impaired plant nutrient uptake, while Ca and Mg enhanced soil aggregate stability and mediated organic-mineral interactions to stabilize BC[62]. Similarly, clay content correlated positively with TOC and BC, as fine particles physically shield BC through adsorption, reduce microbial access, and limit BC desorption and transport[18,21,41,63]. DOC and DBC were co-regulated by TN and WC. Both DOC and DBC increased with TN due to their common origin from soil organic matter. They also increased with WC (average 84% in this study) due to enhanced organic matter dissolution and mobility[60] and suppressed microbial utilization of the dissolved organics[64].
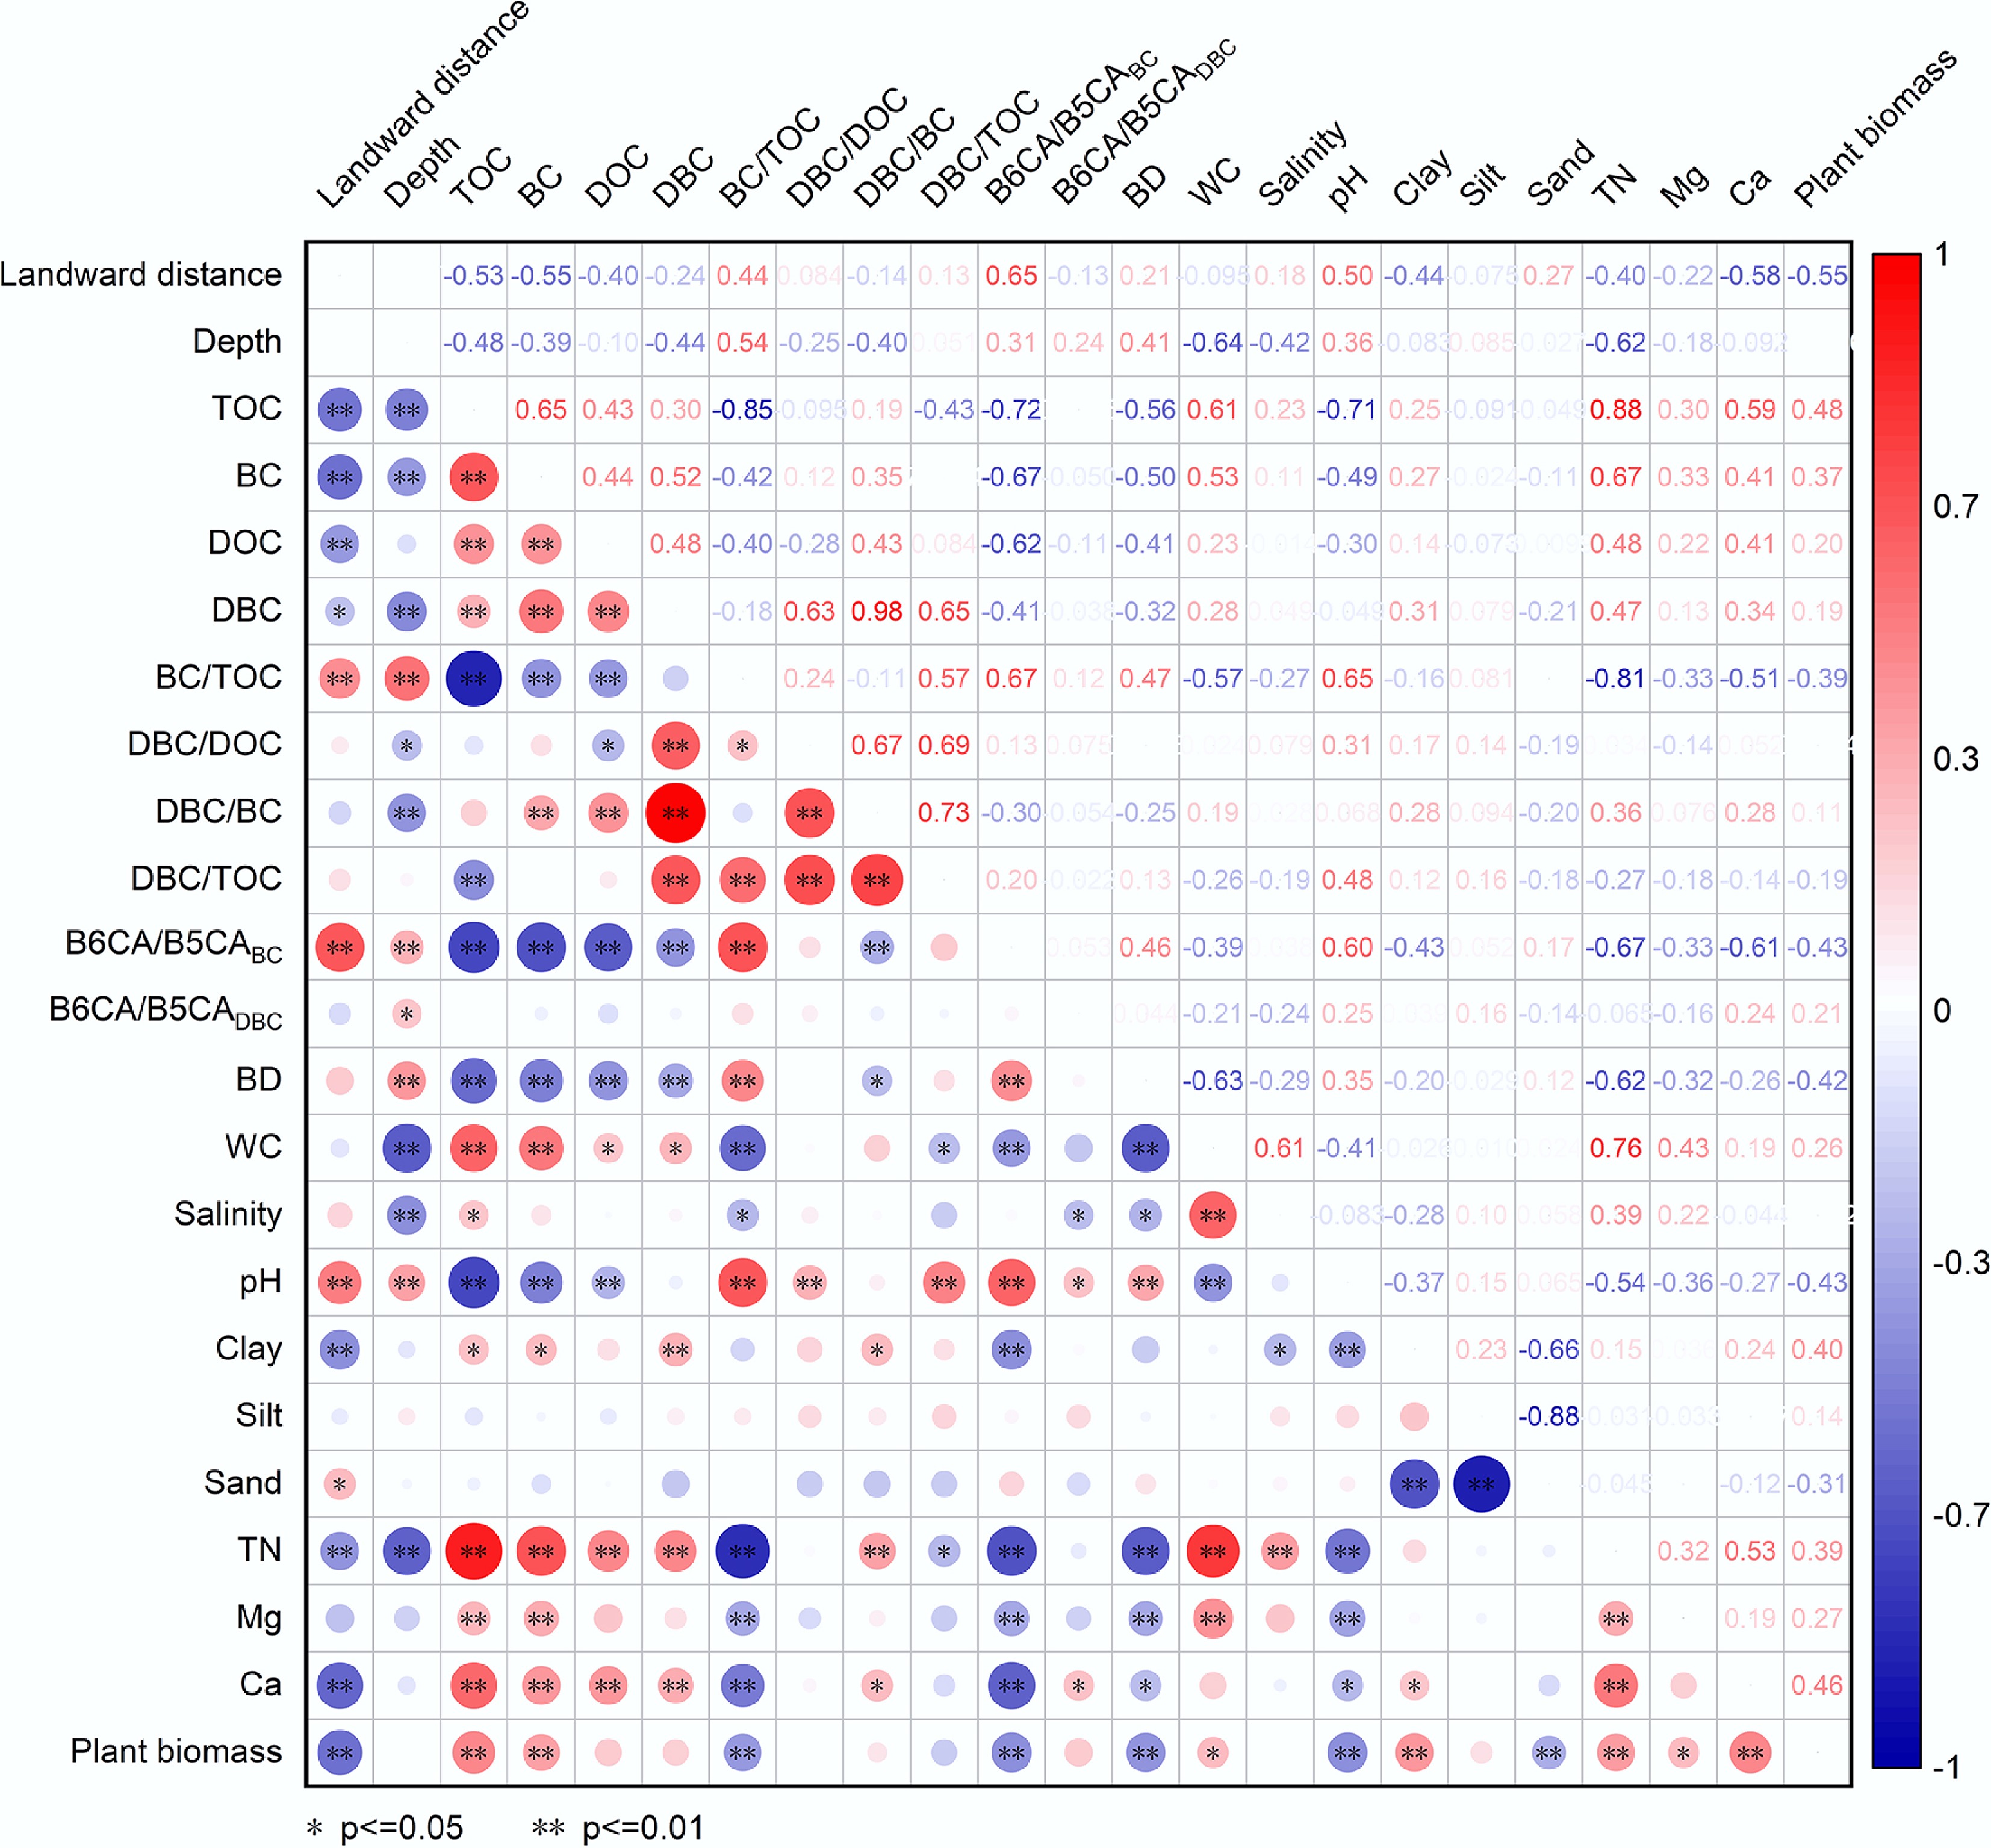
Figure 3.
Relationships among landward distance and depth and soil properties and plant biomass and soil carbon fractions. Abbreviations are the same as those in Fig. 2. BD: bulk density; WC: water content; TN: total nitrogen content. * and ** represent significance of p < 0.05 and p < 0.01, respectively. The size and color of the circles represent the values of the correlation coefficients.
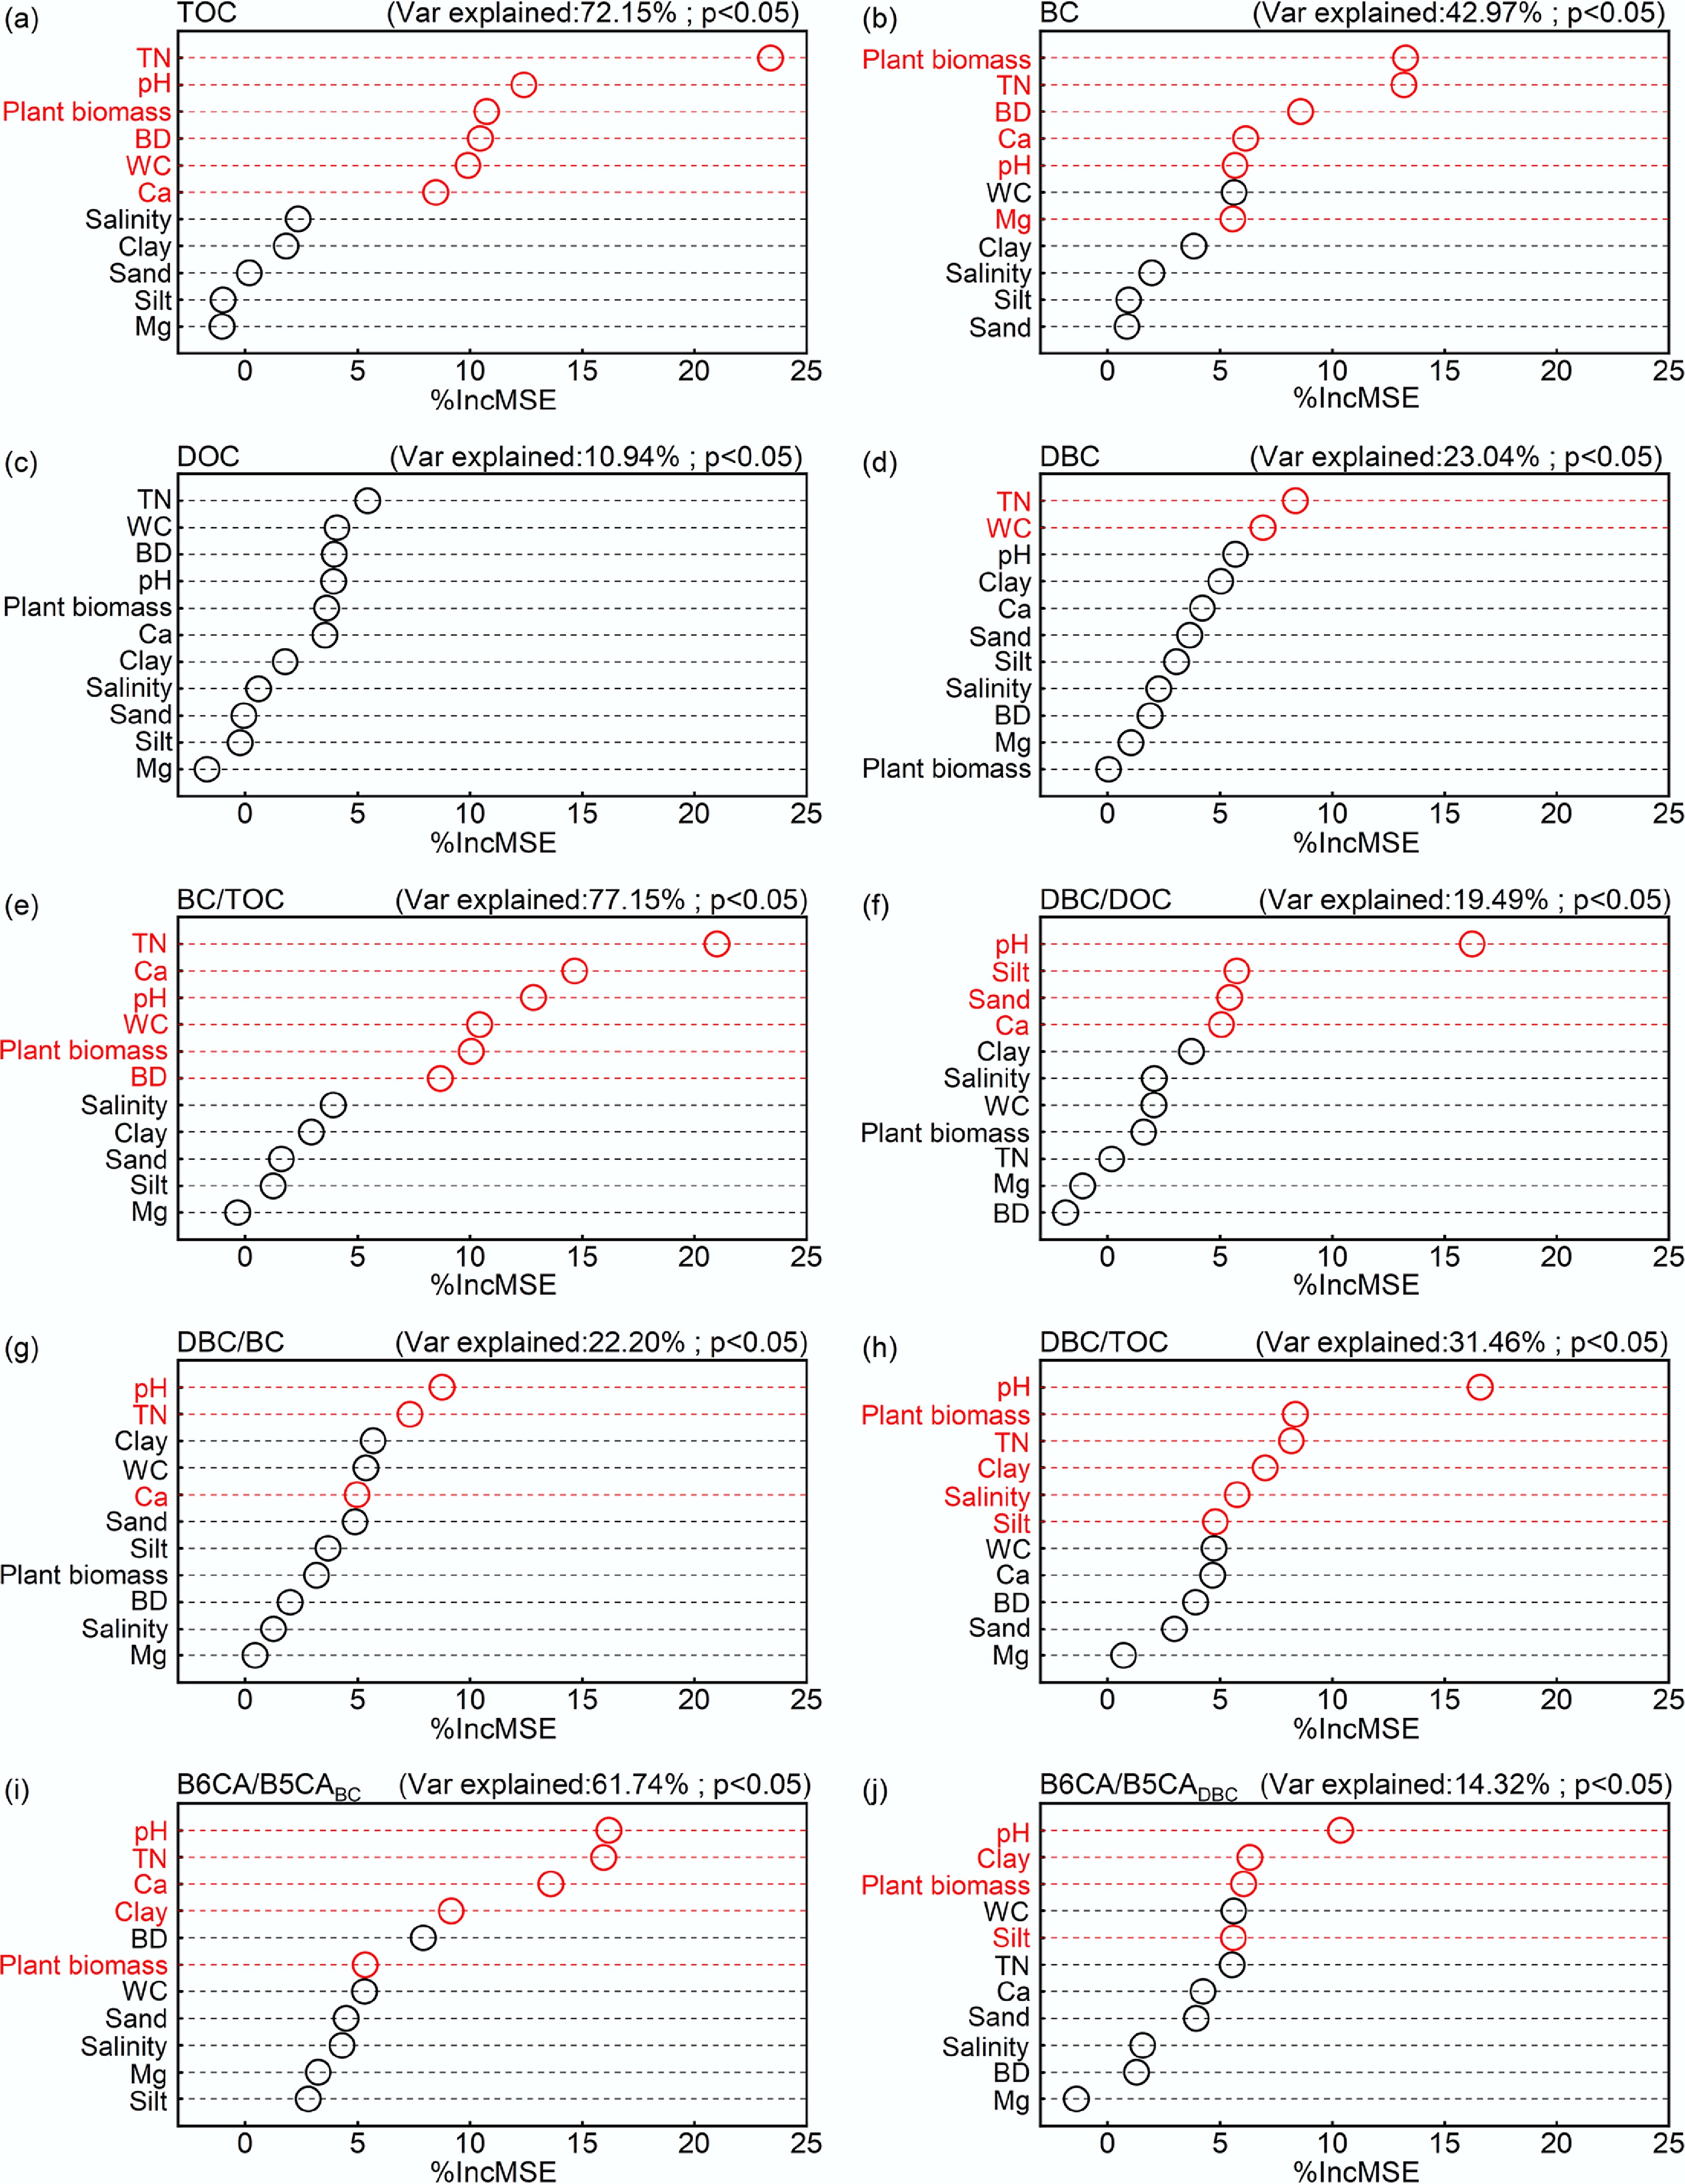
Figure 4.
Relative contributions of environmental variables to soil carbon fractions. Red color represents a significant effect. (a) Total organic carbon (TOC); (b) black carbon (BC); (c) dissolved organic carbon (DOC); (d) dissolved black carbon (DBC); (e) BC/TOC; (f) DBC/DOC; (g) DBC/BC; (h) DBC/TOC; (i) The ratio of B6CA to B5CA monomers in BC (B6CA/B5CABC); (j) The ratio of B6CA to B5CA monomers in DBC (B6CA/B5CADBC).
Stoichiometric ratios such as BC/TOC and DBC/DOC were mainly modulated by TN, pH, WC, and Ca. Although both TOC and BC increased with TN, BC/TOC declined because TN more strongly stimulated the accumulation of non-BC organic carbon (e.g., fresh detritus). BC/TOC increased with rising pH, aligning with the global BC/TOC study, which reported BC/TOC levels of 21.0% in soils with pH > 7 but only 8.6%–11.7% in soils with pH < 5[6]. Under high moisture conditions, BC was more prone to erosion and transport than non-BC organic carbon, thereby reducing its proportion within TOC[65]. Additionally, DBC/DOC increased with exchangeable Ca, suggesting that Ca forms complexes with DBC and enhances its stability and persistence.
The B6CA/B5CA ratios were primarily influenced by pH, TN, Ca, clay content, and plant biomass. Both B6CA/B5CABC and B6CA/B5CADBC increased with pH, whereas BC content decreased with pH. This suggests that higher pH enhanced microbial activity, preferentially degrading less condensed BC fractions while preserving more condensed and stable BC fractions[66]. While B6CA/B5CABC negatively correlated with TN, Ca, clay, and plant biomass, BC content positively correlated with these factors. These results suggest that the reduction of these stabilizing factors enhances microbial decomposition of less-condensed BC, enriching the more condensed and stable fractions[51]. The persistence of these condensed BC and DBC forms in deeper soils underscore their role in long-term carbon sequestration. Collectively, these findings imply that managing soil environmental conditions, particularly TN, pH, and mineral composition, can promote BC accumulation, offering a natural pathway for enhancing carbon storage and mitigating climate change.
Direct and indirect effects of landward distance and soil depth on black carbon content
-
SEM results (Figs 5 and 6) demonstrated that landward distance exerts indirect regulatory effects on soil carbon components (TOC, BC, DOC, and DBC) and the BC/TOC ratio by modifying key environmental factors, including TN, pH, Ca, and clay content. Model fit indices (χ2 = 0.432, root mean square error of approximation = 0.00, comparative fit index = 1.00) indicated a satisfactory fit for the proposed pathways. Notably, increasing landward distance decreases plant biomass, which influences Ca or TN levels and further mediates BC content and stoichiometric ratios. In offshore areas, reduced plant residue inputs and stronger tidal dynamics collectively lowered TN and carbon contents (TOC, BC, DOC, and DBC)[67]. Additionally, increasing landward distance altered soil texture by reducing clay content, weakening the physical adsorption capacity for BC; concurrently, the dilution effect of high sedimentation rates of medium-to-coarse particles and overall sediment coarsening hindered DBC accumulation, resulting in lower DBC concentrations[68]. These processes together led to lower BC and DBC concentrations offshore. Observations from the East China Sea (1.46 g/kg in shelf sediments vs 0.67 g/kg in deep-sea sediments) similarly demonstrate that strong nearshore tidal forces redistribute BC from land to sea, shaping its coastal gradients[55].
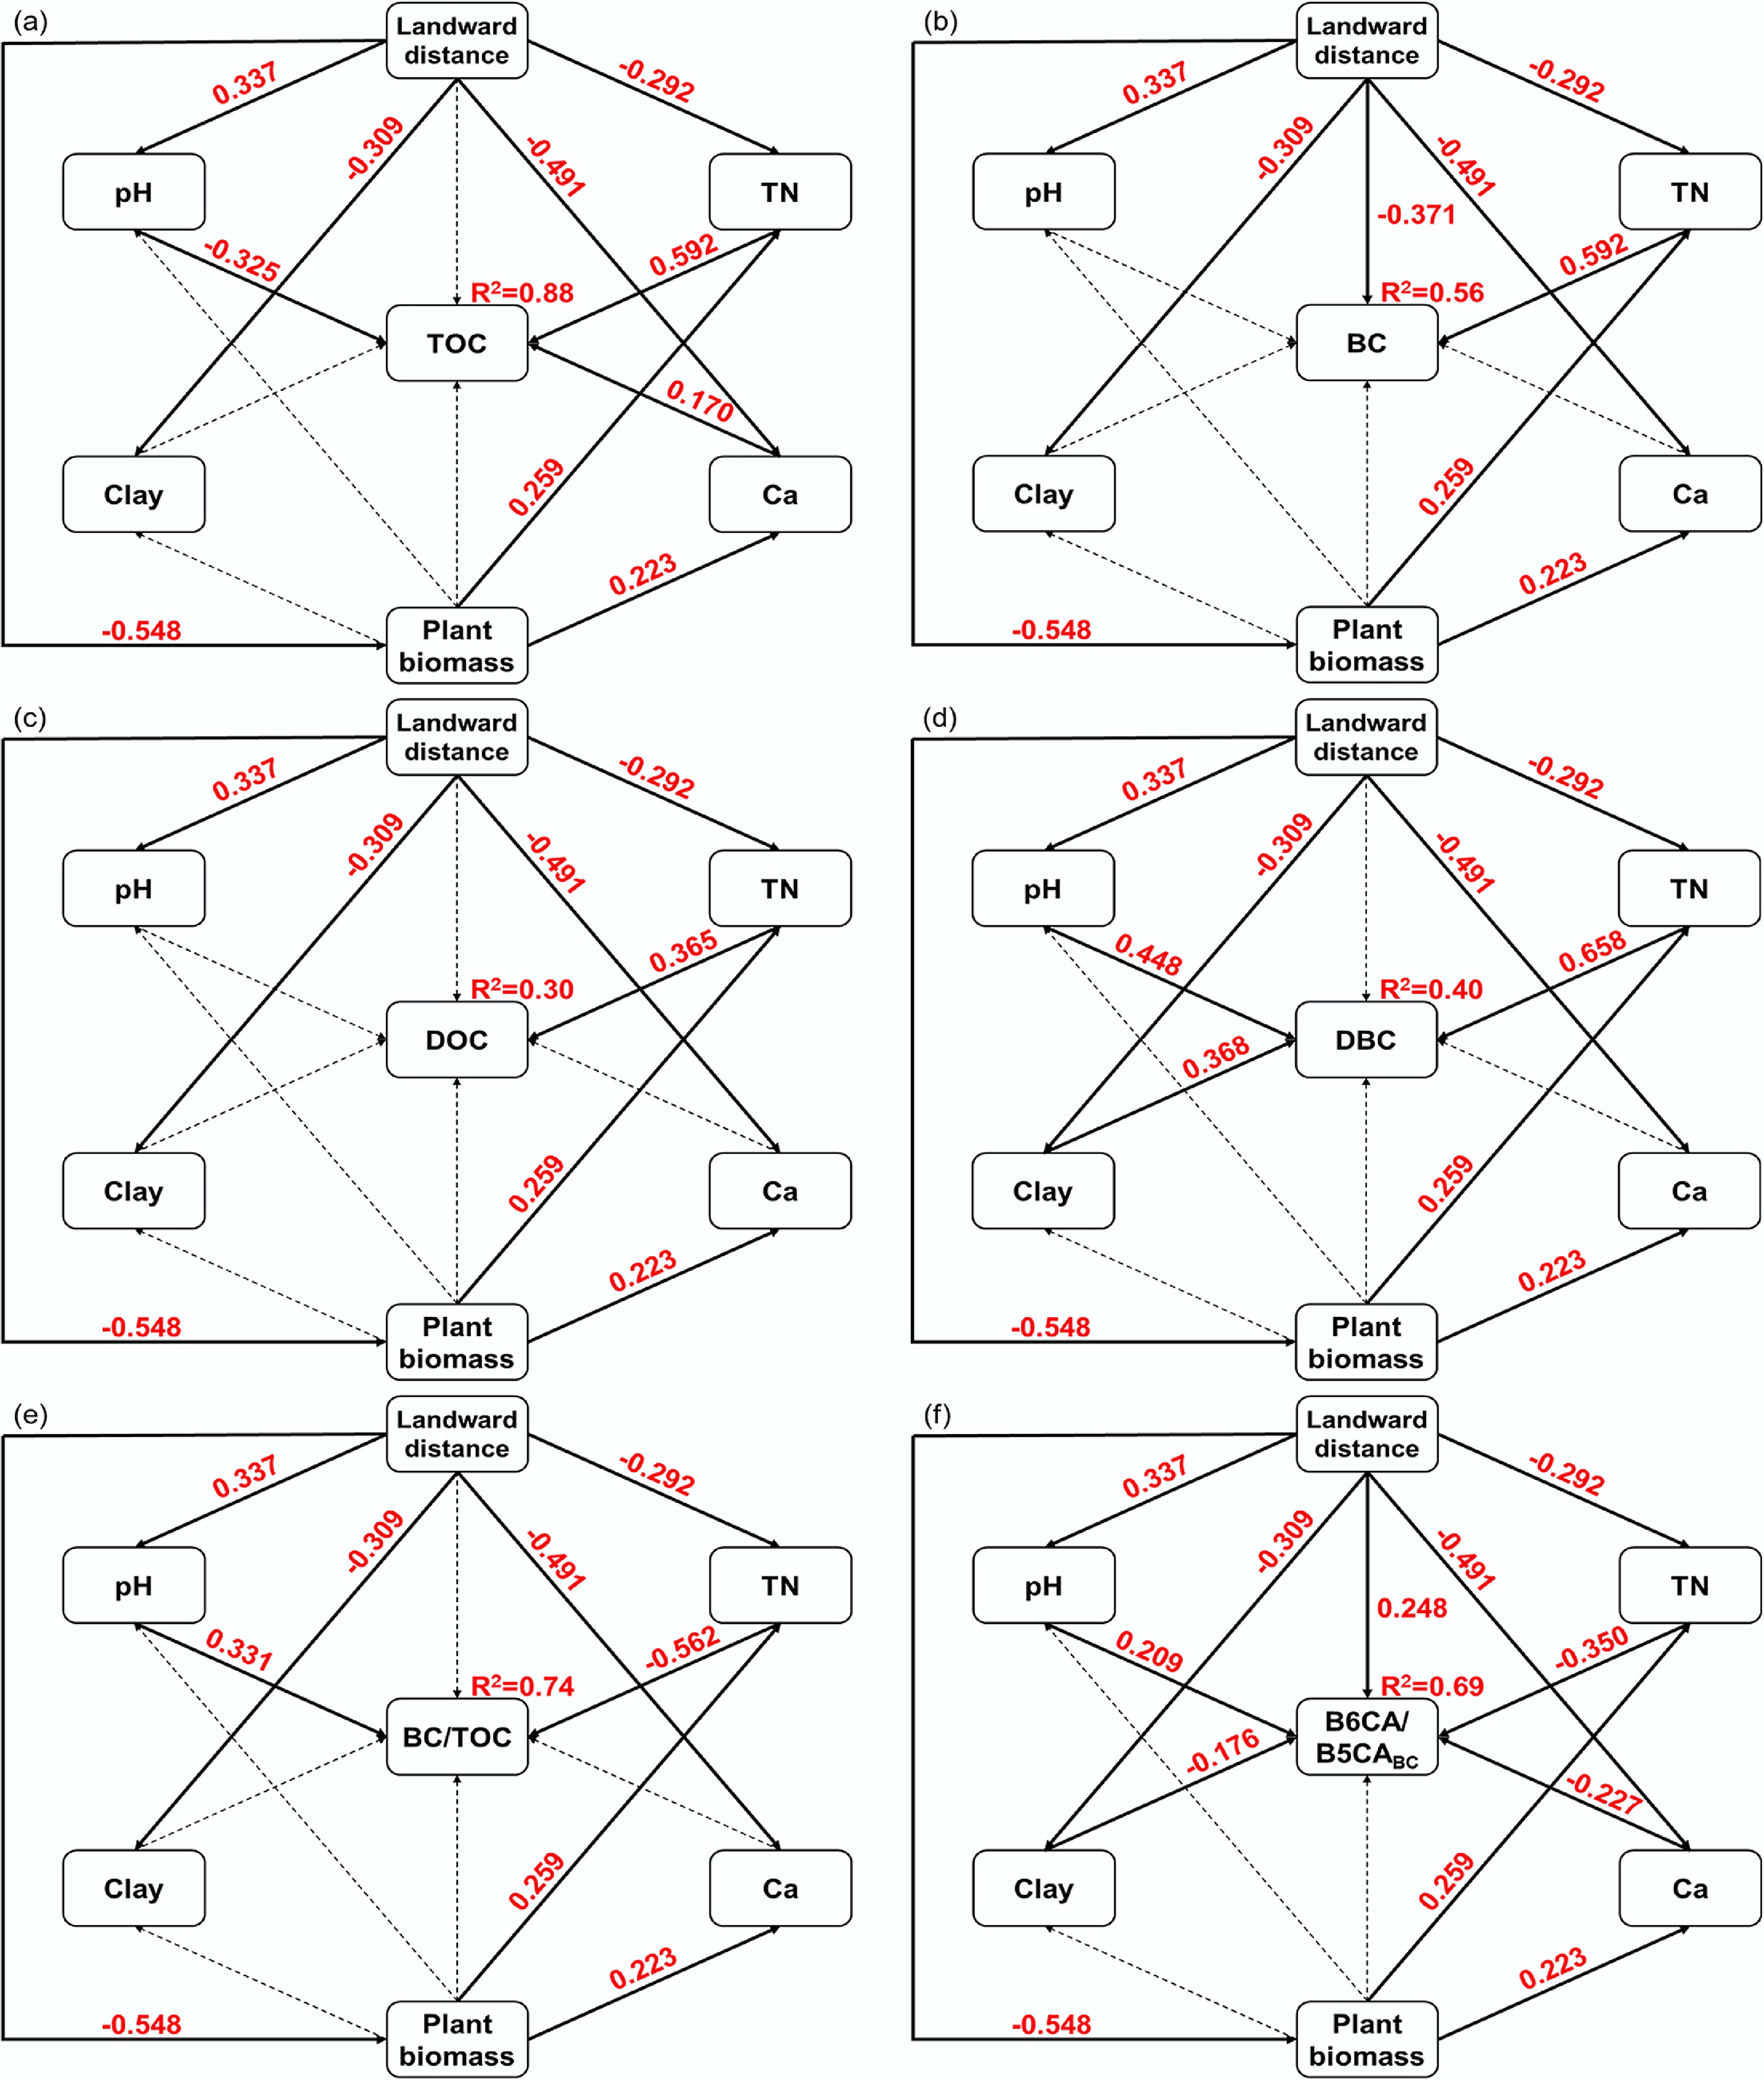
Figure 5.
Structural equation model diagram of the effects of landward distance on soil carbon fractions. (a) Total organic carbon (TOC); (b) black carbon (BC); (c) dissolved organic carbon (DOC); (d) dissolved black carbon (DBC); (e) BC/TOC; (f) The ratio of B6CA to B5CA monomers in BC (B6CA/B5CABC). Each box represents an observed variable. The values on the arrows (solid arrows and red numbers indicate significant effects; dotted arrows indicate insignificant effects) represent the path coefficients. Model fit indices: χ2 = 0.432, p = 0.511, df = 1, root mean square error of approximation = 0.00, normed fit index = 0.998−0.999, comparative fit index = 1.00.
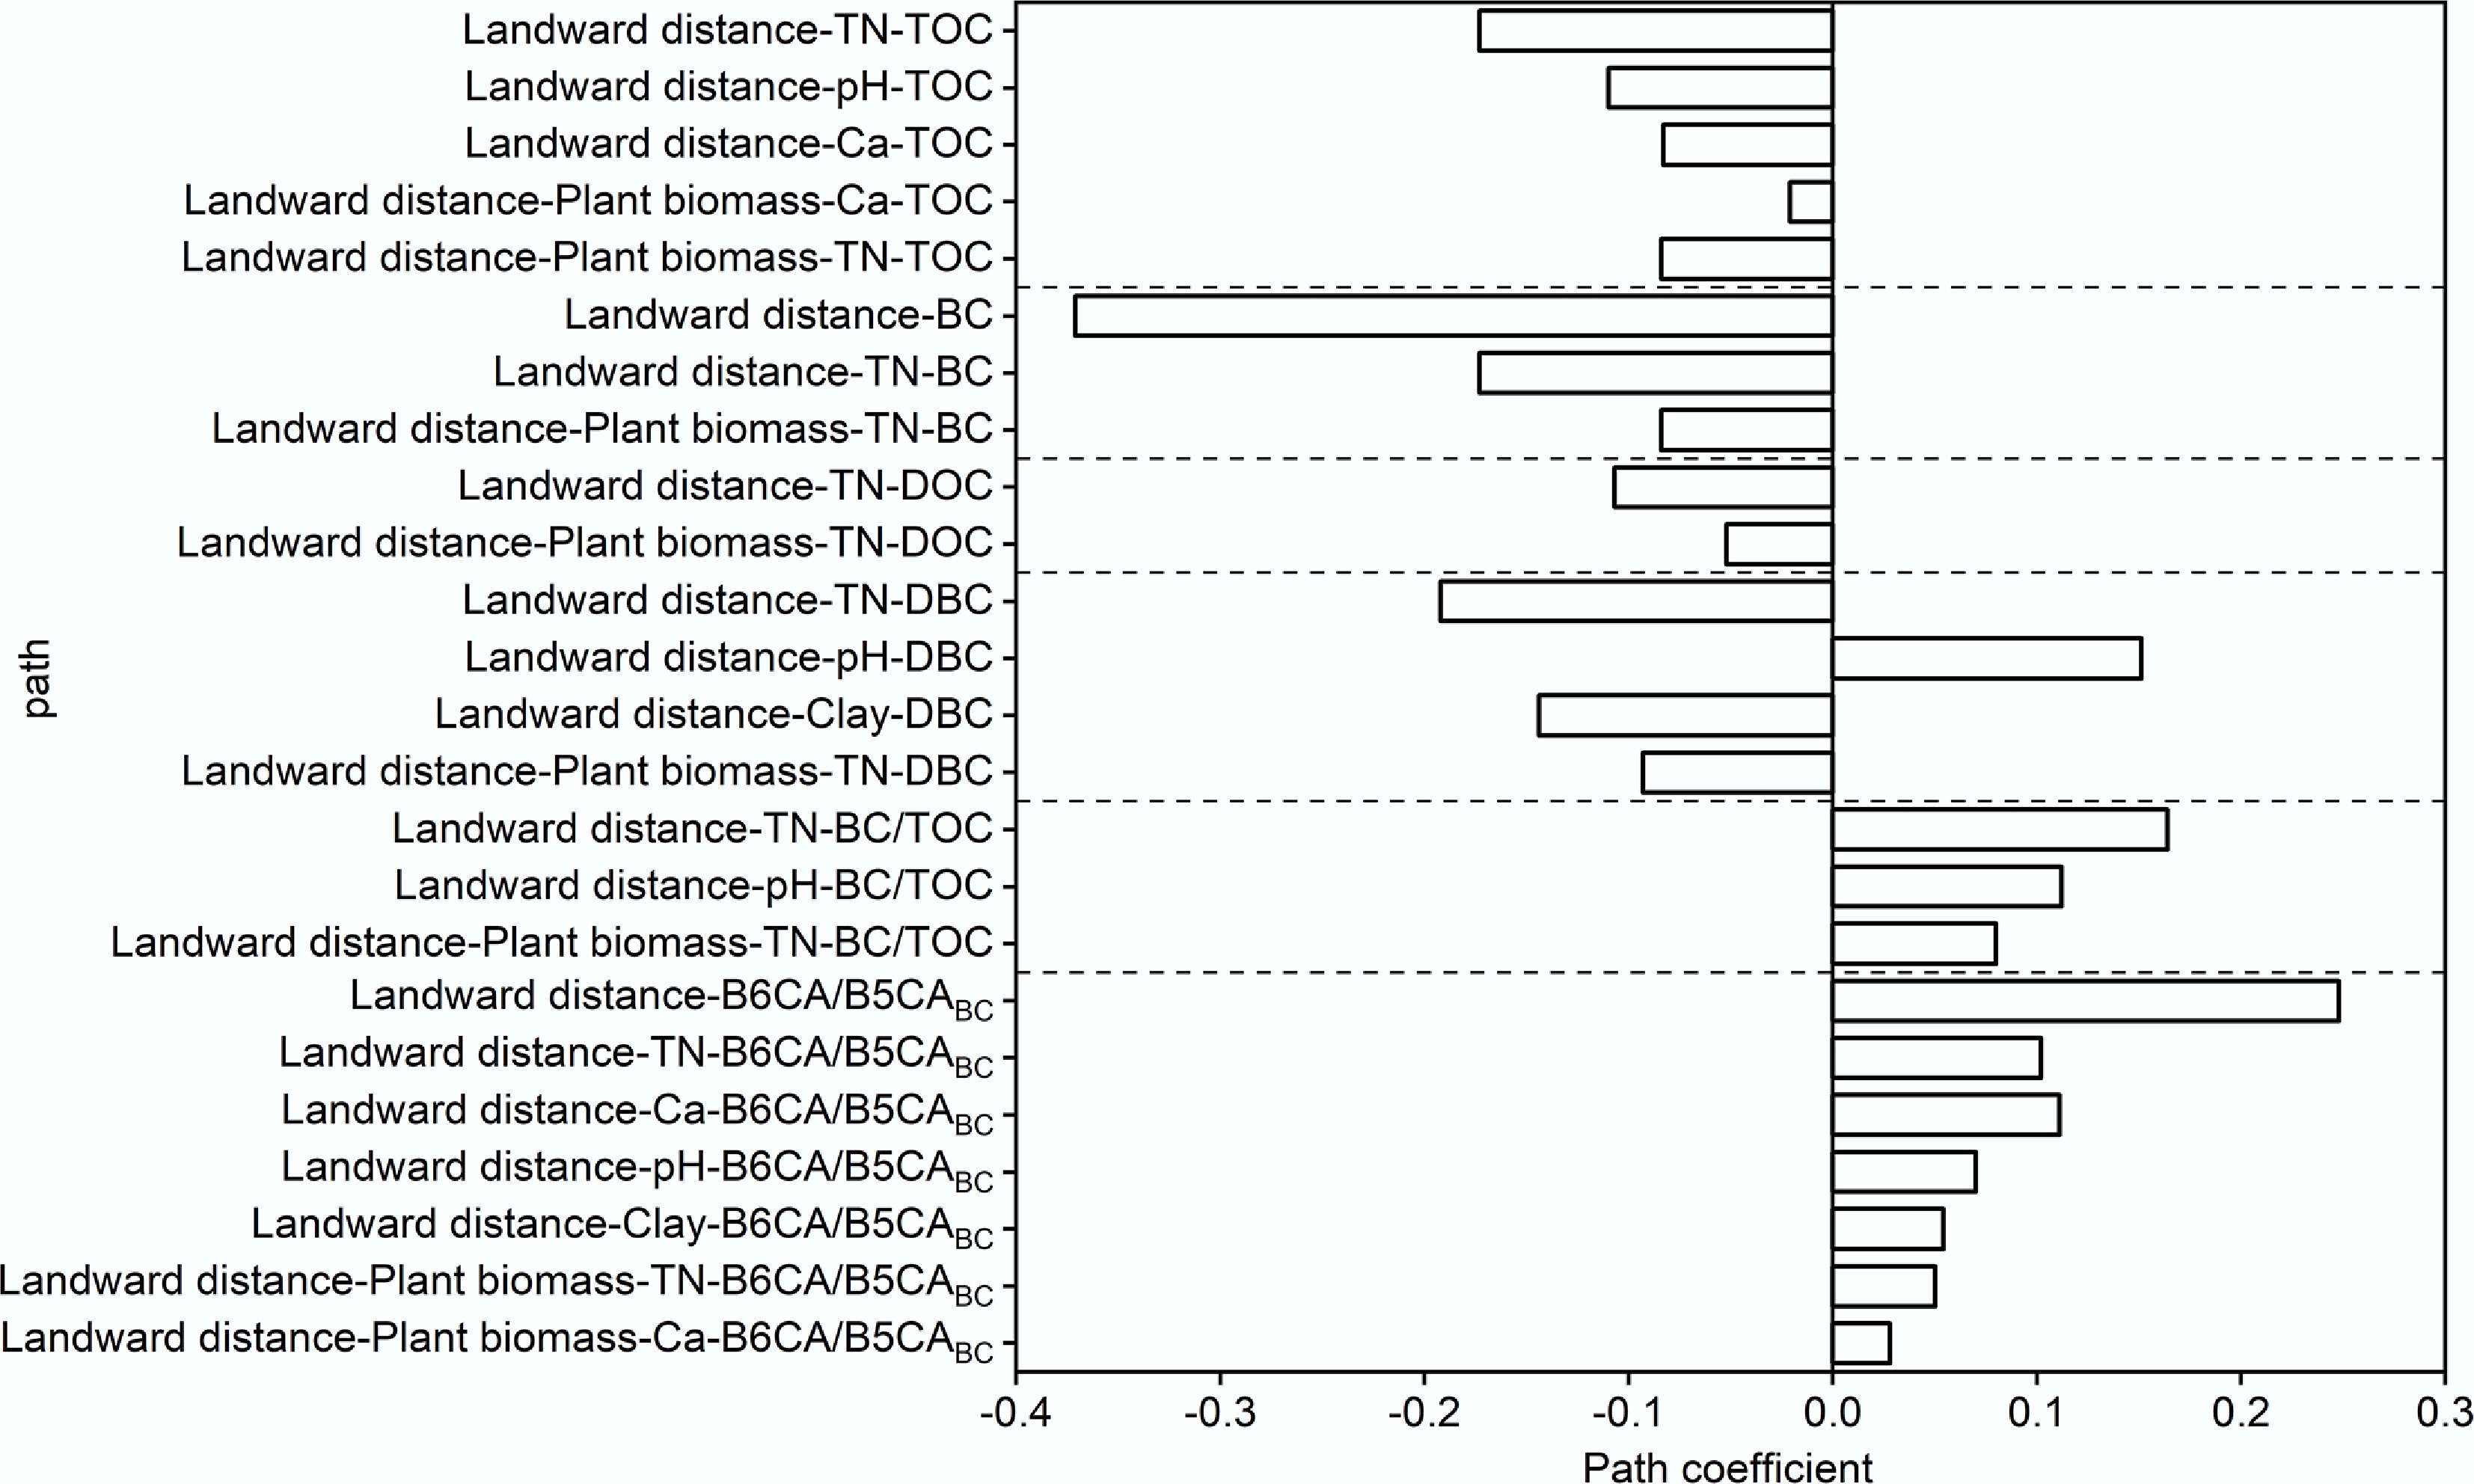
Figure 6.
Direct and indirect effects of landward distance on the soil carbon fraction contents.
With increasing landward distance, TN, Ca, and clay content declined while pH rose, conditions that favored the degradation of less-condensed BC fractions while preserving more stable forms. Consequently, the B6CA/B5CABC ratio, an indicator of BC aromatic condensation and stability, increased in offshore soils. Direct effects of landward distance also included enhanced erosion in offshore areas, which promoted the dissolution of less condensed BC into DBC, leaving more stable BC retained in offshore soils[52]. The observed increase in BC/TOC with landward distance was attributed to the preferential migration of BC relative to other organic matter during hydrological processes[41]. To enhance carbon sequestration in mangrove soils, conservation of plant biomass, minimization of hydrodynamic disturbance, and optimization of coastal land-use practices are critical.
Soil depth also exerted substantial influence on TN, BD, WC, and salinity, thereby regulating BC components and their stoichiometric ratios (Figs 7 and 8). Model fit indices (χ2 = 0.382, root mean square error of approximation = 0.00, comparative fit index = 1.00) indicated a satisfactory fit for the proposed pathways. TN correlated positively with TOC, BC, and DBC, indicating that carbon- and nitrogen-rich organic matter declined with depth. Soil depth also indirectly influenced TN and carbon content through BD and WC. Generally, deeper soils exhibited higher BD, reduced porosity, and limited water exchange, microbial activity, and root growth, leading to lower TN, TOC, BC, and DBC contents[69]. Moreover, tidal processes increased surface moisture and salt accumulation, which may have suppressed microbial degradation of BC.
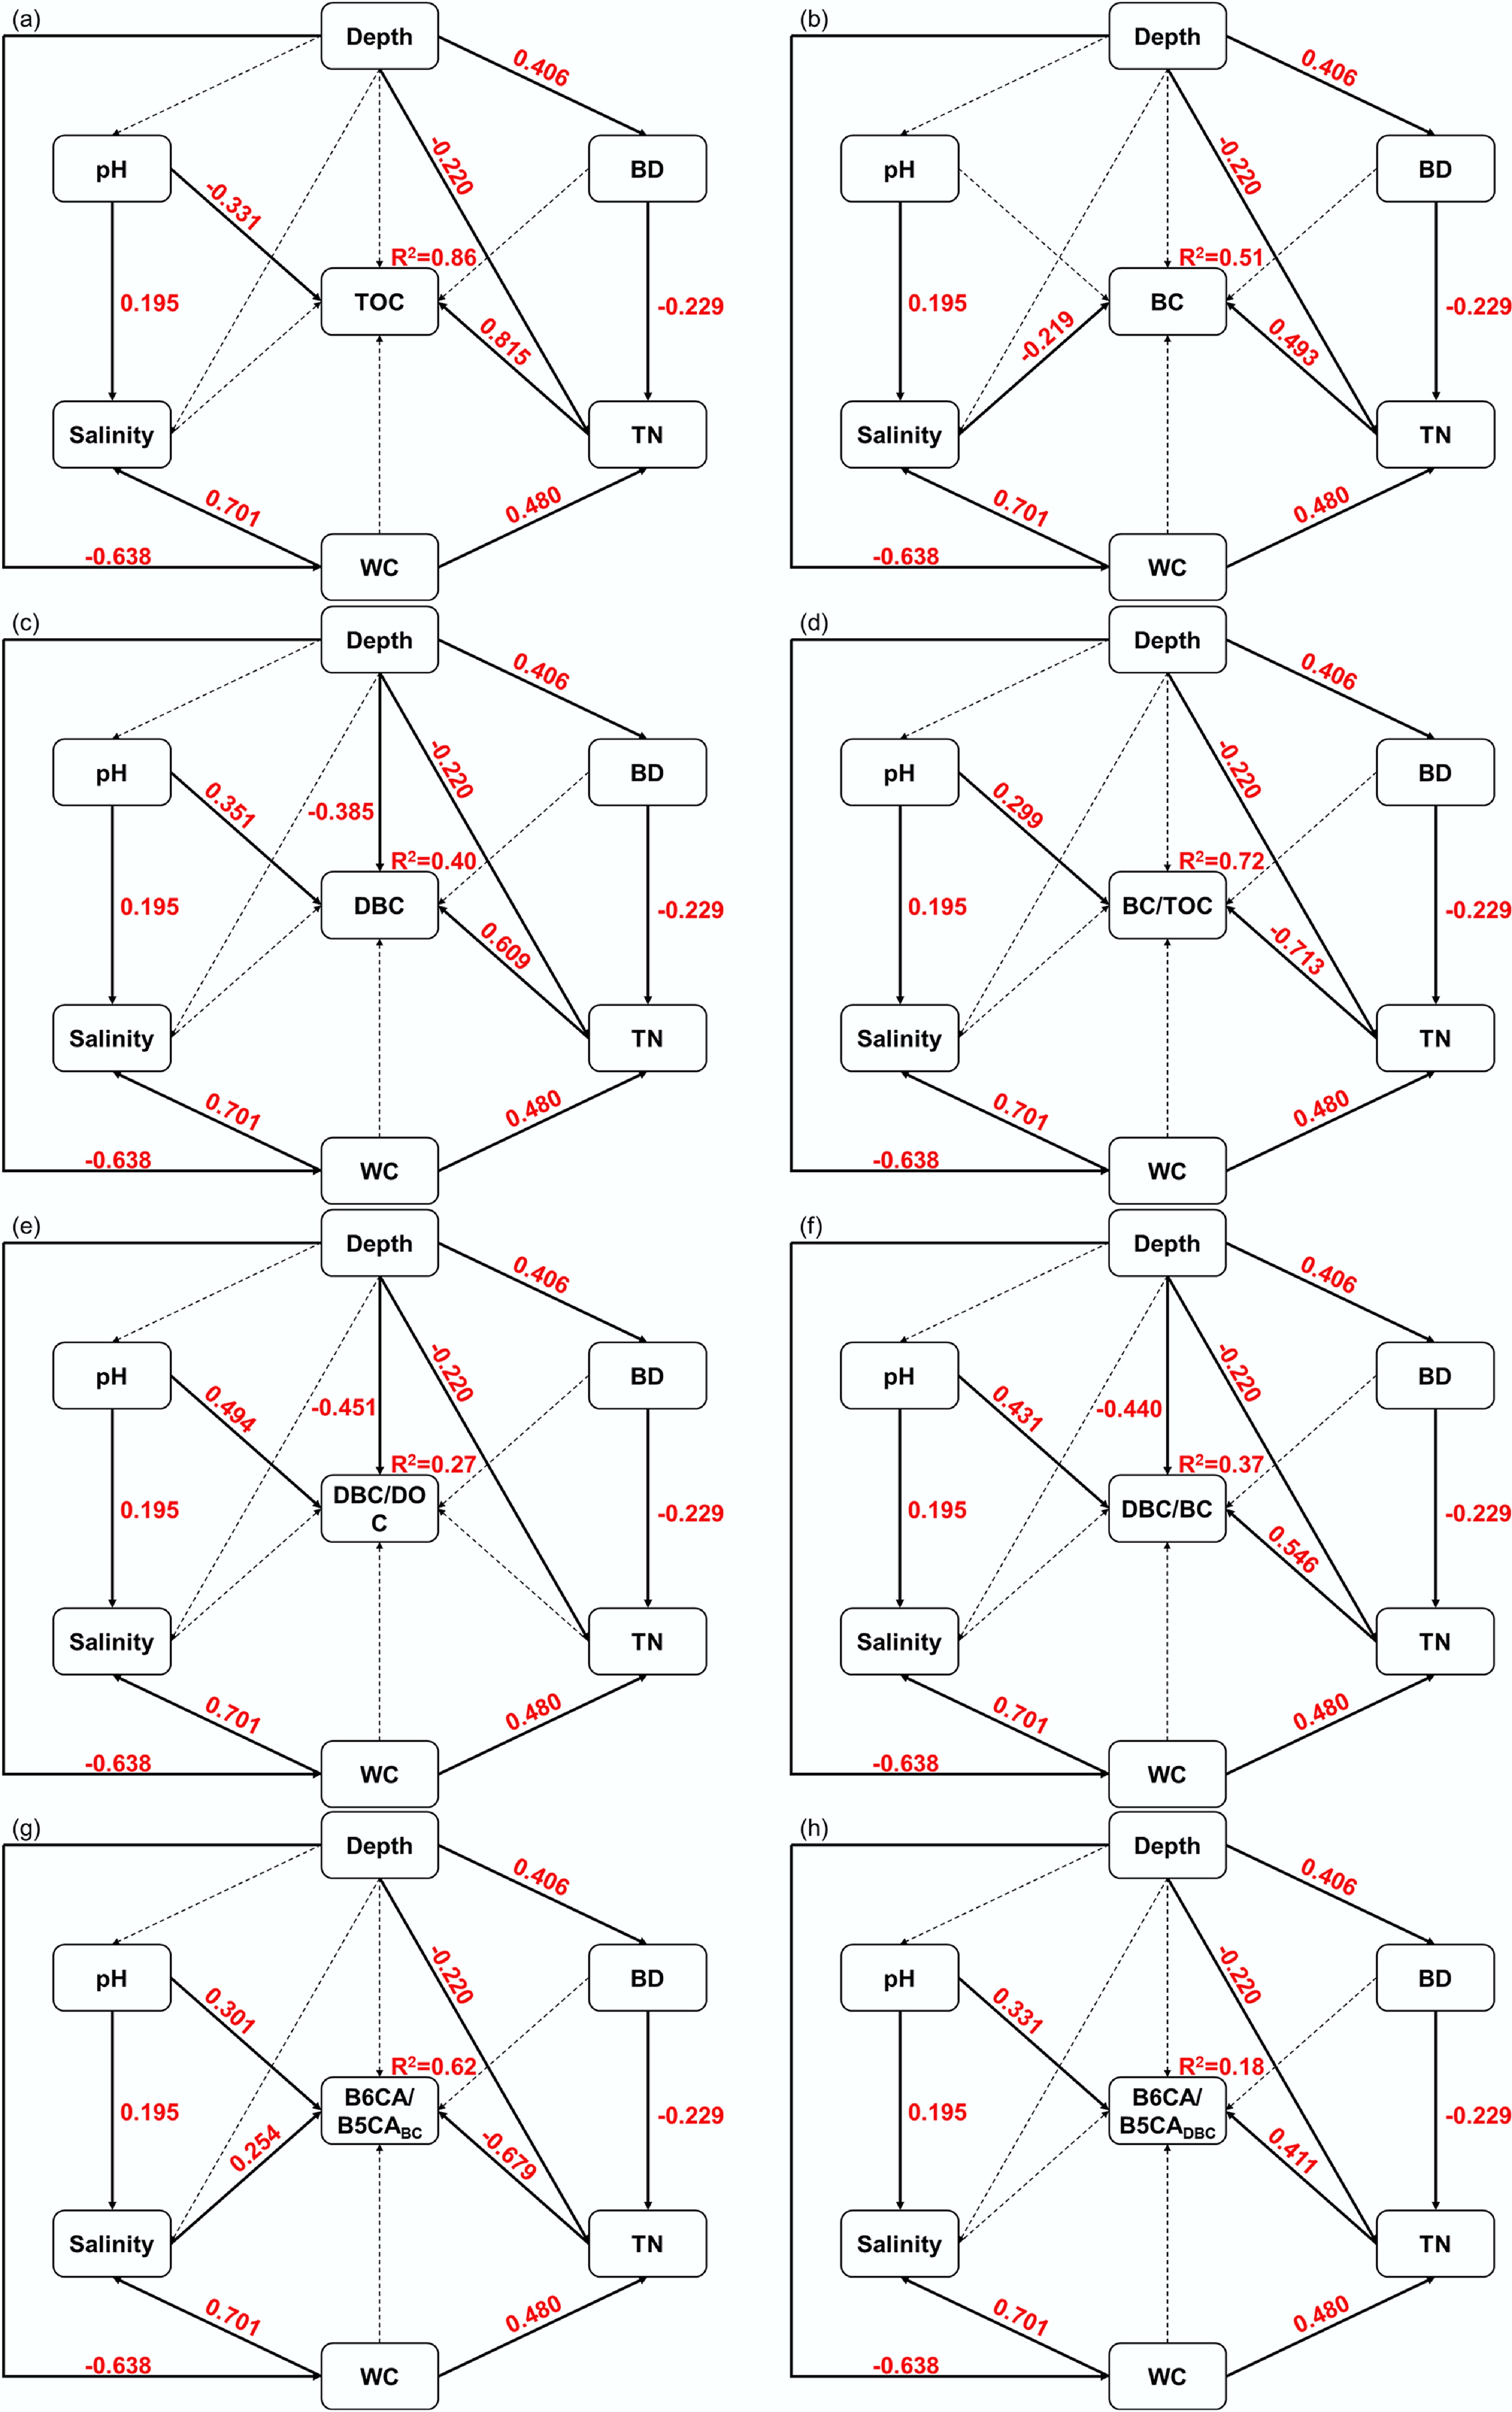
Figure 7.
Structural equation model diagram of the effects of depth on soil carbon fractions. (a) Total organic carbon (TOC); (b) black carbon (BC); (c) dissolved black carbon (DBC); (d) BC/TOC; (e) DBC/DOC; (f) DBC/BC; (g) The ratio of B6CA to B5CA monomers in BC (B6CA/B5CABC); (h) the ratio of B6CA to B5CA monomers in DBC (B6CA/B5CADBC). Each box represents an observed variable. The values on the arrows (solid arrows and red numbers indicate significant effects; dotted arrows indicate insignificant effects) represent the path coefficients. Model fit indices: χ2 = 0.382, p = 0.536, df = 1, root mean square error of approximation = 0.00, normed fit index = 0.998−0.999, comparative fit index = 1.00.
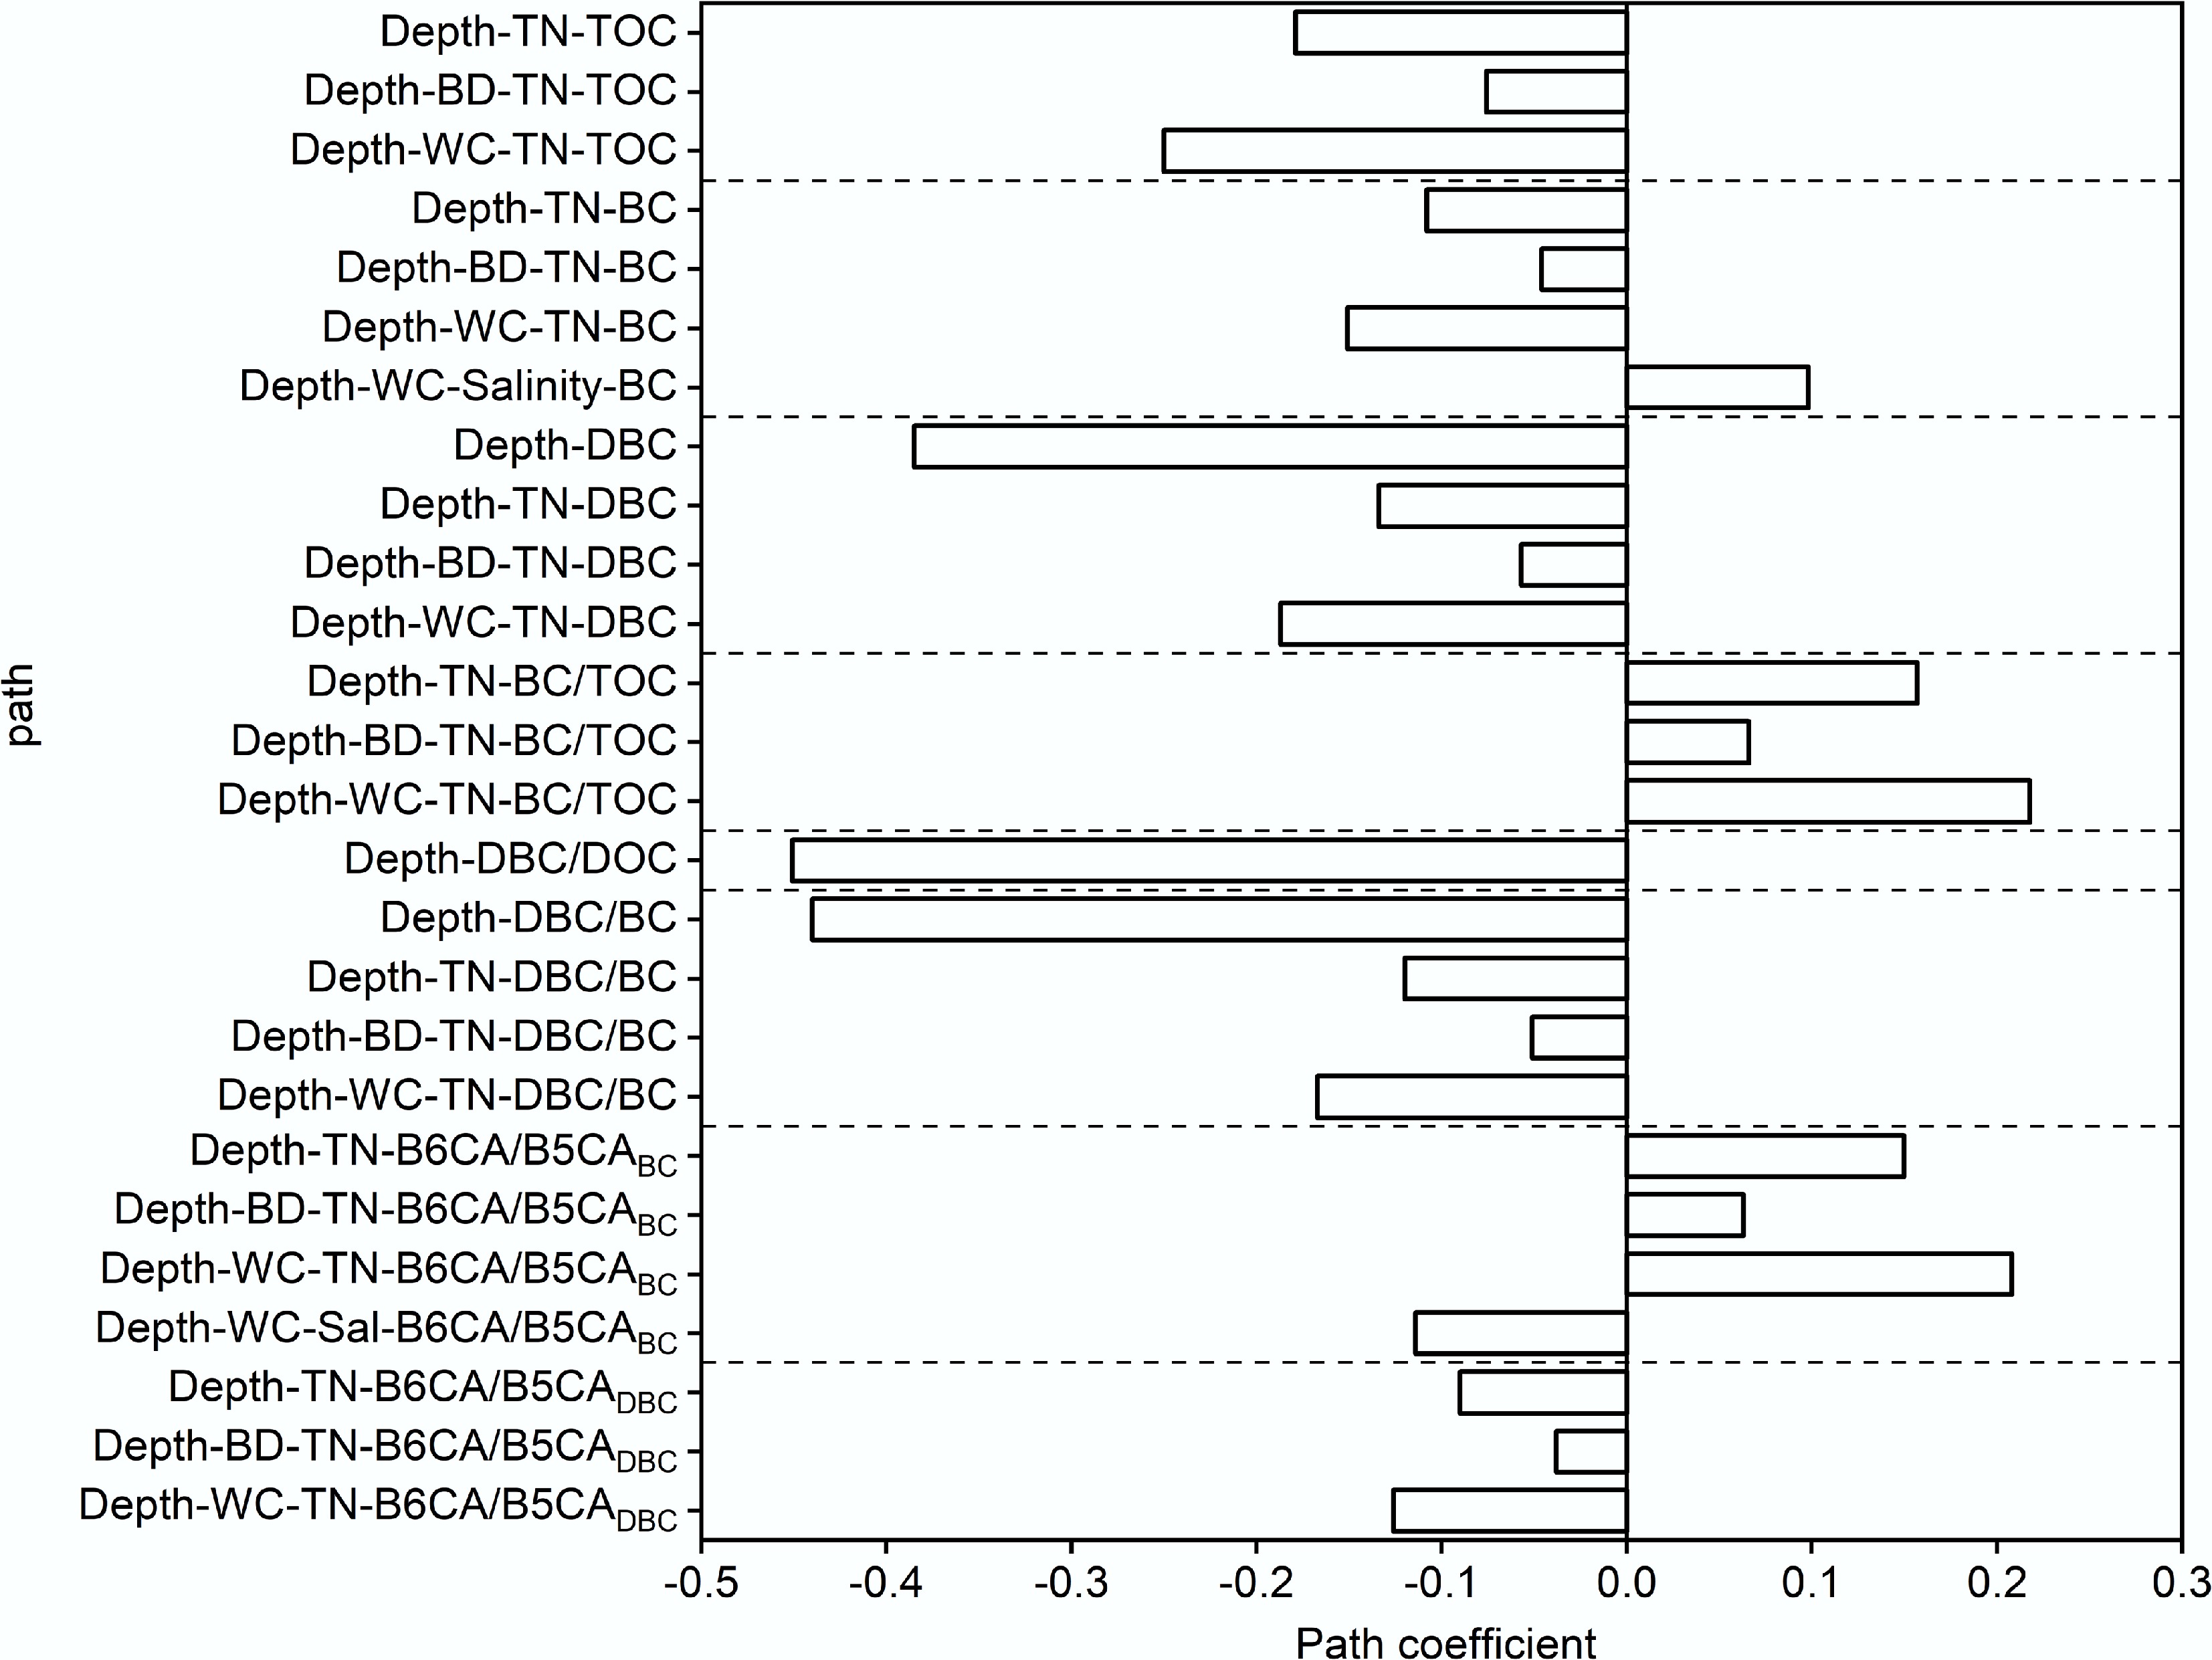
Figure 8.
Direct and indirect effects of soil depth on the soil carbon fraction content.
The BC/TOC ratio increased with soil depth, consistent with findings from Pearl River coastal soils, where the greater recalcitrance of BC led to its preferential preservation relative to TOC[16]. Conversely, DBC, DBC/DOC, and DBC/BC ratios decreased significantly with depth, suggesting stronger DBC adsorption to soil particles and limited downward migration. Higher B6CA/B5CABC and B6CA/B5CADBC ratios in deeper soils indicate that high BD and low WC restricted organic matter and TN accumulation, promoting microbial degradation of labile BC and leaving behind more condensed, stable BC and DBC fractions. From a management perspective, minimizing soil disturbance (e.g., excessive erosion and compaction) is essential to preserve high BC/TOC ratios in soils and strengthen carbon sequestration. Additionally, maintaining soil structure and controlling hydrological processes can further stabilize soil carbon components, contributing to long-term coastal carbon storage and climate change mitigation.
-
This study investigated the spatial distribution of BC and DBC in the soils of the Zhangjiang Estuary mangrove forest in Fujian Province, and analyzed the influence of environmental factors such as landward distance, soil depth, pH, WC, and soil texture on their distribution. BC concentrations ranged from 0.95 to 1.67 g/kg and DBC from 0.95 to 12.18 mg/kg, both relatively low compared with other mangrove systems. Among the environmental drivers, plant biomass was identified as the most critical determinant of BC spatial variation. TN was the primary factor in driving spatial heterogeneity in TOC, DBC, and the BC/TOC ratio, while pH was the primary factor regulating variations in DBC/DOC, DBC/TOC, B6CA/B5CABC, and B6CA/B5CADBC ratios. These findings indicate that different carbon components and stoichiometric ratios are controlled by different driving factors.
With increasing landward distance, TOC, BC, DOC, and DBC concentrations significantly decreased, whereas BC/TOC, B6CA/B5CABC, and B6CA/B5CADBC ratios markedly increased. These trends were primarily driven by the direct or indirect influence of TN, pH, Ca, clay content, and plant biomass. Similarly, with increasing soil depth, TOC, BC, DBC, DBC/DOC, and DBC/BC contents and their respective ratios declined significantly, while BC/TOC, DOC/TOC, and B6CA/B5CABC ratios increased. These patterns were largely regulated by TN, BD, WC, and salinity through direct and indirect pathways. BC and DBC exhibited higher aromatic condensation in deeper soils, particularly in offshore areas. This suggests that BC and DBC may serve as long-term carbon sinks in mangrove soils, playing a role in coastal carbon cycling.
The BC in this region likely originates from long-range atmospheric deposition, with less-condensed fractions more prone to tidal-driven sediment redistribution and subsequent conversion into DBC. To better harness the carbon sequestration potential of BC in mangrove soils, future studies should investigate the interactions between BC and plant roots, microbial communities, natural organic matter, and minerals. Application of radiocarbon and other isotopic techniques will also be essential to precisely trace BC sources and dynamics. Moreover, our SEM analysis is constrained by a relatively small sample size of 75, and the lack of in-situ hydrodynamic data required the use of landward distance as a proxy, which may oversimplify the complex physical mixing processes in the estuary. Consequently, the present findings should be considered exploratory, and future research should validate these patterns using larger sample cohorts, high-resolution hydrodynamic monitoring, and isotopic source tracking to refine the biogeochemical budget of BC in mangrove ecosystems.
We thank the handling editor and reviewers whose input greatly improved the manuscript.
-
It accompanies this paper at: https://doi.org/10.48130/ebp-0026-0001.
-
The authors confirm their contributions to the paper as follows: Chun Cao: conceptualization, data curation, formal analysis, writing − original draft. Weifeng Hu: conceptualization, investigation, data curation, formal analysis, writing − original draft. Shuo Yin: investigation, resources. Tongtong Zhou: methodology, writing − review and editing. Liang Zeng: visualization, software. Peng Zhang: methodology, writing − review and editing. Hui Zeng: investigation, resources. Guangcai Zhong: methodology. Chunling Luo: methodology. Gan Zhang: methodology, funding acquisition. Yan Zheng: methodology, funding acquisition. Junjian Wang: conceptualization, funding acquisition, supervision, writing − original draft, writing − review and editing. All authors reviewed the results and approved the final version of the manuscript.
-
The datasets generated during and/or analyzed during the current study are available from the corresponding author upon reasonable request.
-
This work was supported by the Natural Science Foundation of China (Grant Nos 42321004, 42192513, and 42477227), the Fundamental and Interdisciplinary Disciplines Breakthrough Plan of the Ministry of Education of China (JYB2025XDXM909), the Guangdong Basic and Applied Basic Research Foundation (Grant No. 2023A1515110245), and the High-Level University Special Fund (Grant No. G03050K001).
-
The authors declare that they have no conflict of interest.
-
Black carbon (BC) and dissolved BC (DBC) were quantified in mangrove soils of the Zhangjiang Estuary.
BC (0.95–1.67 g/kg) and DBC contents (0.95–12.18 mg/kg) decreased with increasing landward distance and soil depth.
BC variation was mainly driven by plant biomass, nitrogen, and bulk density; DBC by nitrogen and moisture.
More condensed BC and DBC fractions were preserved in deeper soils, especially in offshore areas.
-
# Authors contributed equally: Chun Cao, Weifeng Hu
Full list of author information is available at the end of the article. - The supplementary files can be downloaded from here.
- Copyright: © 2026 by the author(s). Published by Maximum Academic Press, Fayetteville, GA. This article is an open access article distributed under Creative Commons Attribution License (CC BY 4.0), visit https://creativecommons.org/licenses/by/4.0/.
-
About this article
Cite this article
Cao C, Hu W, Yin S, Zhou T, Zeng L, et al. 2026. Soil black carbon distribution in a mangrove blue carbon ecosystem. Environmental and Biogeochemical Processes 2: e006 doi: 10.48130/ebp-0026-0001 

Soil black carbon distribution in a mangrove blue carbon ecosystem
- Received: 03 November 2025
- Revised: 21 December 2025
- Accepted: 07 January 2026
- Published online: 28 January 2026
Abstract: Black carbon (BC), a highly recalcitrant carbon pool, can persist in mangrove 'blue carbon' ecosystems, and contribute to land–ocean carbon transport through the release of dissolved black carbon (DBC). However, the spatial distributions of BC and DBC in coastal mangrove soils, and their regulating factors remain poorly understood. Here, BC and DBC were quantified across land–ocean and soil depth gradients in mangrove soils of the Zhangjiang Estuary, China. Soil BC content ranged from 0.95 to 1.67 g/kg, accounting for 3.5%–17.4% of total organic carbon (TOC), while DBC content ranged from 0.95 to 12.18 mg/kg, comprising 0.36%–3.07% of dissolved organic carbon (DOC). Plant biomass was the dominant positive factor influencing BC content. Soil total nitrogen (TN) was negatively correlated with BC/TOC but positively correlated with DBC. Additionally, soil pH had significant positive effects on DBC/DOC, DBC/TOC, and benzenehexacarboxylic-to-benzenepentacarboxylic acid ratio for BC and DBC (B6CA/B5CABC and B6CA/B5CADBC). Landward distance negatively influenced BC and DBC directly or indirectly via TN, plant biomass, and clay content, while positively affecting BC/TOC and B6CA/B5CABC through TN, plant biomass, and pH. Soil depth exerted a direct or indirect negative effect on BC, DBC, DBC/DOC, and DBC/BC through TN, bulk density, and soil water content, while positively influencing BC/TOC and B6CA/B5CABC. Overall, these findings highlight how environmental factors shape BC and DBC dynamics in mangrove soils, and offer insights into strategies for enhancing BC sequestration in coastal blue carbon ecosystems.