-
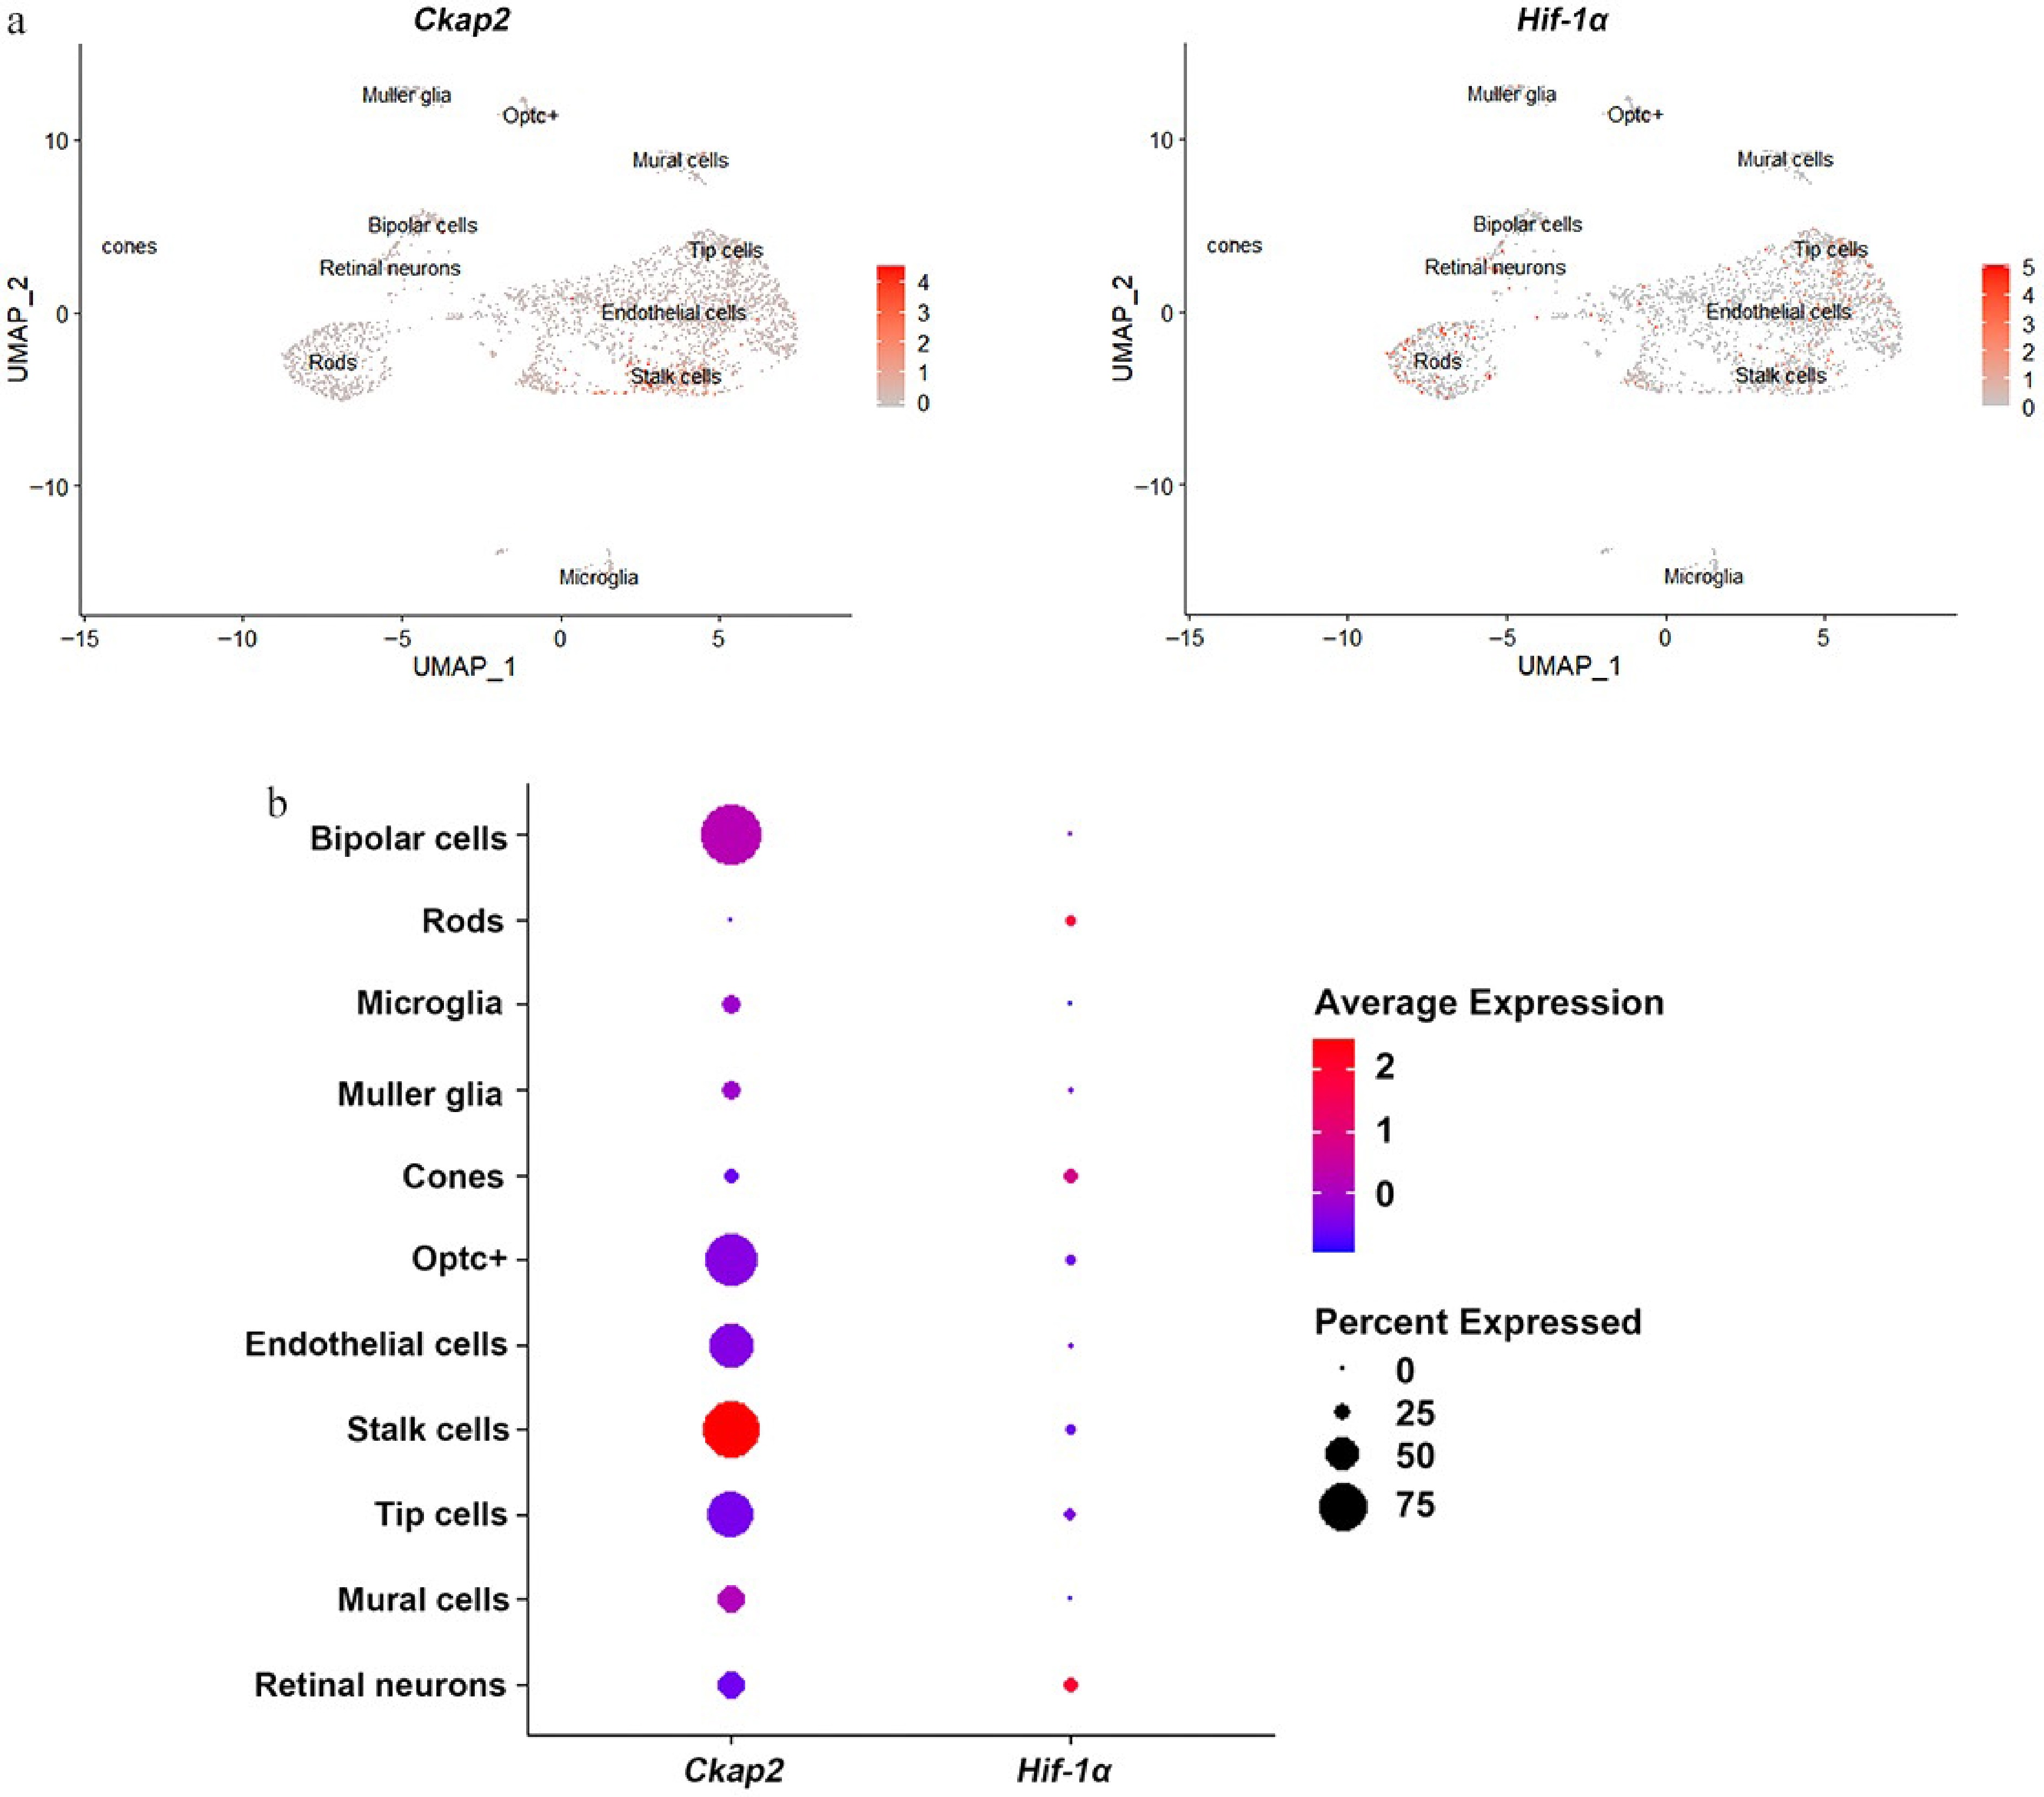
Figure 1.
Expression patterns of Ckap2 and Hif-1α in retinal cells in the OIR model. (a) UMAP visualization of single-cell RNA sequencing data showing the expression distribution of Ckap2 (left) and Hif-1α (right) across various retinal cell populations in the OIR model on postnatal day 14. (b) Dot plot showing the relative expression levels (color intensity) and proportion of expressing cells (dot size) for Ckap2 and Hif-1α across retinal cell types. Data were reanalyzed from the published scRNA-seq dataset GSE174400; no additional statistical tests were performed for this descriptive analysis. UMAP, uniform manifold approximation and projection; OIR, oxygen-induced retinopathy; Ckap2, cytoskeleton-associated protein 2; Hif-1α, hypoxia-inducible factor 1-alpha.
-
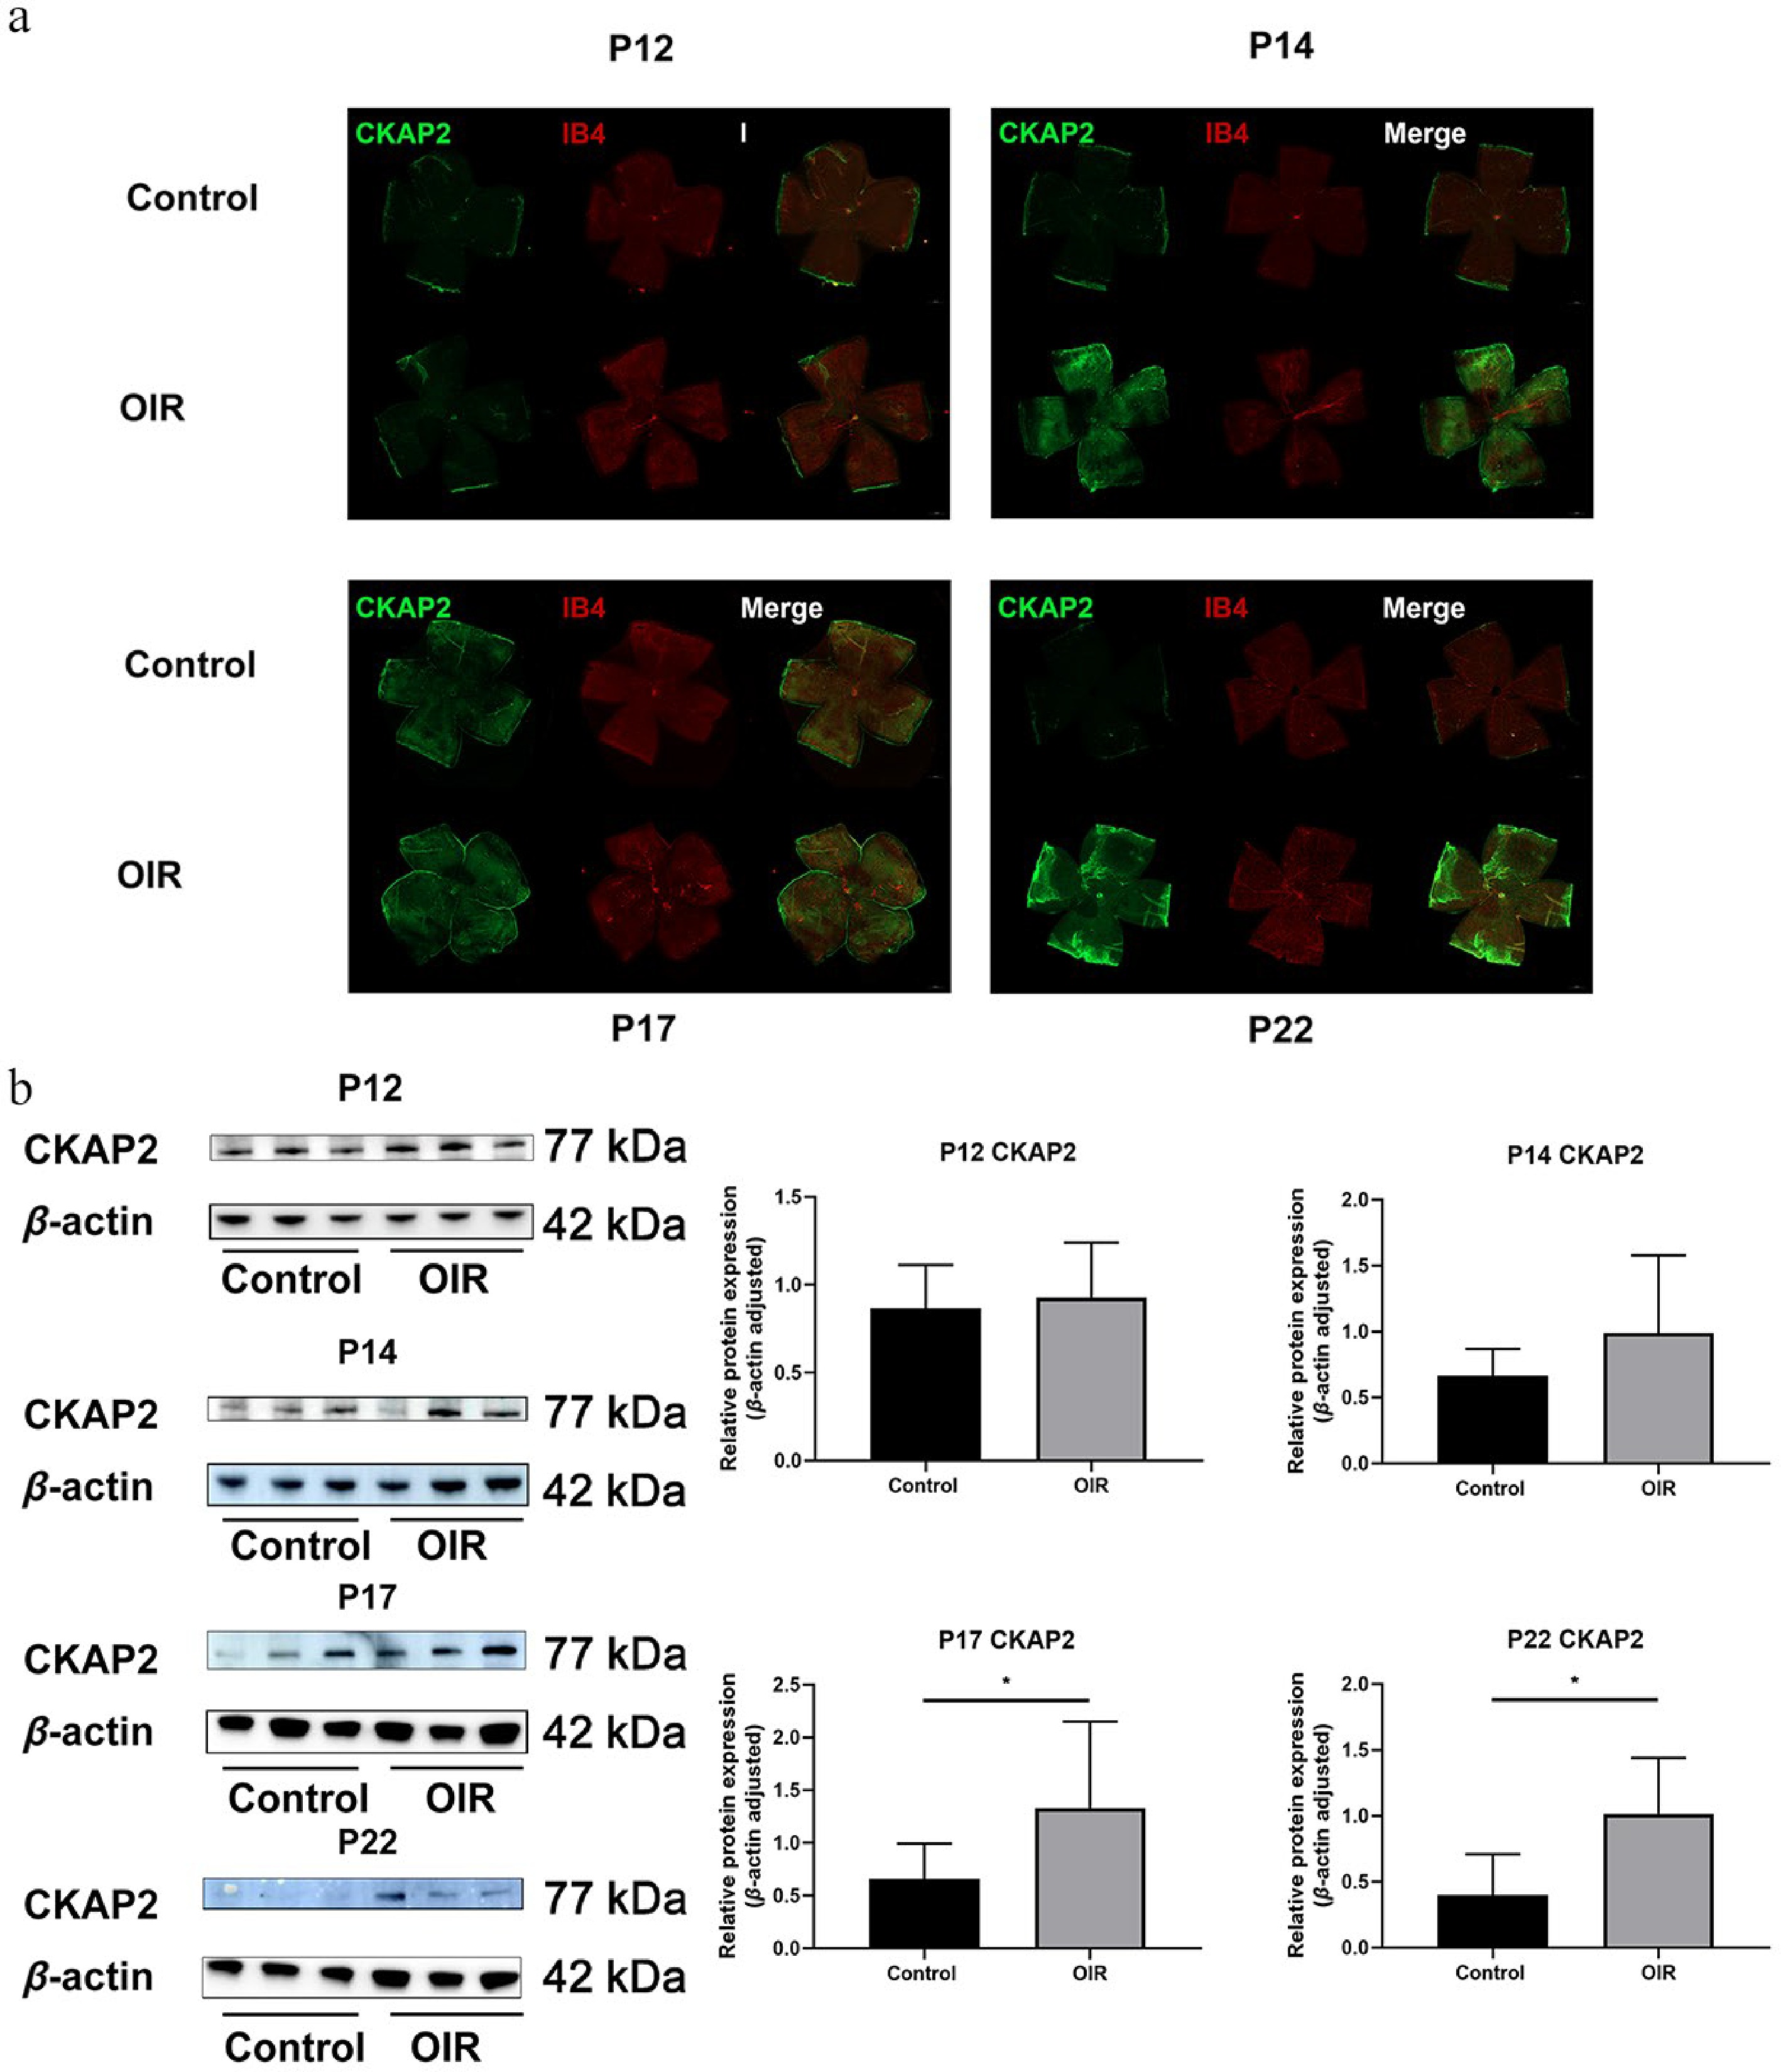
Figure 2.
Spatial expression and colocalization of CKAP2 with IB4 in the retinas of OIR and control mice at different developmental stages. (a) Immunofluorescence staining of CKAP2 (green) and IB4 (red) in retinal flat mounts from control and OIR mice on postnatal days (P) 12, 14, 17, and 22. Scale bar: 500 µm. Representative images were obtained from n = 3 mice per group at each time point. (b) Western blot analysis of CKAP2 protein expression in retinal tissues from control and OIR mice at different developmental stages (on P12, P14, P17, and P22. n = 3 per group). Quantification of CKAP2 expression is normalized to β-actin. Data are presented as mean ± SD (n = 3 mice per group); comparisons between control and OIR groups at each time point were performed using unpaired two-tailed t-tests. * p < 0.05. CKAP2, cytoskeleton-associated protein 2; HIF-1α, hypoxia-inducible factor 1-alpha; IB4, isolectin B4; OIR, oxygen-induced retinopathy.
-
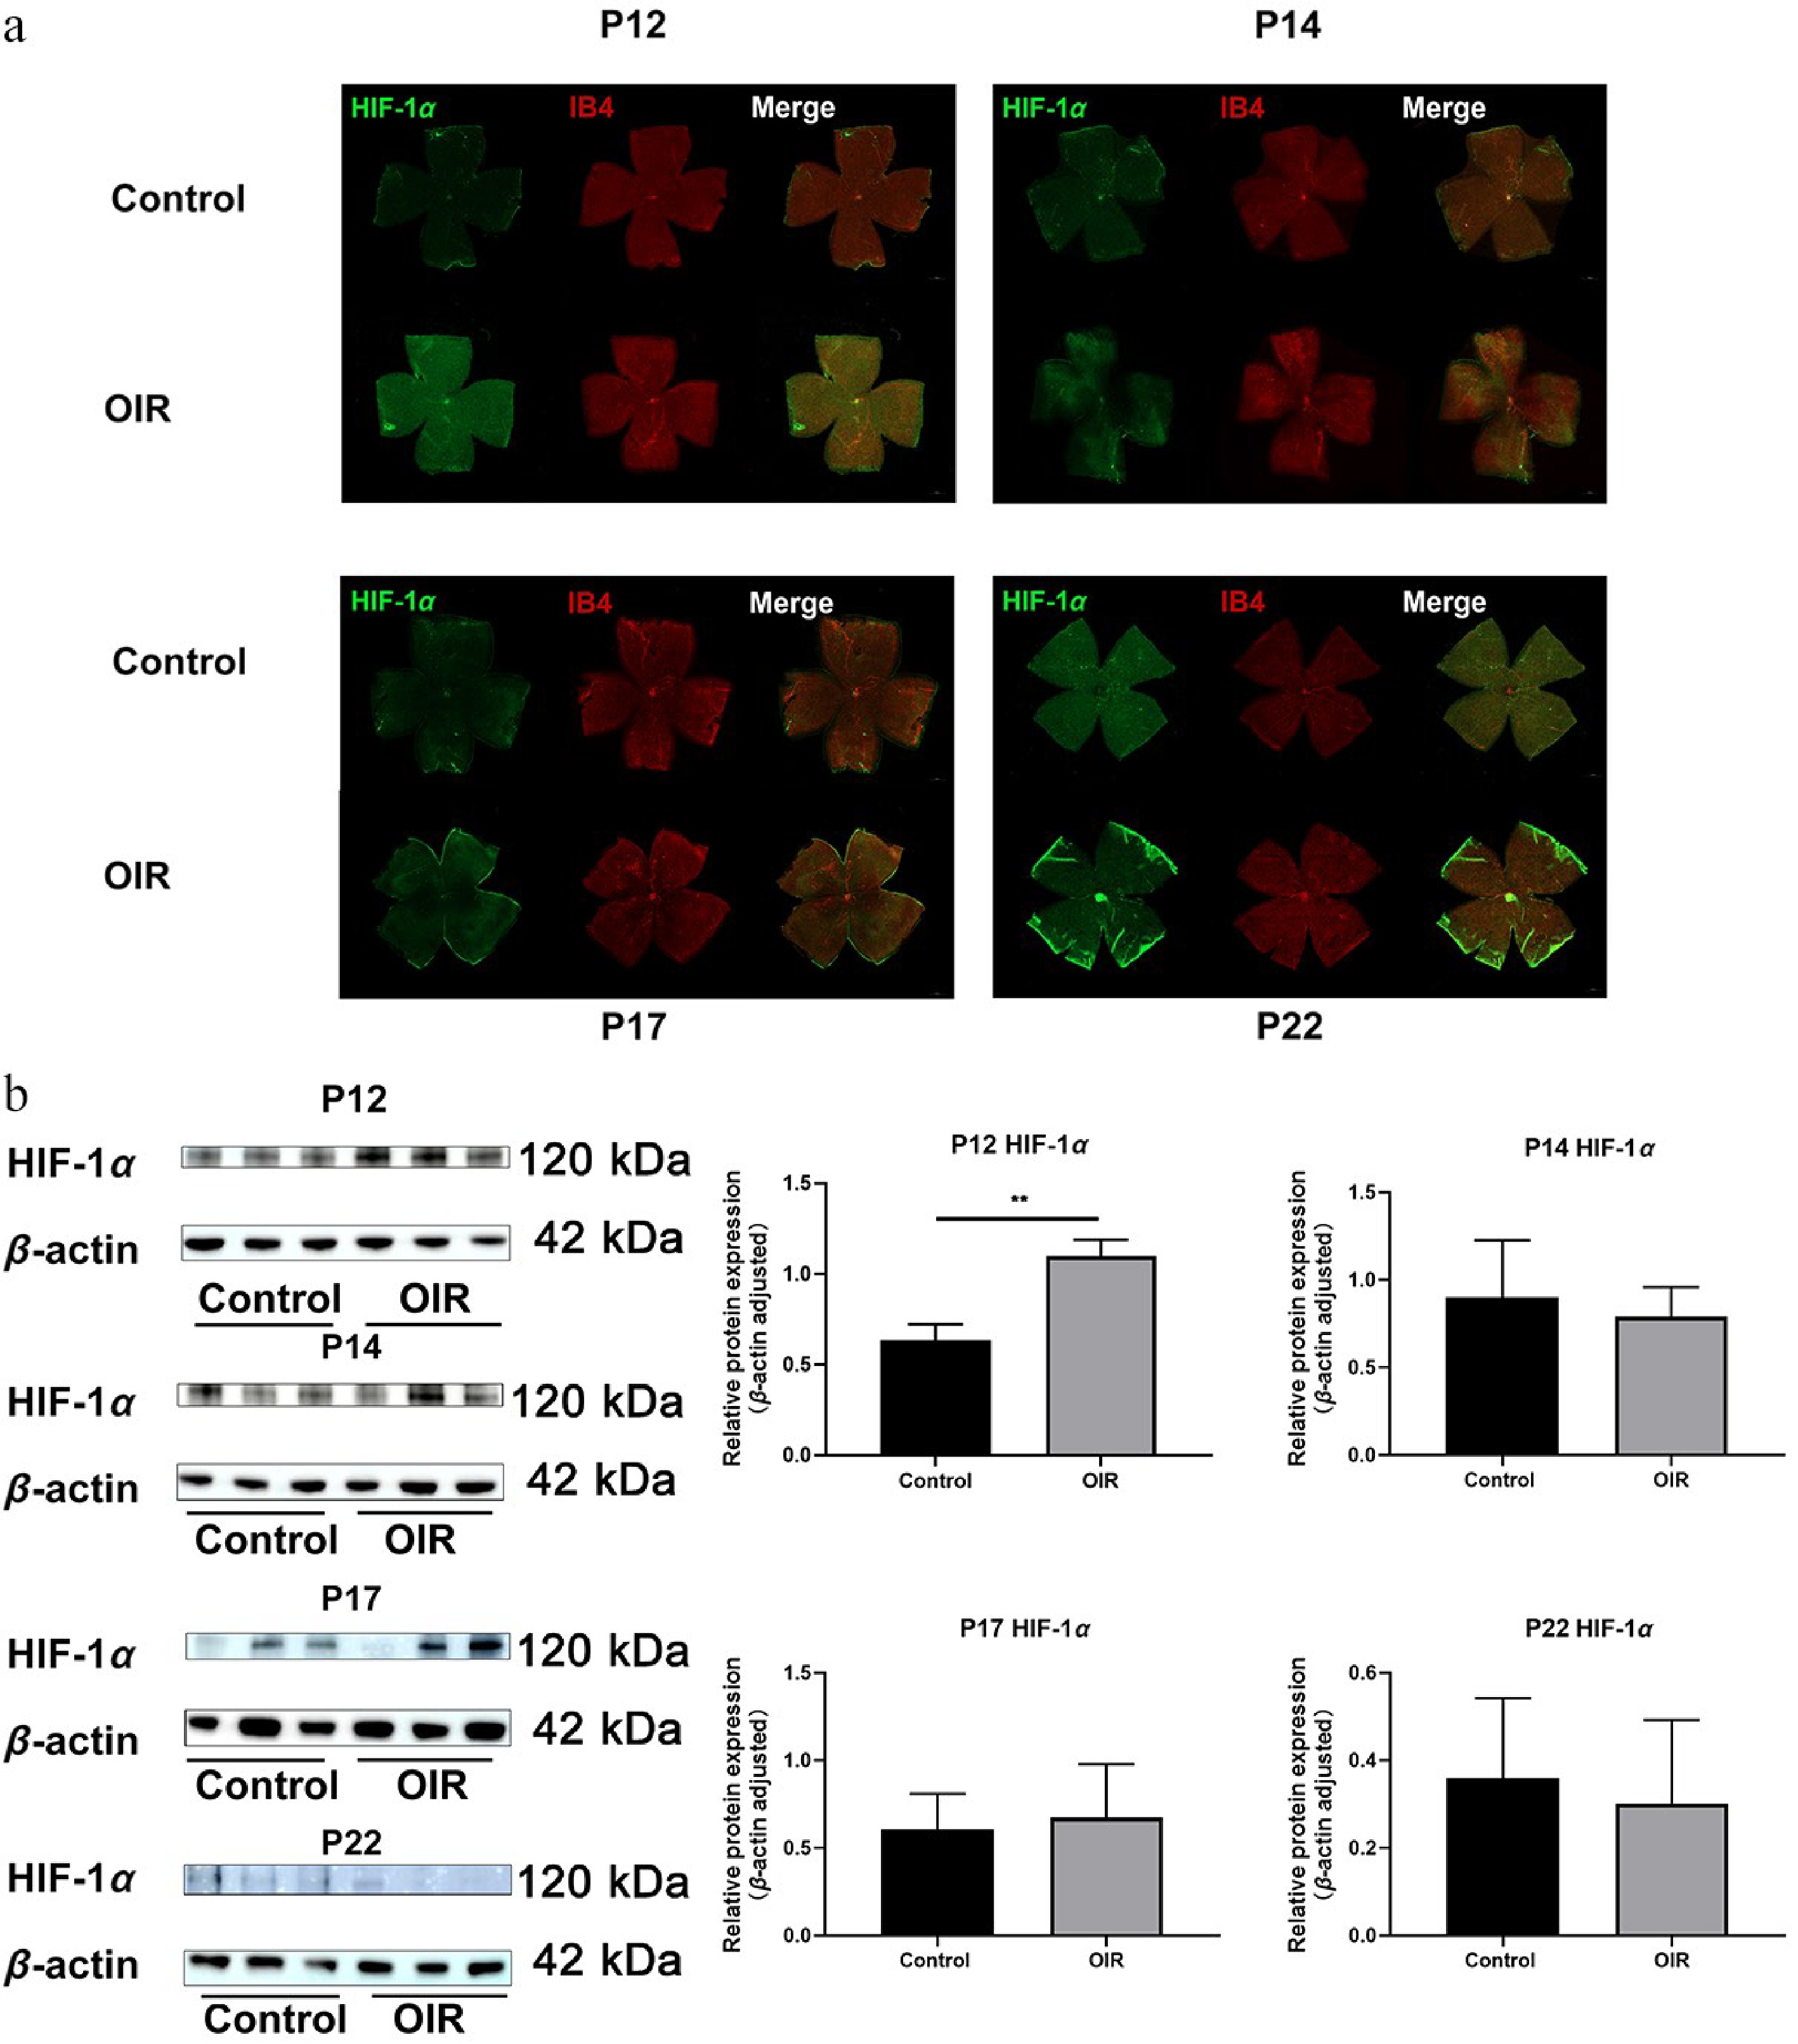
Figure 3.
Spatial expression and colocalization of HIF-1α with IB4 in the retinas of OIR and control mice at different developmental stages. (a) Immunofluorescence staining of HIF-1α (green) and IB4 (red) in the same retinal flat mounts from control and OIR mice on post-natal days (P) 12, 14, 17, and 22. Scale bar: 500 µm. Representative images were obtained from n = 3 mice per group at each time point. (b) Western blot analysis of HIF-1α protein expression at different developmental stages (on P12, P14, P17, and P22. n = 3 per group). Quantification of HIF-1α expression is normalized to β-actin. Data are presented as mean ± SD (n = 3 mice per group); comparisons between control and OIR groups at each time point were performed using unpaired two-tailed t-tests. ** p < 0.01. CKAP2, cytoskeleton-associated protein 2; HIF-1α, hypoxia-inducible factor 1-alpha; IB4, isolectin B4; OIR, oxygen-induced retinopathy.
-
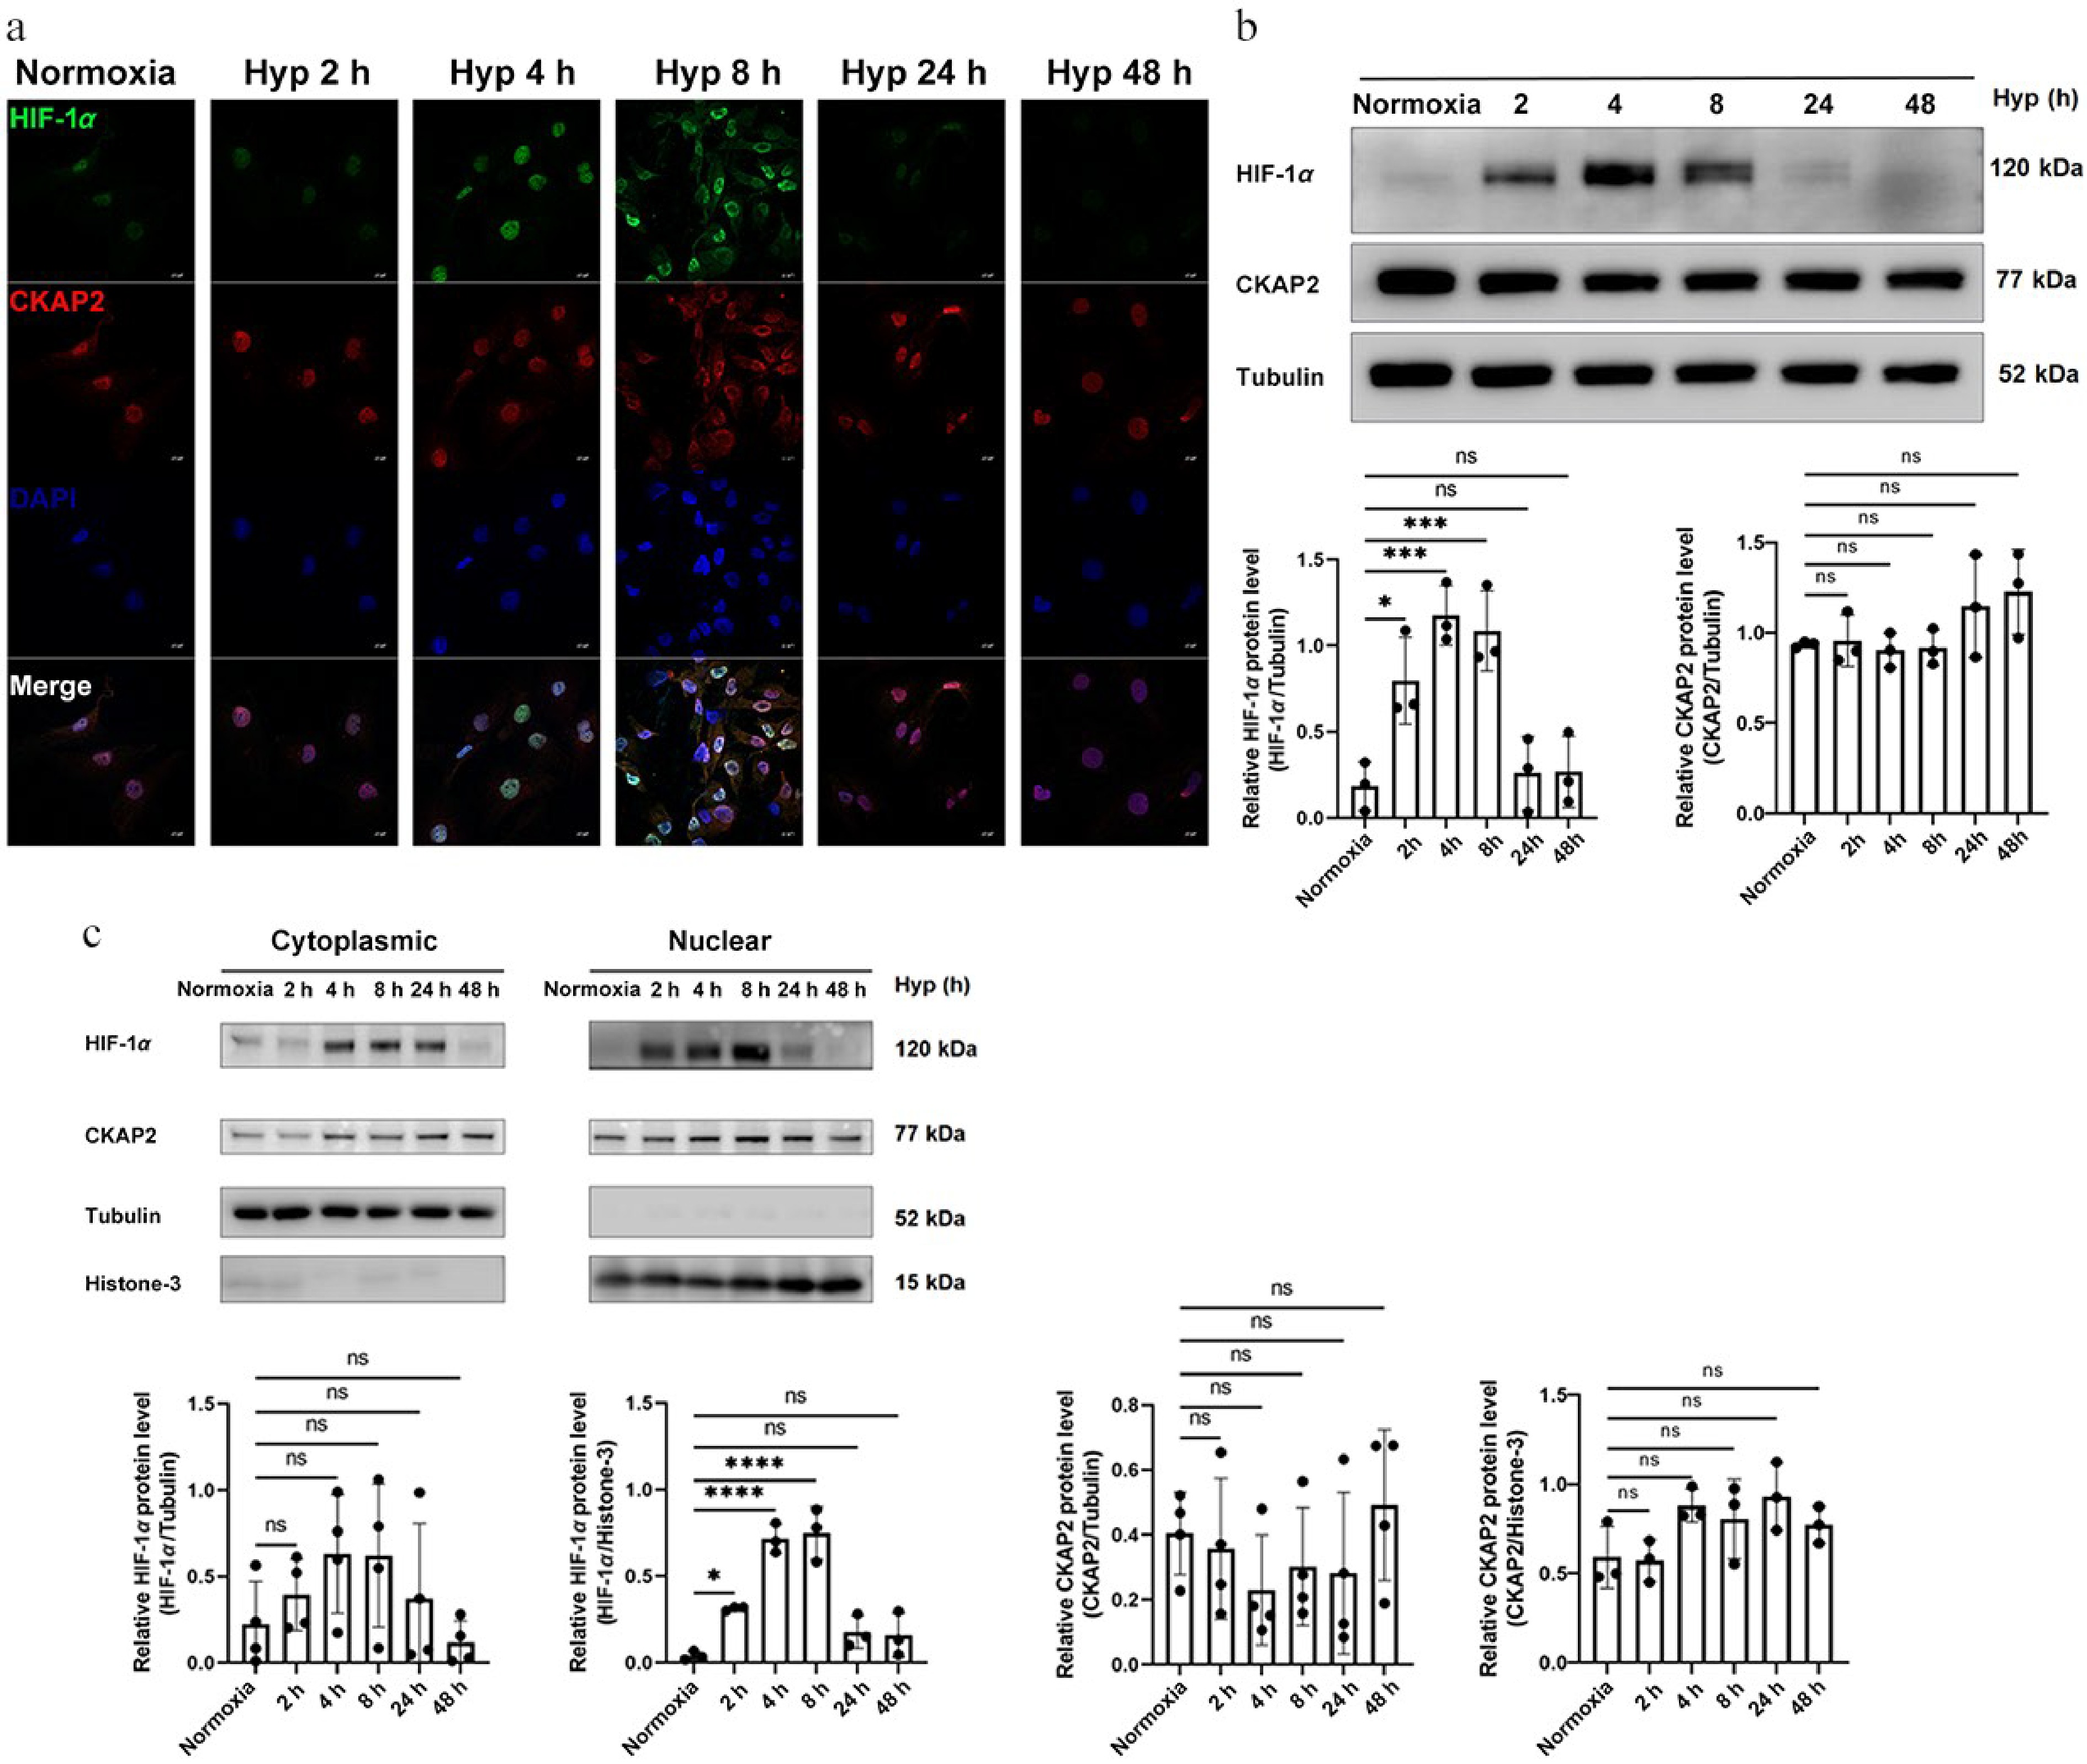
Figure 4.
Time-dependent expression and localization of HIF-1α and CKAP2 under hypoxic conditions in HRMECs. (a) Representative immunofluorescence images showing the localization of HIF-1α (green) and CKAP2 (red) in HRMECs exposed to normoxia (control) or hypoxia for 2, 4, 8, 24, and 48 h. DAPI (blue) was used for nuclear staining. Scale bars: 20 µm. Images are representative of n = 3 independent experiments. (b) Western blot analysis of HIF-1α and CKAP2 protein levels in HRMECs exposed to hypoxia for 2, 4, 8, 24, and 48 h (n = 3). Quantitative analysis normalized to tubulin is shown below the blot. Data are presented as mean ± SD (n = 3); comparisons among multiple time points were performed using one-way analysis of variance (ANOVA) followed by appropriate post hoc multiple-comparison tests (* p < 0.05; ** p < 0.01; ns: not significant). (c) Subcellular localization of HIF-1α and CKAP2 proteins under hypoxia was assessed by western blot analysis of cytoplasmic and nuclear fractions. Quantification is shown with normalization to tubulin (cytoplasmic fraction) and histone H3 (nuclear fraction). Data are presented as mean ± SD (n = 3); comparisons between normoxia and hypoxia within each subcellular fraction were performed using unpaired two-tailed t-tests (* p < 0.05; ** p < 0.01). HIF-1α, hypoxia-inducible factor 1-alpha; CKAP2, cytoskeleton-associated protein 2; HRMEC, human retinal microvascular endothelial cell; Hyp, hypoxia.
-
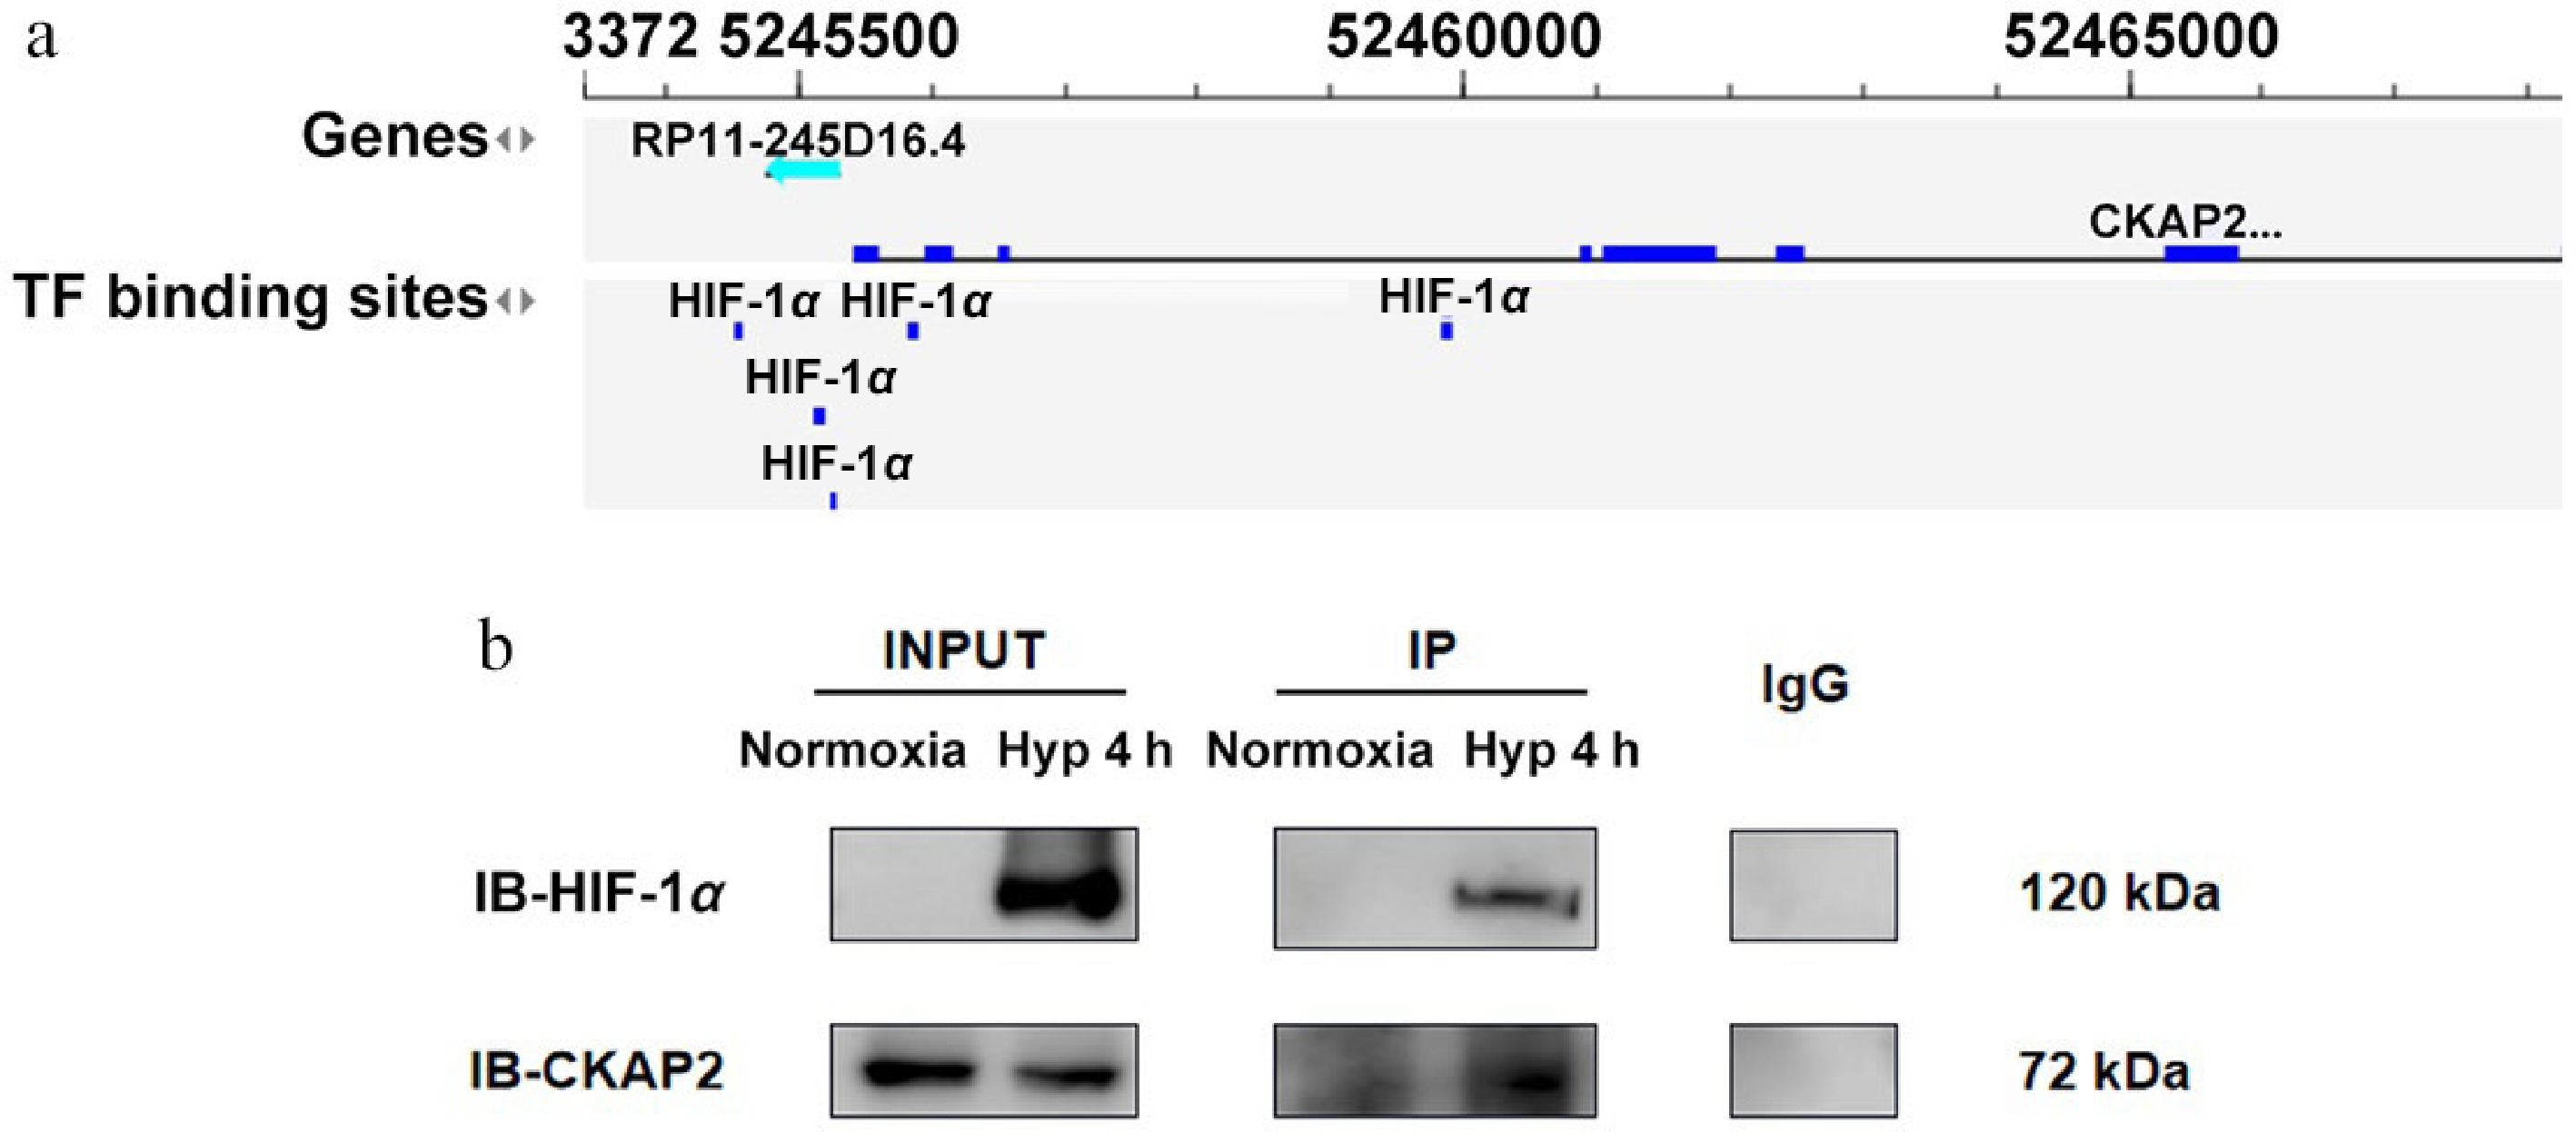
Figure 5.
Identification of CKAP2 and HIF-1α interaction under hypoxic conditions in HRMECs. (a) Bioinformatics analysis indicating TF binding sites for HIF-1α in the CKAP2 genomic locus. (b) Co-immunoprecipitation analysis showing the interaction between HIF-1α and CKAP2 in HRMECs under normoxic and hypoxic conditions (at 4 h). Blots are representative of n = 3 independent experiments; no formal statistical tests were performed. HIF-1α, hypoxia-inducible factor 1-alpha; CKAP2, cytoskeleton-associated protein 2; TF, transcription factor; HRMEC, human retinal microvascular endothelial cell; IB, immunoblot.
-
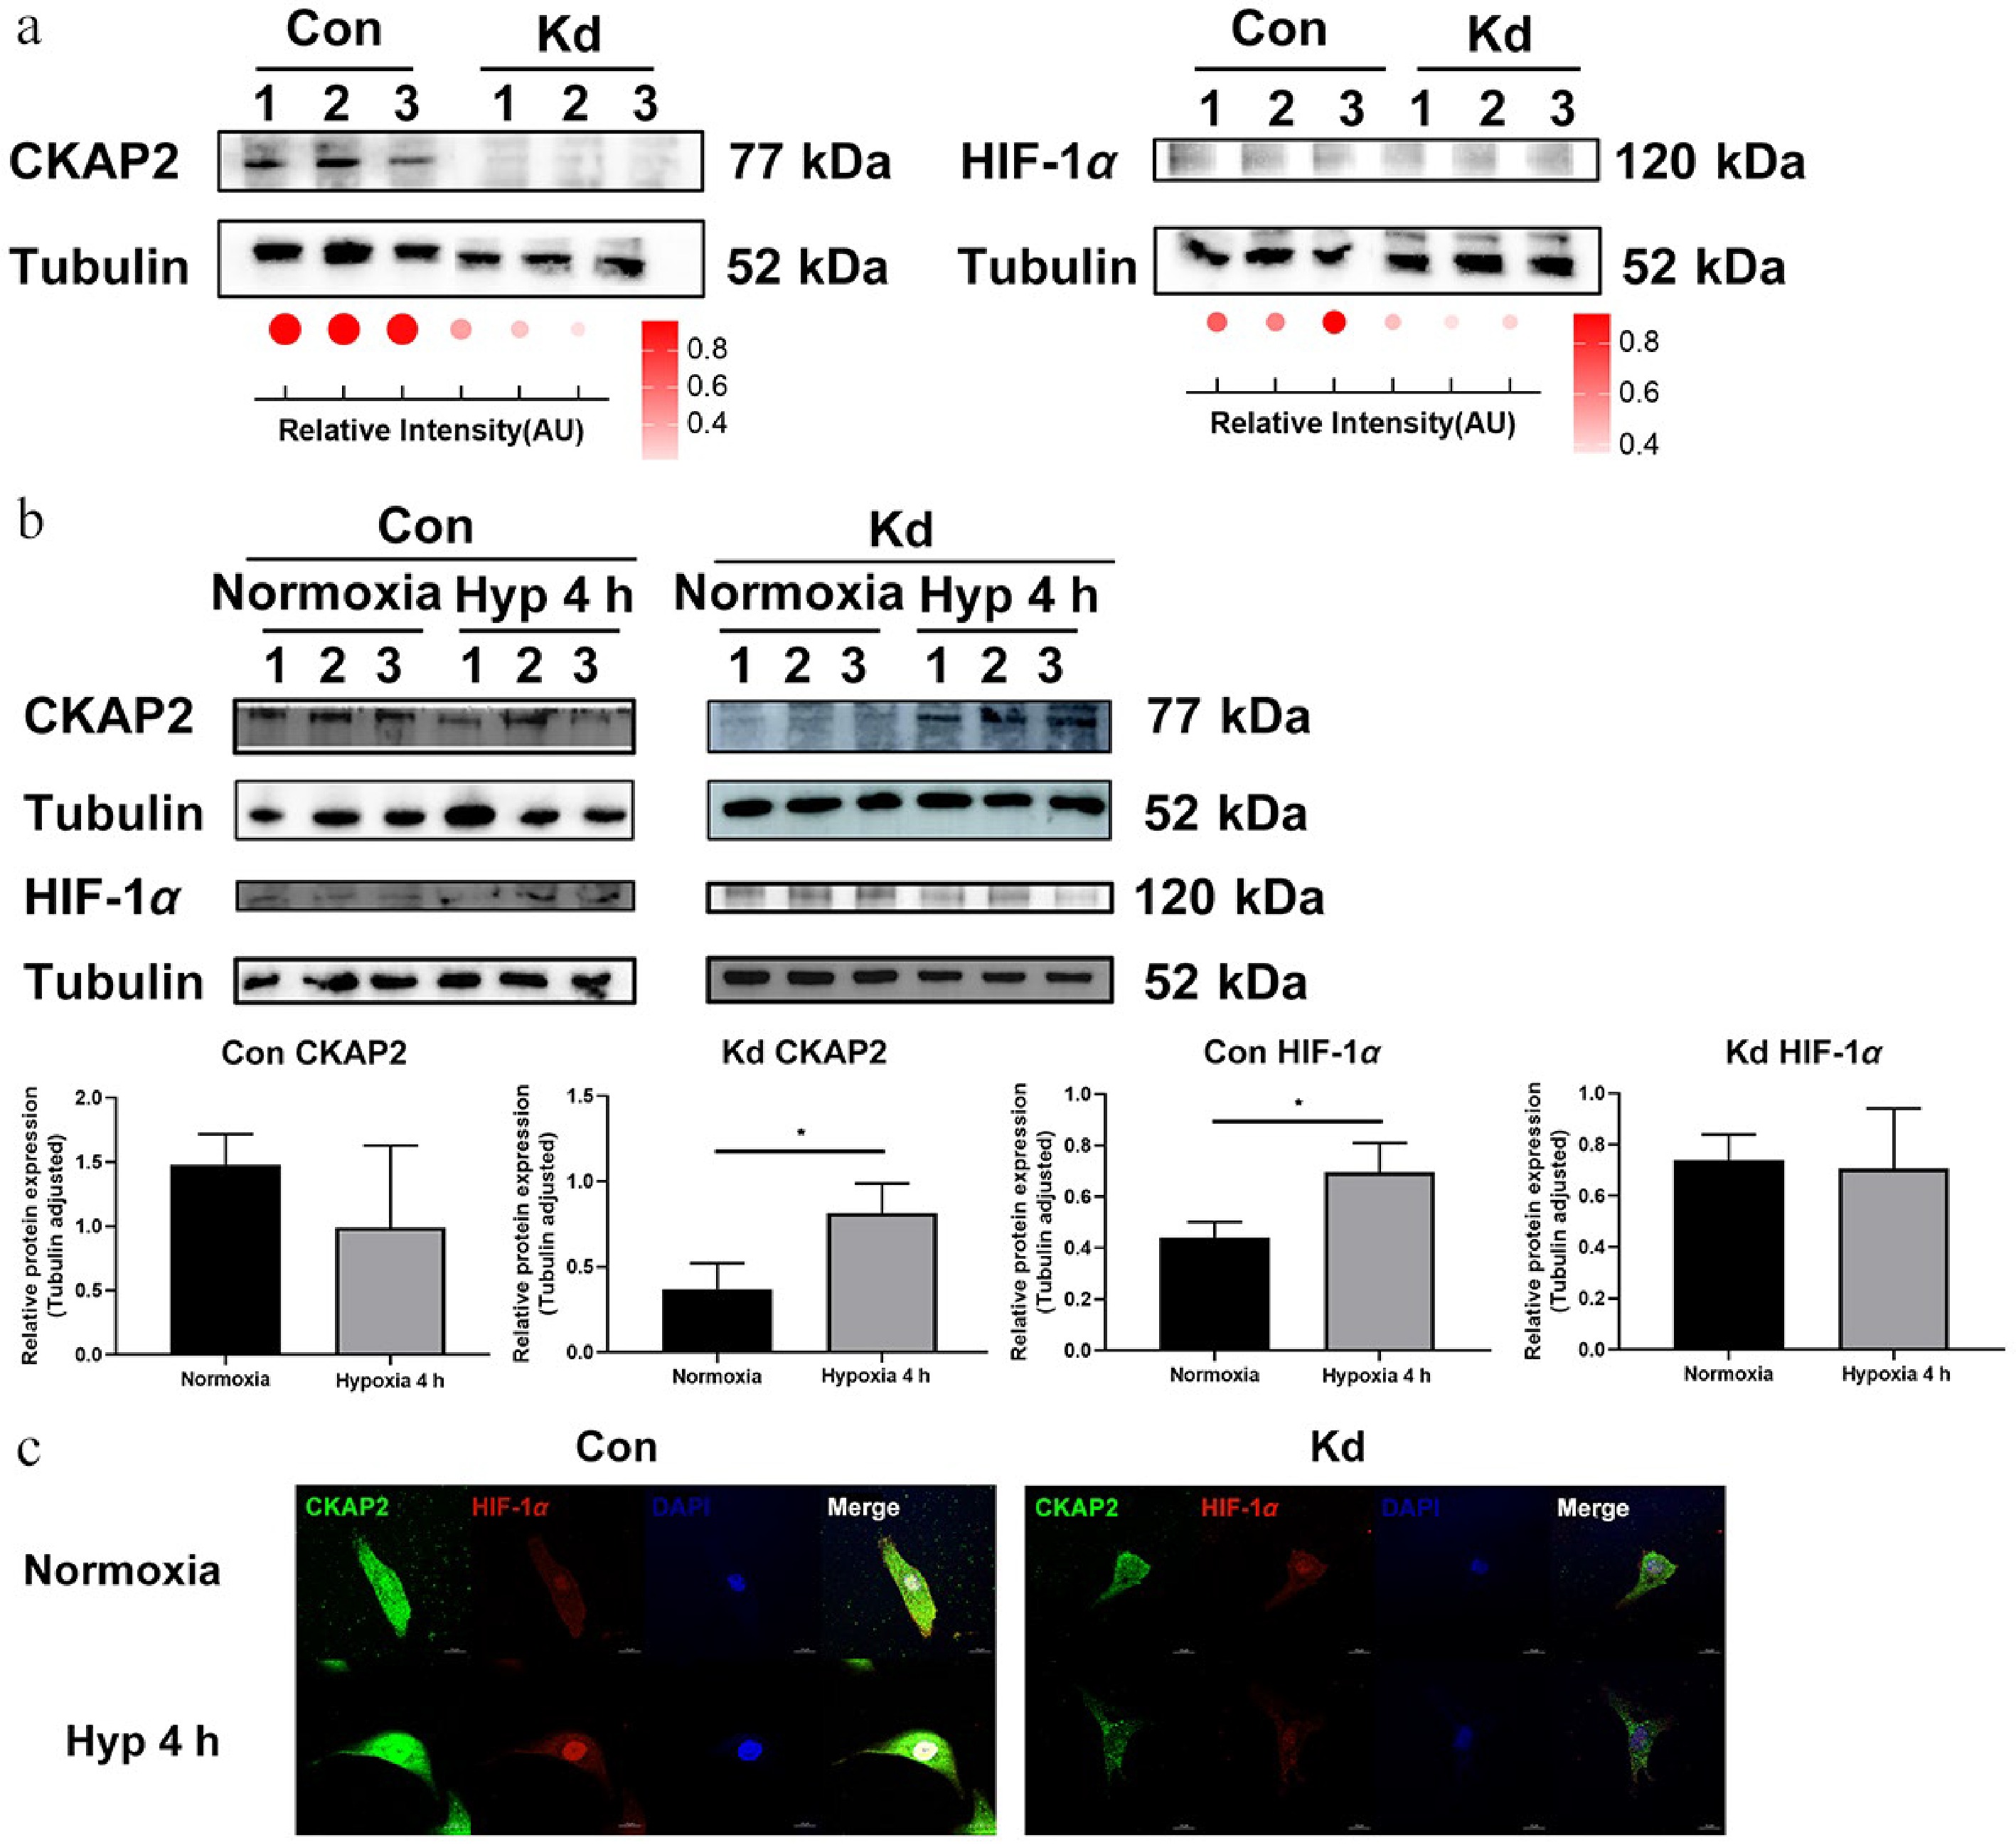
Figure 6.
Effects of Ckap2 knockdown on HIF-1α expression under hypoxic conditions in HRMECs. (a) Western blot analysis of CKAP2 and HIF-1α protein levels in Ckap2 Kd and Con HRMECs under normoxic conditions. Tubulin served as a loading control. Quantification of band intensities is represented by dot plots below, indicating relative signal intensity normalized to tubulin. Data are presented as mean ± SD (n = 3); comparisons between Con and Kd groups were performed using unpaired two-tailed t-tests. (b) Time-course western blot analysis of CKAP2 and HIF-1α protein expression in Con HRMECs (left panel) and Ckap2 Kd HRMECs (right panel) under hypoxic conditions (at 4 h). From bottom left to right: CKAP2 expression in the Con group, CKAP2 expression in the Kd group, HIF-1α expression in the Con group, and HIF-1α expression in the Kd group. Data are presented as mean ± SD (n = 3); comparisons among multiple time points within each group were performed using one-way ANOVA followed by appropriate post hoc multiple-comparison tests (* p < 0.05; ** p < 0.01; *** p < 0.001). Quantitative data normalized to tubulin are shown below. (c) Immunofluorescence imaging of CKAP2 (green) and HIF-1α (red) in Ckap2 Kd and Con HRMECs under normoxia and hypoxia (at 4 h). DAPI (blue) was used to stain nuclei. CKAP2, cytoskeleton-associated protein 2; HIF-1α, hypoxia-inducible factor 1-alpha; HRMEC, human retinal microvascular endothelial cell; Con, control; Kd, knockdown; Hyp, hypoxia. Scale bar: 20 µm. Images are representative of n = 3 independent experiments. For presentation, brightness and contrast were adjusted uniformly across all images within each channel to improve visualization of CKAP2–HIF-1α colocalization while maintaining data integrity.
Figures
(6)
Tables
(0)