-
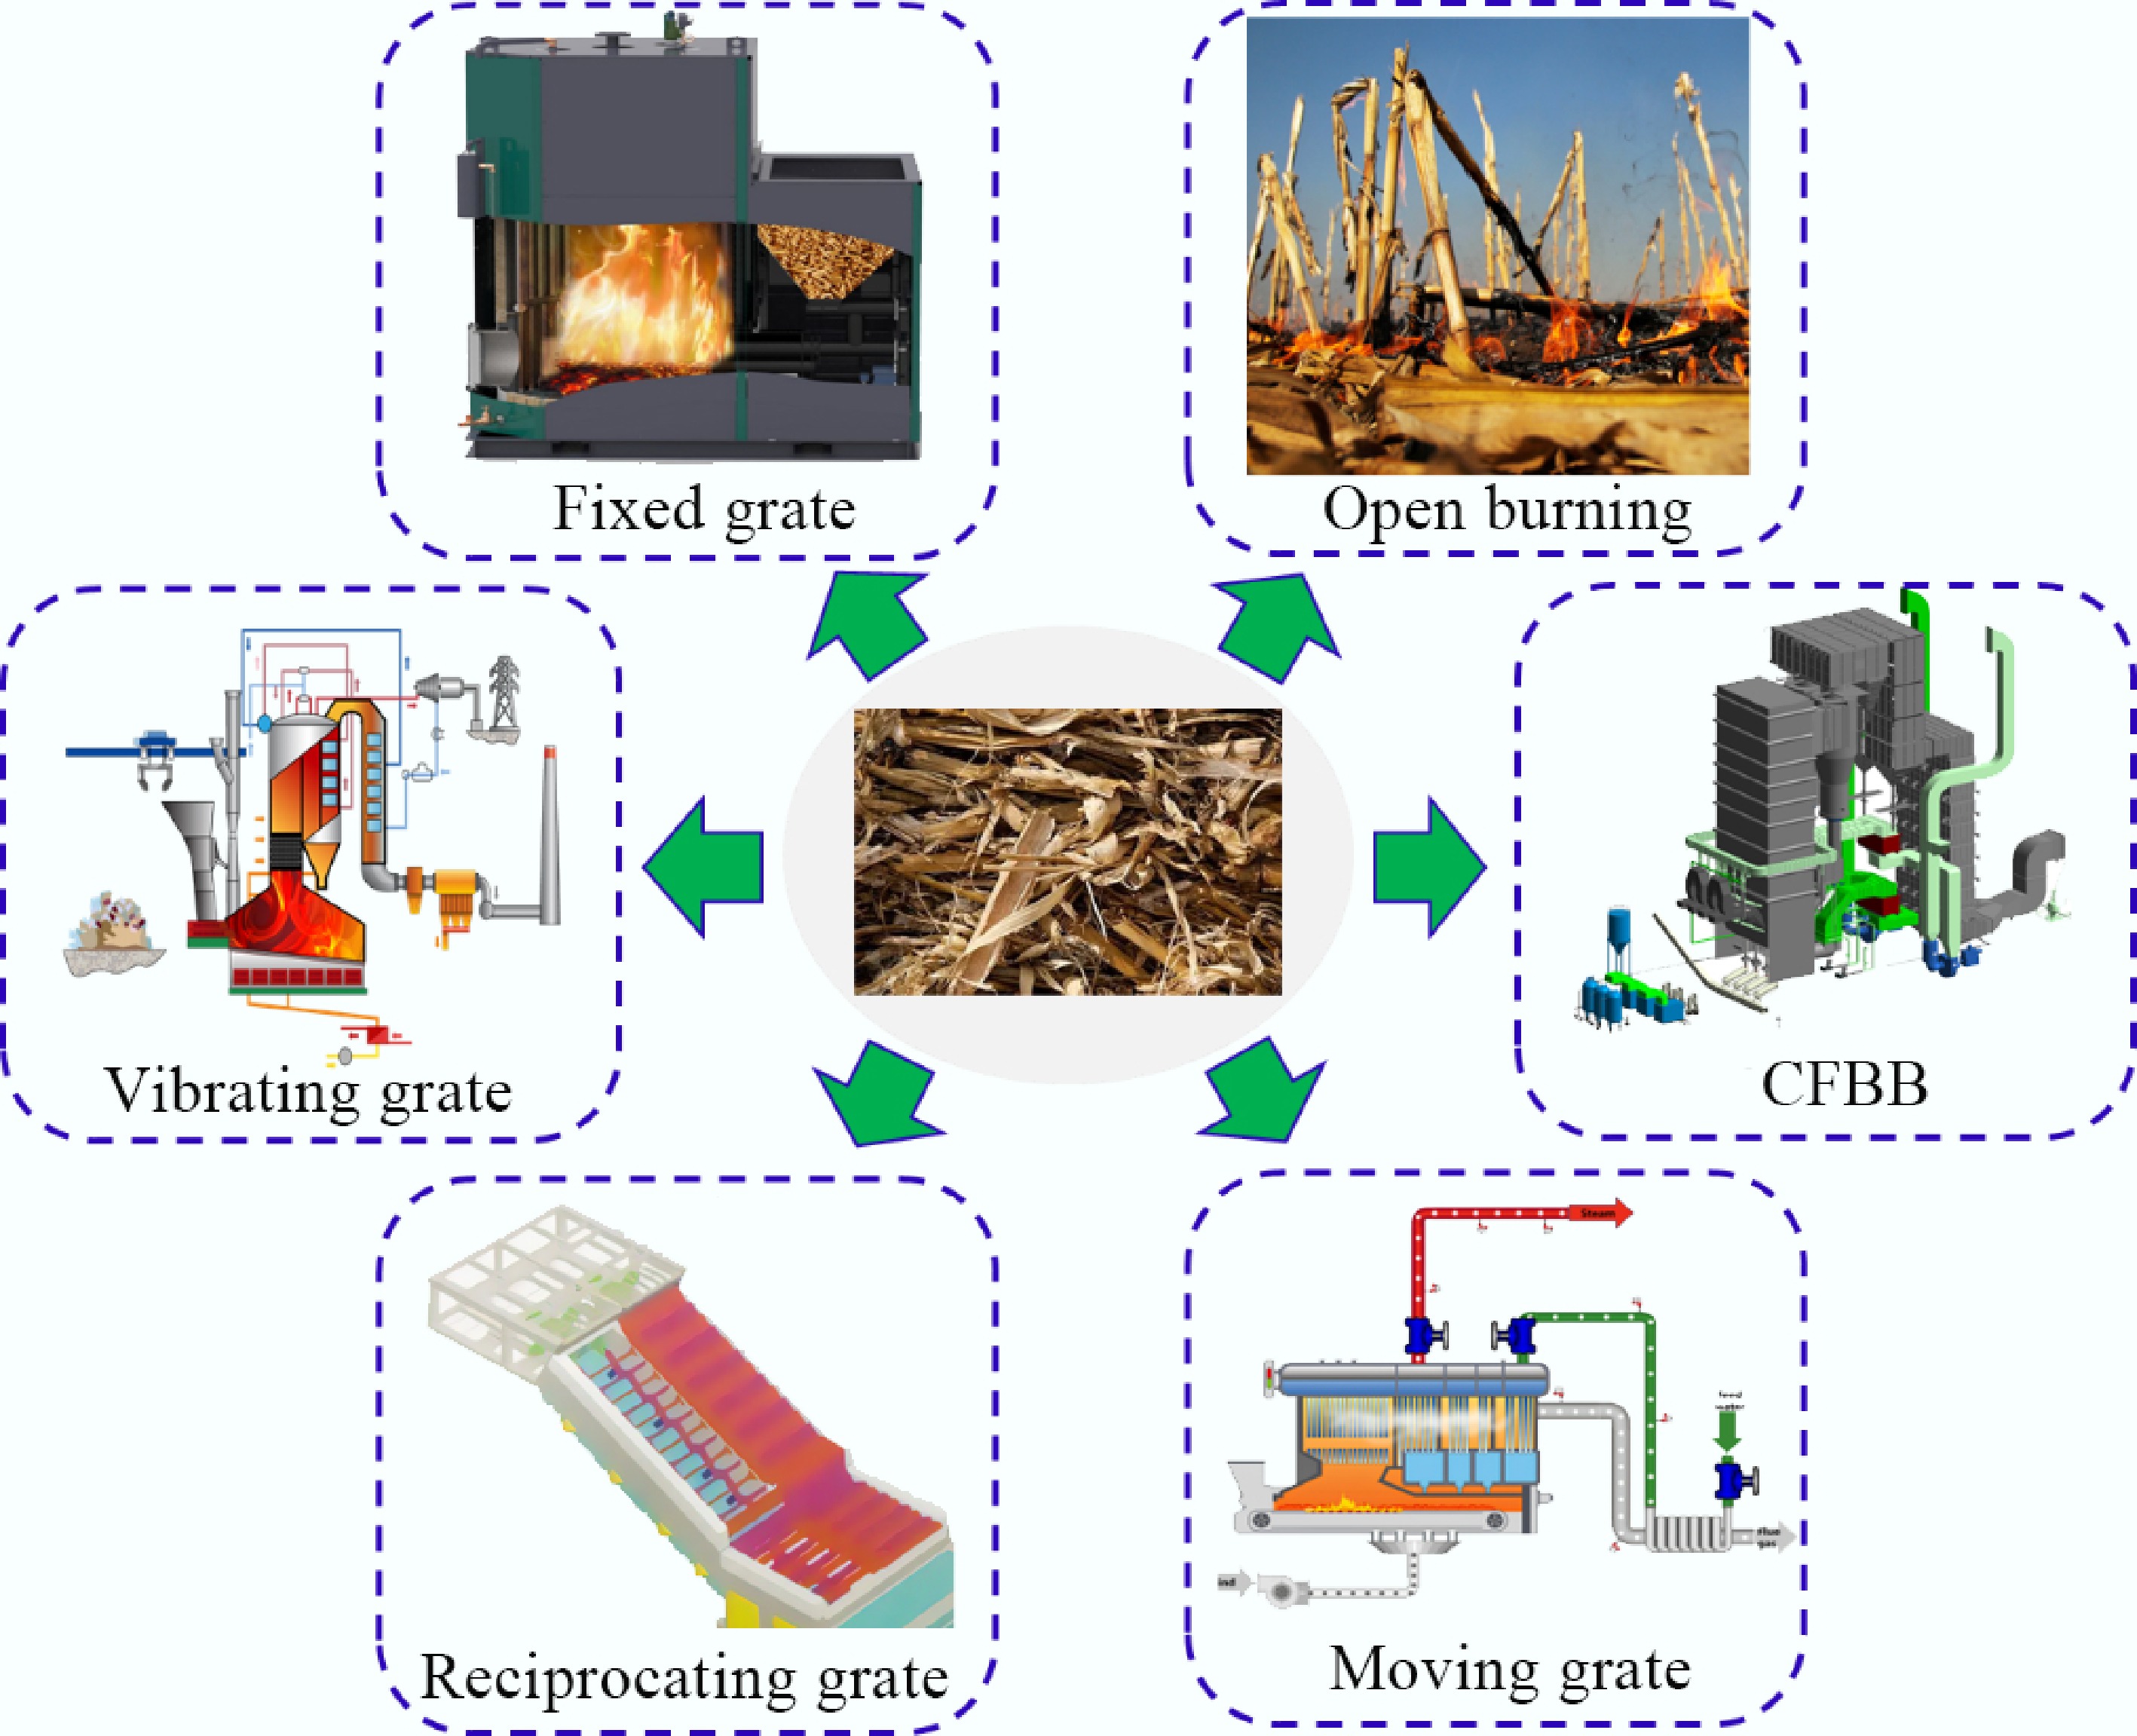
Figure 1.
Biomass combustion methods.
-
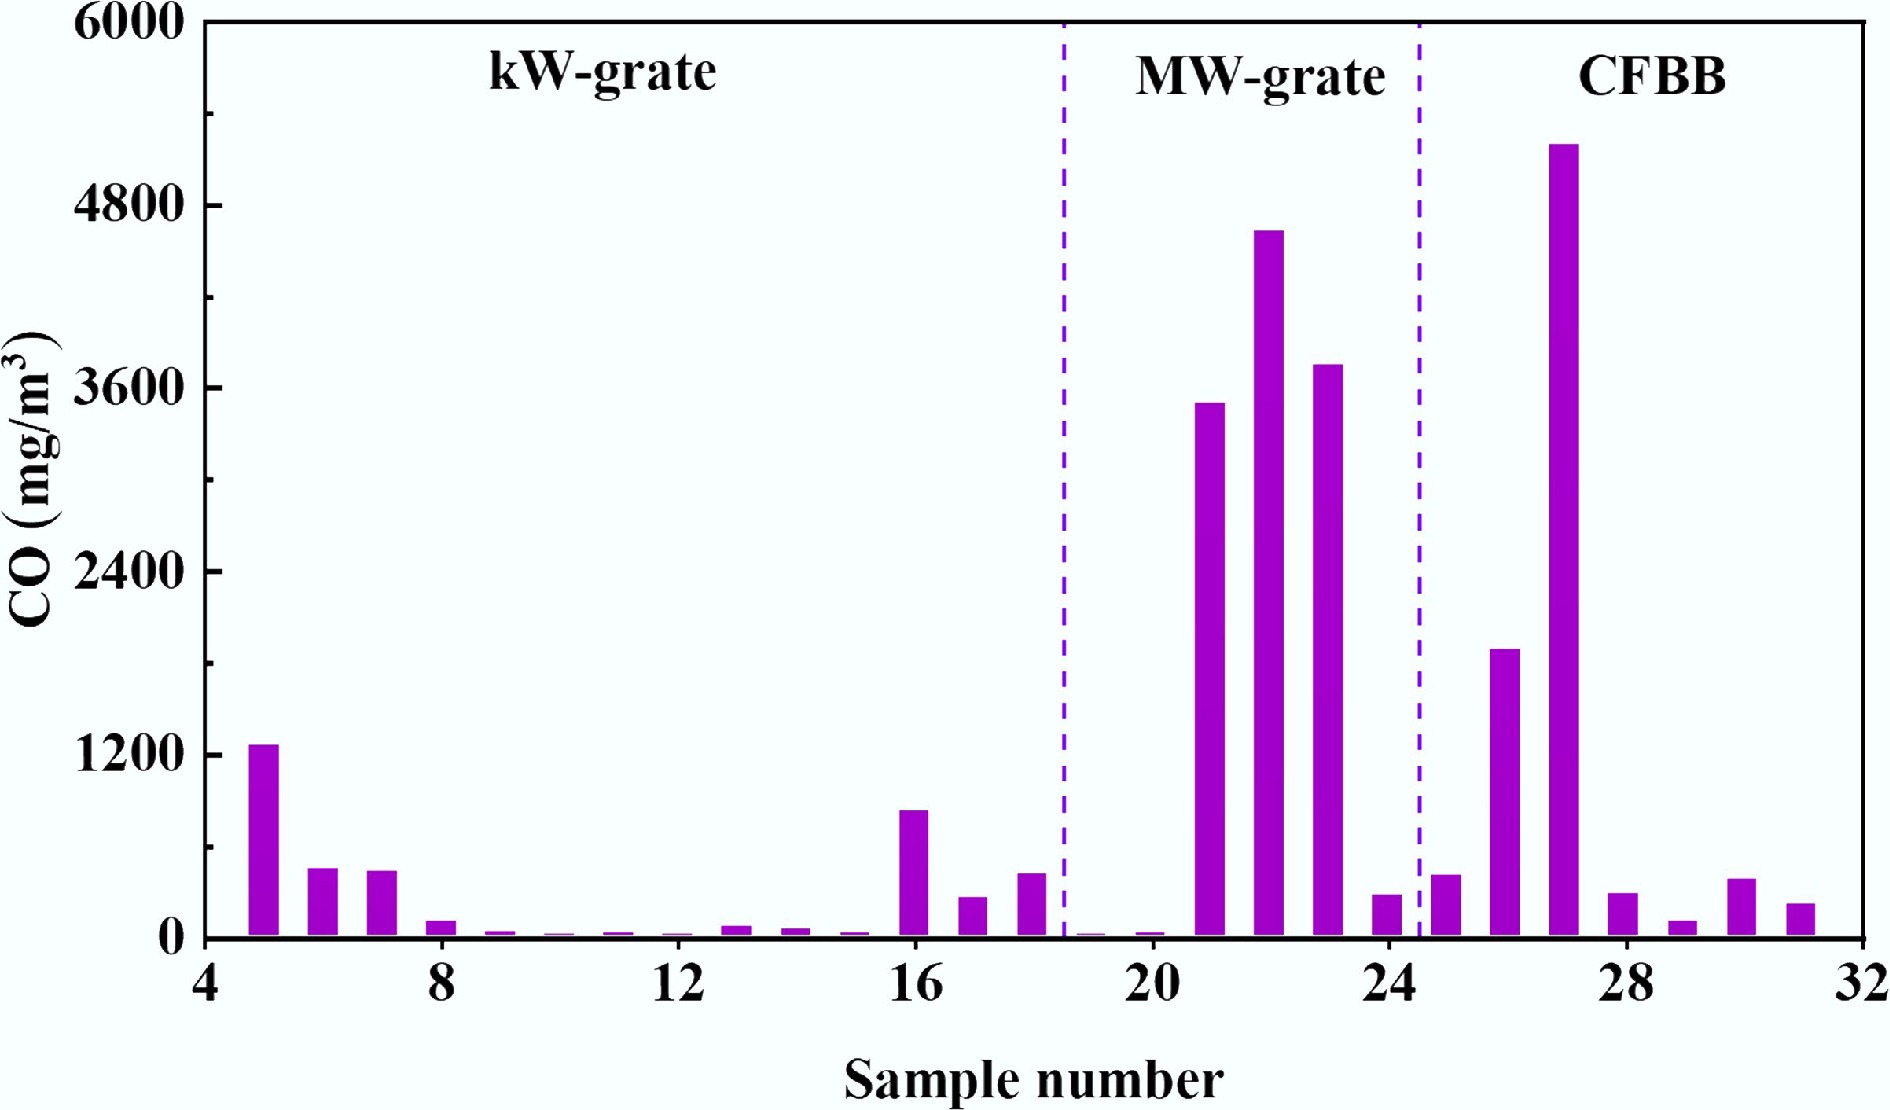
Figure 2.
The mass concentration of CO.
-
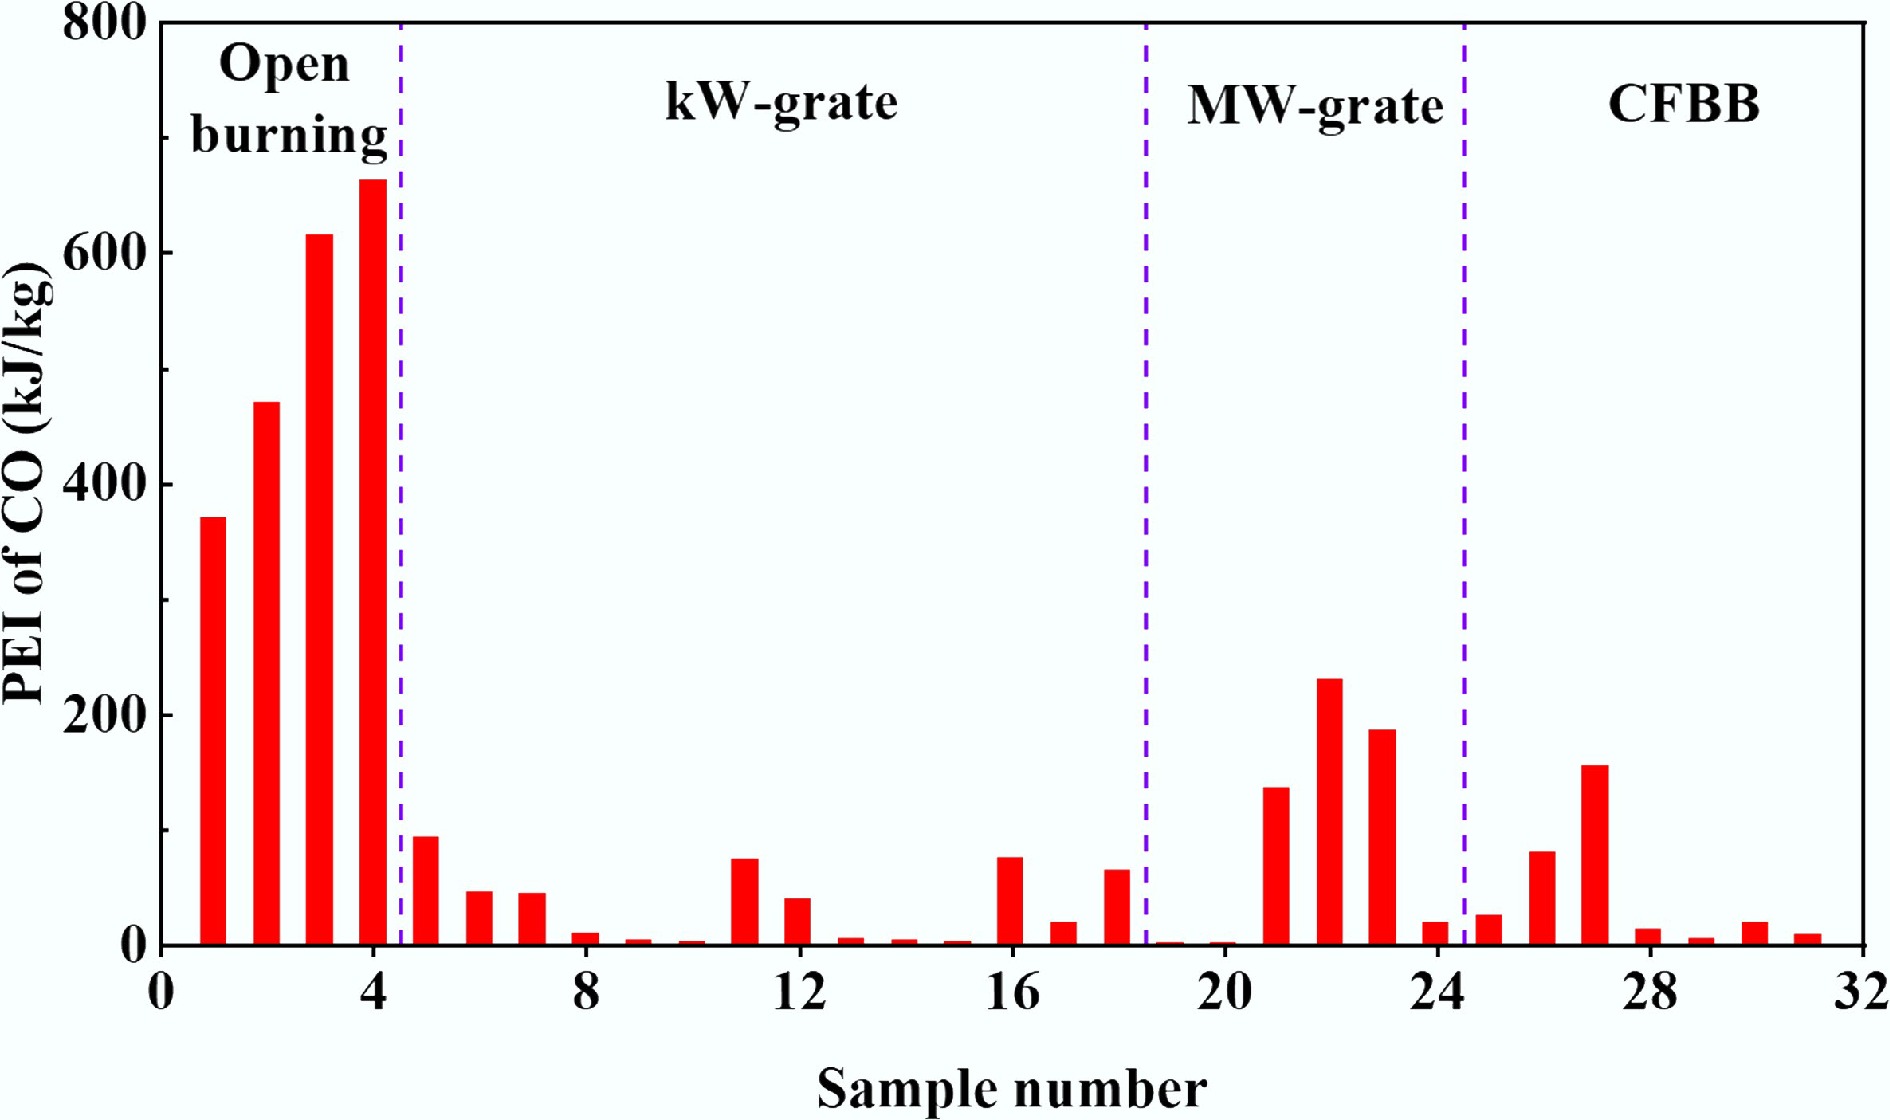
Figure 3.
The PEI of CO.
-
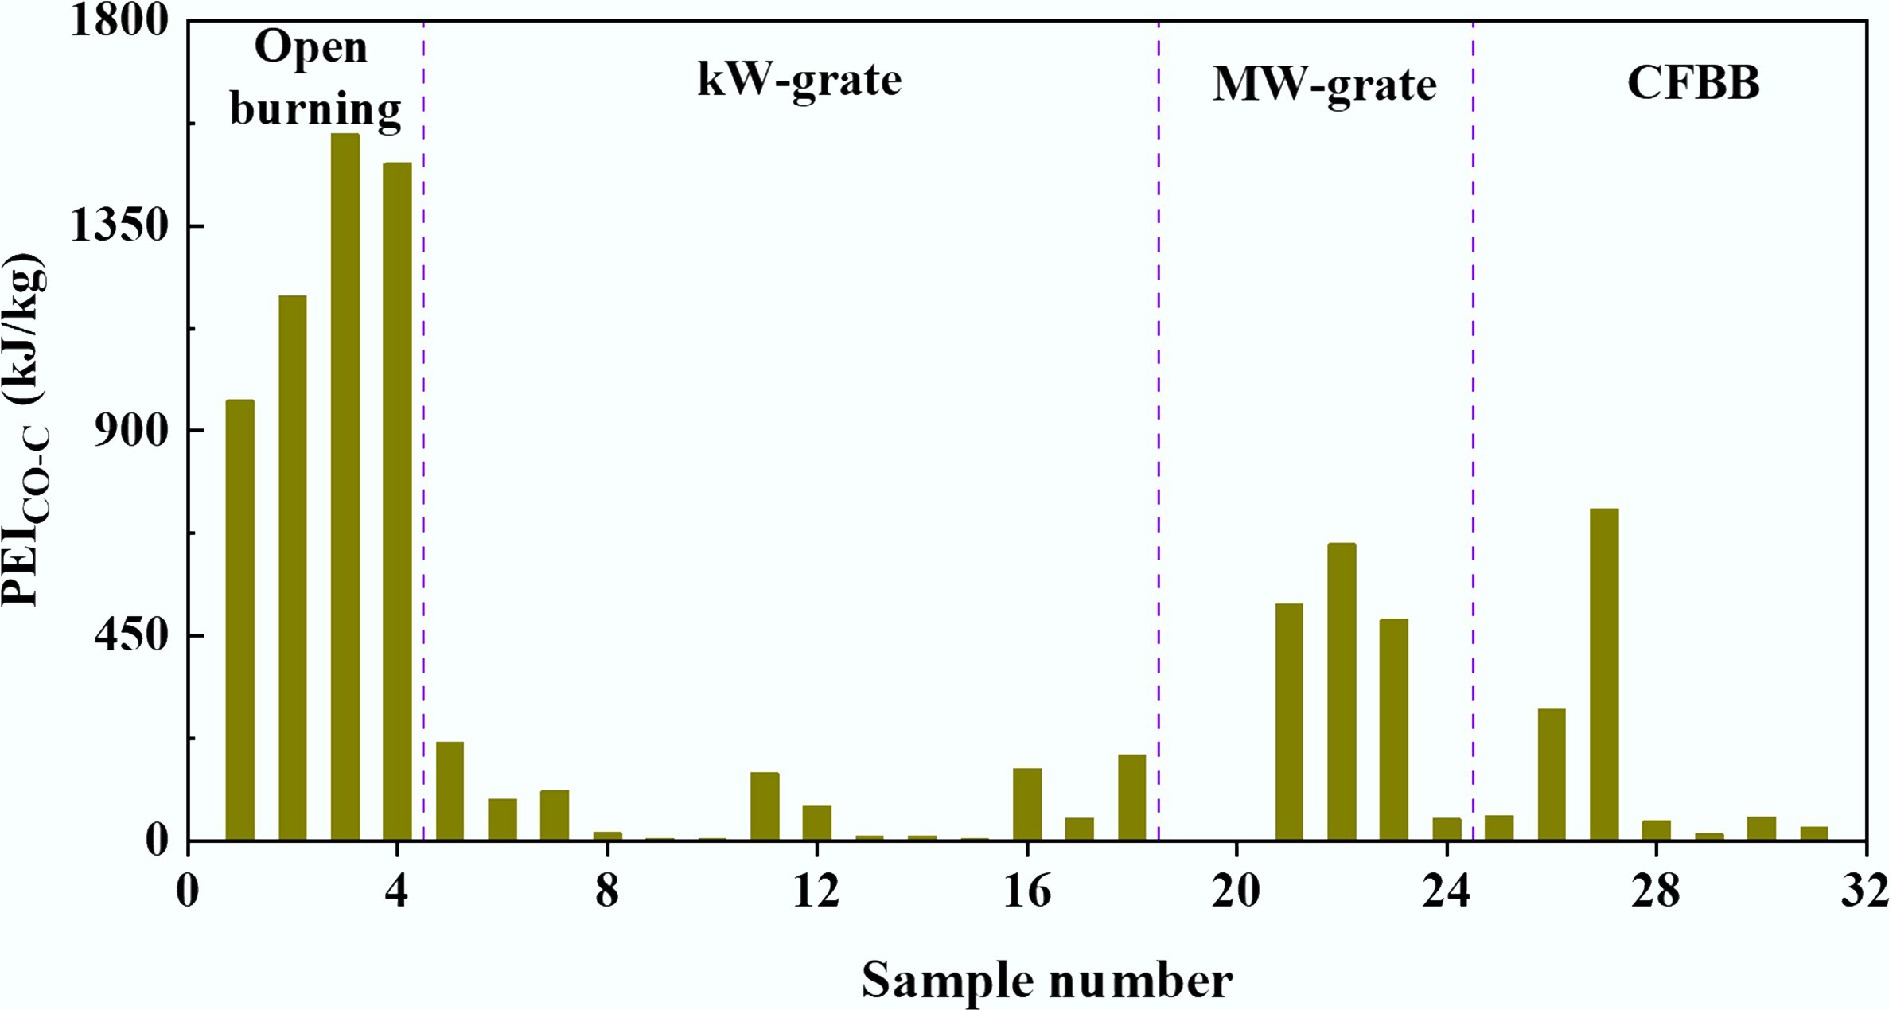
Figure 4.
The PEI of CO produced by per kg of C.
-
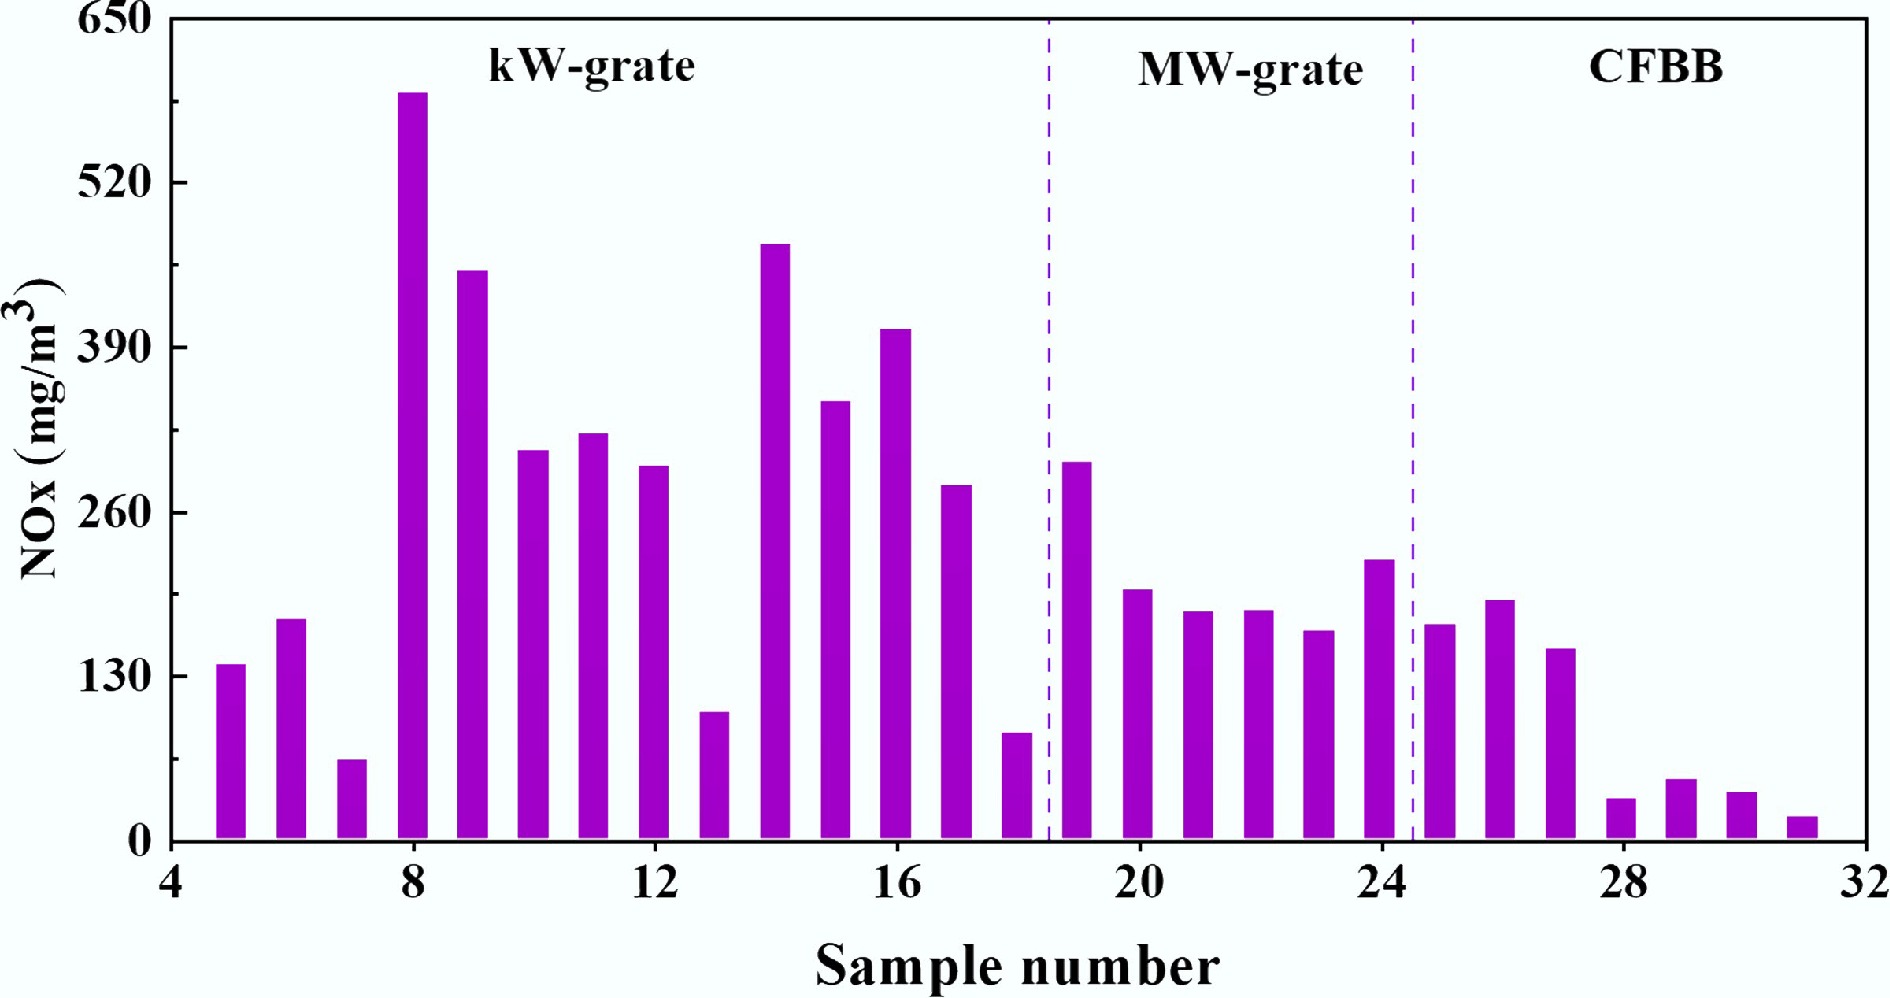
Figure 5.
The mass concentration of NOx.
-
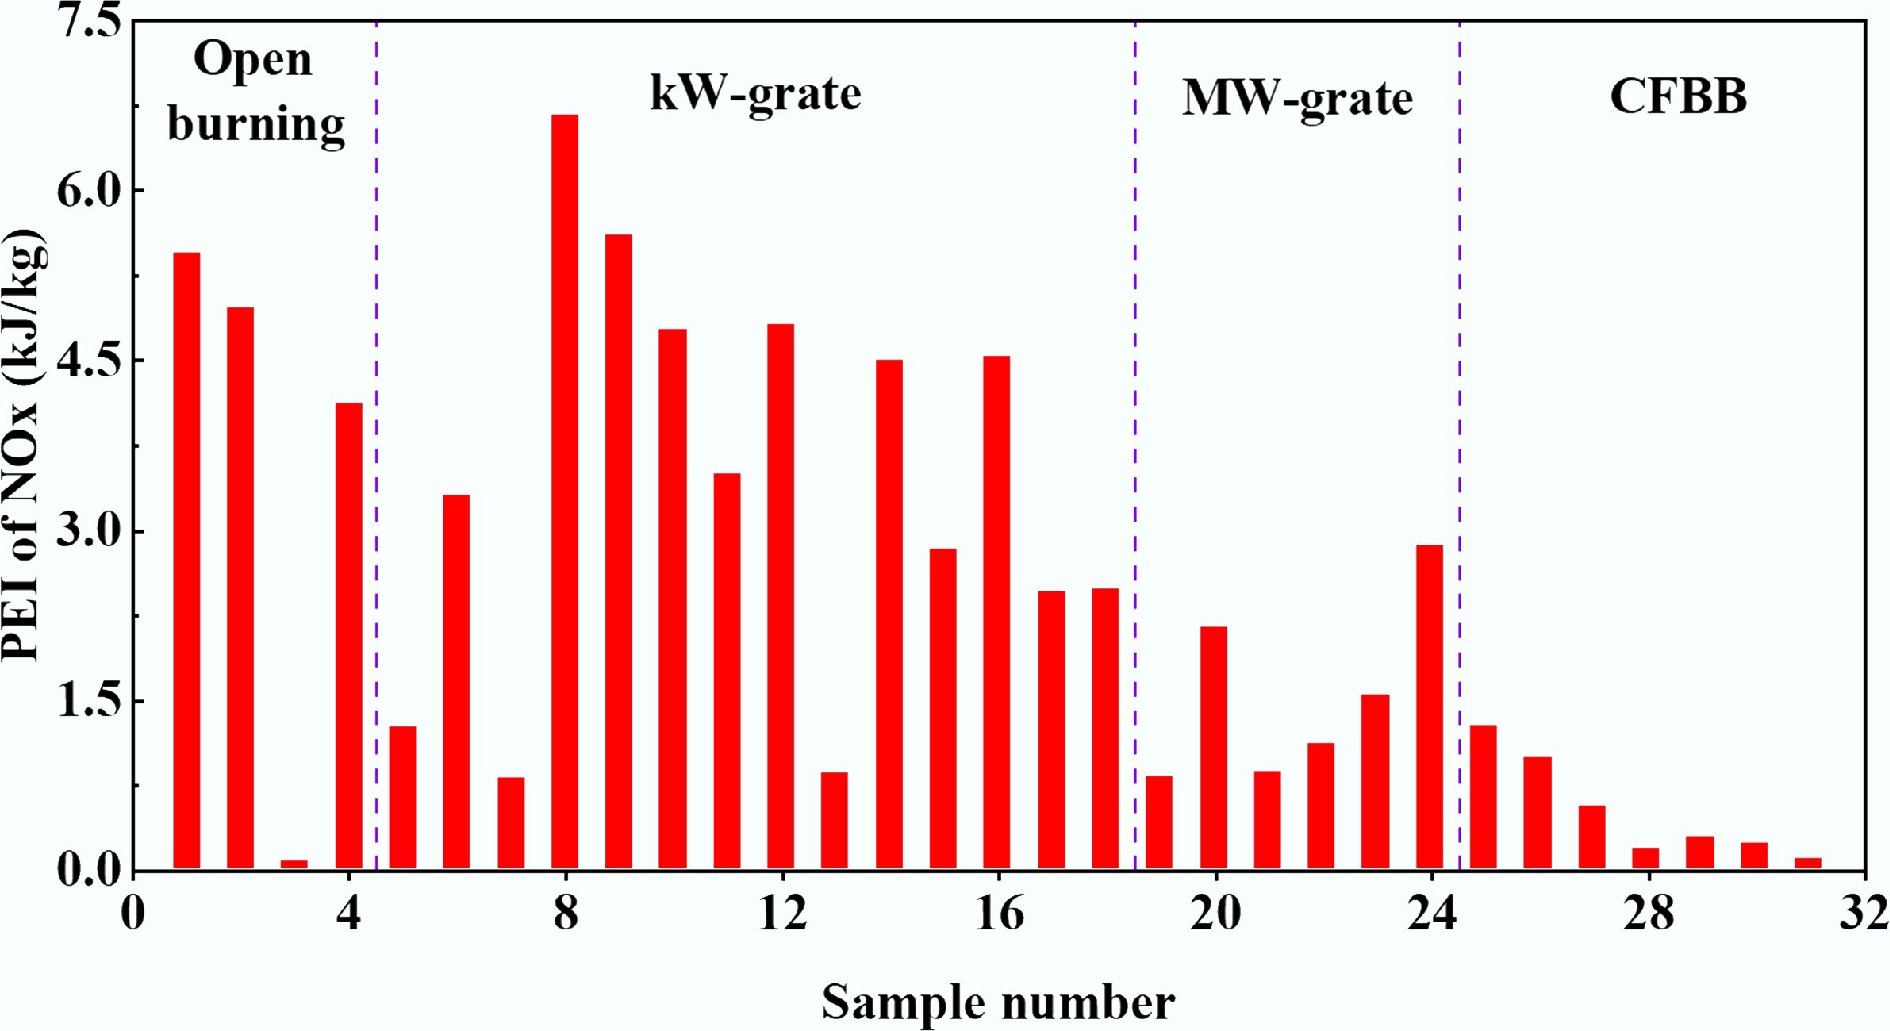
Figure 6.
The PEI of NOx.
-
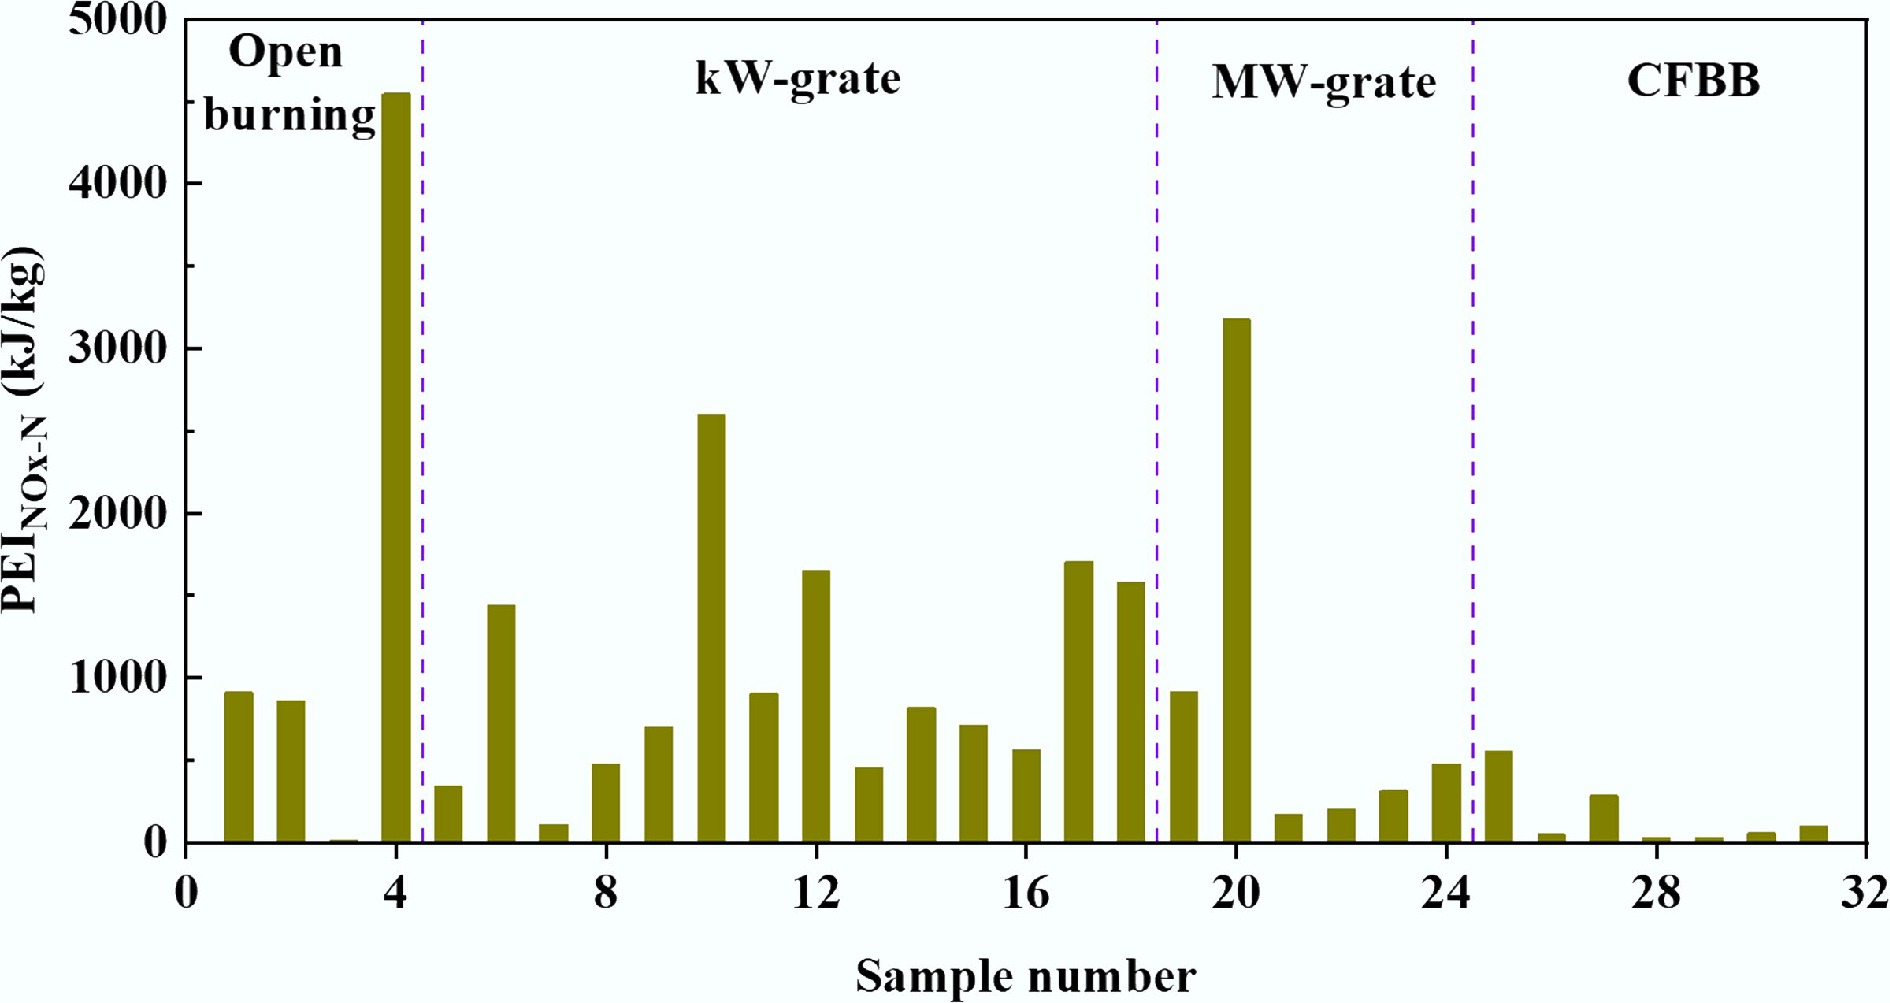
Figure 7.
The PEI of NOx produced by per kg of N.
-
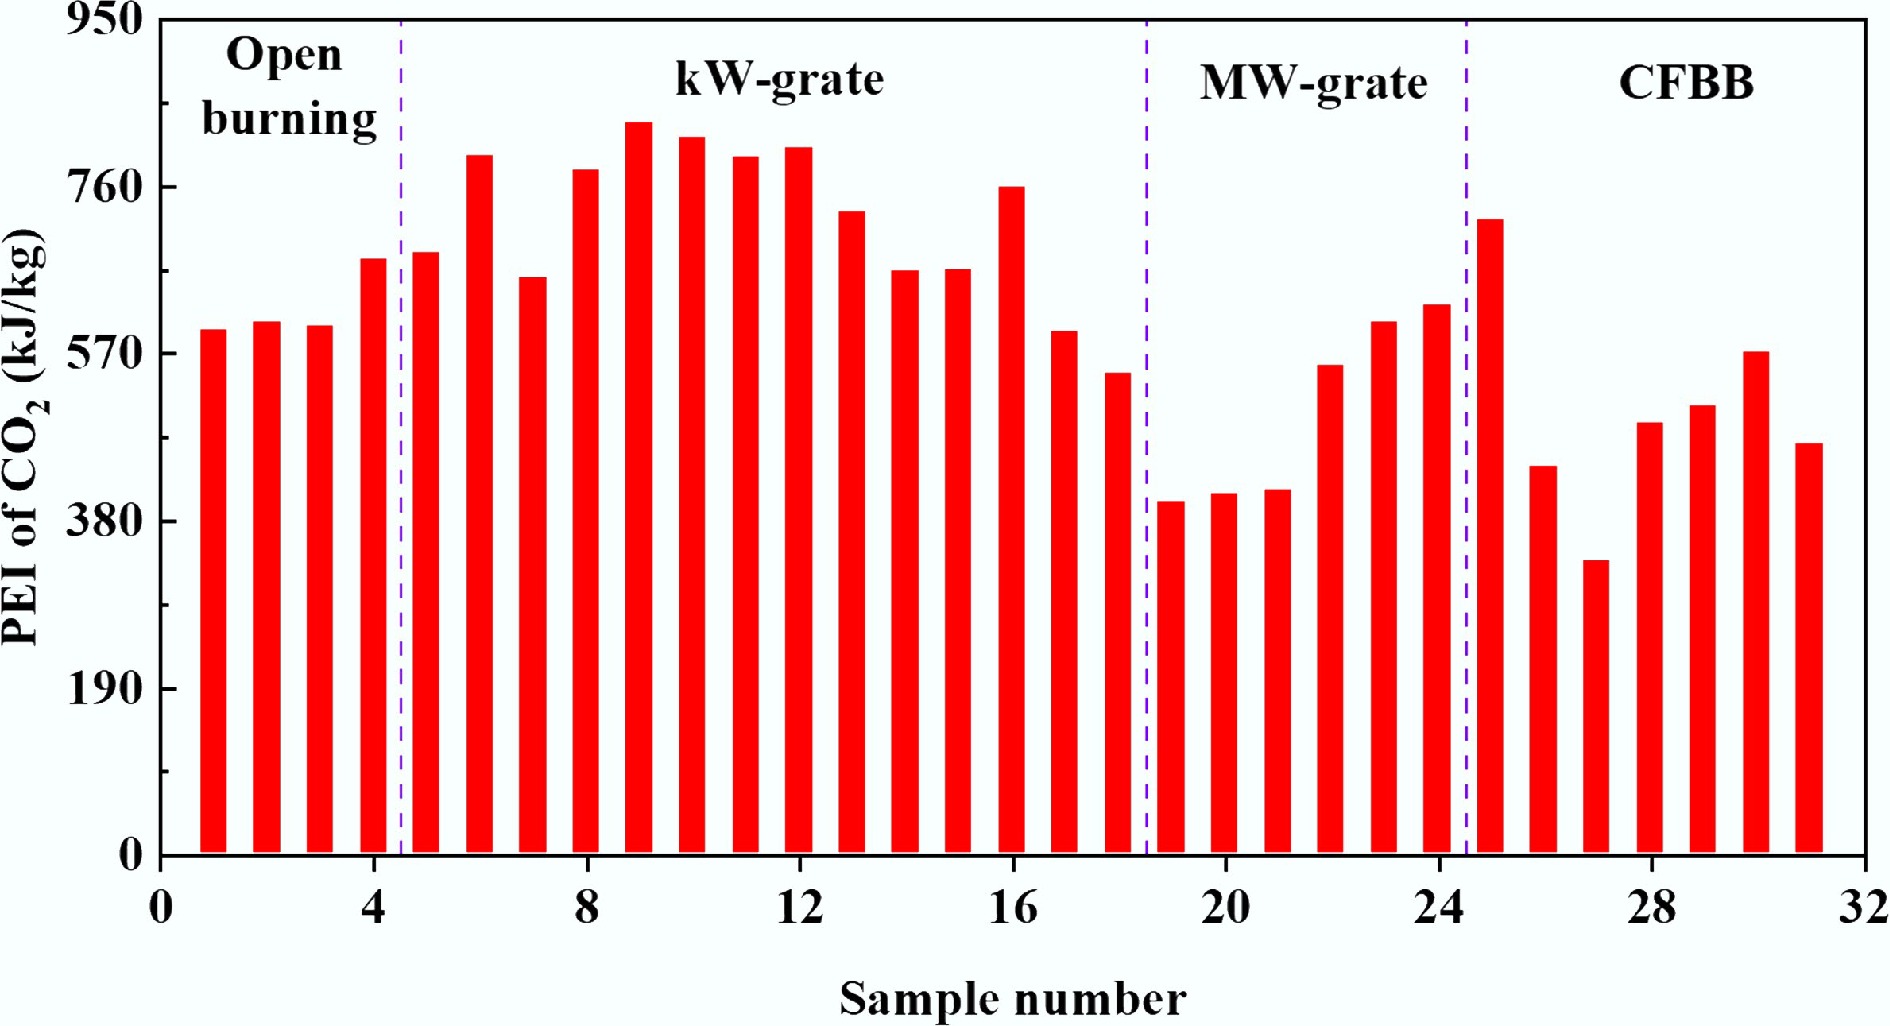
Figure 8.
The PEI of CO2.
-
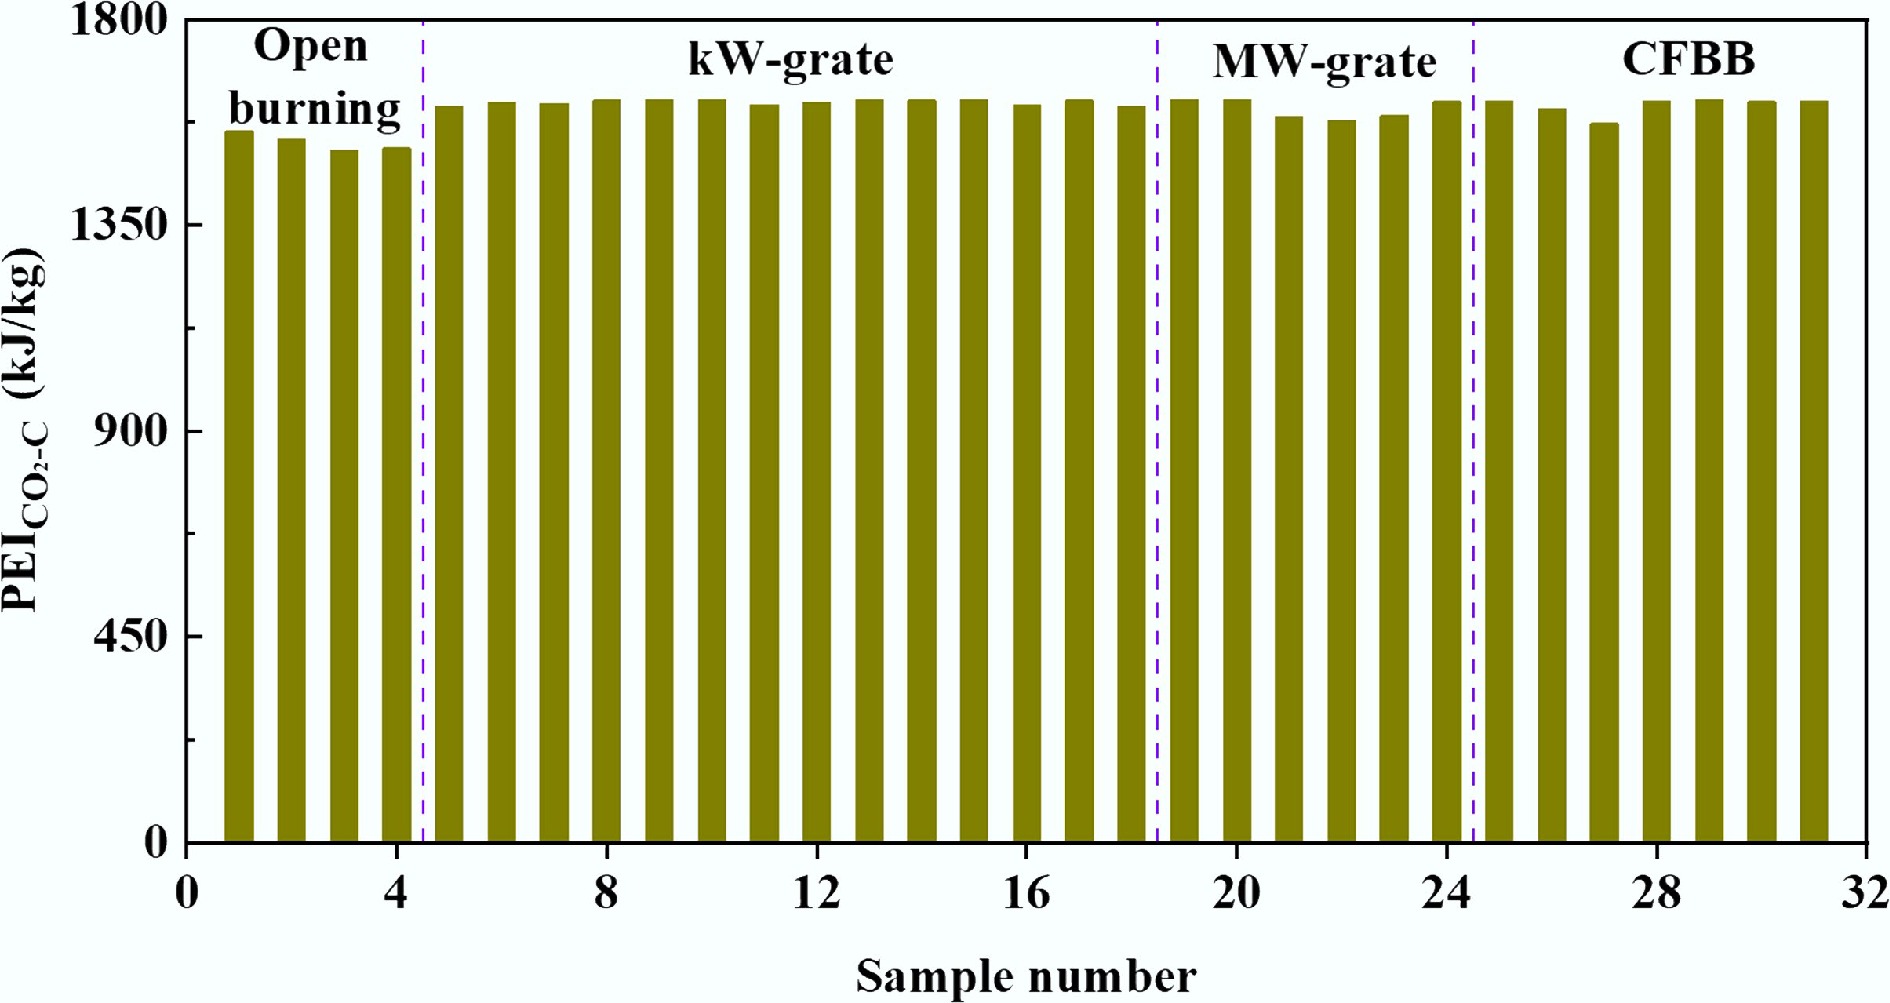
Figure 9.
The PEI of CO2 produced by per kg of C.
-
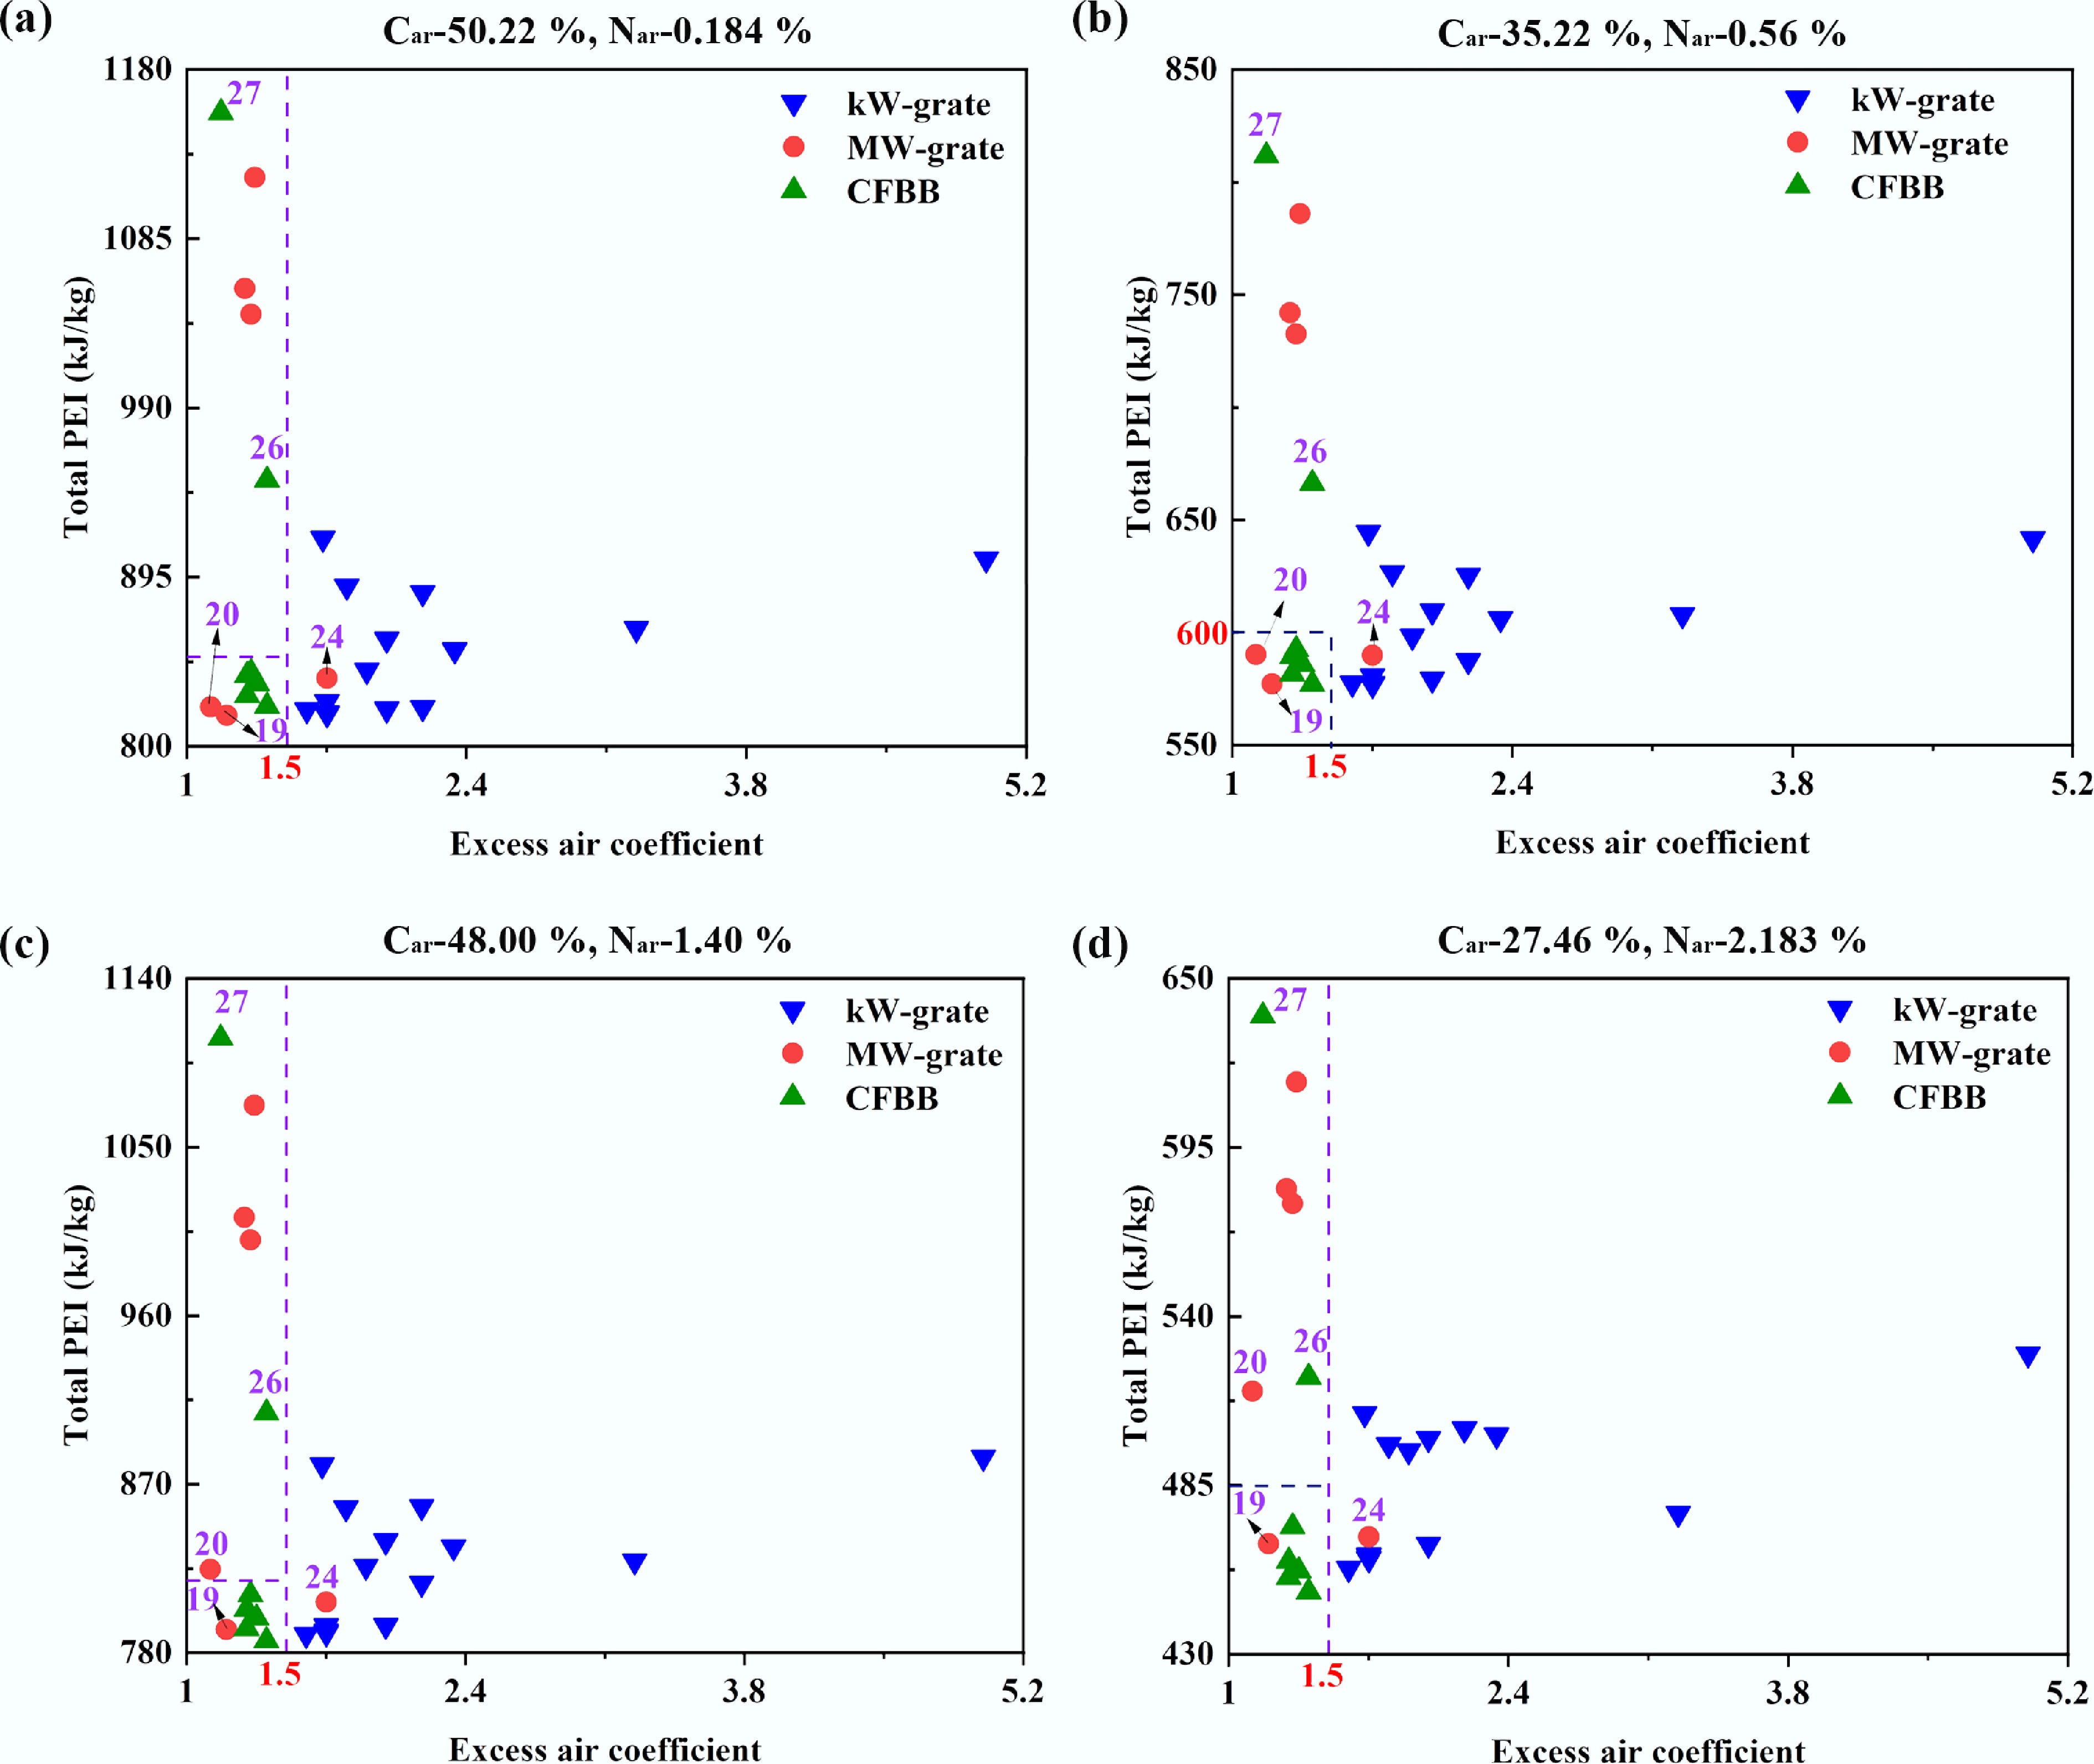
Figure 10.
Total PEI of biomass. (a) Car-50.22% and Nar-0.184%. (b) Car-35.22% and Nar-0.56%. (c) Car-48.00% and Nar-1.40%. (d) Car-27.46% and Nar-2.183%.
-
No. Biomass fuel Car (%) Har (%) Oar (%) Nar (%) Sar (%) Mar (%) Aar (%) LHV (MJ/kg) Ref. 1 Wheat straw 38.34 5.07 34.2 0.6 0.3 10.42 11.07 14.26a [16] 2 Corn straw 39.32 5.20 36.34 0.58 0.59 9.93 8.04 14.54a [16] 3 Rice straw 39.73 4.94 36.15 1.08 0.37 9.79 7.94 14.41a [16] 4 Poplar 44.60 5.13 39.37 0.09 0.42 10.00 0.39 15.91a [16] 5 Corn straw 42.57 3.82 37.86 0.37 0.12 8.00 6.9 14.68 [17] 6 Birch sawdust 49.1 5.95 35.71 0.23 0.01 7.5 1.5 18.50 [18] 7 Corn straw 40.56 3.03 40.65 0.75 0.12 6.49 8.4 15.53 [19] 8 Grass 48 5.8 22 1.4 0.1 14.6 8.1 18.40 [20] 9 Foliage 51.3 6 15.14 0.8 0.06 16.2 10.5 18.90 [20] 10 78% wood and 22% rcgb 50.22 6.356 19.4 0.184 0.078 22.73 1.04 18.60 [21] 11 67% wood and 33% straw 49.18 6.202 22.58 0.387 0.1 18.51 3.042 18.24 [21] 12 78% wood and 22% straw 49.69 6.268 21.64 0.291 0.081 19.8 2.228 18.43 [21] 13 Wood shavings 45.06 4.915 40.5 0.191 0.004 9 0.33 19.30 [22] 14 Wheat straw 40.87 4.621 37.61 0.553 0.254 8.8 7.3 16.70 [22] 15 Miscanthus 40.92 4.429 37.29 0.399 0.062 11 5.9 17.70 [22] 16 Corn stover 47.09 5.4 26.48 0.81 0.12 16 4.1 15.80 [23] 17 Forest chips 36.67 4.32 30.86 0.144 0.007 27 1 12.74 [24] 18 Wood chips 34.01 3.828 30.34 0.157 0.014 29.41 2.24 12.84 [25] 19 Wood chips 24.69 2.78 19.13 0.09 0.01 52.9 0.4 9.92 [26] 20 Woodchips 25.22 2.727 19.28 0.067 0.008 50.5 2.22 21.20 [27] 21 Wheat straw 26.1 2.99 21.04 0.51 0.09 39.49 9.79 8.88 [28] 22 Wheat straw 35.22 4.17 30.51 0.56 0.09 20.81 8.58 11.79 [28] 23 Corn straw 38.06 4.3 35.38 0.493 0.086 8.13 13.55 13.27 [29] 24 Agricultural straw 38.6 5.1 34.1 0.6 0.1 16 5.5 14.58 [30] 25 Cotton stalk 44.58 5.46 39.43 0.23 0.14 8.41 1.75 17.30 [31] 26 Chicken manure and husk 27.46 3.42 23.72 2.183 0.421 25.4 17.39 10.41 [32] 27 Eucalyptus bark 21.19 3.026 25.97 0.196 0.185 42.65 6.79 7.65 [33] 28 Corn stalk 30.22 4.29 28.75 0.64 0.05 28.69 7.36 10.69 [34] 29 Corn stalk 31.39 3.76 26.32 1.11 0.05 34.15 3.22 10.80 [34] 30 Corn stalk 35.27 3.69 22.69 0.42 0.43 21.3 16.5 12.40 [34] 31 Rice husk and wood chip 28.78 2.68 25.92 0.09 0.01 39.6 2.92 9.73 [34] a The value obtained by the Mendeleev Formula. b rcg means reed canary grass. Table 1.
Ultimate analysis and proximate analysis of biomass fuels
-
No. Combustion
methodOutput
powerExcess air
coefficientRef. 1 Open burning (tiling) Unknown Unknown [16] 2 Open burning (stacking) Unknown Unknown [16] 3 Open burning (stacking) Unknown Unknown [16] 4 Open burning (tiling) Unknown Unknown [16] 5 Fixed grate 8 kW 1.68 [17] 6 Fixed grate 10 kW 2 [18] 7 Rocking grate 12 kW 3.25 [19] 8 Moving grate 25 kW 1.7 [20] 9 Moving grate 25 kW 1.7 [20] 10 Moving step grate 40 kW 2.18 [21] 11 Moving step grate 40 kW 2.18 [21] 12 Moving step grate 40 kW 2.34 [21] 13 Fixed grate 36.4 kW 1.6 [22] 14 Fixed grate 30.1 kW 2 [22] 15 Fixed grate 30.8 kW 1.7 [22] 16 Moving step grate 51 kW 1.8 [23] 17 Moving grate 200 kW 1.9 [24] 18 Moving grate 320 kW 5 [25] 19 Inclined reciprocating grate 4 MW 1.2 [26] 20 Inclined reciprocating grate 12 MW 1.12 [27] 21 Vibrating grate 12 MW 1.29 [28] 22 Vibrating grate 30 MW 1.34 [28] 23 Vibrating grates 30 MW 1.32 [29] 24 Vibrating-grate 38 MW 1.7 [30] 25 CFBB 0.5 MW 1.32 [31] 26 CFBB 1 MW 1.4 [32] 27 CFBB 50 MW 1.17 [33] 28 CFBB 30 MW 1.35 [34] 29 CFBB 40 MW 1.4 [34] 30 CFBB 80 MW 1.3 [34] 31 CFBB 125 MW 1.3 [34] Table 2.
Methods, output powers, and excess air coefficients for combustion
-
Gaseous pollutant Standard chemical exergy (kJ/mol) CO 274.71 CO2 19.48 NO 88.90 Table 3.
Standard chemical exergy values of gaseous pollutants
-
Biomass fuel The total PEI (kJ/kg) No. 1 No. 2 No. 3 No. 4 Car-50.22%, Nar-0.184% 1,267.55 1,374.11 1,538.41 1,516.93 Car-35.22%, Nar-0.56% 892.86 967.37 1,078.94 1,083.43 Car-48.00%, Nar-1.40% 1,222.62 1,323.84 1,470.48 1,505.49 Car-27.46%, Nar-2.183% 711.97 769.17 841.32 924.06 Table 4.
The total PEI for open burning
Figures
(10)
Tables
(4)