


-
The consumption of fossil fuels has caused serious environmental problems, such as excessive CO2 emissions, which are considered the primary cause of global warming[1] and have attracted worldwide attention. Reducing fossil fuel consumption is seen as an inevitable choice to mitigate global warming. Generally, biomass has a significant impact on reducing CO2 emissions[2].
Biomass energy has the outstanding advantage of being highly renewable and is considered an effective alternative to fossil fuels[3]. Currently, the main thermochemical conversion methods for biomass include combustion, gasification, and pyrolysis, which can produce bio-oil, syngas, and biochar[4]. Among them, combustion is the most important method of biomass thermochemical utilization due to its high technological maturity and the large scale of resource utilization[5]. Biomass combustion provides tremendous energy and can be used to generate electricity and heat, but it releases gaseous pollutants, such as CO, NOx, SO2, and CO2, causing serious environmental impacts[6−9].
The environmental impacts of gaseous pollutants from biomass have been widely assessed. Shafie et al.[10] compared the environmental impact of rice straw-based power generation with that of coal and natural gas based on the life cycle assessment method, and the results showed that rice straw power generation can save greenhouse gas emissions of about 1.79 kg CO2-eq/kWh compared to coal. Freer-Smith et al.[11] systematically assessed the impacts of biomass use on climate and air quality in California, and the study pointed out that open burning of agricultural waste will adversely affect greenhouse gas and pollutant emissions. Sanchez-García et al.[12] carried out an analysis of the greenhouse gas emissions from a wood-fired power plant in Spain. Generally, the existing literature has focused on greenhouse gas emissions and their impact on climate and air quality when studying the environmental impacts of biomass, using mainly the life cycle assessment method.
Exergy is recognized as a measure of energy quantity and quality, and has been proven to be effective in evaluating the potential impact of matter on the environment. Ji et al.[13] conducted an assessment of the emissions produced by Chinese transportation, and the chemical exergy was introduced to unify the assessment of the main waste gas emissions of CO, NOx, and SO2 from fossil fuel consumption. Zhang et al.[14] used the chemical exergy sum of the potential (theoretical) emission gases (CO2, NO2, SO2) and ash components (mineral oxides) to represent the PEI of woody biomass.
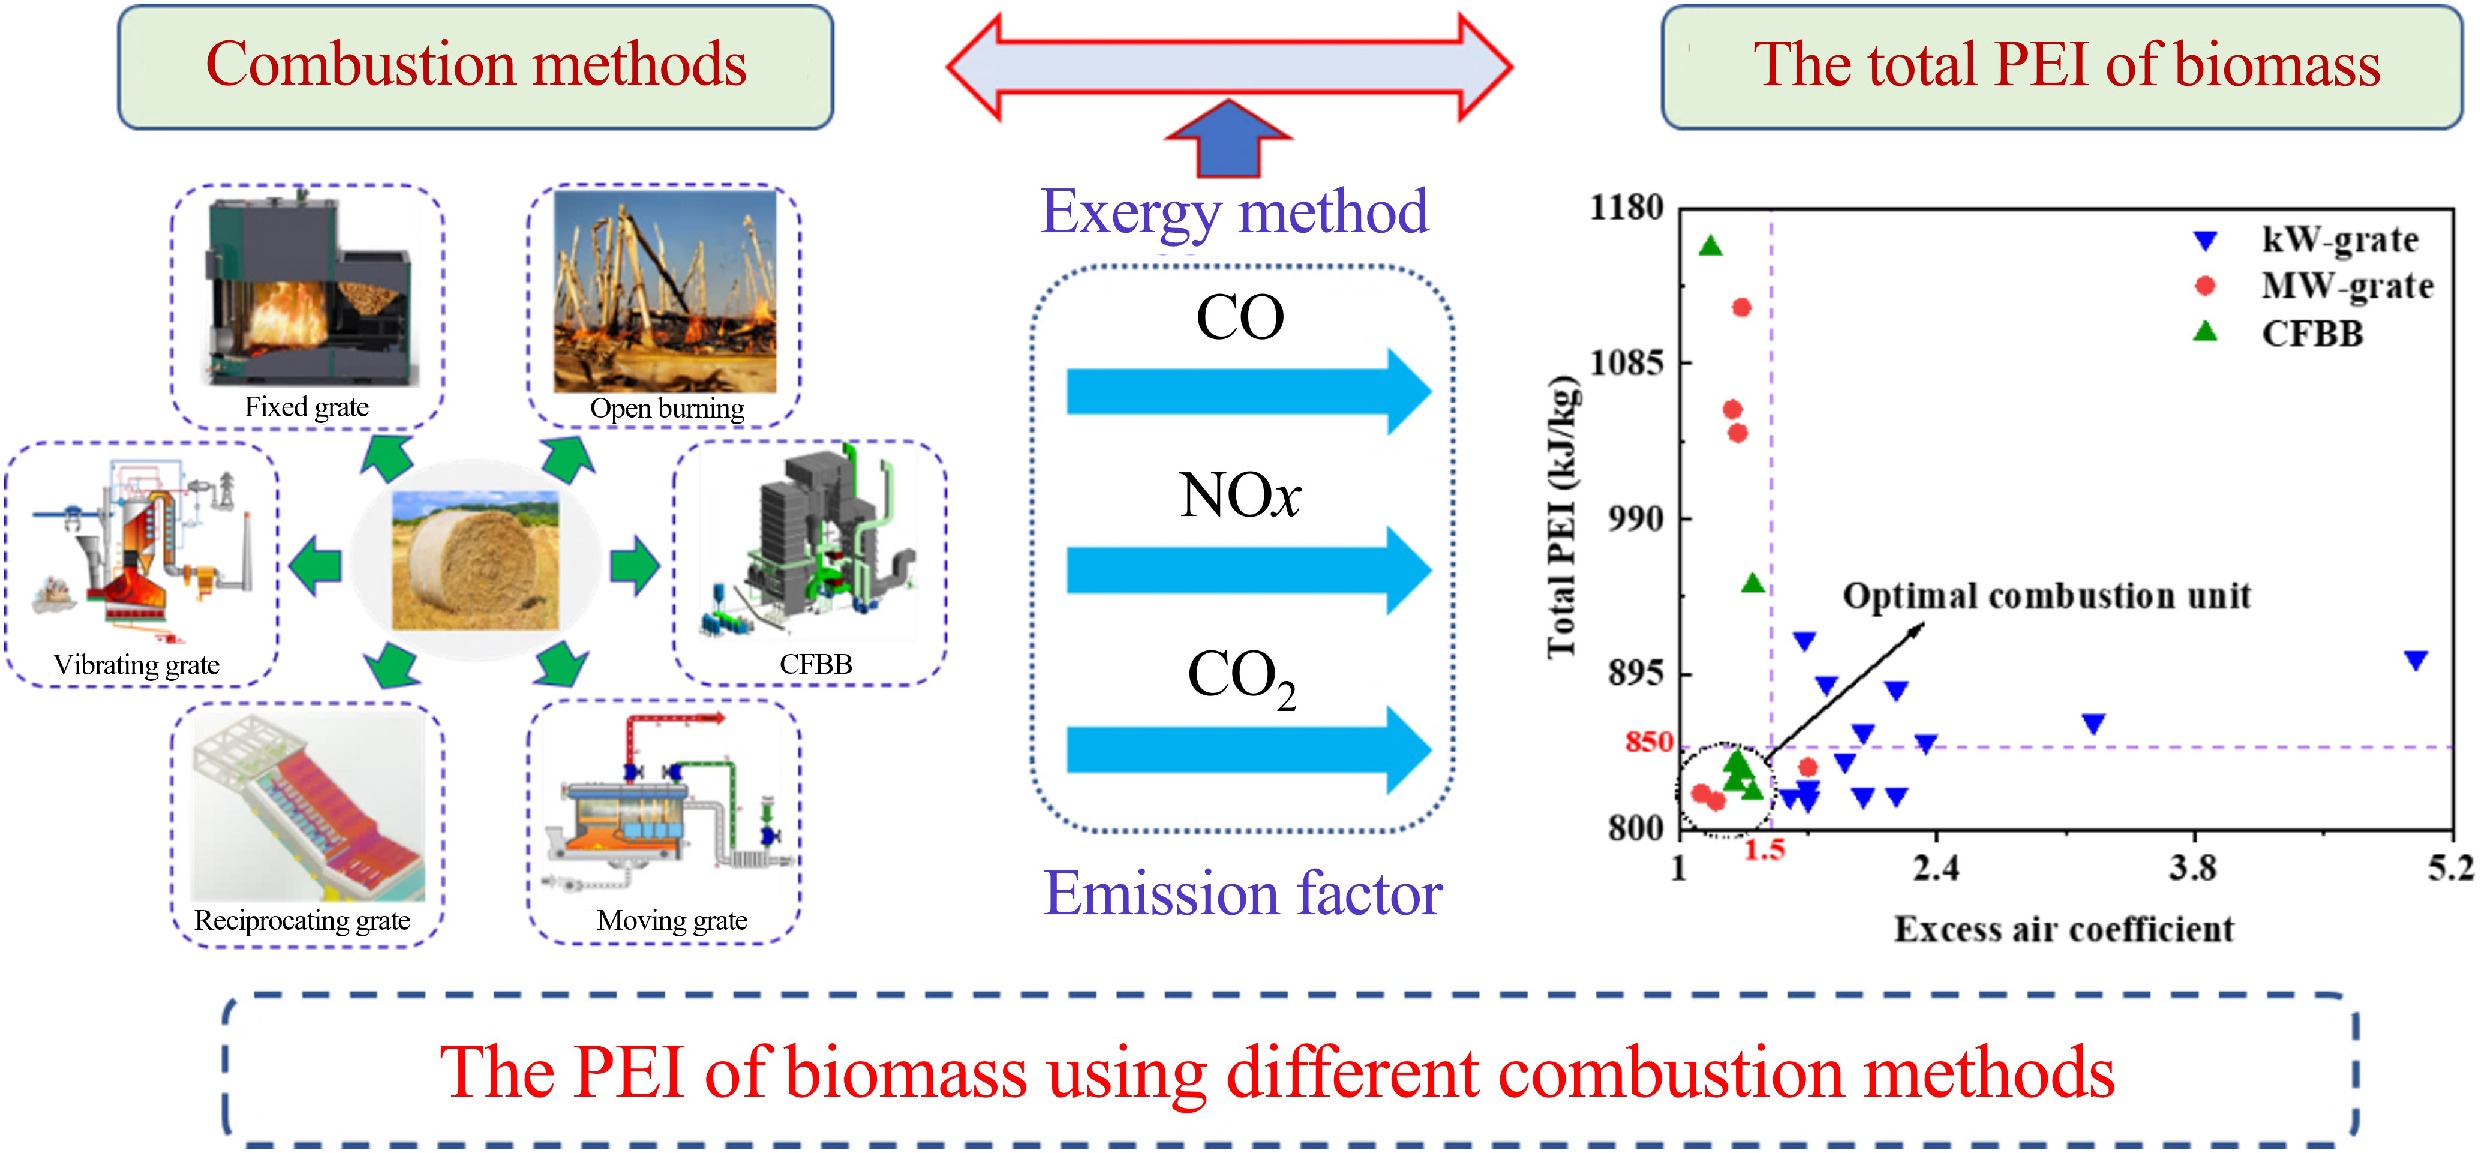
Figure 1 schematically represents the biomass combustion methods evaluated in this study, which include the mainstream industrial technologies—grate firing and circulating fluidized bed boilers (CFBB), as well as the prevalent but uncontrolled practice of open burning. The grates for biomass burning mainly include fixed grates, moving grates, vibrating grates, and reciprocating grates. Among them, the output power of the boiler is mostly in the kW class when using a fixed grate and moving grate, and the output power of the boiler is mostly in the MW class when using a vibrating grate and reciprocating grate. Based on the significant differences in combustion conditions, particularly across scales of output power, this study categorizes biomass combustion into four types: open burning, kW-grate, MW-grate, and CFBB.
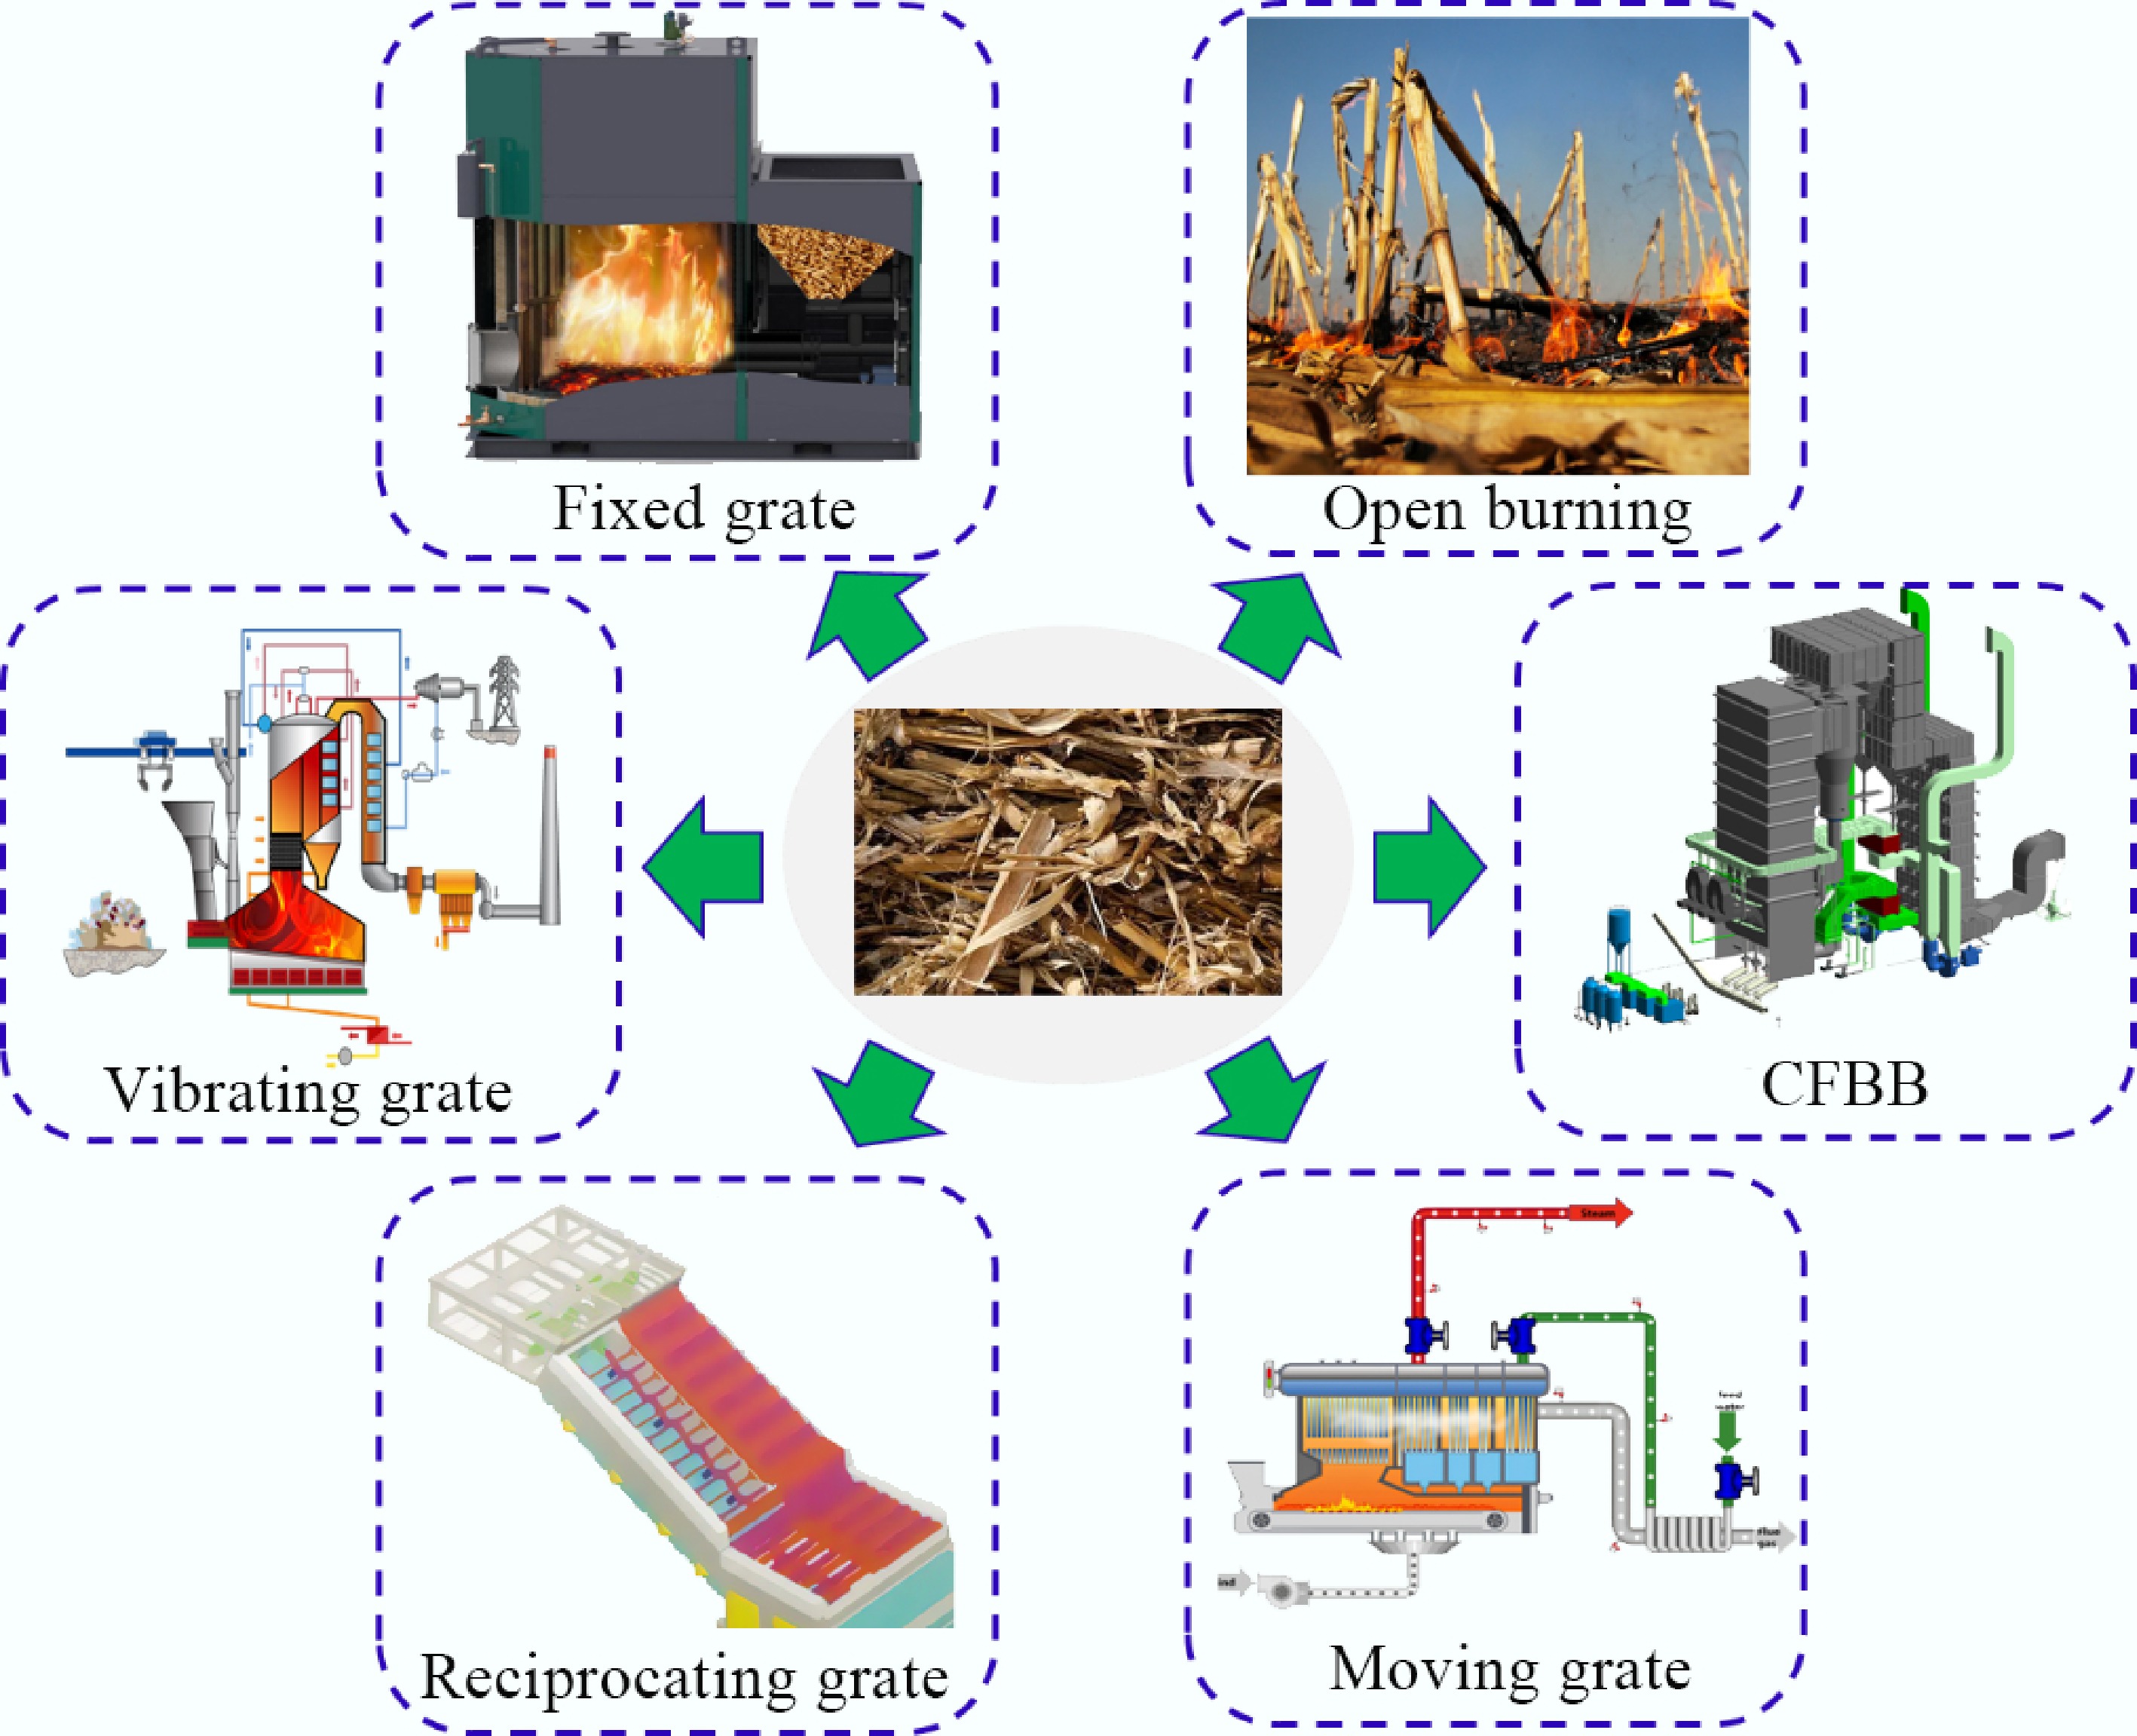
Figure 1.
Biomass combustion methods.
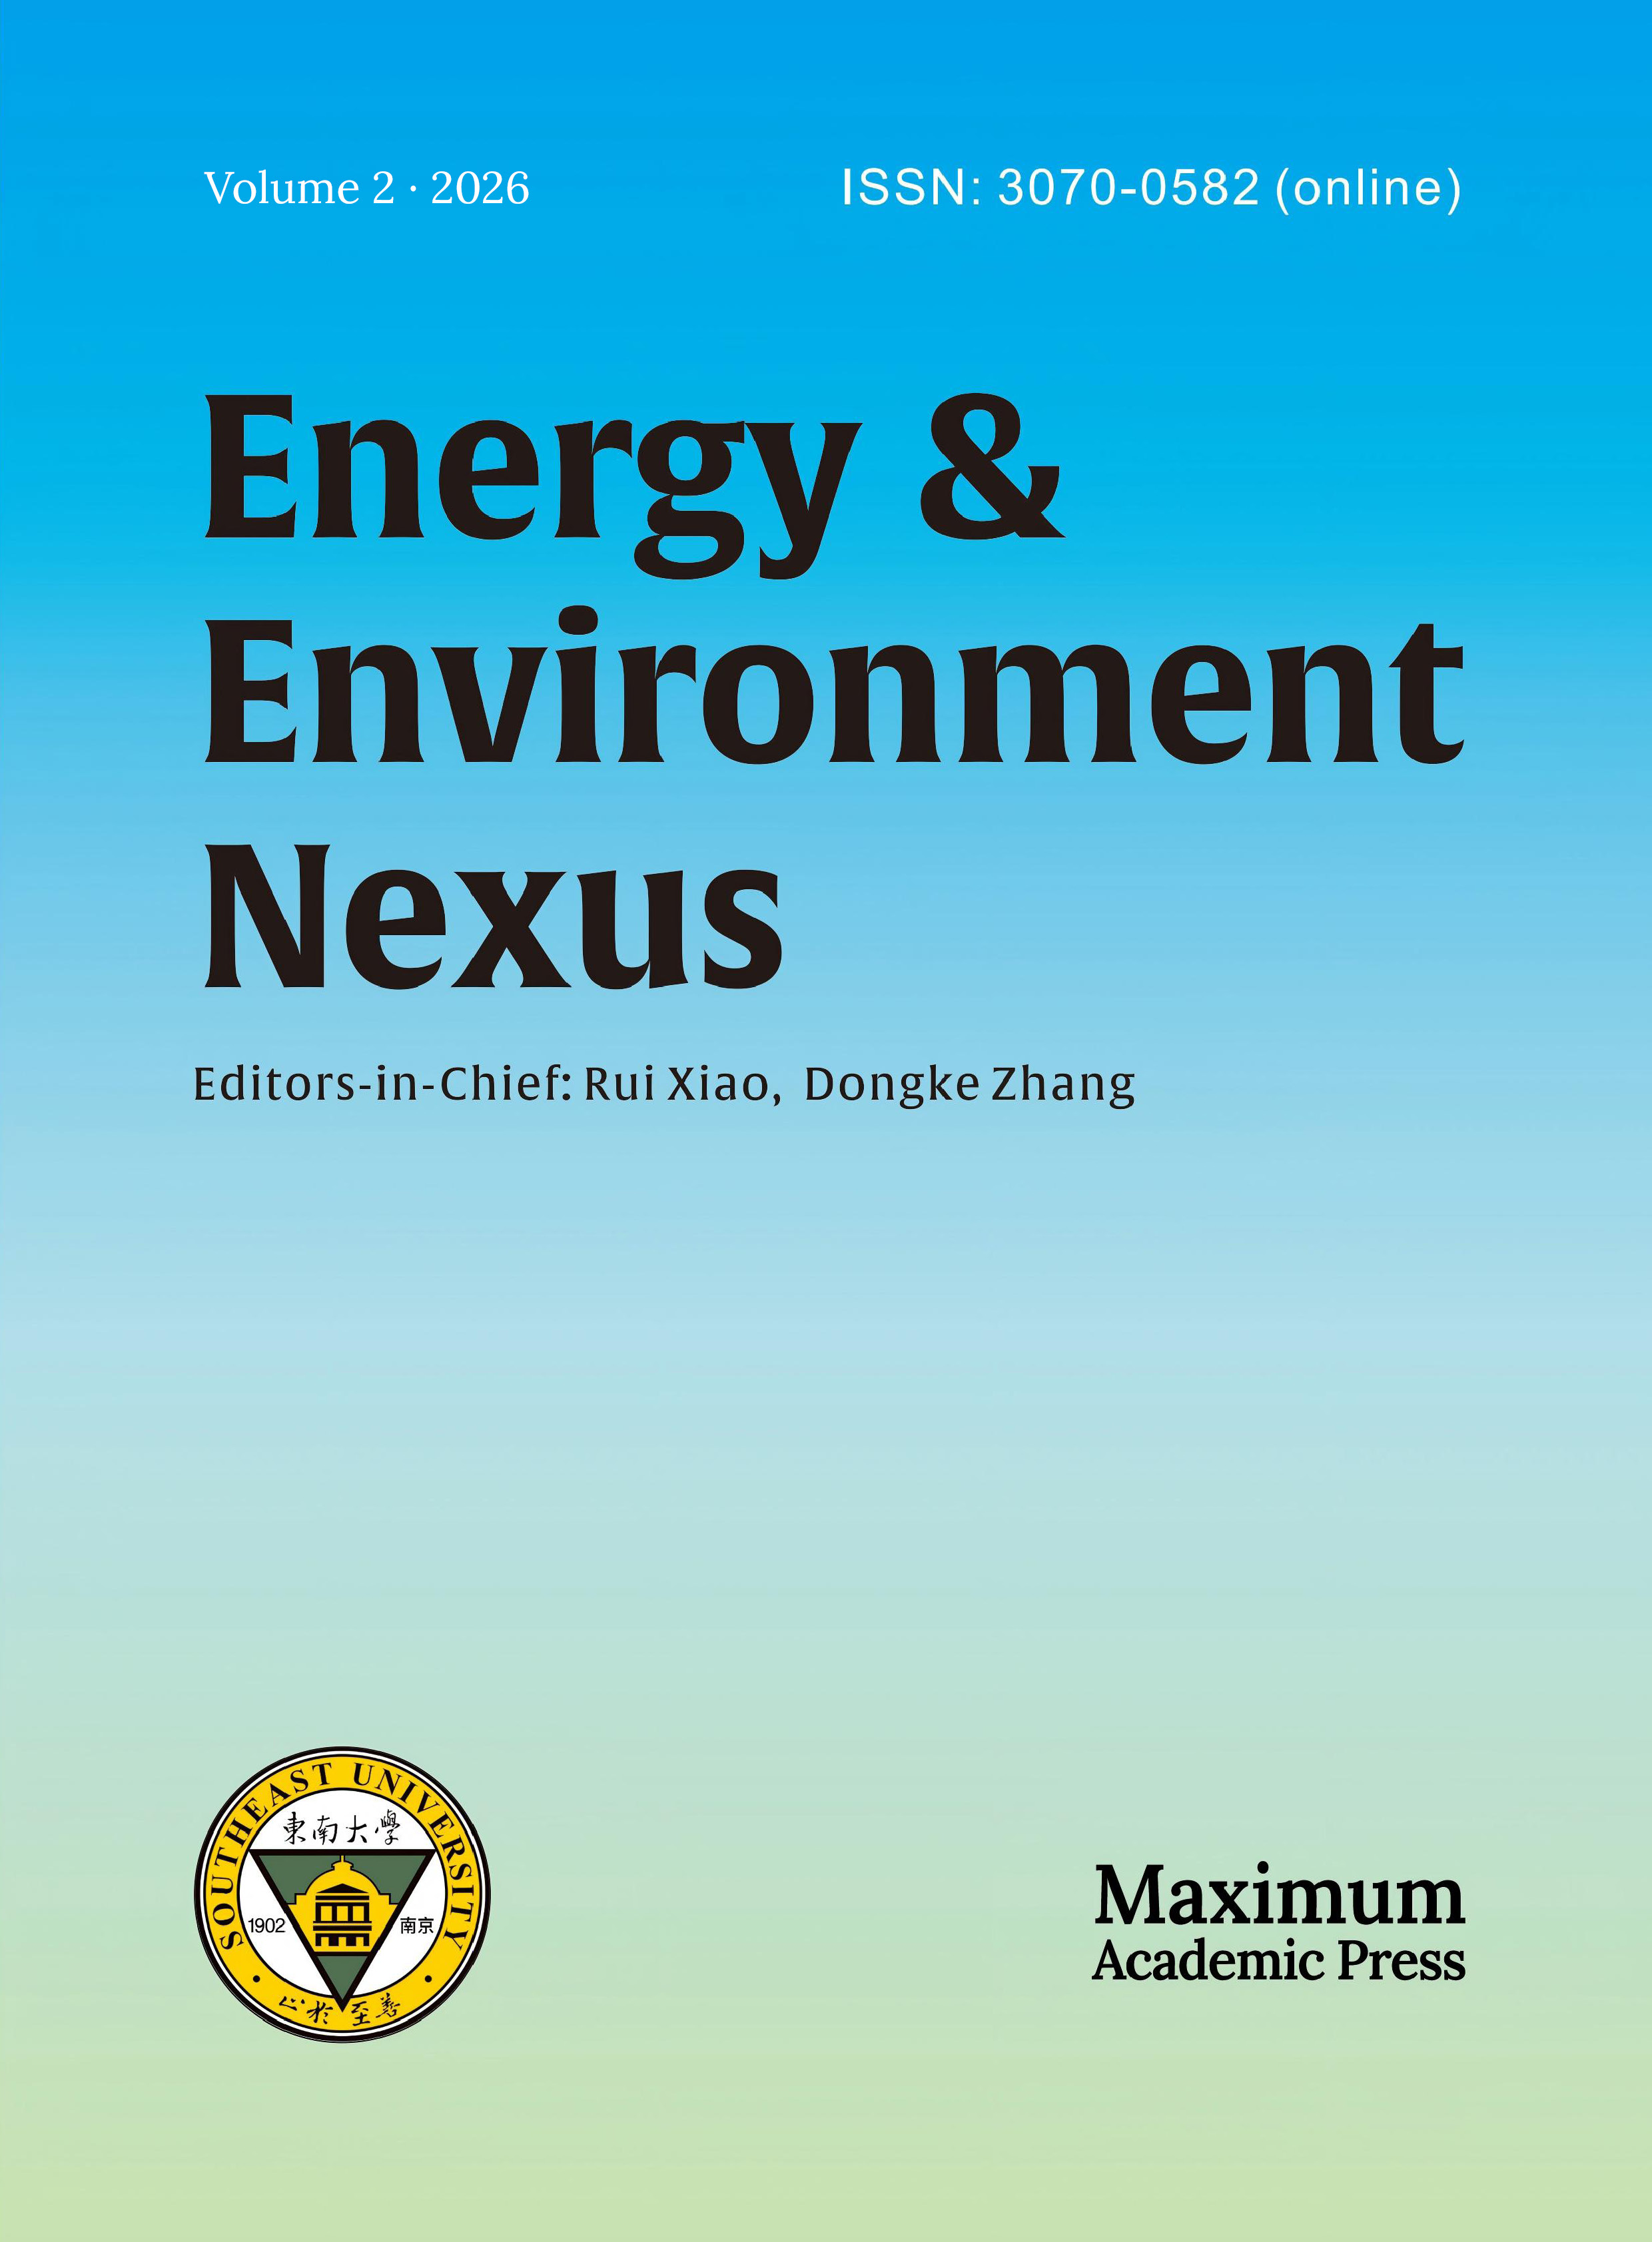
Although biomass combustion has been widely studied, a systematic assessment of the PEI of different combustion methods is still lacking. In this study, based on the exergy method, the PEI of the main gaseous pollutants (CO, CO2, NOx) under four typical biomass combustion modes (open burning, kW-grate, MW-grate, and CFBB) was quantitatively calculated and compared for the first time, which fills the gap in evaluating the influence of combustion mode on the PEI of biomass utilization. The results show that there are significant differences in the effects of different combustion modes on PEI (open burning leads to the highest PEI, while CFBB performs better). The excess air coefficient and fuel characteristics (such as N content) are the key influencing factors. This study not only provides a new method for in-depth understanding of the environmental impact mechanism of biomass combustion (based on the exergy method), but also has important practical guiding significance for scientifically selecting economic and environmentally friendly combustion technology routes, and optimizing biomass energy utilization strategies.
-
The gaseous pollutants produced by biomass combustion mainly include CO, CO2, SO2, and NOx. The low S content in biomass leads to low SO2 concentration in flue gas. The existing literature indicated that SO2 emission requirements can be met without the use of desulphurization equipment, only needing to spray limestone into the furnace[15]. In general, except for the role of desulfurizer, the PEI of SO2 is mainly affected by the S content in the fuel and has little to do with the combustion method. The purpose of this study was to evaluate the effects of various combustion methods on the PEI of biomass, so the PEI of SO2 was ignored. Other gaseous pollutants, such as CH4, were present at low levels in the flue gas and were also not taken into account.
The gaseous pollutants involved in this study are CO, CO2, and NOx. A total of 31 samples of gaseous pollutant emissions from biomass combustion were selected from the published literature, covering all biomass combustion methods. Table 1 shows the ultimate analysis and proximate analysis of biomass fuels in each sample. Generally, biomass fuels have high C content (21.19%–51.3%), low contents of S (0.004%–0.59%) and N (0.067%–2.183%). The moisture content of different types of biomass fuels varies greatly, with a maximum value of 52.9%. The low heating value (LHV) of biomass fuel is strongly influenced by the type of biomass and moisture content, with a maximum of 19.3 MJ/kg and a minimum of 7.65 MJ/kg, the former being 2.5 times higher than the latter.
Table 1. Ultimate analysis and proximate analysis of biomass fuels
No. Biomass fuel Car (%) Har (%) Oar (%) Nar (%) Sar (%) Mar (%) Aar (%) LHV (MJ/kg) Ref. 1 Wheat straw 38.34 5.07 34.2 0.6 0.3 10.42 11.07 14.26a [16] 2 Corn straw 39.32 5.20 36.34 0.58 0.59 9.93 8.04 14.54a [16] 3 Rice straw 39.73 4.94 36.15 1.08 0.37 9.79 7.94 14.41a [16] 4 Poplar 44.60 5.13 39.37 0.09 0.42 10.00 0.39 15.91a [16] 5 Corn straw 42.57 3.82 37.86 0.37 0.12 8.00 6.9 14.68 [17] 6 Birch sawdust 49.1 5.95 35.71 0.23 0.01 7.5 1.5 18.50 [18] 7 Corn straw 40.56 3.03 40.65 0.75 0.12 6.49 8.4 15.53 [19] 8 Grass 48 5.8 22 1.4 0.1 14.6 8.1 18.40 [20] 9 Foliage 51.3 6 15.14 0.8 0.06 16.2 10.5 18.90 [20] 10 78% wood and 22% rcgb 50.22 6.356 19.4 0.184 0.078 22.73 1.04 18.60 [21] 11 67% wood and 33% straw 49.18 6.202 22.58 0.387 0.1 18.51 3.042 18.24 [21] 12 78% wood and 22% straw 49.69 6.268 21.64 0.291 0.081 19.8 2.228 18.43 [21] 13 Wood shavings 45.06 4.915 40.5 0.191 0.004 9 0.33 19.30 [22] 14 Wheat straw 40.87 4.621 37.61 0.553 0.254 8.8 7.3 16.70 [22] 15 Miscanthus 40.92 4.429 37.29 0.399 0.062 11 5.9 17.70 [22] 16 Corn stover 47.09 5.4 26.48 0.81 0.12 16 4.1 15.80 [23] 17 Forest chips 36.67 4.32 30.86 0.144 0.007 27 1 12.74 [24] 18 Wood chips 34.01 3.828 30.34 0.157 0.014 29.41 2.24 12.84 [25] 19 Wood chips 24.69 2.78 19.13 0.09 0.01 52.9 0.4 9.92 [26] 20 Woodchips 25.22 2.727 19.28 0.067 0.008 50.5 2.22 21.20 [27] 21 Wheat straw 26.1 2.99 21.04 0.51 0.09 39.49 9.79 8.88 [28] 22 Wheat straw 35.22 4.17 30.51 0.56 0.09 20.81 8.58 11.79 [28] 23 Corn straw 38.06 4.3 35.38 0.493 0.086 8.13 13.55 13.27 [29] 24 Agricultural straw 38.6 5.1 34.1 0.6 0.1 16 5.5 14.58 [30] 25 Cotton stalk 44.58 5.46 39.43 0.23 0.14 8.41 1.75 17.30 [31] 26 Chicken manure and husk 27.46 3.42 23.72 2.183 0.421 25.4 17.39 10.41 [32] 27 Eucalyptus bark 21.19 3.026 25.97 0.196 0.185 42.65 6.79 7.65 [33] 28 Corn stalk 30.22 4.29 28.75 0.64 0.05 28.69 7.36 10.69 [34] 29 Corn stalk 31.39 3.76 26.32 1.11 0.05 34.15 3.22 10.80 [34] 30 Corn stalk 35.27 3.69 22.69 0.42 0.43 21.3 16.5 12.40 [34] 31 Rice husk and wood chip 28.78 2.68 25.92 0.09 0.01 39.6 2.92 9.73 [34] a The value obtained by the Mendeleev Formula. b rcg means reed canary grass. The combustion method, output power, and the excess air coefficient for combustion are shown in Table 2. It is noted that for samples No. 1–4, biomass fuels were treated by open burning, and the concepts of output power and excess air coefficient are not applicable. CFBB is a clean and efficient combustion technology that is widely used in biomass combustion. The maximum output power of biomass-fired CFBB is 125 MW.
Table 2. Methods, output powers, and excess air coefficients for combustion
No. Combustion
methodOutput
powerExcess air
coefficientRef. 1 Open burning (tiling) Unknown Unknown [16] 2 Open burning (stacking) Unknown Unknown [16] 3 Open burning (stacking) Unknown Unknown [16] 4 Open burning (tiling) Unknown Unknown [16] 5 Fixed grate 8 kW 1.68 [17] 6 Fixed grate 10 kW 2 [18] 7 Rocking grate 12 kW 3.25 [19] 8 Moving grate 25 kW 1.7 [20] 9 Moving grate 25 kW 1.7 [20] 10 Moving step grate 40 kW 2.18 [21] 11 Moving step grate 40 kW 2.18 [21] 12 Moving step grate 40 kW 2.34 [21] 13 Fixed grate 36.4 kW 1.6 [22] 14 Fixed grate 30.1 kW 2 [22] 15 Fixed grate 30.8 kW 1.7 [22] 16 Moving step grate 51 kW 1.8 [23] 17 Moving grate 200 kW 1.9 [24] 18 Moving grate 320 kW 5 [25] 19 Inclined reciprocating grate 4 MW 1.2 [26] 20 Inclined reciprocating grate 12 MW 1.12 [27] 21 Vibrating grate 12 MW 1.29 [28] 22 Vibrating grate 30 MW 1.34 [28] 23 Vibrating grates 30 MW 1.32 [29] 24 Vibrating-grate 38 MW 1.7 [30] 25 CFBB 0.5 MW 1.32 [31] 26 CFBB 1 MW 1.4 [32] 27 CFBB 50 MW 1.17 [33] 28 CFBB 30 MW 1.35 [34] 29 CFBB 40 MW 1.4 [34] 30 CFBB 80 MW 1.3 [34] 31 CFBB 125 MW 1.3 [34] Method
Calculation of emission factor
-
There are two main ways to express the concentration of gaseous pollutants in the selected literature. The first is the volume concentration, with a unit of ppm or %, and the second is the mass concentration, with a unit of mg/m3. In addition, the emission of gaseous pollutants was measured by the mass of pollutant emitted from unit calorific value fuel in some literature, with a unit of mg/MJ. In this study, the gaseous pollutant emission concentrations were converted to 'emission factor' to facilitate the calculation of PEI, where the emission factor refers to the mass of gaseous pollutants emitted from a unit mass of fuel. The conversion methods are as follows:
$ 1\text{ mg/m}^{\text{3}}=\dfrac{M_i}{22.4}\rm{ppm}=\dfrac{M_i}{224,000}\text{% } $ (1) $ E_i=S_i\ \times\ V_i=P_i\ \times\ Q_i $ (2) where, M is the mole mass of gaseous pollutant (g/mol); i indicates gaseous pollutant i; E is the emission factor (mg/kg); S is the mass concentration of gaseous pollutant (mg/m3); V is the actual volume of wet flue gas (m3/kg), calculated by Eqs (3)–(5); P is the mass of pollutants emitted from unit calorific value fuel (mg/MJ); Q is the LHV of biomass fuel (MJ/kg).
$ V={V}_{0}+\left(\alpha -1\right)L $ (3) $ {V}_{0}=0.01(1.867{\text{C}}_{\text{ar}}+0.7{\text{S}}_{\text{ar}}+0.8{\text{N}}_{\text{ar}}+11.2{\text{H}}_{\text{ar}}+1.24{\text{M}}_{\text{ar}})+0.79L $ (4) $ L=0.0889\left({\text{C}}_{\text{ar}}+0.375{\text{S}}_{\text{ar}}\right)+0.265{\text{H}}_{\text{ar}}-0.0333{\text{O}}_{\text{ar}} $ (5) where, V0 is the theoretical wet flue gas volume (m3/kg); α is the excess air coefficient, which was obtained from the selected literature; L is the theoretical air volume required for biomass combustion (m3/kg).
Potential environmental impact
-
Based on the main potential gaseous pollutants (CO, CO2, NOx), the PEI of biomass fuels was expressed as follows:
$ m_i=\dfrac{E_i}{1,000M_i} $ (6) $ PEI=PE{I}_{\text{CO}}+PE{I}_{\text{C}{{\text{O}}_{\text{2}}}}+PE{I}_{\text{NO}x}=\sum{m}_{i}e{x}_{i} $ (7) where, mi indicates the mass of gaseous pollutant i (mol/kg); PEI is the total PEI of biomass fuel (kJ/kg); PEICO, PEICO2, and PEINOx indicate the PEI of CO, CO2, and NOx, respectively, (kJ/kg); exi indicates standard chemical exergy of gaseous pollutant (kJ/mol), as shown in Table 3.
Table 3. Standard chemical exergy values of gaseous pollutants
Gaseous pollutant Standard chemical exergy (kJ/mol) CO 274.71 CO2 19.48 NO 88.90 Data on CO2 emissions are rarely monitored when biomass-fired equipment is operating; therefore, such data were not available for almost all samples. It is assumed that all of the C in the biomass fuel is eventually converted to CO or CO2 in this study. The emission factor of CO2 is calculated by Eq. (8).
$ E_{\text{C}\text{O}_{\text{2}}}=1,000M_{\text{C}\text{O}_{\text{2}}}\left(\dfrac{10\text{C}_{\text{ar}}}{12}-\dfrac{E_{\text{CO}}}{1,000M_{\text{CO}}}\right) $ (8) It should be noted that the NO and NO2 produced by biomass combustion are uniformly expressed as NOx. Some selected literature only listed the emission concentration of NOx and did not distinguish between NO and NO2. It has been reported that fuel- NOx accounts for 80%–90% of NOx generated by biomass combustion, and its main form is NO[35,36]. In this study, NOx was considered as NO to quantitatively assess the PEI of NOx.
The PEI of biomass is affected by both fuel types and combustion methods. In order to exclude the effect of fuel types and effectively evaluate the effect of combustion methods on the PEI of biomass, the PEI of CO and CO2 produced by per kg of C (PEICO-C and PEICO2-C), and the PEI of NOx produced by per kg of N (PEINOx-N) were calculated, according to Eqs (9)–(11).
$ \textit{PE}{\textit{I}}_{\mathrm{CO}-\mathrm{C}}=\dfrac{\text{100}\times \textit{PE}{\textit{I}}_{\mathrm{CO}}}{{\mathrm{C}}_{\mathrm{ar}}} $ (9) $ \textit{PE}{\textit{I}}_{\mathrm{C}{{\mathrm{O}}_{2}}-\mathrm{C}}=\dfrac{\text{100}\times \textit{PE}{\textit{I}}_{\mathrm{C}{{\mathrm{O}}_{2}}}}{{\mathrm{C}}_{\mathrm{ar}}} $ (10) $ \textit{PE}{\textit{I}}_{\mathrm{NO}\textit{x}-\mathrm{N}}=\dfrac{\text{100}\times \textit{PE}{\textit{I}}_{\mathrm{NO}\textit{x}}}{{\mathrm{N}}_{\mathrm{ar}}} $ (11) Each sample represents a special combustion unit due to differences in combustion conditions, even if its combustion method is the same as that of other samples. For any biomass fuel with known Car and Nar, the PEI of all gaseous pollutants can be calculated by the inverse operation of Eqs (9)–(11) based on the PEICO-C, PEICO2-C, and PEINOx-N of each sample, and then the effect of each combustion unit on the PEI of biomass can be evaluated.
-
For samples No. 1–4, the emission concentrations of all gaseous pollutants could not be obtained due to the open burning method. Therefore, their PEIs were calculated from the emission factors given in the literature[37] according to Eqs (6) and (7).
Potential environmental impact of CO
-
There are significant differences in the moisture content and particle size of biomass fuels, increasing the inhomogeneity of boiler feed. A portion of the fuel is accumulated after entering the furnace, which cannot fully contact with oxygen, resulting in a large amount of CO being generated. High CO emission is one of the most significant characteristics of biomass combustion, attracting much attention from researchers[37,38]. Figure 2 shows the mass concentration of CO emissions from selected samples. Samples with CO emission concentrations exceeding 1,000 mg/m3 are mostly from the MW-grates or CFBBs, and the No. 12 sample has the lowest CO emission concentration (13.37 mg/m3). This is because the excess air coefficients of MW-grates and CFBB (1.12–1.7) are significantly lower than those of kW-grates (1.6–5). When the excess air coefficient is high, the possibility of full contact between the fuel and oxygen increases, and the C in the fuel tends to be converted to CO2 rather than CO, resulting in lower concentrations of CO emissions. On the contrary, the emission concentration of CO will be higher. Chen et al. explored the CO emission characteristics of large particle wood briquette combustion and obtained the same conclusion[39]. The low CO emission concentration of the No. 24 sample (267.5 mg/m3) can also be well explained by the above analysis.
Figure 2.
The mass concentration of CO.
Note that the No. 27 sample had the highest CO emission concentration (5,199.71 mg/m3). It can be speculated that there are two reasons for this result. On the one hand, the No. 27 sample uses eucalyptus bark with high moisture content (42.65%) as fuel, and the accumulation of fuel in the furnace is serious. On the other hand, the excess air coefficient of the No. 27 sample (1.17) is low. The above two reasons lead to the fuel not being able to fully contact oxygen, and a large amount of CO is produced by fuel combustion in an oxygen-deficient state. Li et al. found that when the excess air coefficient is lower than 1.2, CO emissions will increase significantly[40]. For the CFBB, in addition to the No. 27 sample (5,199.71 mg/m3), the CO emission concentration of the No. 26 sample is also high (1,875 mg/m3). This is because the fuel of the No. 26 sample contains chicken manure, making the average temperature of the furnace lower than that of the general CFBB, and the proportion of unburned CO increases. In general, fuel specificity is the main reason for the high CO emission concentration in the No. 26 and No. 27 samples. Thus, the combustion method of CFBB does not cause excessively high concentrations of CO emissions.
Comparing the No. 19–23 samples, it can be found that the grate type has a significant effect on CO emissions. For the MW-grates, the CO emission concentration of No. 19 and No. 20 samples (11.13 and 15 mg/m3) with inclined reciprocating grates are very low. It can be concluded that the inclined reciprocating grate is more conducive to the burnout of fuel than other types of grates.
Based on the CO emission, the PEI of CO was obtained for the selected samples, as shown in Fig. 3. It is observed that biomass has a much higher PEI when treated by open burning (370.30–662.76 kJ/kg) compared with other combustion methods. According to Eqs (2), (6), and (7), the PEI of biomass is proportional to both the emission concentration of gaseous pollutants and flue gas volume. When biomass fuel is treated by open burning, on the one hand, the fuel that is not exposed to the air cannot fully contact with the air, resulting in a higher CO emission concentration; on the other hand, the fuel exposed to the air continuously absorbs oxygen from the surrounding air and produces more flue gas.
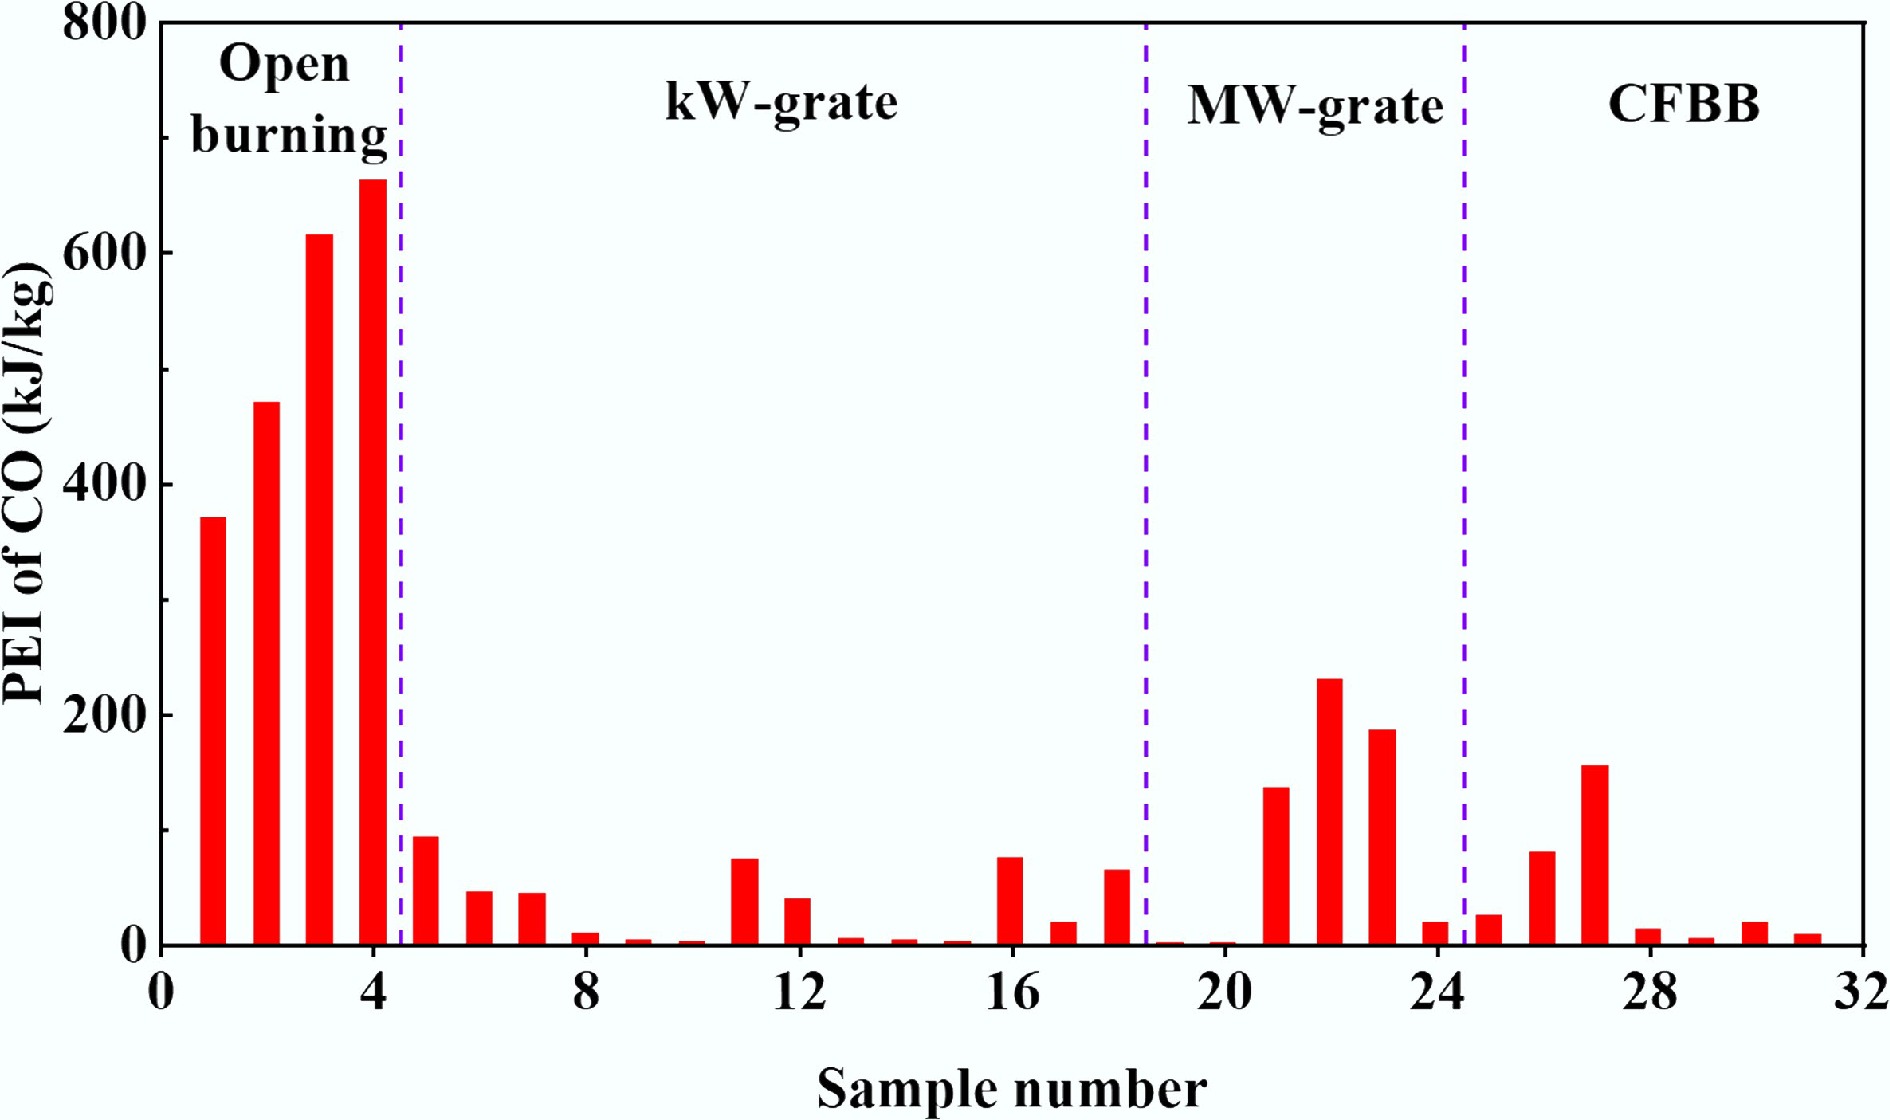
Figure 3.
The PEI of CO.
When biomass is treated by the grate and CFBB, the PEI of CO is between 0.25 kJ/kg (No. 19 sample) and 229.37 kJ/kg (No. 22 sample). The kW-grates are usually used for residential heating, which requires a high excess air coefficient, increasing the amount of flue gas and reducing the generation of CO. Compared with the former, the latter has a greater impact. Therefore, the PEIs of CO for No. 5–18 samples are low, with a maximum of 91.98 kJ/kg (No. 5 sample). The high PEI of CO in samples of No. 21–23, and No. 26, 27 is due to the high CO emission concentration, as explained in detail above. When biomass is burned by CFBB, the PEI of CO is significantly affected by fuel characteristics. Compared with the No. 22–24 and No. 28–31 samples, when the output power is greater than 30 MW, CFBB is easier to obtain a low PEI of CO. Therefore, CFB combustion technology is considered to be one of the most promising technologies for large-scale utilization of biomass resources[41].
Based on the PEI of CO, the PEICO-C was calculated, as shown in Fig. 4. It is observed that the No. 3 and No. 19 samples have the highest and lowest PEICO-C (1,550 and 0.998 kJ/kg). The PEICO-C effectively reflects the degree of fuel burnout, and a higher PEICO-C indicates a greater proportion of C converted to CO. For open burning, the PEICO-C of No. 1–4 samples (965.83–1,549.89 kJ/kg) is significantly higher than that of other samples due to the poor combustion conditions. Among them, the PEICO of the No. 3 sample (1,549.89 kJ/kg) is not the highest, but it has the highest PEICO-C, verifying that its combustion condition is the worst. For MW-grates and CFBBs, the PEICO of the No. 27 sample is less than that of the No. 22 and No. 23 samples, but it has the highest PEICO-C (728.60 kJ/kg).
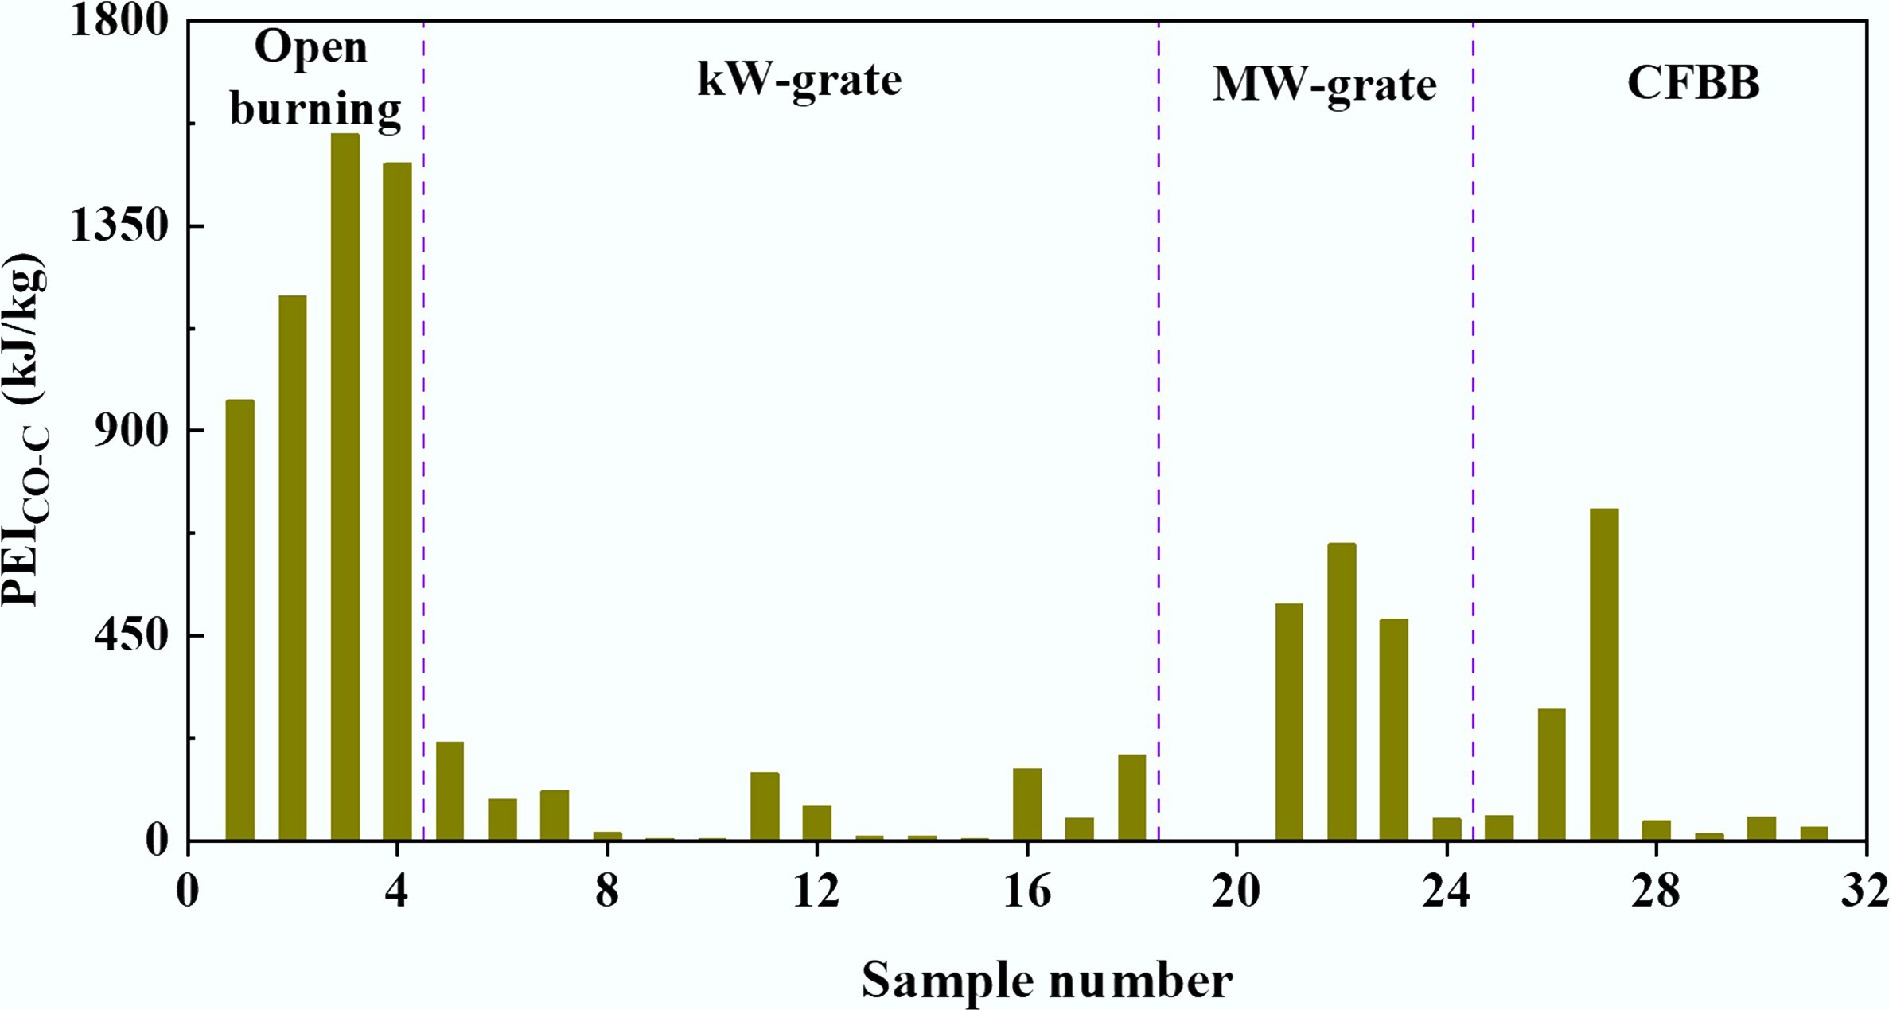
Figure 4.
The PEI of CO produced by per kg of C.
Potential environmental impact of NOx
-
NOx is an important pollutant to monitor in biomass-fired power plants. Figure 5 shows the mass concentration of NOx emission for the selected samples. In general, because the MW-grates and CFBBs are equipped with denitrification equipment, their NOx emission concentration is less than that of kW-grates. In particular, for CFBBs that burn ordinary biomass fuels and have an output power greater than 30 MW (No. 28–31 samples), their emission concentrations of NOx are less than 50 mg/m3 after denitrification treatment.
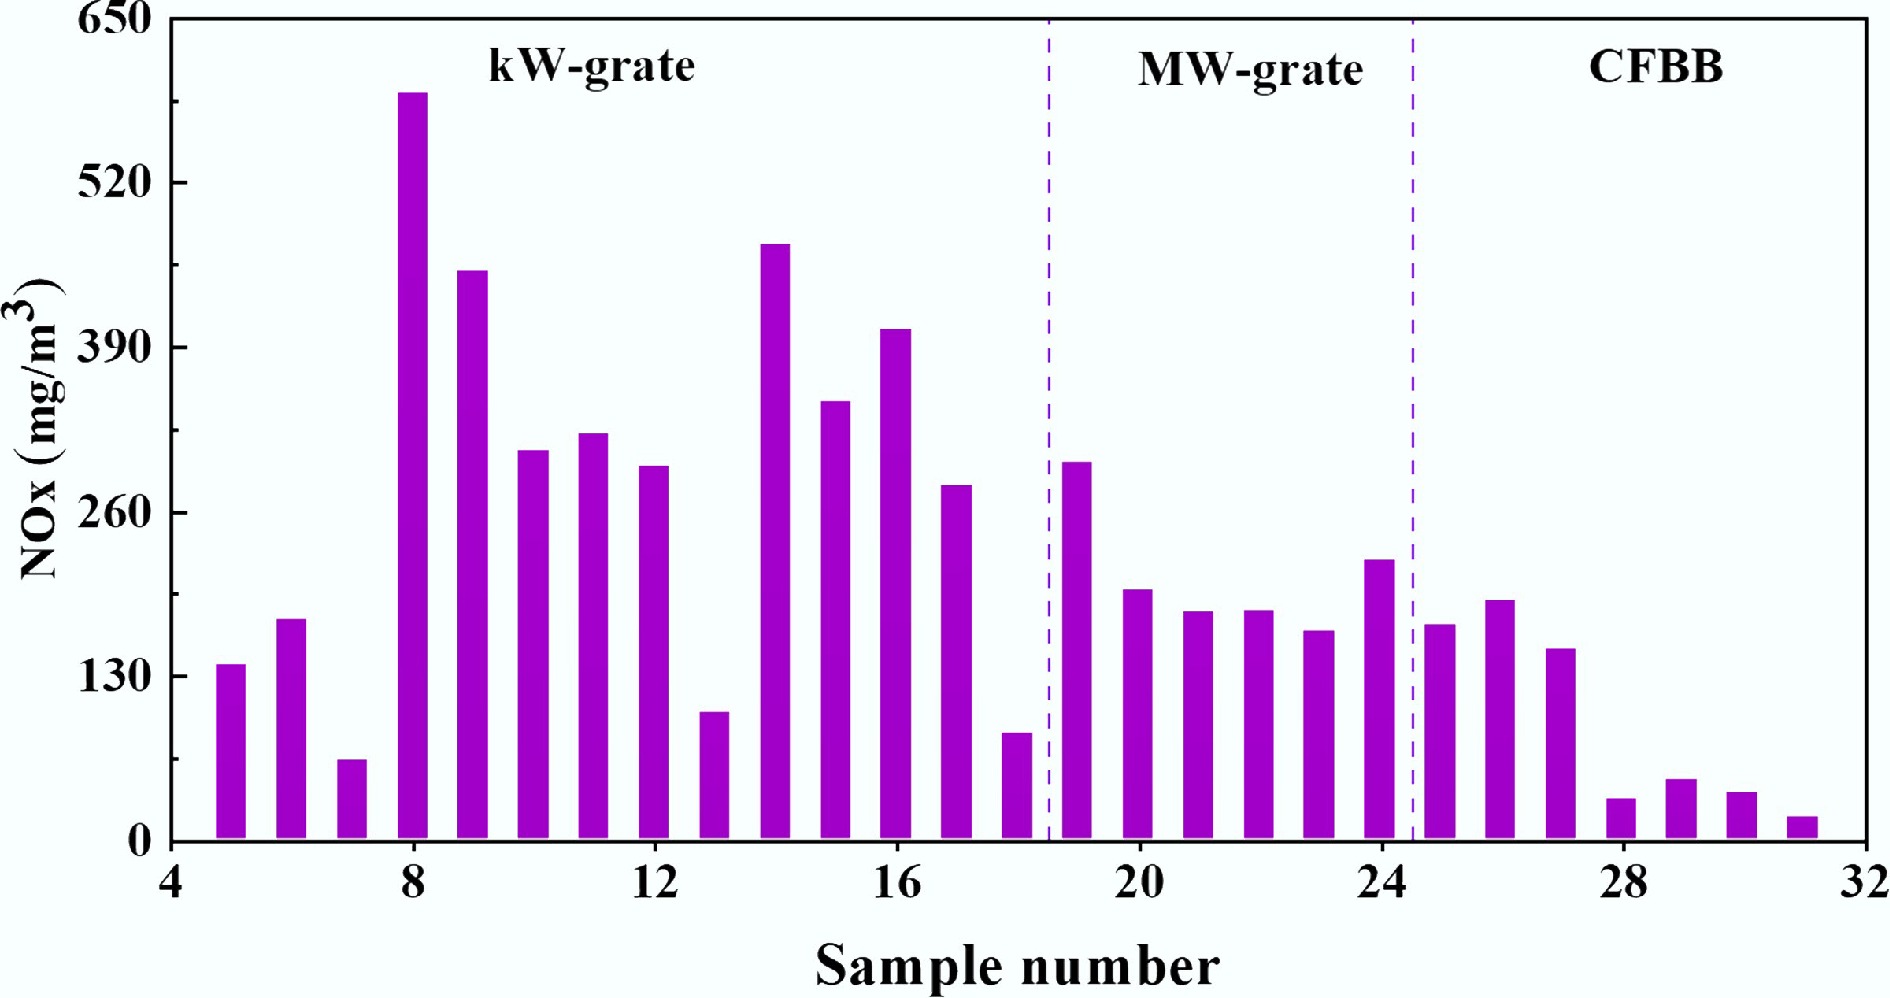
Figure 5.
The mass concentration of NOx.
It is noted that the No. 5–7, 13, and 18 samples have relatively low NOx emission concentrations among the samples using kW-grate. The concentration of NOx in the flue gas is affected by the combustion temperature, the nitrogen content of the fuel, and the combustion atmosphere (reducing or oxidizing)[42]. For the No. 5–7 and 18 samples, it is observed from Fig. 2 that they have relatively high CO concentrations in the flue gas, indicating that there is more CO in the furnace. CO can effectively inhibit NOx generation or reduce the generated NOx, reducing the NOx concentration in the flue gas. The chemical reactions are shown in Eqs (12)–(14). For the No. 13 sample, the ash content in biomass fuel is only 0.3%, and the volatile content is high. The components of biomass volatiles are mostly reducing gases, which can play the same role as CO, so the concentration of NOx in flue gas is also low. Liu et al. studied the effect of air classification on NOx emissions from household biomass pellet boilers and obtained similar conclusions[43].
$ \mathrm{N}{\mathrm{O}}_{2}(\text{g)}+\mathrm{CO}(\text{g)}\rightarrow \mathrm{C}{\mathrm{O}}_{2}(\text{g)}+\mathrm{NO}(\text{g)} $ (12) $ 2\mathrm{N}{\mathrm{O}}_{2}(\text{g)}+4\mathrm{CO}(\text{g)}\rightarrow {\mathrm{N}}_{2}(\text{g)}+4\mathrm{C}{\mathrm{O}}_{2}(\text{g)} $ (13) $ 2\mathrm{NO}(\text{g)}+2\mathrm{CO}(\text{g)}\rightarrow {\mathrm{N}}_{2}(\text{g)}+2\mathrm{C}{\mathrm{O}}_{2}(\text{g)} $ (14) Based on the NOx emission, the PEIs of NOx were obtained for the selected samples, as shown in Fig. 6. It is observed that the biomass samples generally have lower PEIs of NOx (0.065–6.657 kJ/kg) than coals (33–89 kJ/kg)[44]. Similar conclusions were also reported[45]. The PEI of NOx is lower when biomass is burned by CFBBs compared with that of MW-grates. For the MW-grates and CFBBs, the No. 24 sample has the second highest NOx emission concentration (220.98 mg/m3) after the No. 19 sample (298.91 mg/m3) and the highest excess air factor (1.7), therefore it has the highest PEI for NOx (2.85 kJ/kg). For the kW-grates, the low PEIs of NOx in No. 5, 7, and 13 samples are due to their low NOx emission concentration, as analyzed above.
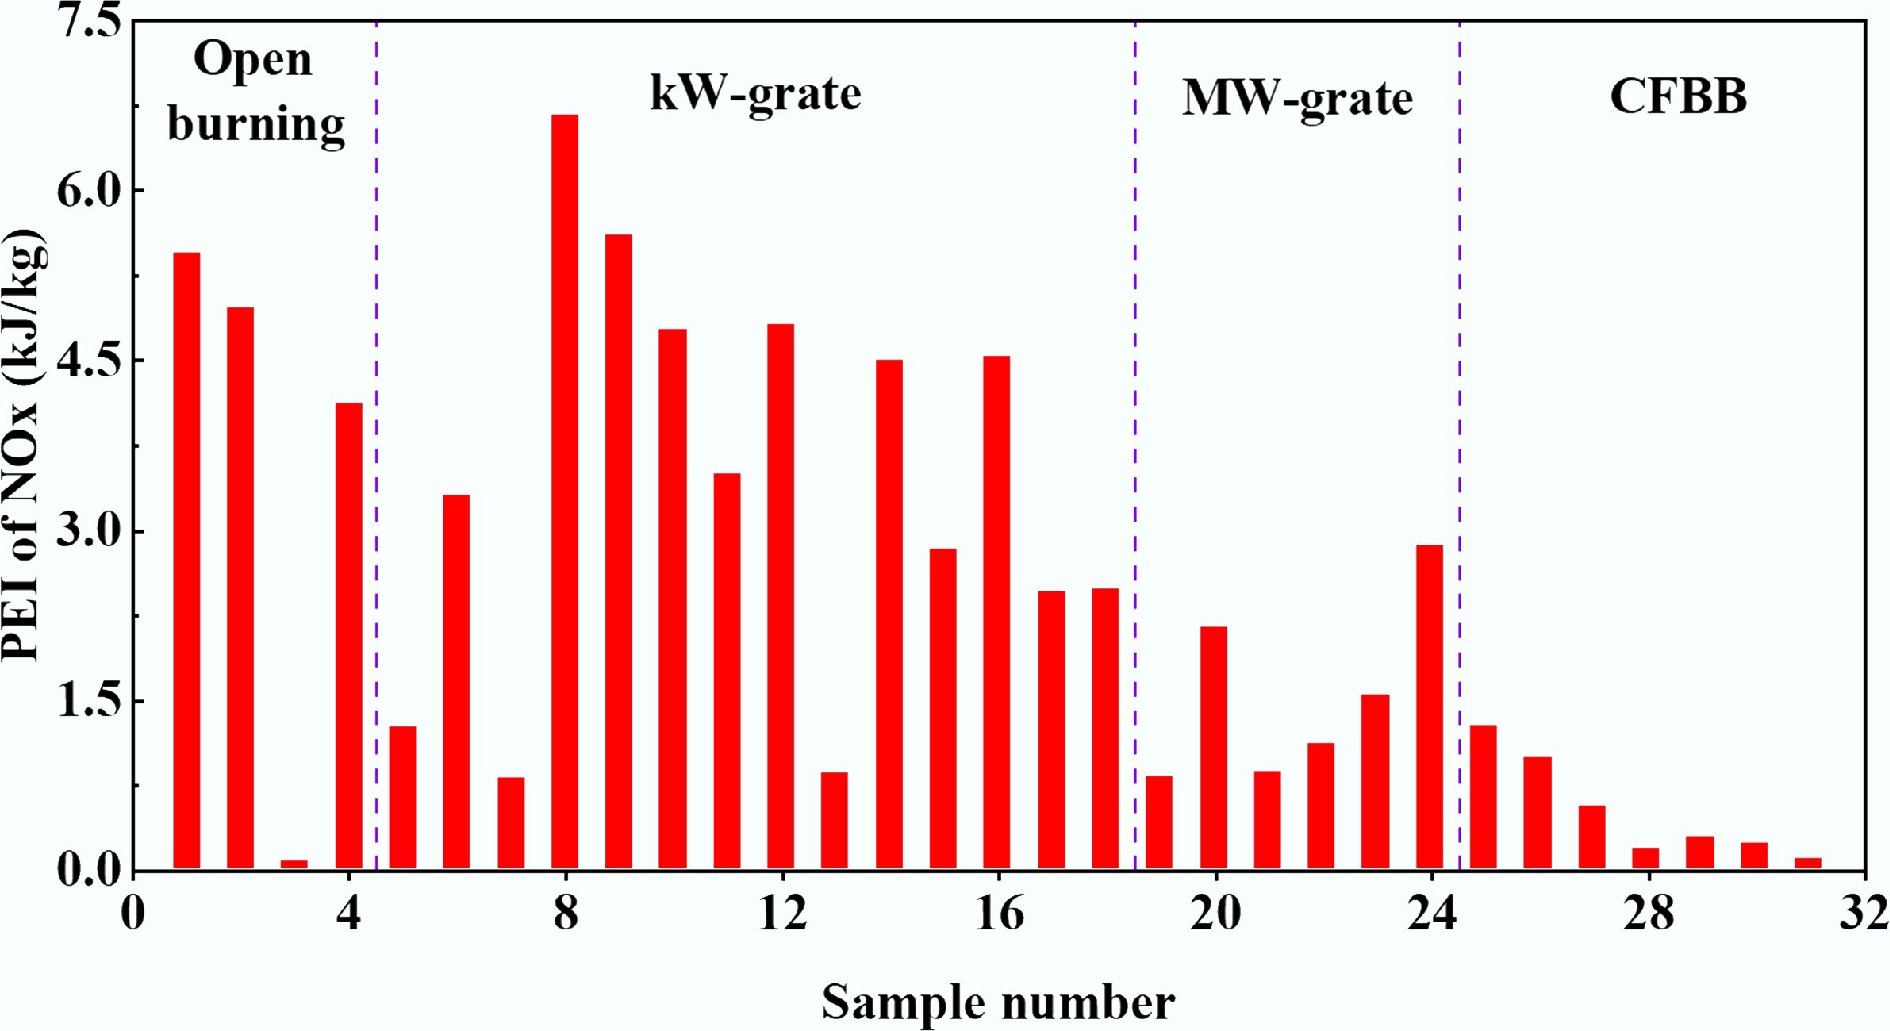
Figure 6.
The PEI of NOx.
It is noted that the No. 3 sample has the lowest PEI of NOx (0.065 kJ/kg). This is because the literature[16] indicated that it had an NOx emission factor of 0.054 g/kg, which was significantly lower than the other selected samples. Compared with No. 1–4 samples, although biomass fuels are all treated by open burning, rice straw has the smallest diameter, the smallest stacking gaps, and the highest stacking density, so it has the worst contact with the air. Accordingly, the authors speculate that the No. 3 sample has the lowest combustion temperature, hindering the generation of NOx, resulting in the lowest emission factor for NOx. Due to the low N content of the biomass, the maximum PEI of NOx is only 6.657 kJ/kg (No. 8 sample).
Based on the PEIs of NOx, the PEINOx-N was obtained, as shown in Fig. 7. It is observed that the No. 4 sample has the highest PEINOx-N (4,543 kJ/kg), whereas the No. 3 sample has the lowest PEINOx-N (6.043 kJ/kg). Both use open burning to treat biomass. The PEINOx-N of samples using kW-grates is generally higher than that of MW-grates and CFBBs. This may be due to the excessive air coefficients of the kW-grates being too high, so that the NOx generated by the biomass combustion is always in an oxidizing atmosphere and cannot be effectively reduced. However, there are several special samples: The No. 7 sample uses a kW-grate, but its PEINOx-N is very low (105.98 kJ/kg); the No. 19 and 20 samples use MW-grates, but their PEINOx-N is high (911.10 kJ/kg and 3,175.01 kJ/kg). The excessive air coefficient of the No.7 sample is too high (3.25), resulting in a lower temperature in the furnace, hindering the generation of NOx. In contrast, the No. 19 and No. 20 samples have high combustion intensity due to the use of a reciprocating grate, resulting in higher temperatures in the furnace and increasing NOx generation.
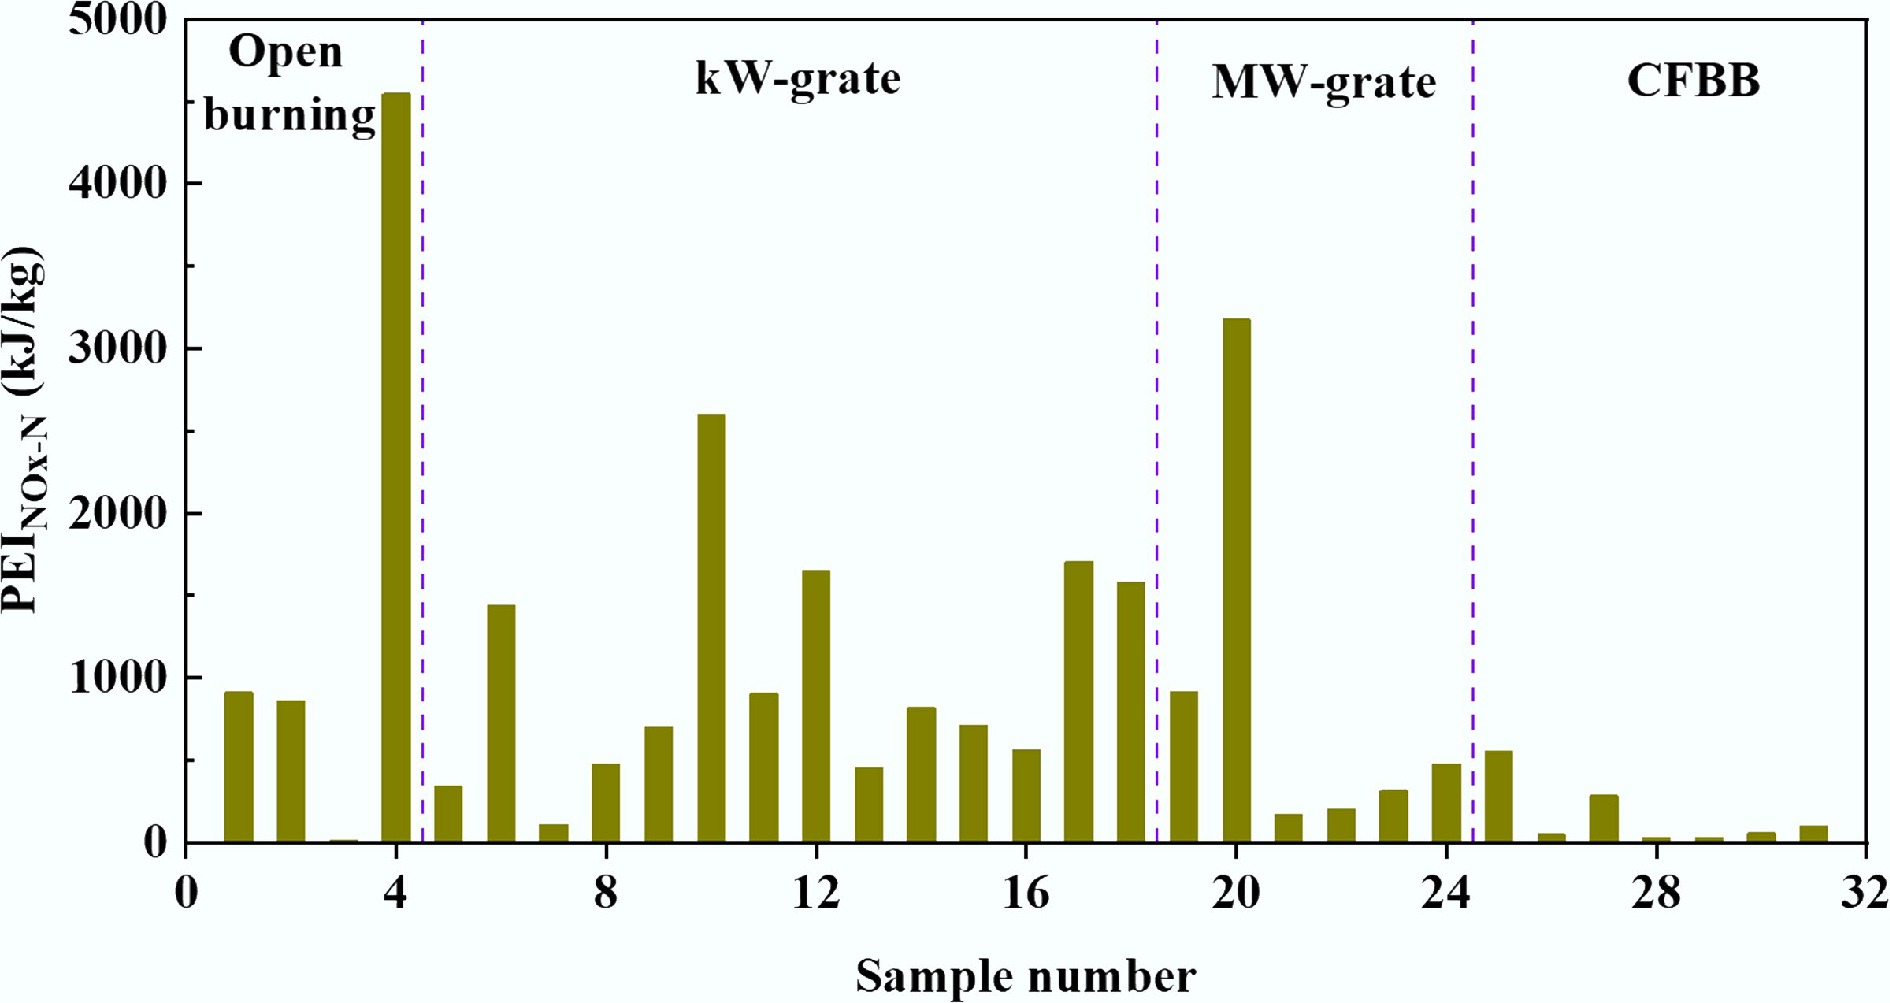
Figure 7.
The PEI of NOx produced by per kg of N.
Samples using CFBB show a low PEINOx-N. This is because CFBB often uses staged air distribution to adjust combustion and is equipped with denitrification devices. The former effectively reduces the generation of NOx, and the latter greatly reduces the concentration of NOx in the flue gas, both of which reduce PEINOx-N. Song et al. explored the effect of air classification on NOx generation and obtained a similar conclusion[46].
Potential environmental impact of CO2
-
From the perspective of the whole life cycle, the contribution of biomass to CO2 in the environment is close to zero[47]. However, the PEI of CO2 cannot be ignored when assessing the impact of biomass combustion on the environment. The PEI of CO2 for selected samples is shown in Fig. 8. It can be seen that the No. 9 sample has the highest PEI of CO2 (832.59 kJ/kg) due to its highest C content (51.3%), whereas the No. 27 sample has the lowest PEI of CO2 (332.97 kJ/kg) due to its lowest C content (21.186%). Thus, it can be seen that the PEI of CO2 is mainly affected by the C element in biomass fuel. The higher the C content in the biomass fuel, the more CO2 is produced, and the higher the PEI of CO2 is. It is observed that the biomass samples have lower PEIs of CO2 than coals (942–953 kJ/kg)[44]. A similar conclusion was also reported by other researchers[48].
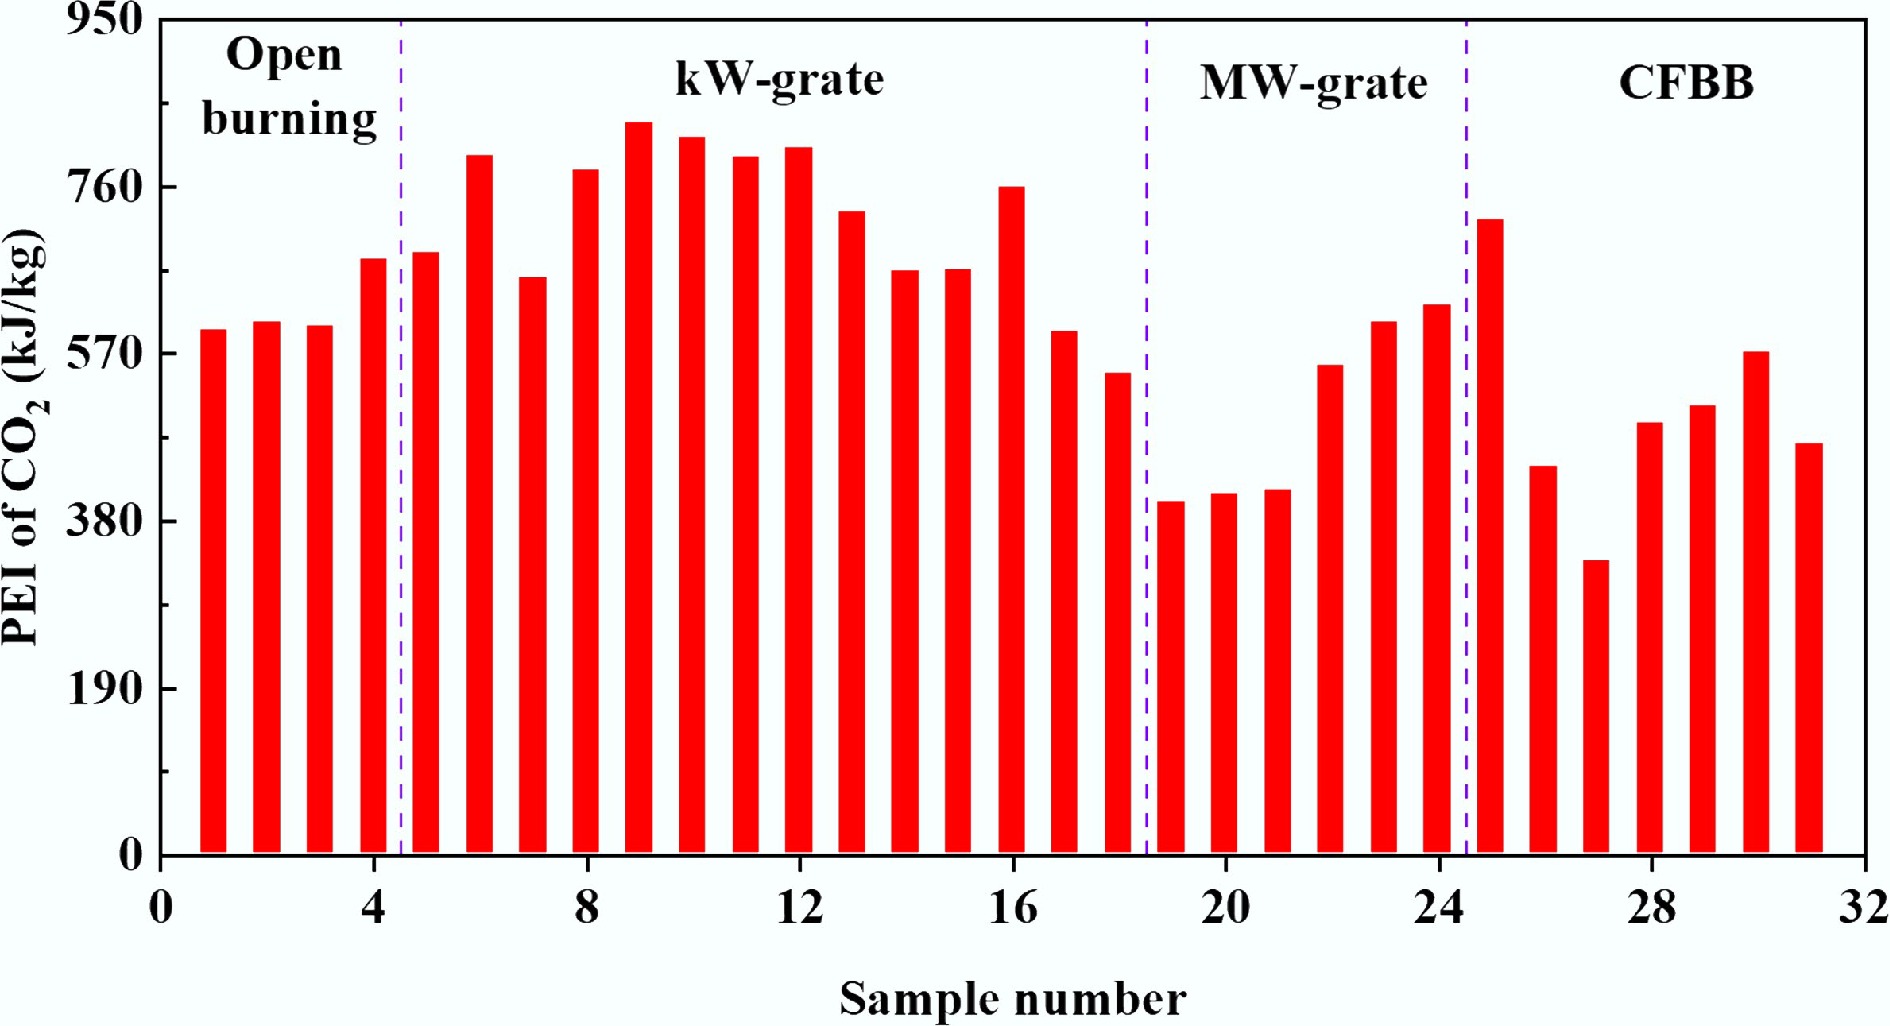
Figure 8.
The PEI of CO2.
Based on the PEI of CO2, the PEICO2-C was obtained, as shown in Fig. 9. It is observed that the PEICO2-C of all samples is similar, and the maximum and minimum values are 1,623 kJ/kg (No. 19 sample) and 1,513 kJ/kg (No. 3 sample), respectively. This is because there is very little CO in the flue gas compared to CO2. Theoretically, if all the C in the biomass fuel is converted to CO2, according to Eqs (6)–(8), and (10), it can be obtained as follows:
$ E_{\text{C}\text{O}_{\text{2}}}=\dfrac{10,000M_{\text{C}\text{O}_{\text{2}}}\text{C}_{\text{ar}}}{12} $ (15) $ PEI_{\text{C}\text{O}_{\text{2}}}=\dfrac{E_{\text{C}\text{O}_{\text{2}}}}{1,000M_{_{\text{C}\text{O}_{\text{2}}}}}ex_{\text{C}\text{O}_{\text{2}}} $ (16) $ \text{PE}\text{I}_{\mathrm{C}\mathrm{O}_2-\mathrm{C}}=\dfrac{\text{1,000}}{12}\text{e}\text{x}_{\mathrm{C}\mathrm{O}_2} $ (17) Since exCO2 is a fixed value, PEICO2-C will be a fixed value at this time. Therefore, the PEICO2-C indirectly reflects the degree of conversion of C to CO2. The lower the PEICO2-C, the higher the proportion of C converted to CO, and the lower the degree of C conversion to CO2. Taking the No. 3 sample as an example, it has the lowest PEICO2-C but the highest PEICO-C.
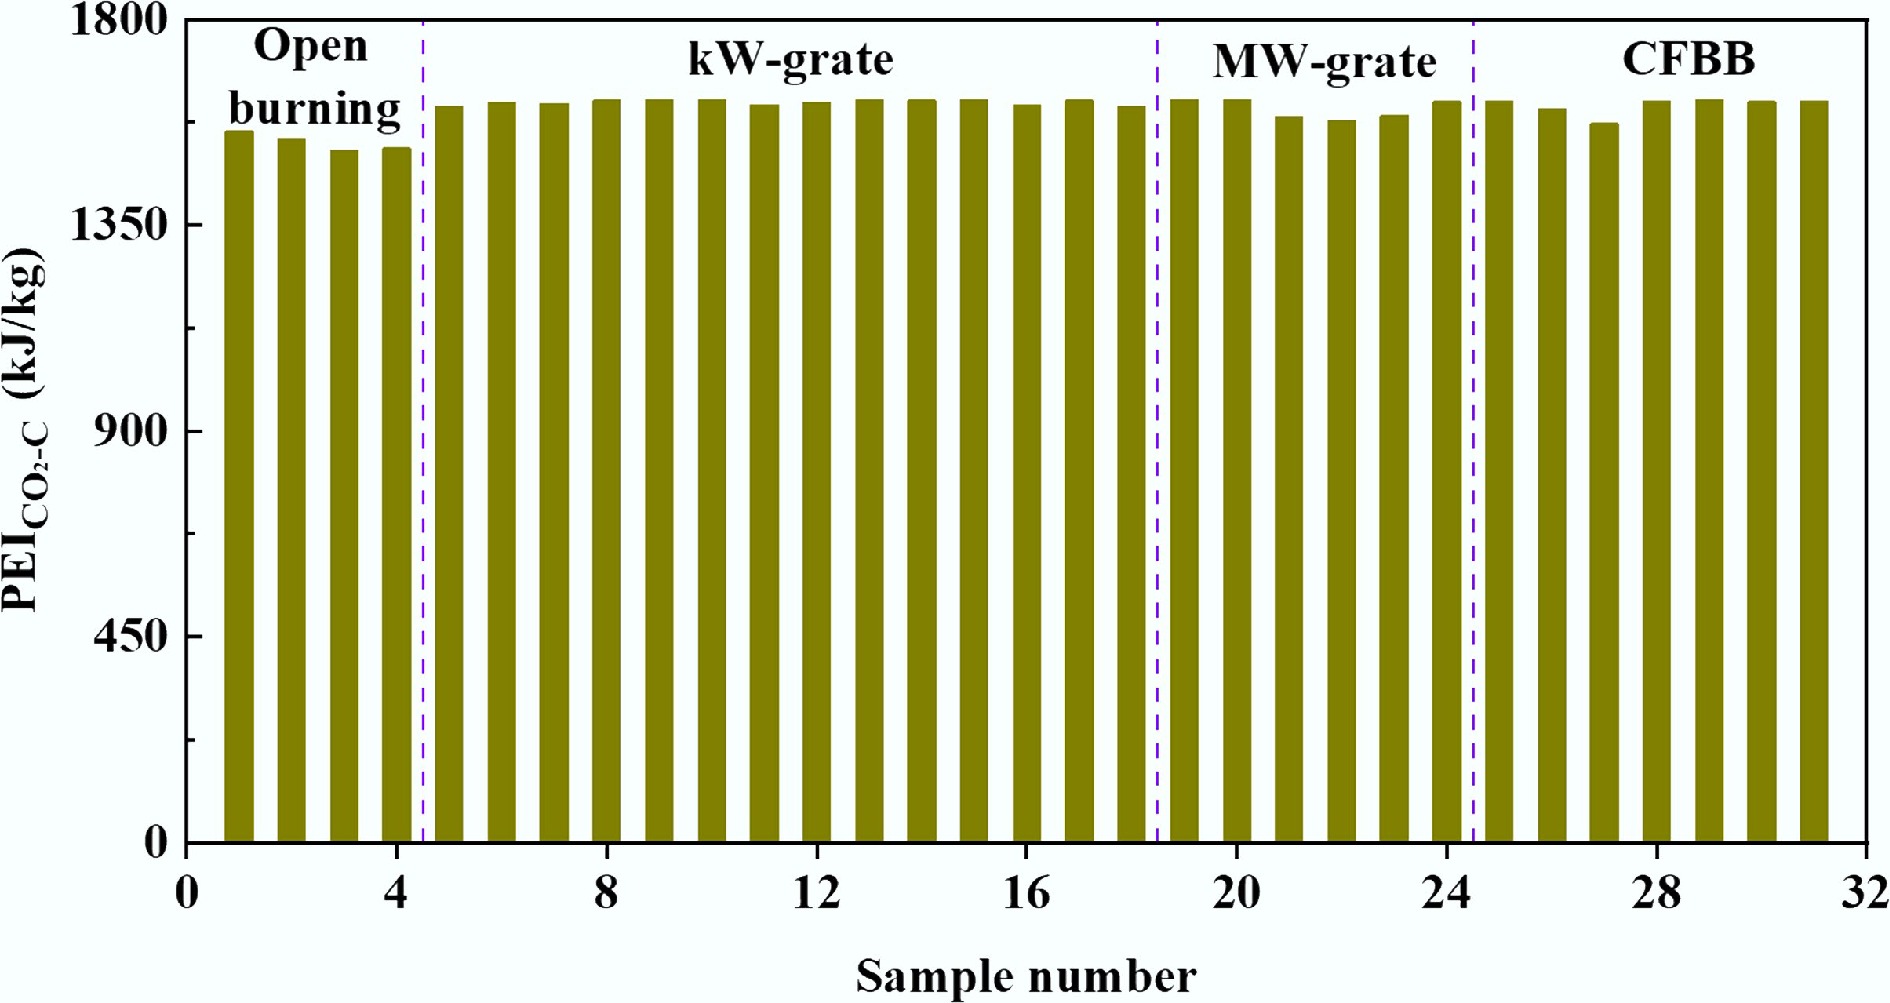
Figure 9.
The PEI of CO2 produced by per kg of C.
Total potential environmental impact
-
There is no doubt that the amounts of CO, CO2, and NOx in the flue gas are proportional to the contents of C and N in the fuel. To assess the effect of combustion units on the PEI of biomass, based on the PEICO-C, PEICO2-C, and PEINOx-N, the total PEIs of four biomass fuels with widely varying C and N contents were calculated, as shown in Fig. 10. The numbers in the figure indicate the combustion unit corresponding to that sample.
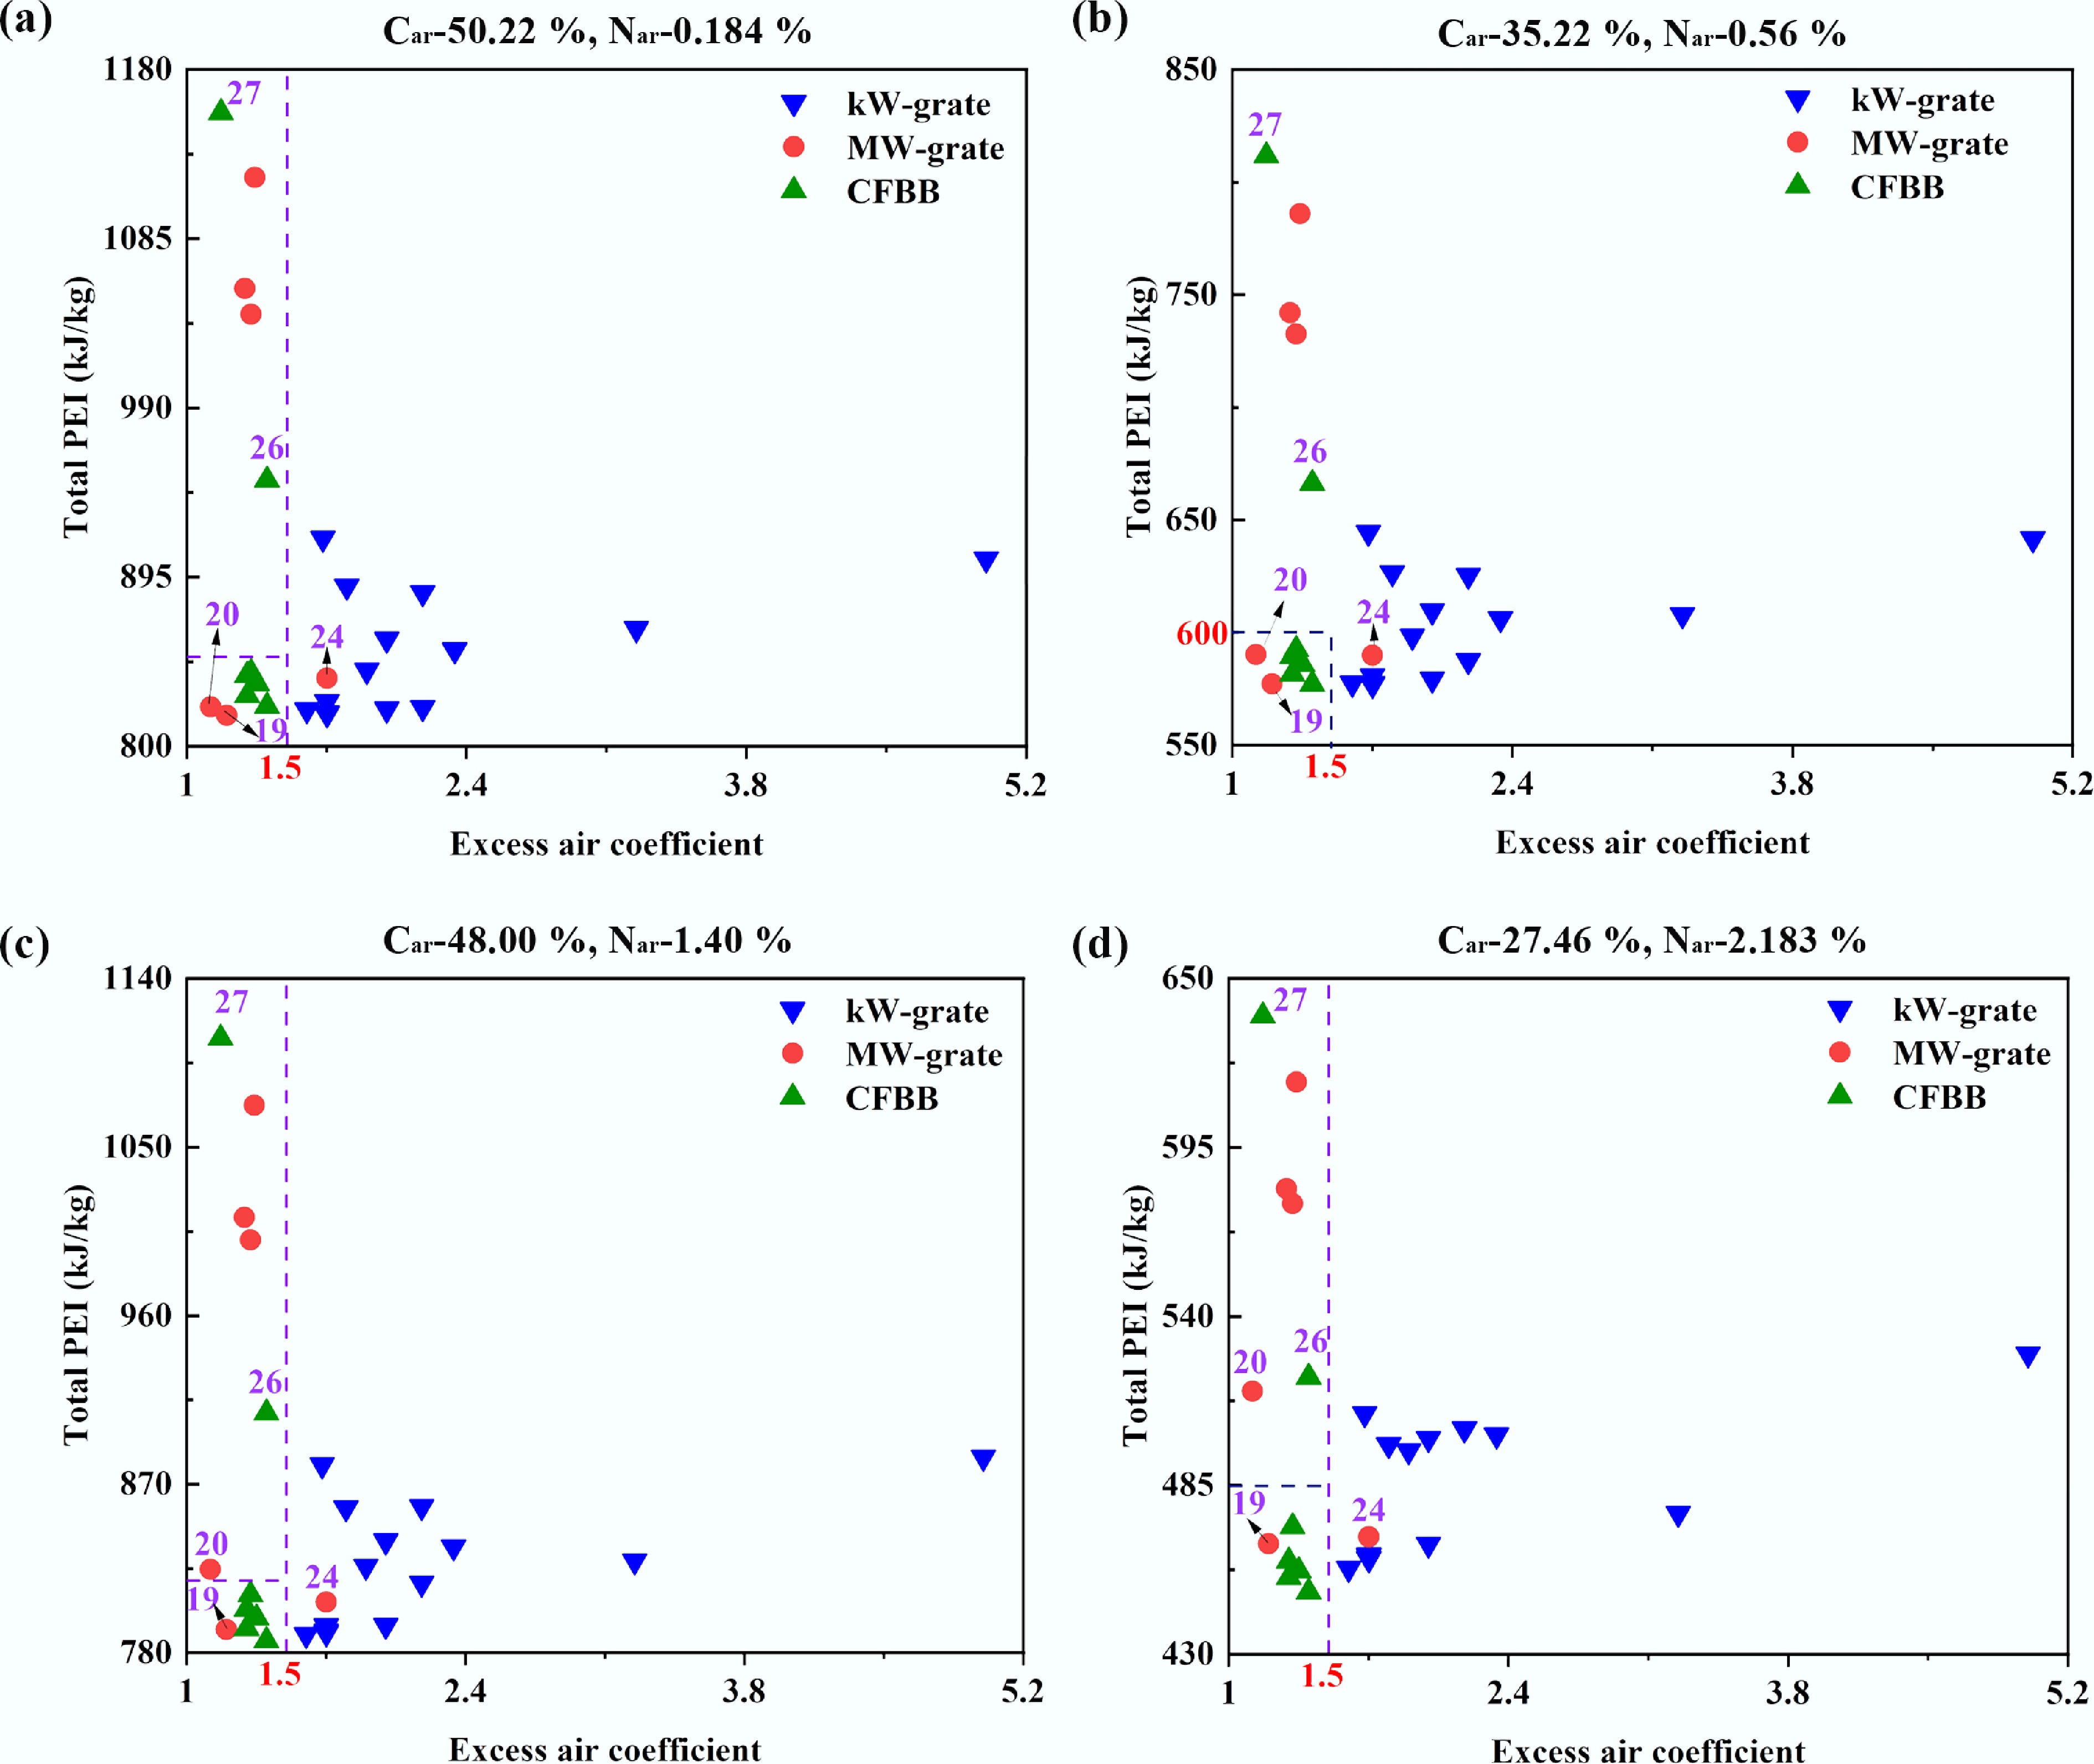
Figure 10.
Total PEI of biomass. (a) Car-50.22% and Nar-0.184%. (b) Car-35.22% and Nar-0.56%. (c) Car-48.00% and Nar-1.40%. (d) Car-27.46% and Nar-2.183%.
For open burning, due to the high PEICO-C, the total PEI is much higher than that of other combustion methods, as shown in Table 4, so it is the worst combustion method. Since there is no concept of excess air coefficient for open burning, it is not shown in Fig. 10.
Table 4. The total PEI for open burning
Biomass fuel The total PEI (kJ/kg) No. 1 No. 2 No. 3 No. 4 Car-50.22%, Nar-0.184% 1,267.55 1,374.11 1,538.41 1,516.93 Car-35.22%, Nar-0.56% 892.86 967.37 1,078.94 1,083.43 Car-48.00%, Nar-1.40% 1,222.62 1,323.84 1,470.48 1,505.49 Car-27.46%, Nar-2.183% 711.97 769.17 841.32 924.06 It is observed that low PEI can be obtained by all combustion methods. Taking Fig. 10b as an example, for samples with total PEI below 600 kJ/kg, their combustion methods cover kW-grate, MW-grate, and CFBB, with varying excess air coefficient. A high excess air coefficient means more energy consumption and more heat loss in exhaust gas. Therefore, it is advisable to consider the excess air coefficient as the cost of achieving low PEI. A combustion unit that achieves a low PEI with a low excess air coefficient is considered an 'optimal combustion unit' for reducing the PEI of biomass, as shown in the circle part.
Comparing the samples with low PEI, for the same PEI, the kW-grate requires a higher excess air coefficient (1.6–5) compared to the MW-grate and CFBB, making it less cost-effective for reducing PEI. For MW-grade grates, only the No. 19 and 20 samples show better PEI reduction performance. This is mainly due to the unique design of the inclined reciprocating grate. There is relative motion between the reciprocating grate and the fuel. Due to the constant raking action of the movable grate pieces, part of the new fuel is pushed and fed into the hot fire bed below, which is already on fire and burning, and the ignition conditions are greatly improved. At the same time, the fuel layer is raked and loosened, enhancing the permeability of fuel, promoting the disturbance of the combustion bed, and the coke and fuel block outer surface of the ash shell is mashed or comes off due to extrusion and flipping. These factors are conducive to combustion enhancement and burnout. The total PEI of the No. 24 sample is low, but its excess air coefficient is the highest of all MW-class units, so it is not in the 'optimal combustion unit' region. In addition to the No. 19, 20, and 24 samples, other samples using MW-grate have poor combustion performance, resulting in PEICO-C being too high, the total PEI being too high, and separating from the 'optimal combustion unit' region.
The high PEI of the No. 26 and 27 samples is due to their special fuel, so they cannot be used as evidence for measuring the impact of CFBB on PEI. Except for the No. 26 and 27 samples, the PEIs of other samples using CFBB are very low, and their excess air coefficients are also low. Therefore, CFBB is a good combustion method for achieving low PEI.
As the C content of the biomass fuel decreased from 50.22% to 27.46%, the total PEI decreased for all samples, and the minimum value of total PEI decreased from 817.4 to 450.2 kJ/kg. This is because CO2 contributes the majority of the PEI, and the decrease in C content makes the amount of CO2 lower. The same conclusion is drawn in another literature[14]. It is worth noting that the No. 20 sample gradually moves out of the 'optimal combustion unit' region as the N content of the biomass fuel increases. When the N content is 2.183 %, the total PEI of the No. 20 sample is 515.6 kJ/kg, which is much higher than the minimum PEI under this condition (450.2 kJ/kg). It can be obtained from Fig. 6 that, compared with other MW-grates and CFBBs, the PEINOx-N of the No. 20 sample is much higher. Therefore, when the N content in the fuel is higher, the PEINOx increases significantly, and the total PEI is significantly higher than other samples in the 'optimal combustion unit' region. Due to its high PEINOx-N (911.1 kJ/kg), the No. 19 sample also shows a trend of gradually moving away from the 'optimal combustion unit' region as the N content in the biomass fuel increases. The N content in biomass fuel is low, and the PEINOx-N of the No. 19 sample (911.1 kJ/kg) is much lower than that of the No. 20 sample (3,175 kJ/kg). Therefore, the No. 19 sample is still in the 'optimal combustion unit' region when the N content is 2.183%, but its total PEI is closer to the edge of the 'optimal combustion unit' region.
In general, CFBB and inclined reciprocating grates are the best combustion methods to reduce the total PEI of gaseous pollutants. For biomass fuels with high N content, the inclined reciprocating grate is not applicable, which may lead to a high total PEI.
-
When biomass is treated by open burning, the air fails to fully contact the fuel near the ground. Consequently, its PEICO-C (965.8–1,550 kJ/kg) is much higher than that of grate and CFBB (0.998–728 kJ/kg), resulting in the PEI of biomass being higher (711.97–1,538.41 kJ/kg).
When biomass is treated by kW-grate, its PEI can be as low as that of MW-grate and CFBB (450.25–841.43 kJ/kg) due to the similar combustion environment. However, due to the high excess air coefficient (1.6–5) required, it means greater fan energy consumption, so the cost-effectiveness of reducing biomass PEI is low.
Reciprocating grate and CFBB are the optimal combustion methods for reducing the PEI of biomass. However, when the N content in biomass is high (i.e., 2.183%), the reciprocating grate method results in higher PEI (515.6 kJ/kg) compared with the CFBB method (450.25–471.50 kJ/kg) due to its high PEINOx-N (3,175 kJ/kg). The high PEINOx-N is due to the high temperature in the reciprocating grate furnace, which increases the generation of NOx.
The exergy method used in this study can effectively assess various combustion methods and guide the design and operation of biomass boilers.
-
This study focuses on CO, CO2, and NOx, and more pollutants, such as PM2.5 and heavy metals, can be included in the future[49,50]. A more comprehensive PEI assessment method can be established to more fully reveal the environmental footprint of biomass combustion.
The results of this study show that CFBB technology can achieve lower PEI, but its investment and operating costs are higher. In the future, technical and economic analysis and life cycle cost should be combined to explore the optimal technical path to achieve the balance of environmental and economic benefits in specific scenarios.
With the development of co-firing technology of biomass and other solid waste (sludge, solid waste-derived fuel), it is also a valuable research direction to evaluate the influence of different combustion modes on the PEI of mixed fuel.
-
The authors confirm contributions to the paper as follows: Zhihong Liu: study conception and design, data collection, analysis and interpretation of results; Ehab Mostafa: study conception and design; Man Zhang: draft manuscript preparation; Wei Luo: data collection; Wenke Zhao: analysis and interpretation of results; Yaning Zhang: draft manuscript preparation, Study conception and design. All authors reviewed the results and approved the final version of the manuscript.
-
The data that support the findings of this study are available upon request from the corresponding author.
-
Financial support was provided by Heilongjiang Provincial Key R&D Program (Grant No. 2023ZX02C05), and Heilongjiang Provincial Key R&D Program 'Unveiling the Leader' Project (Grant No. 2023ZXJ02C04).
-
The authors declare that they have no conflict of interest.
-
The PEI of biomass combustion methods was evaluated using the exergy method.
Open burning results in the highest PEI of biomass (711.97–1,538.41 kJ/kg).
CFBB method exhibits low PEIs (450.25–841.43 kJ/kg) for different biomass fuels.
Reciprocating grate results in high PEI (515.6 kJ/kg) when the N content is high.
-
Full list of author information is available at the end of the article.
- Copyright: © 2026 by the author(s). Published by Maximum Academic Press, Fayetteville, GA. This article is an open access article distributed under Creative Commons Attribution License (CC BY 4.0), visit https://creativecommons.org/licenses/by/4.0/.
-
About this article
Cite this article
Liu Z, Luo W, Zhang M, Zhao W, Mostafa E, et al. 2026. Evaluating the potential environmental impact of biomass combustion methods using quantitative universal exergy method. Energy & Environment Nexus 2: e005 doi: 10.48130/een-0025-0019 

Evaluating the potential environmental impact of biomass combustion methods using quantitative universal exergy method
- Received: 01 October 2025
- Revised: 25 November 2025
- Accepted: 11 December 2025
- Published online: 28 January 2026
Abstract: Combustion is one of the most important methods for utilizing biomass energy. However, there is currently a lack of systematic assessment of how different combustion technologies affect the environmental impact of biomass utilization. This study addresses this gap by assessing the potential environmental impact (PEI) of biomass combustion. The biomass combustion methods were divided into open burning, kW-grate, MW-grate, and CFBB (Circulating Fluidized Bed Boiler). Based on the analysis of gaseous pollutants (CO, CO2, NOx) in 31 literature samples, the PEIs of CO and CO2 produced by per kg of C (PEICO-C and PEICO2-C), and the PEI of NOx produced by per kg of N (PEINOx-N) were calculated for each sample. Subsequently, the PEIs of four biomass fuels with different C and N contents were determined. Key findings reveal that open burning yields the highest overall PEI (711.97–1,538.41 kJ/kg), primarily due to its high PEI for CO. While kW-grate combustion shows improvement, its high excess air ratio (1.6–5) limits its cost-effectiveness. In contrast, the CFBB method consistently demonstrates the lowest PEIs (450.25–841.43 kJ/kg) across different biomass fuels, establishing it as a superior technology for minimizing environmental impact. For MW-grate, the reciprocating grate results in a high PEI (515.6 kJ/kg) when the N content in biomass is high (i.e., 2.183%). This study provides a quantitative foundation for selecting environmentally optimal biomass combustion technologies.
-
Key words:
- Biomass /
- Gaseous pollutants /
- CFBB /
- Open burning /
- Grate /
- Exergy