-
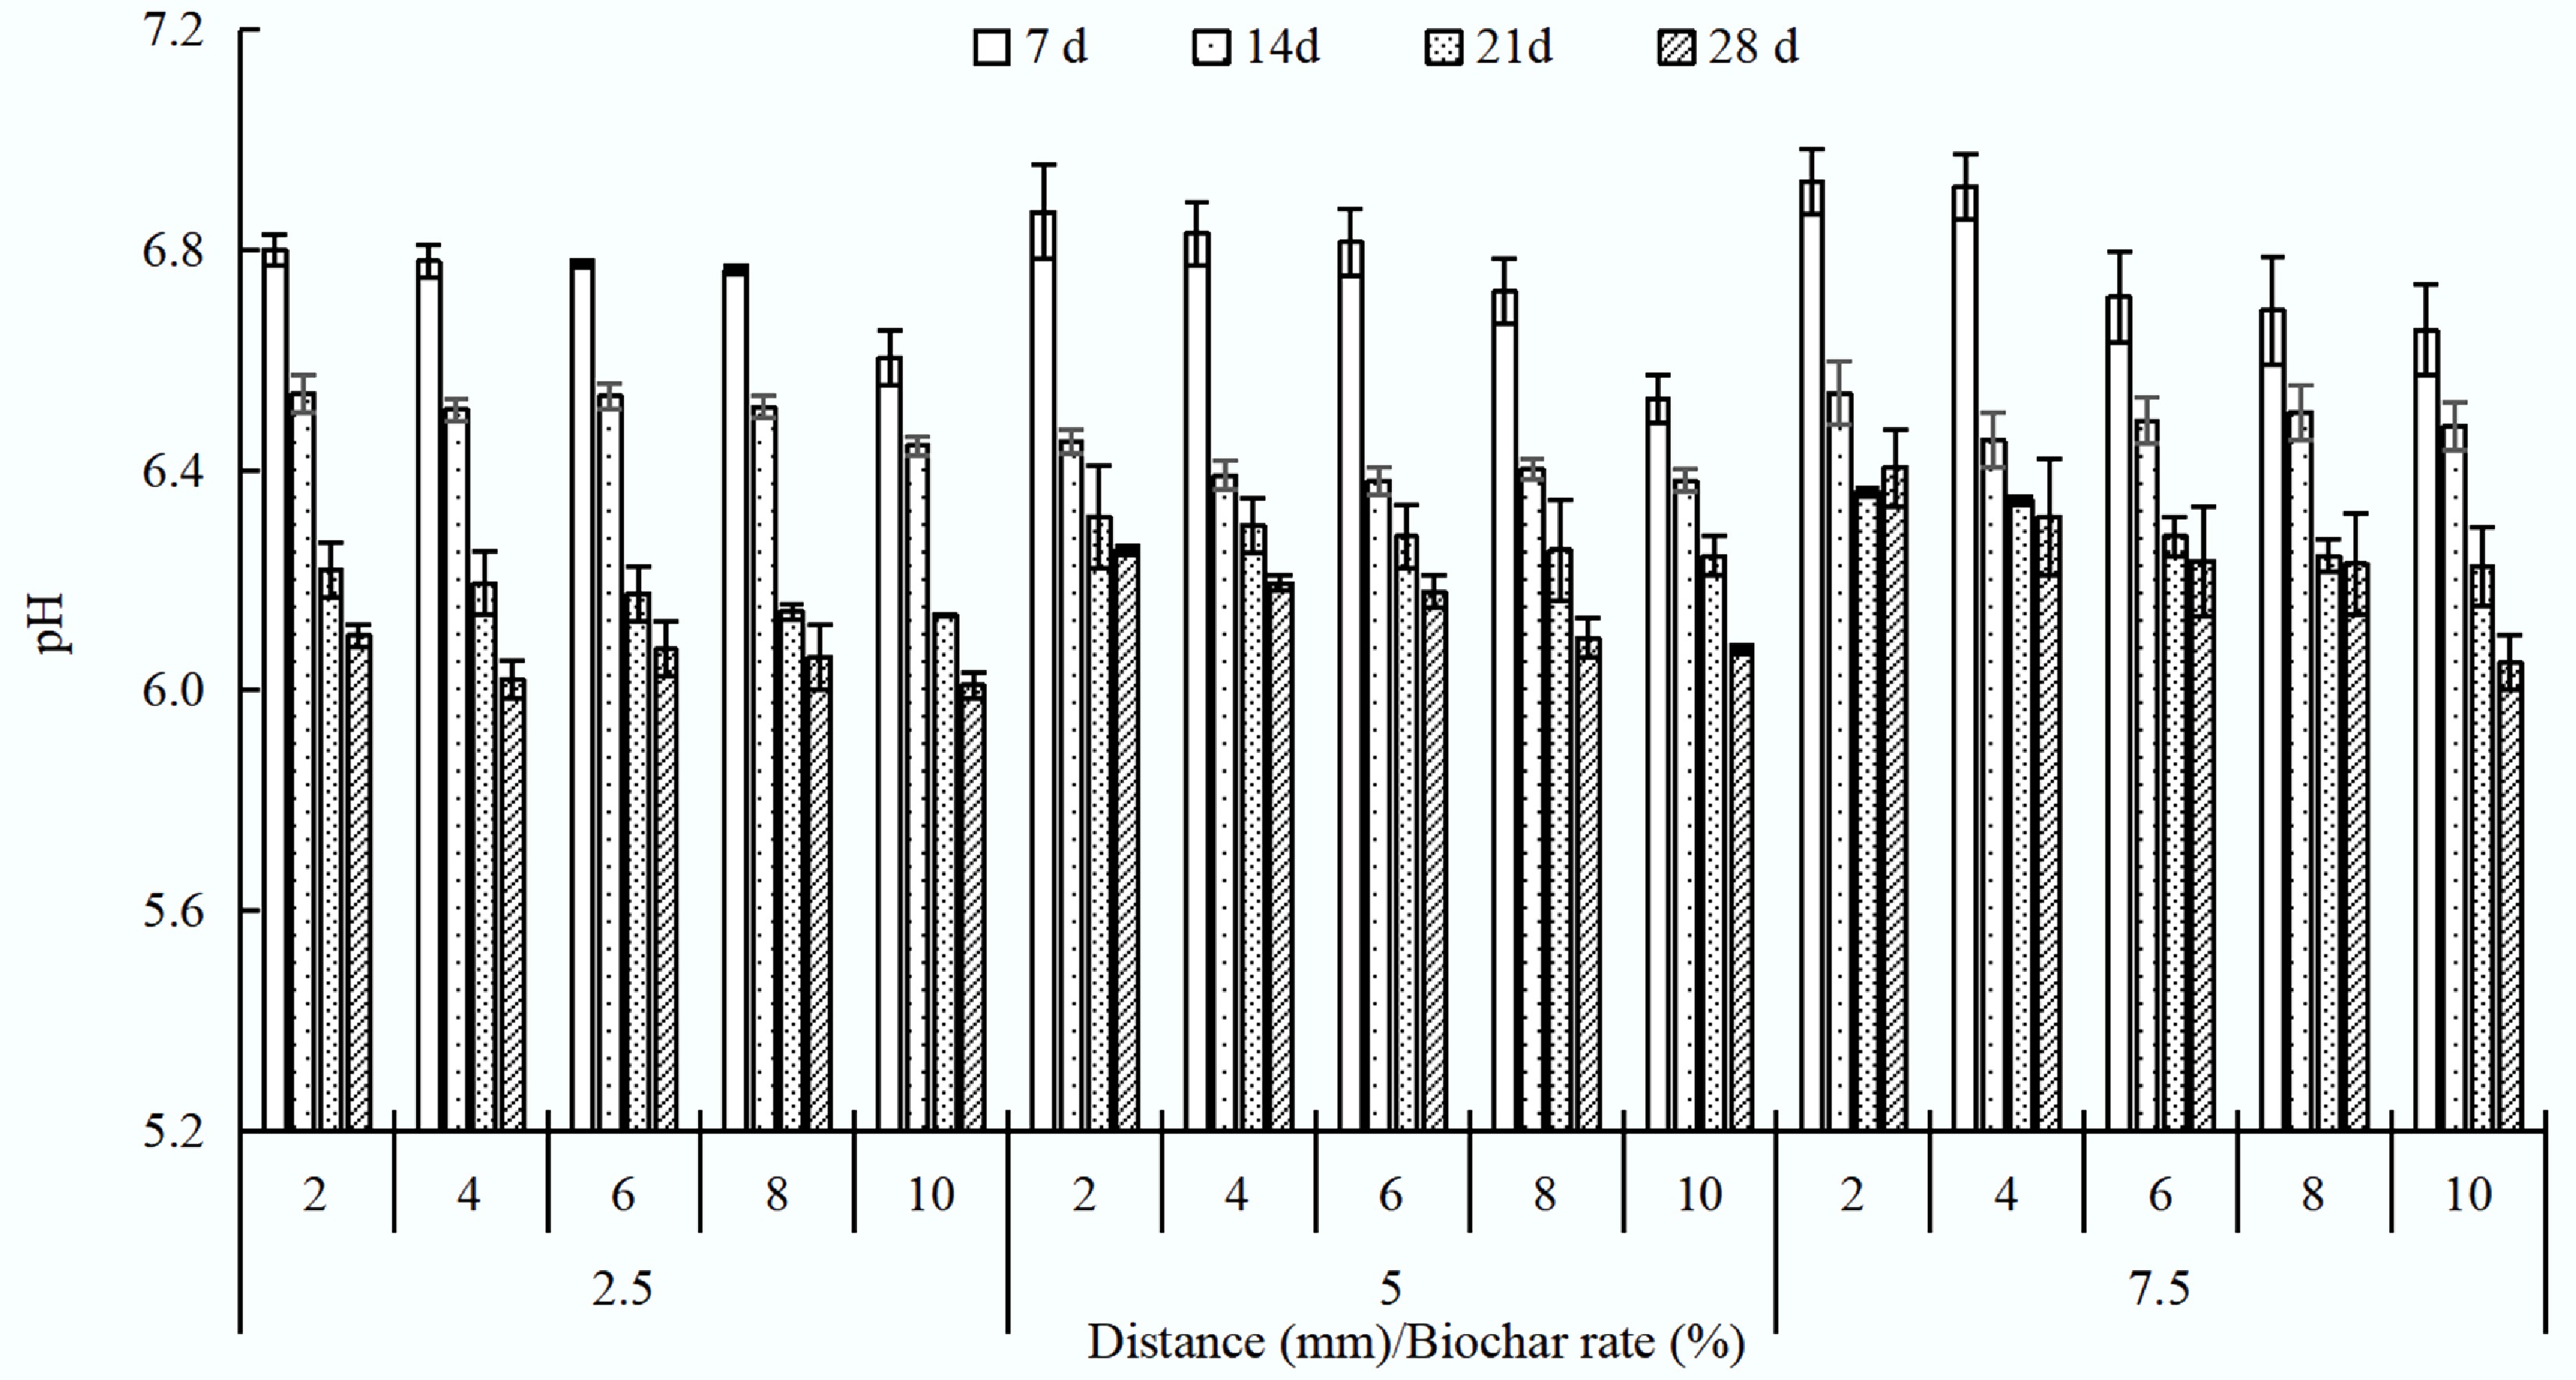
Figure 1.
The changes of pH in the charosphere.
-
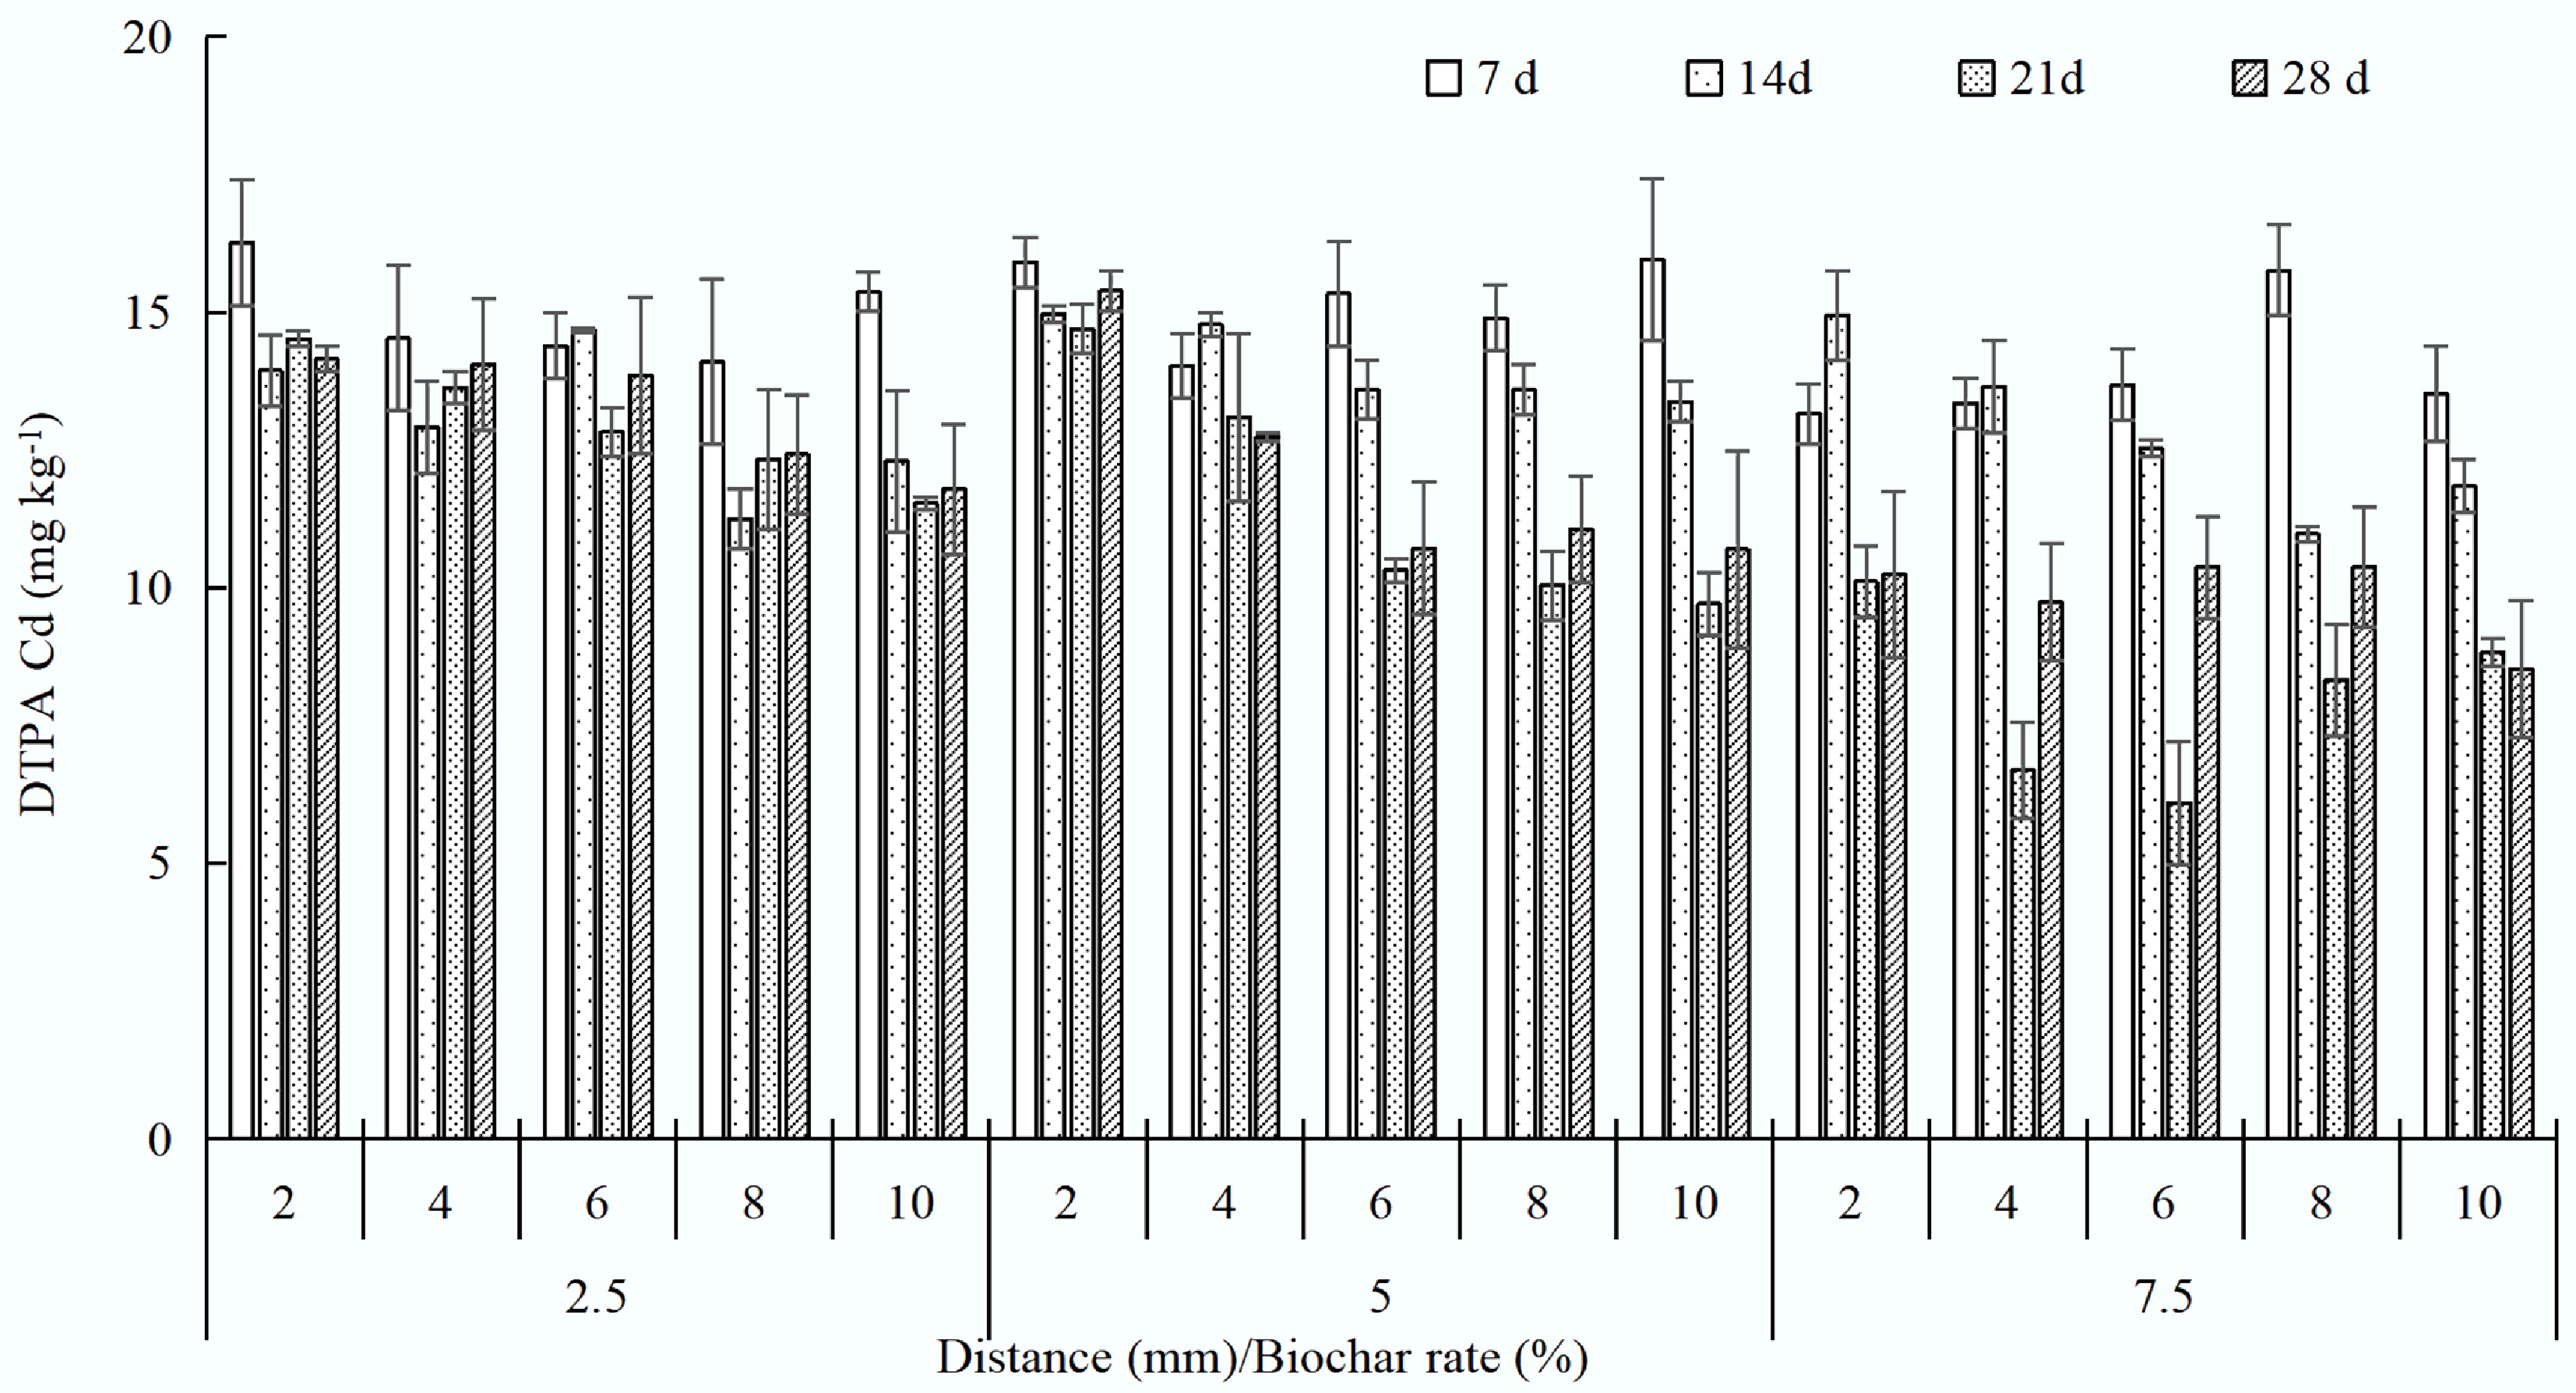
Figure 2.
The changes of DTPA Cd in the charosphere.
-
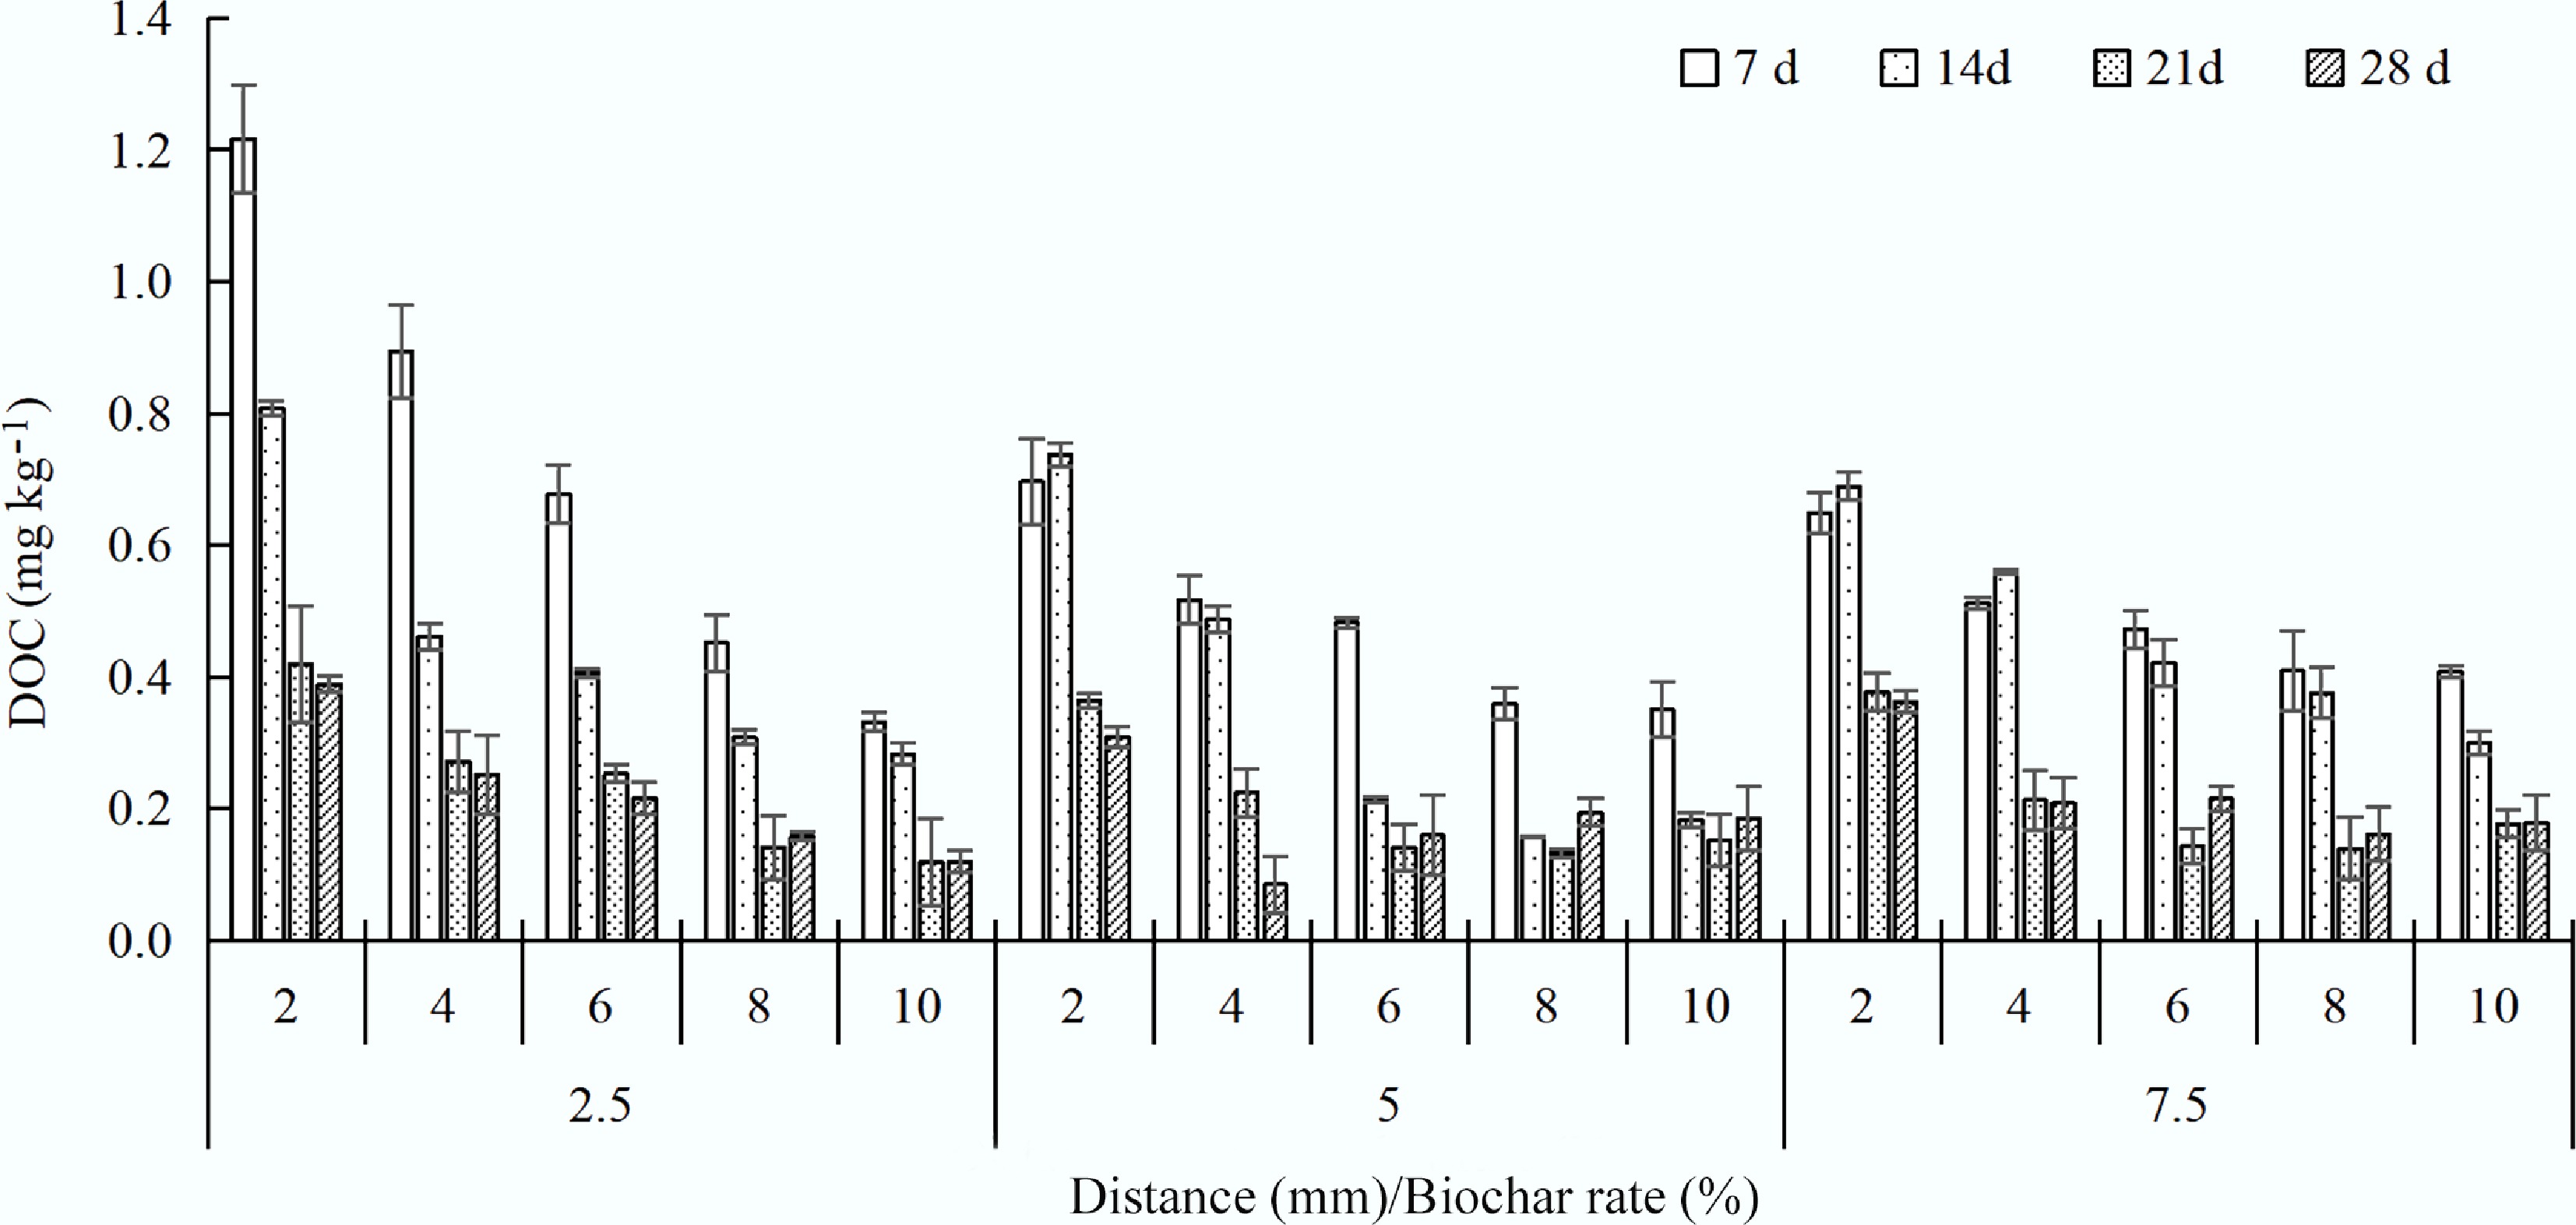
Figure 3.
The changes of DOC in the charosphere.
-
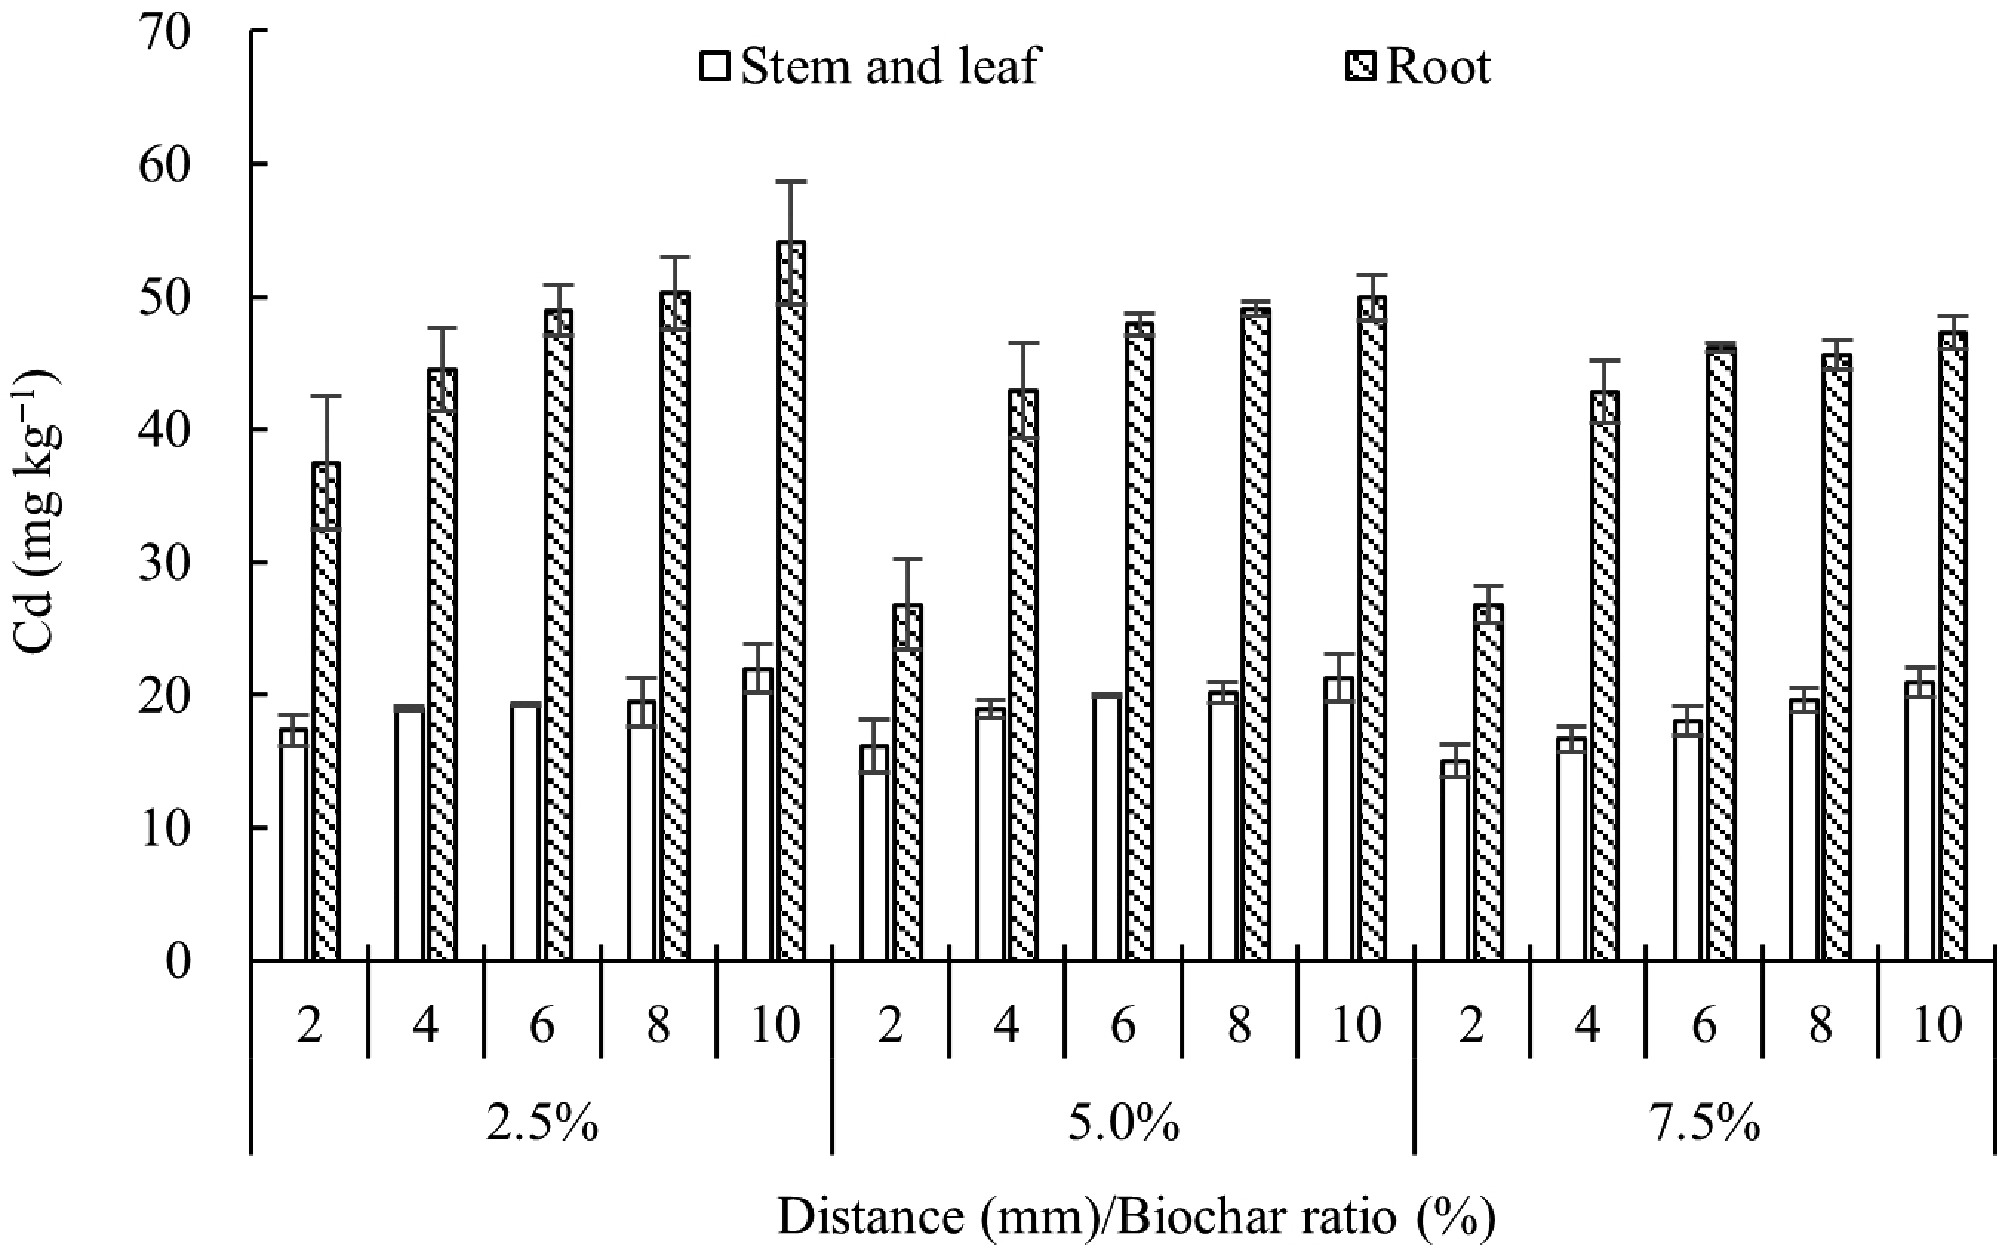
Figure 4.
The changes of Cd in the plant.
-
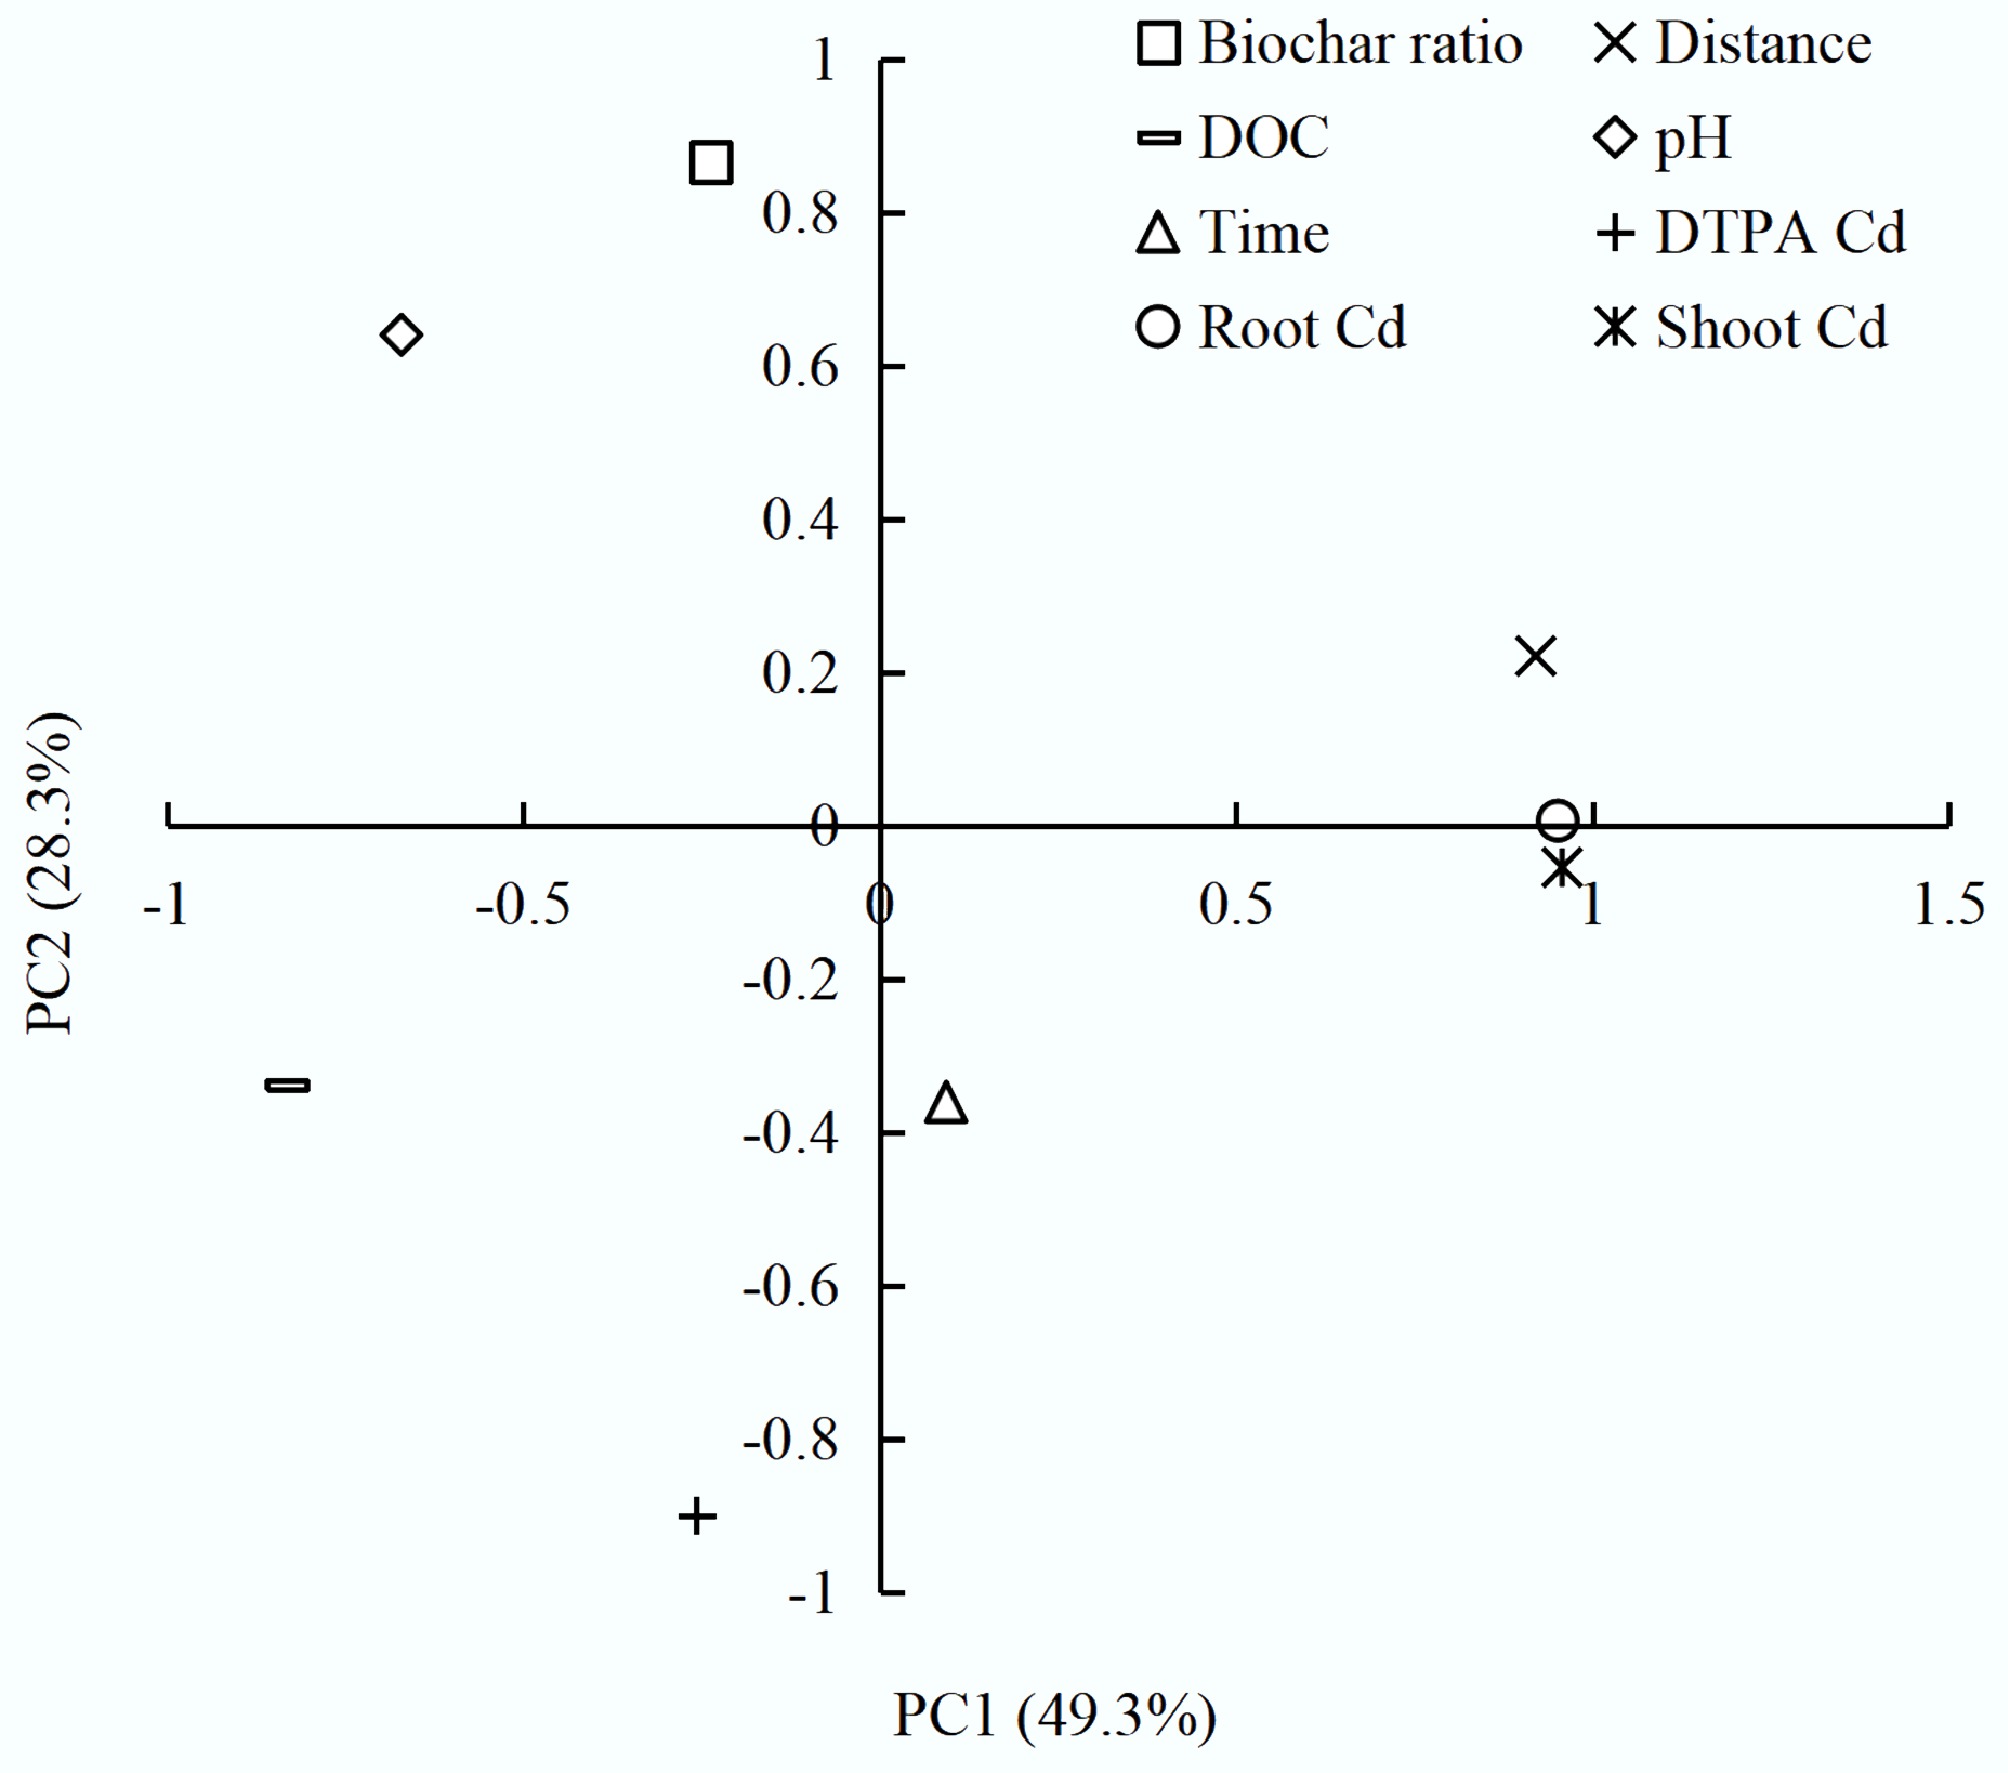
Figure 5.
Principal component analysis (PCA) of charosphere drivers: ordination of biochar rate, distance, time, pH, DOC, DTPA-Cd, and wheat Cd concentrations in roots and shoots.
Figures
(5)
Tables
(0)