-
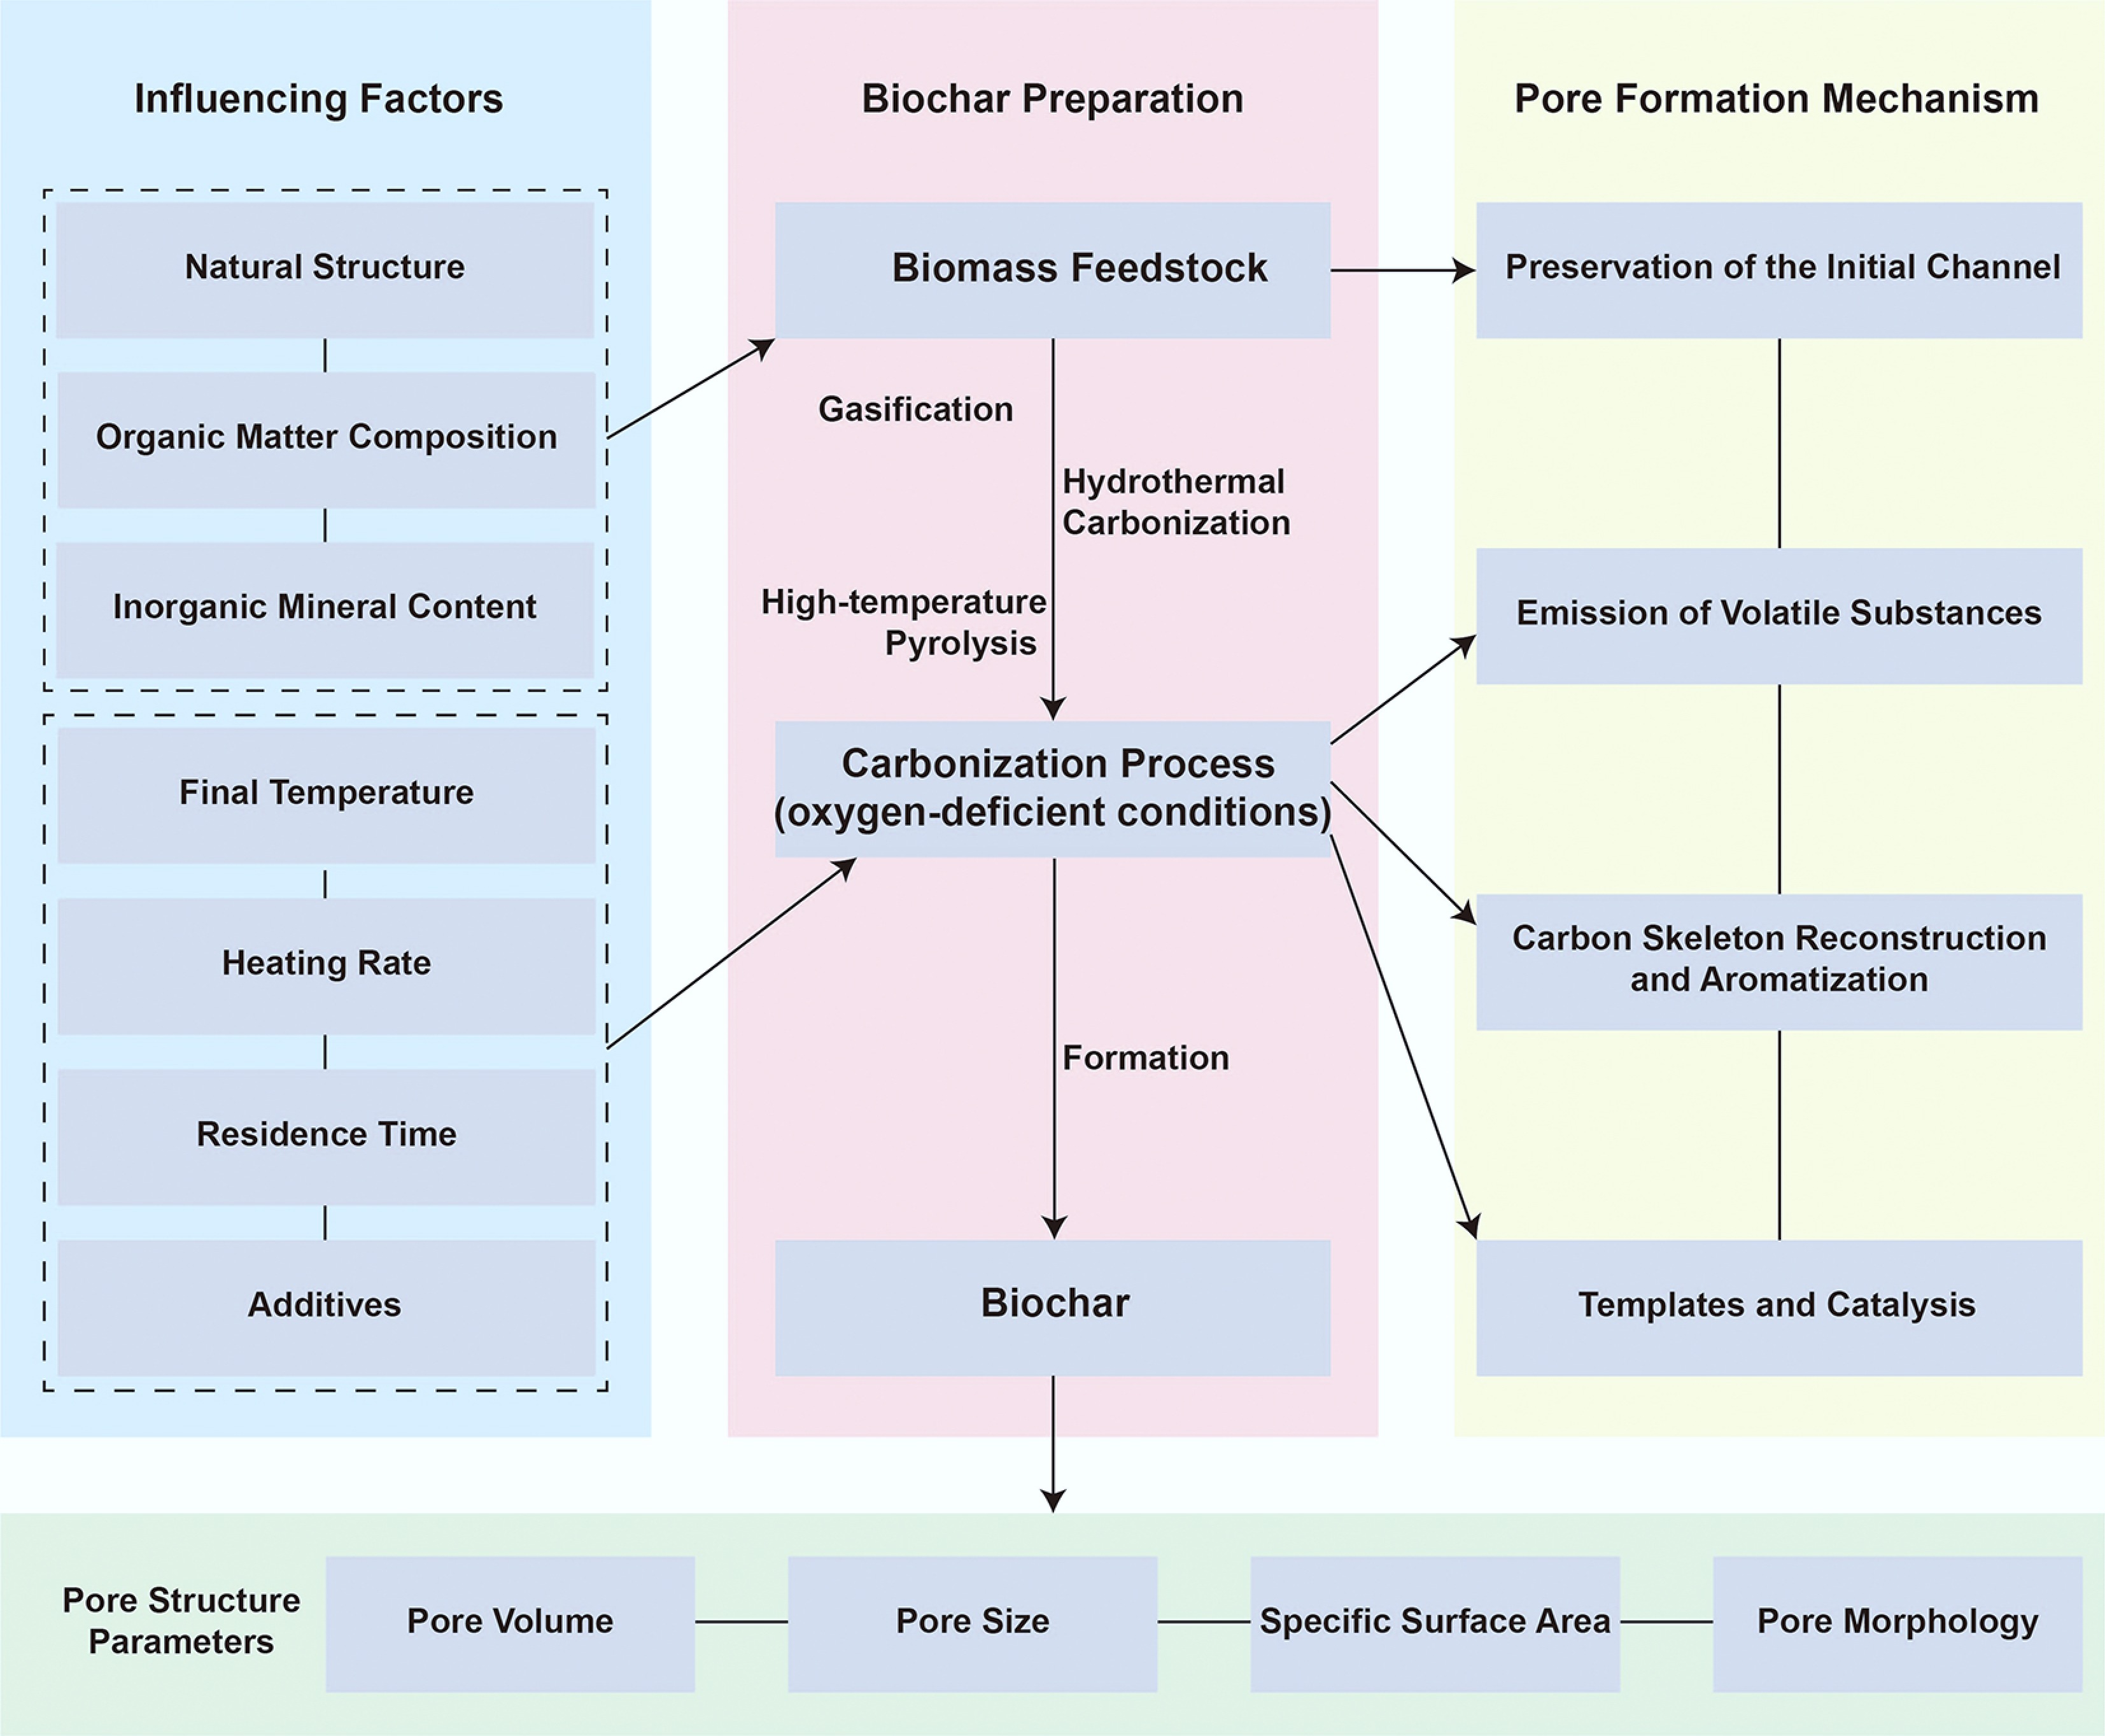
Figure 1.
Schematic diagram of the formation mechanism and influencing factors of biochar pore structure.
-
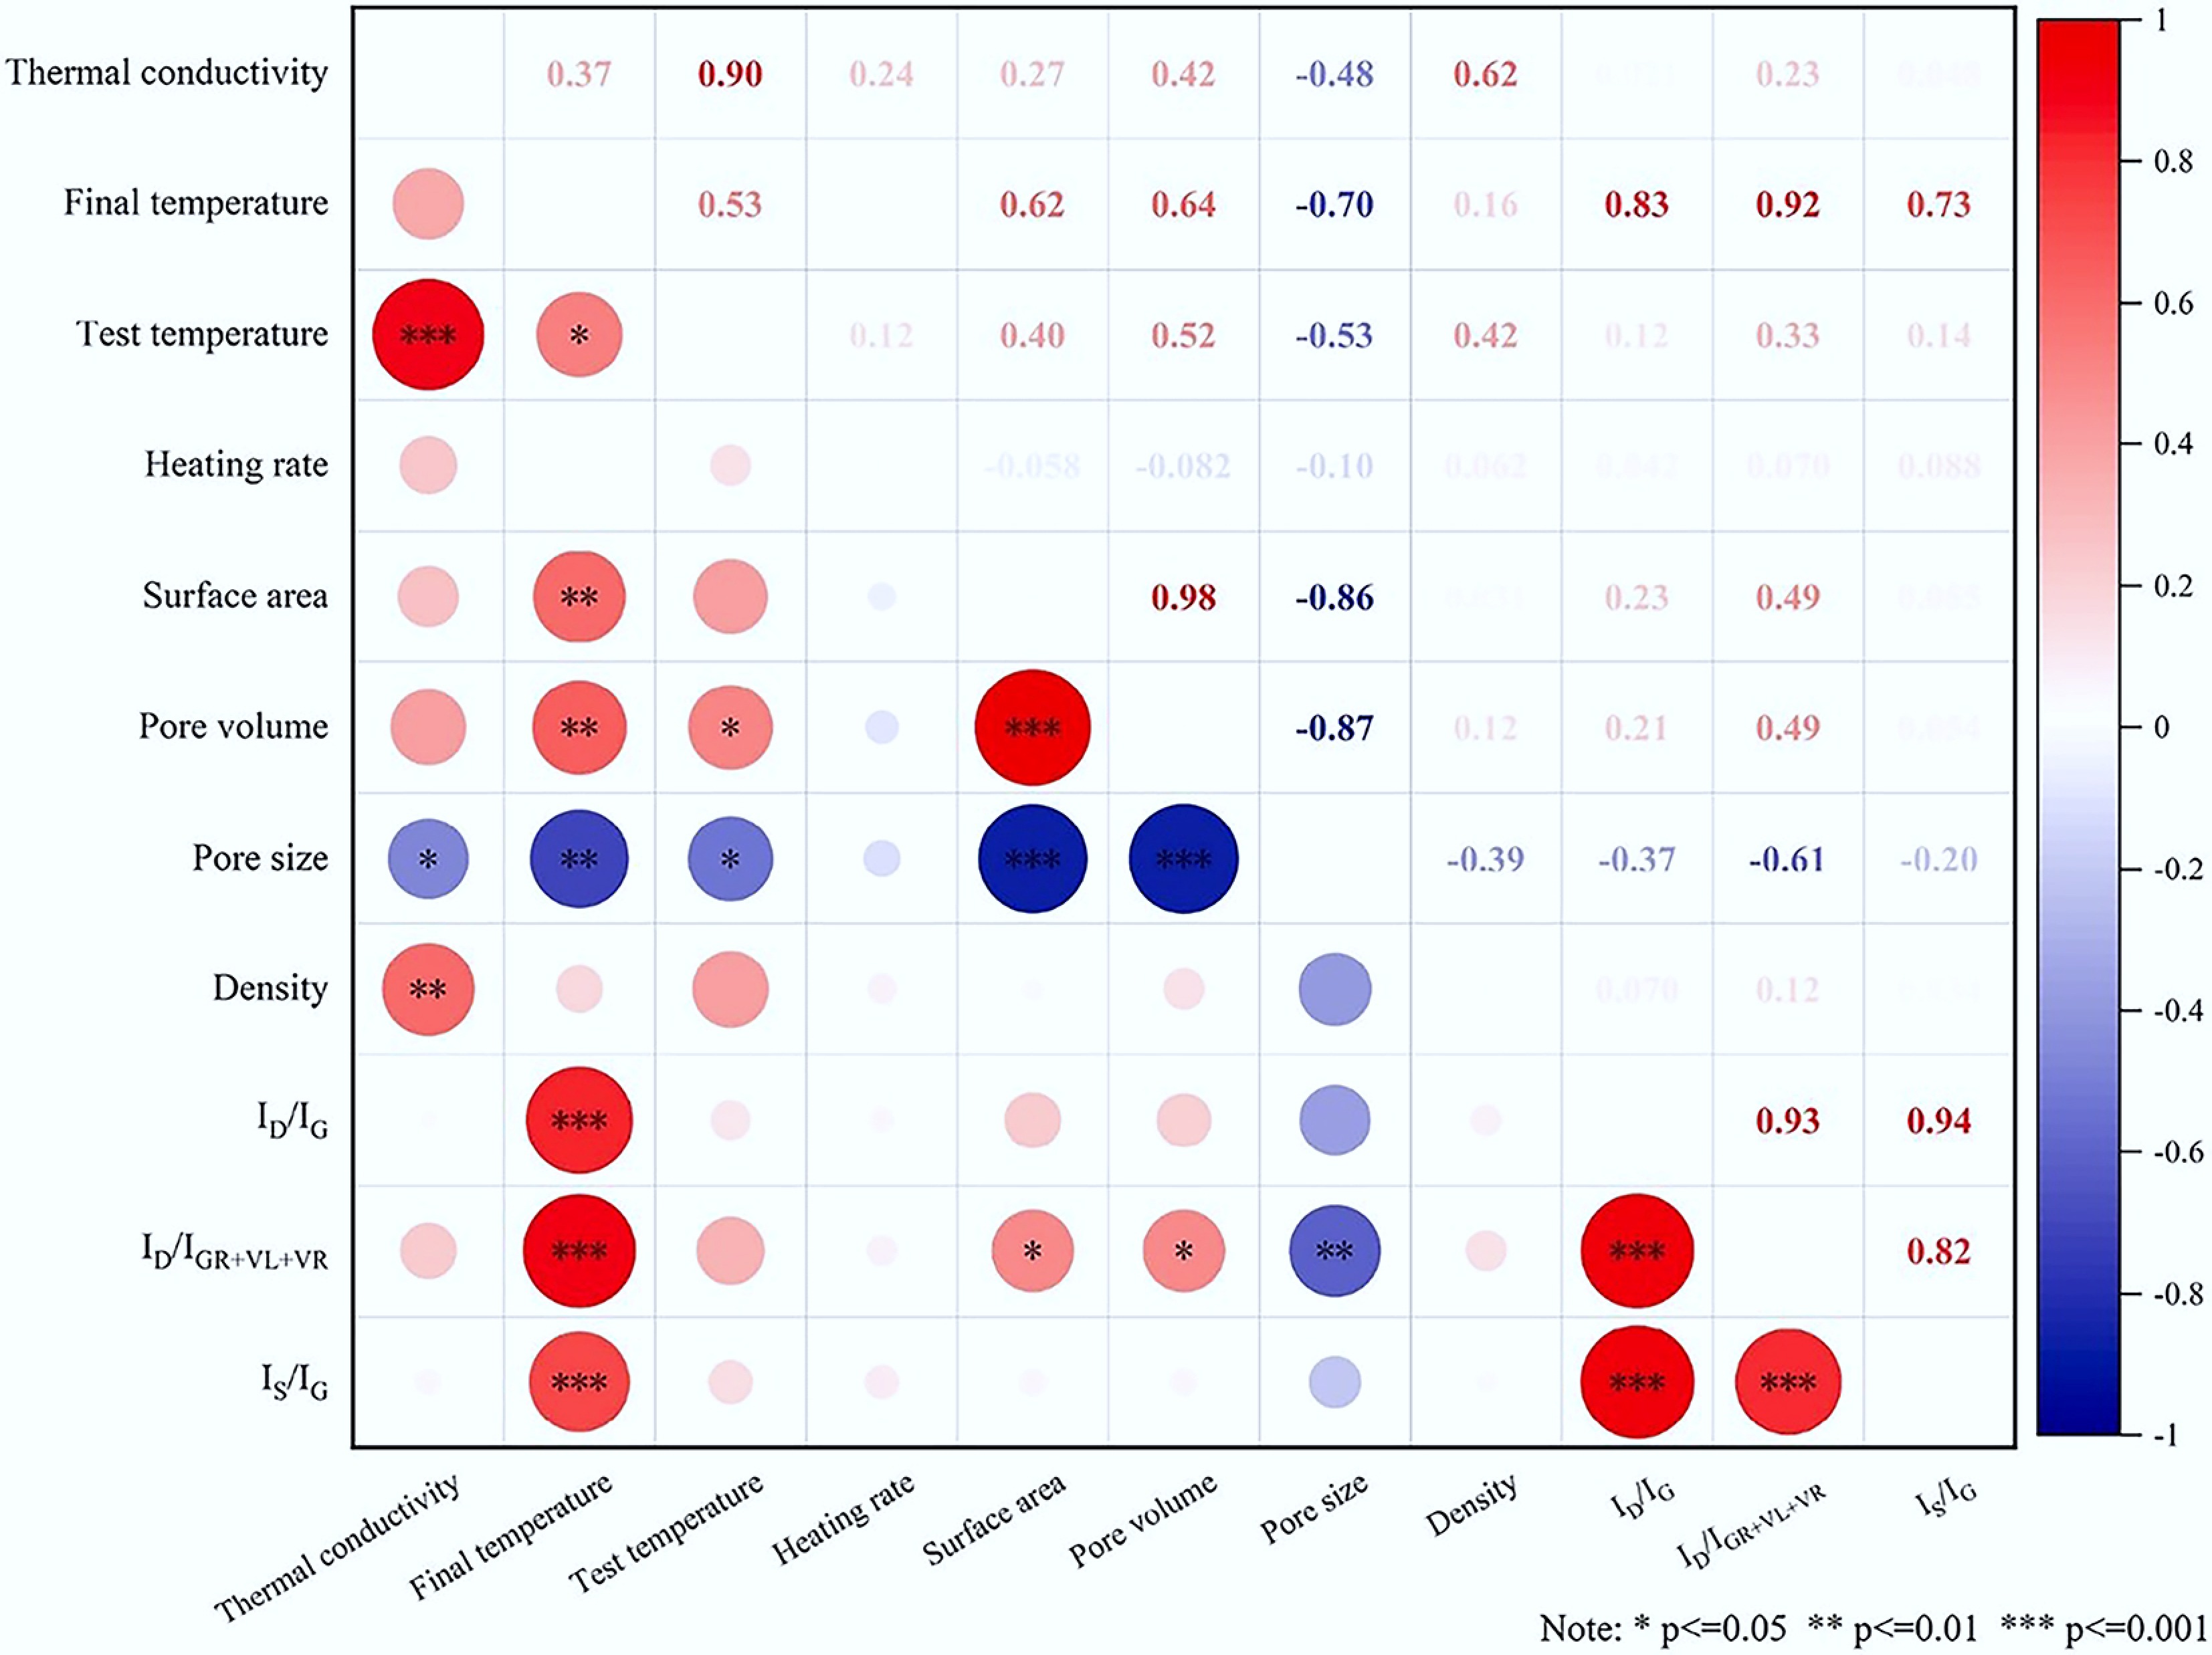
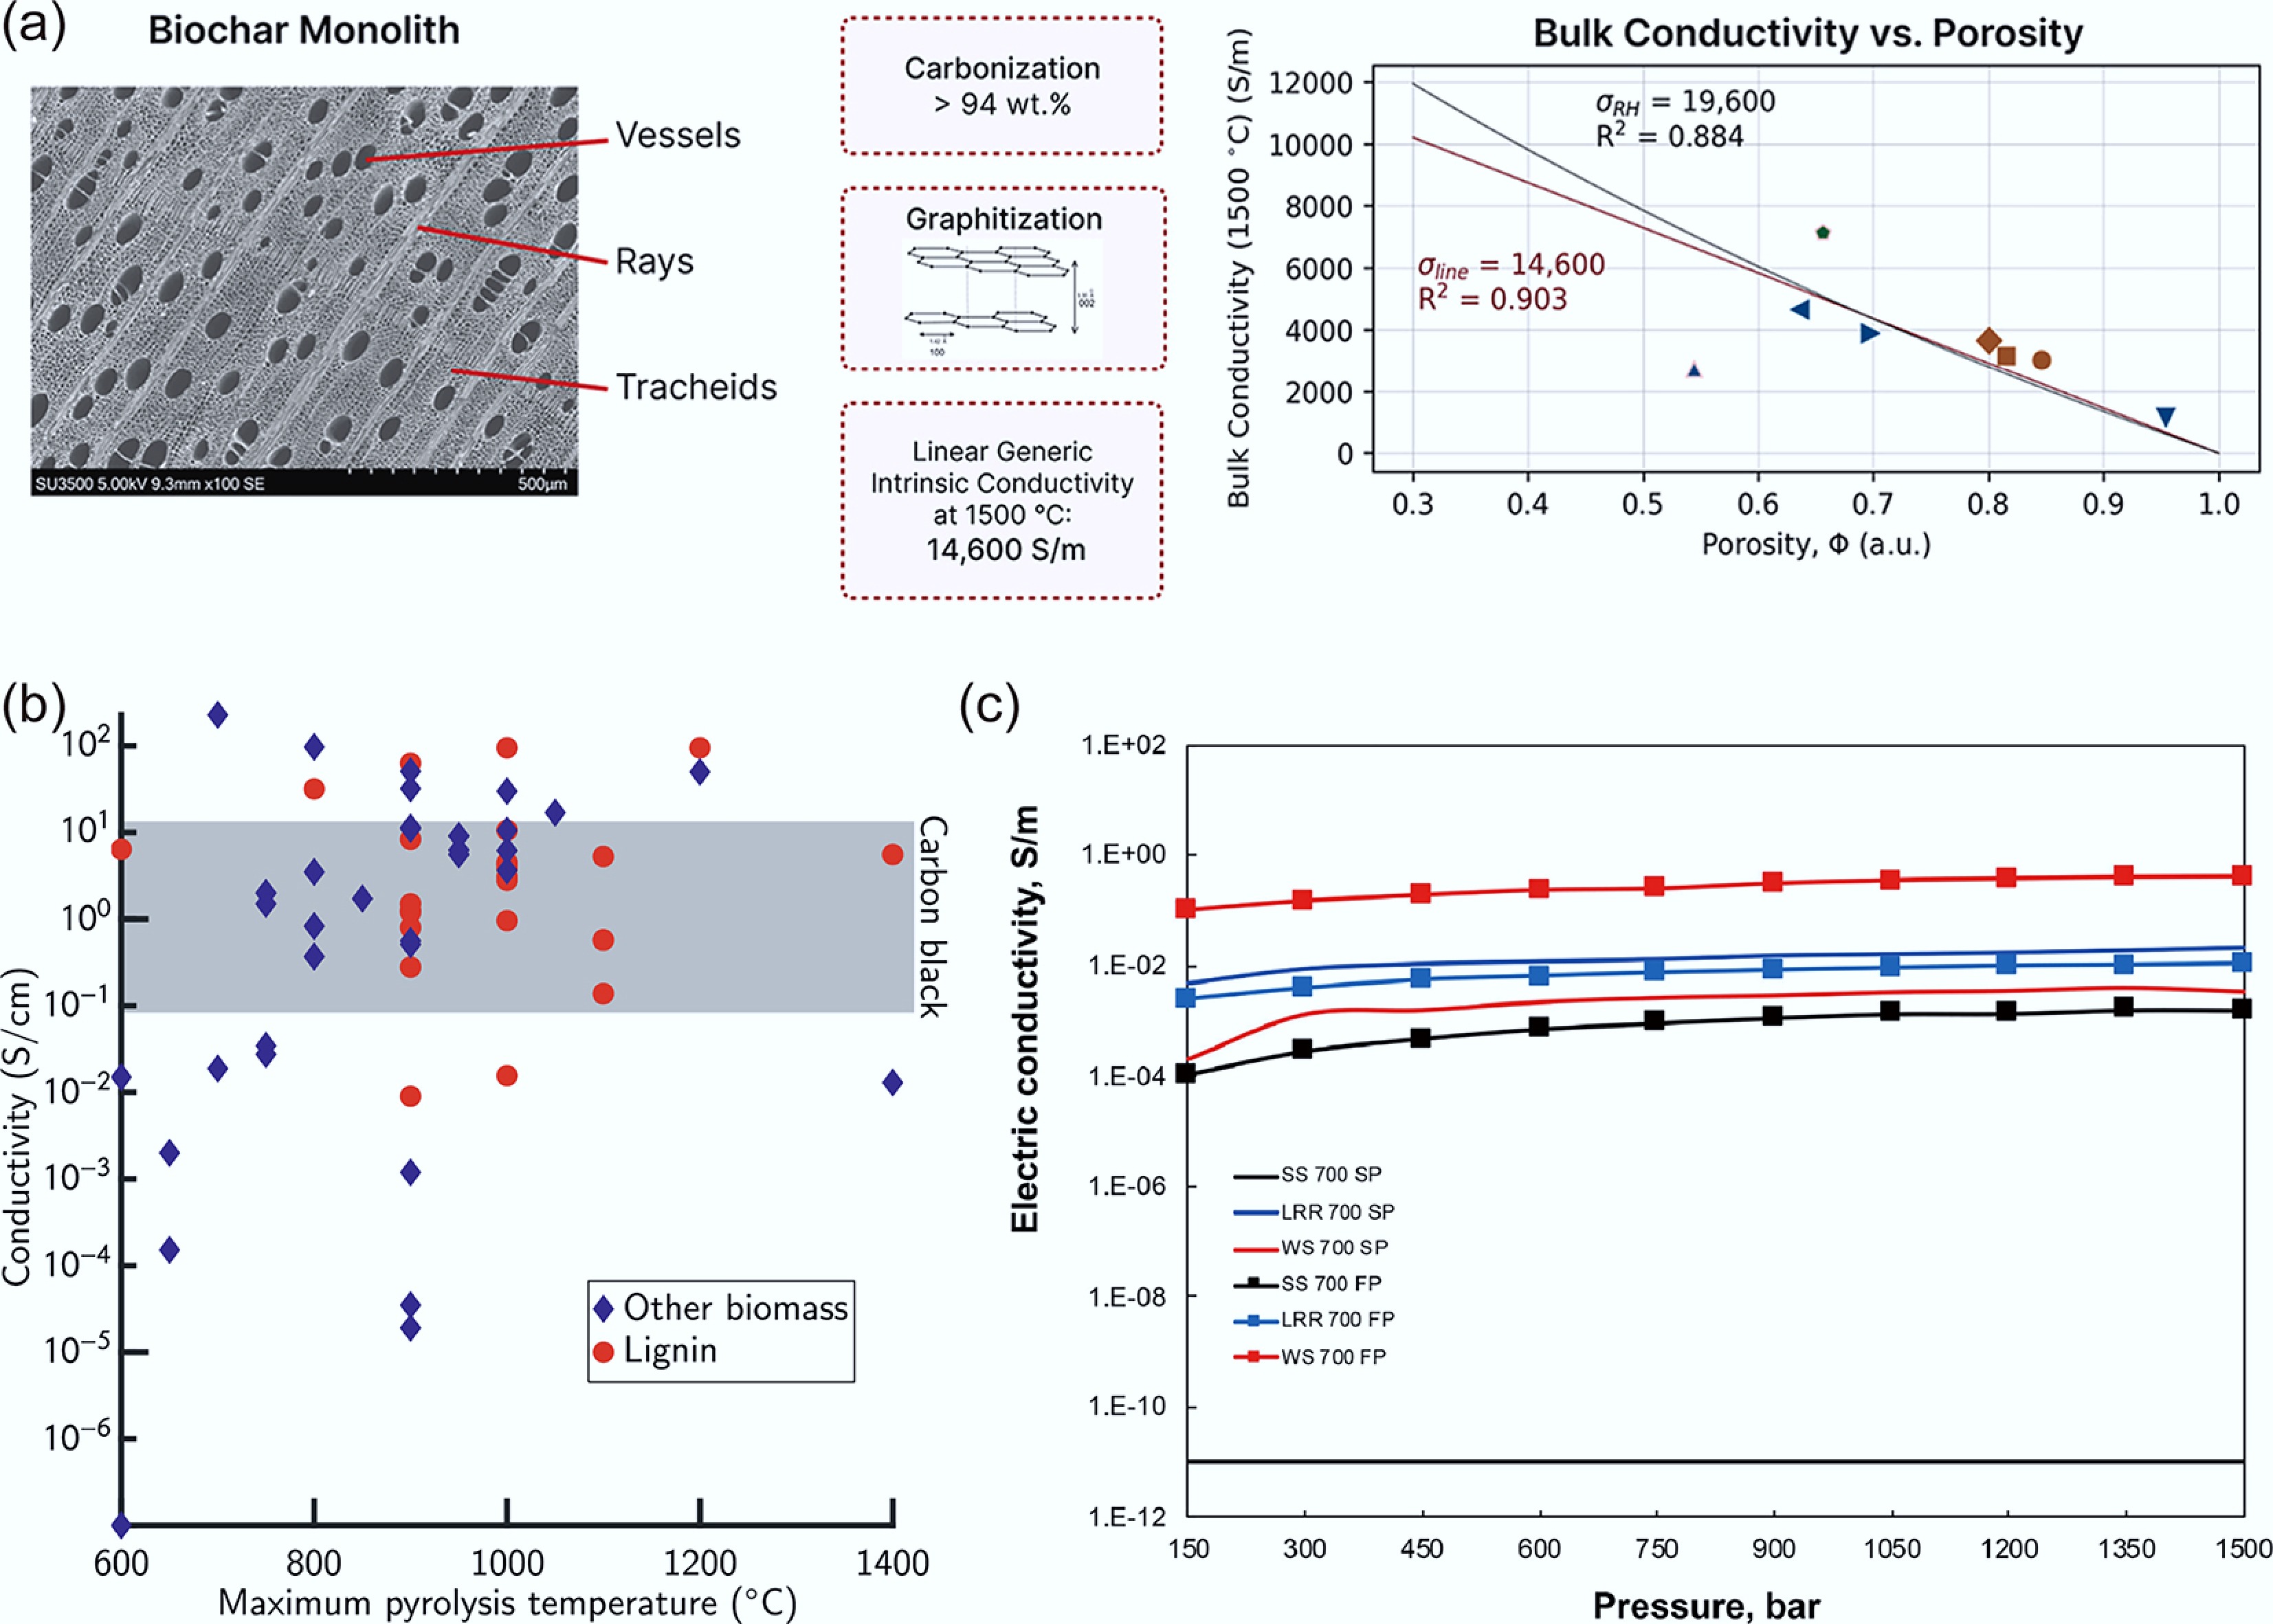
Figure 2.
Correlation analysis of thermal conductivity[64].
-
-
-
-
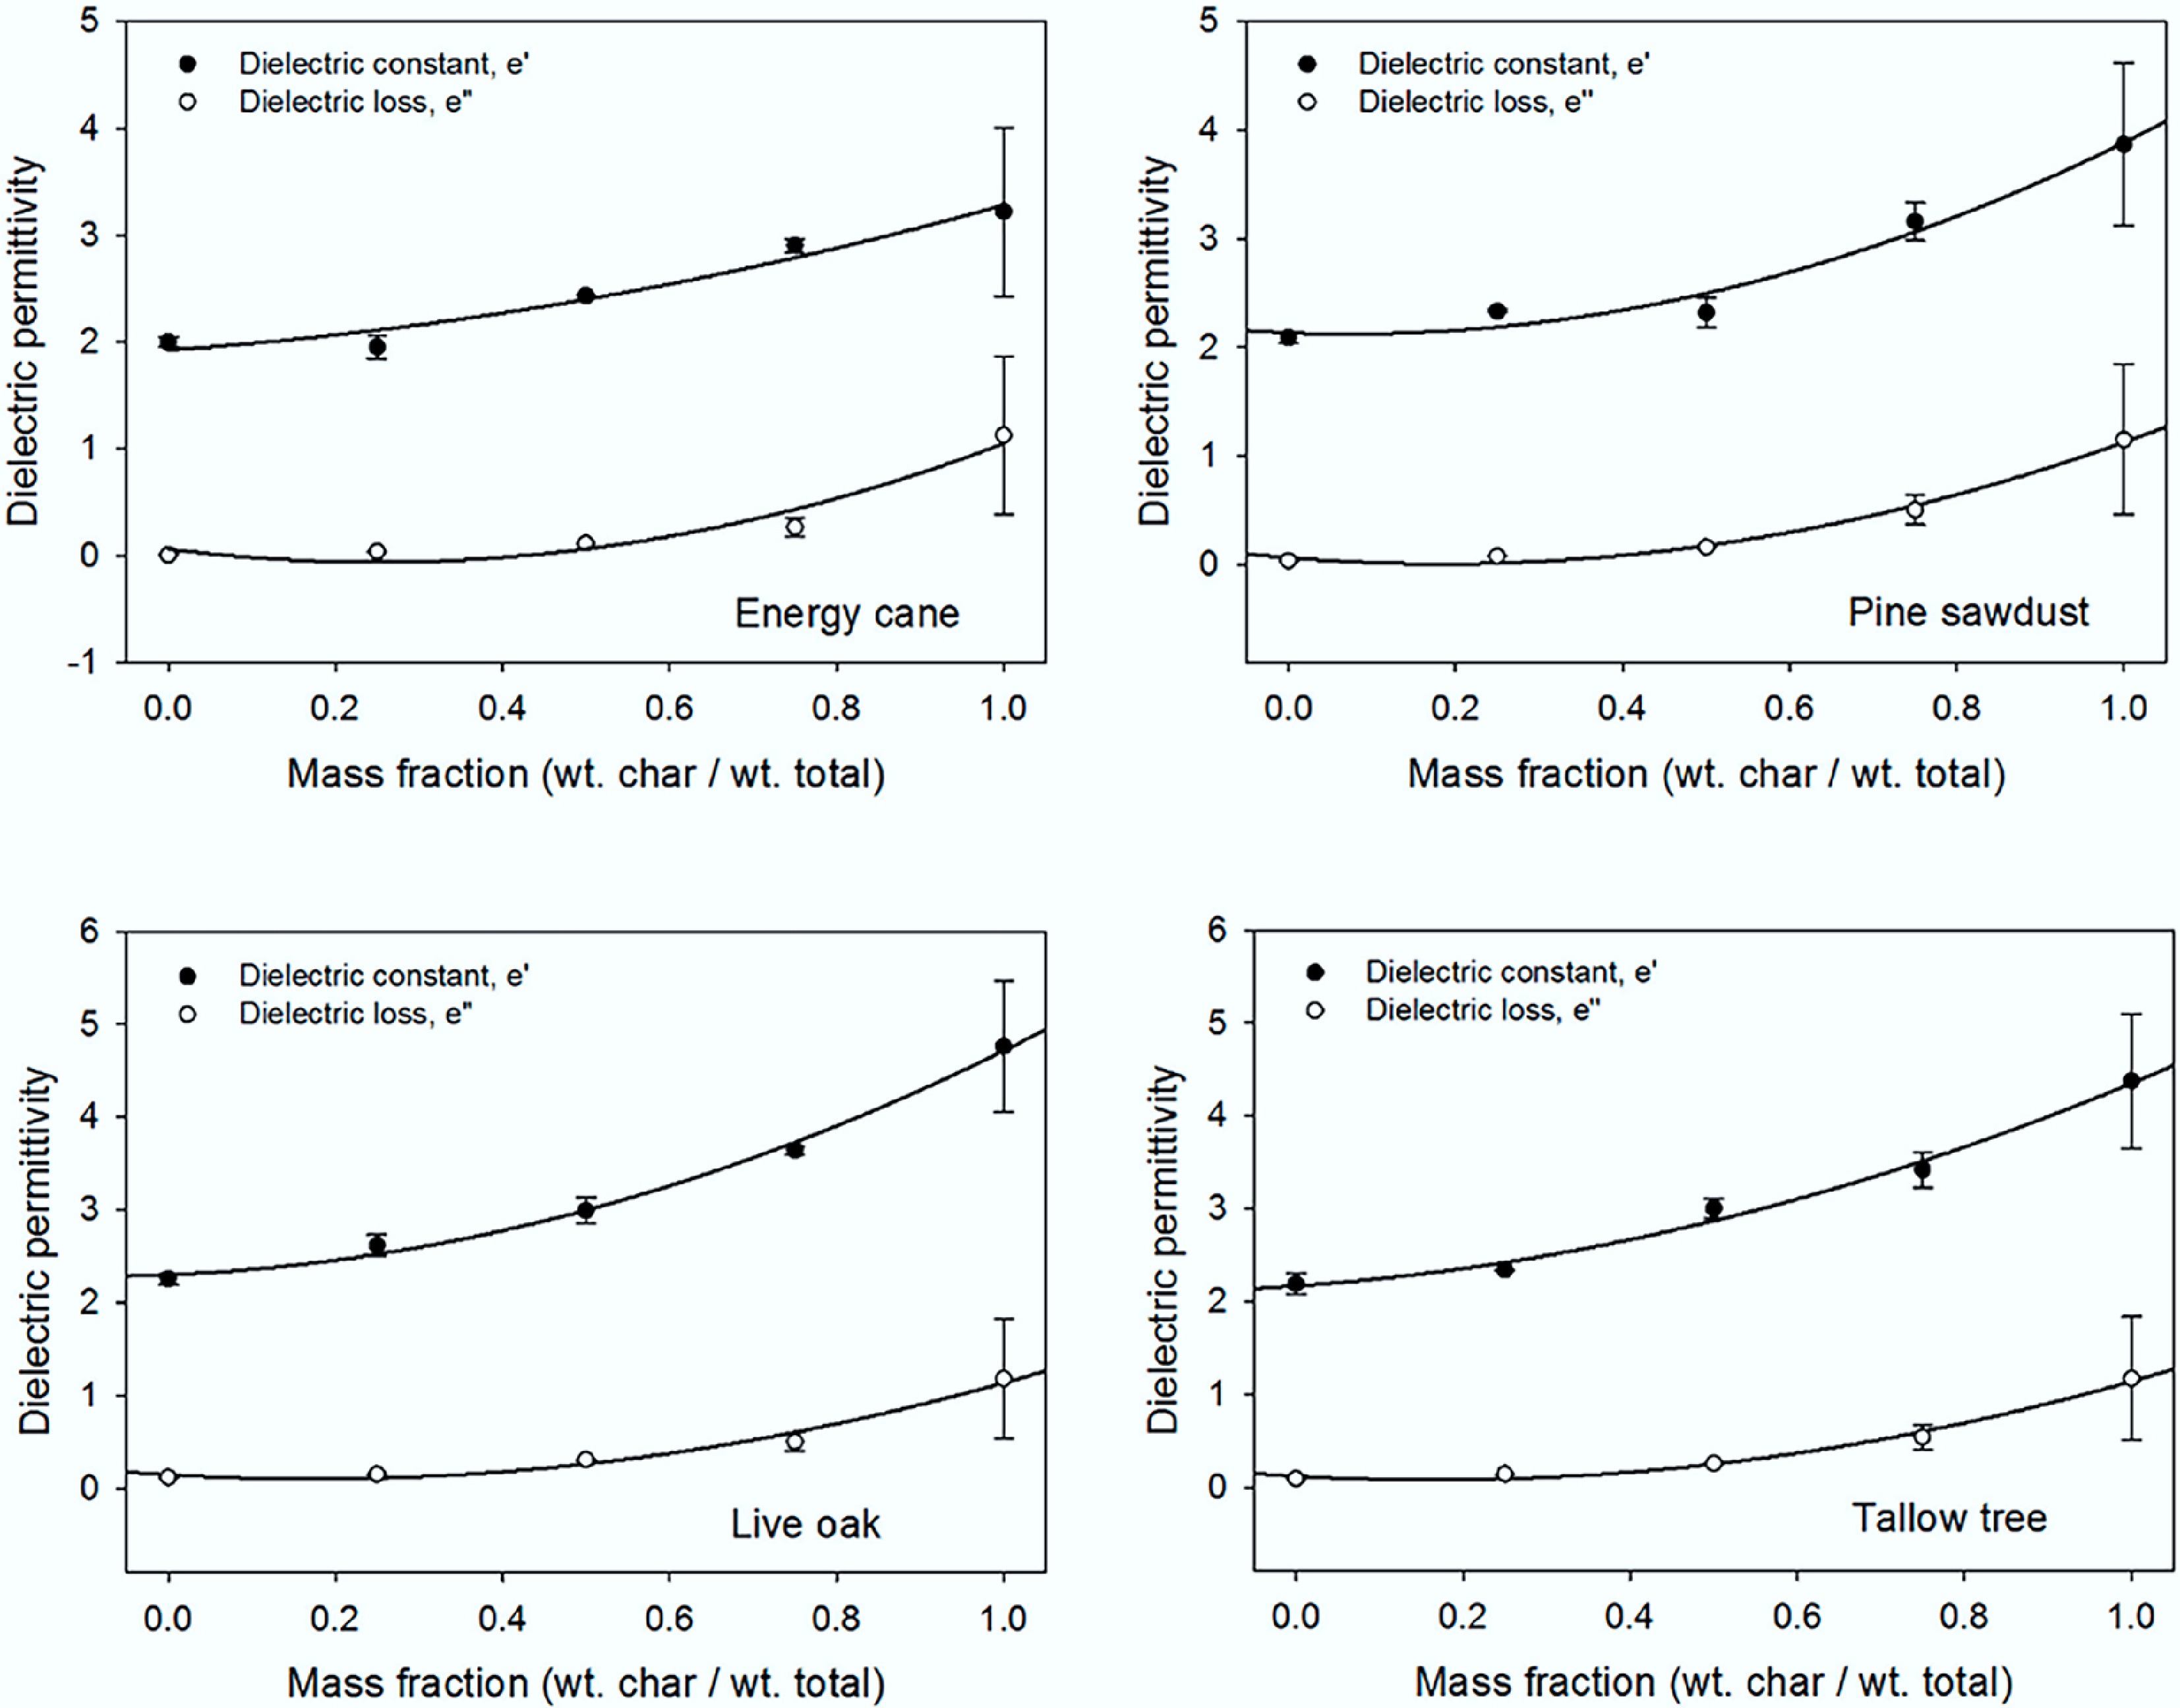
Figure 6.
Dielectric constant and loss factor measurements as a function of biochar content at 2.45 GHz for each biomass[84].
-
-
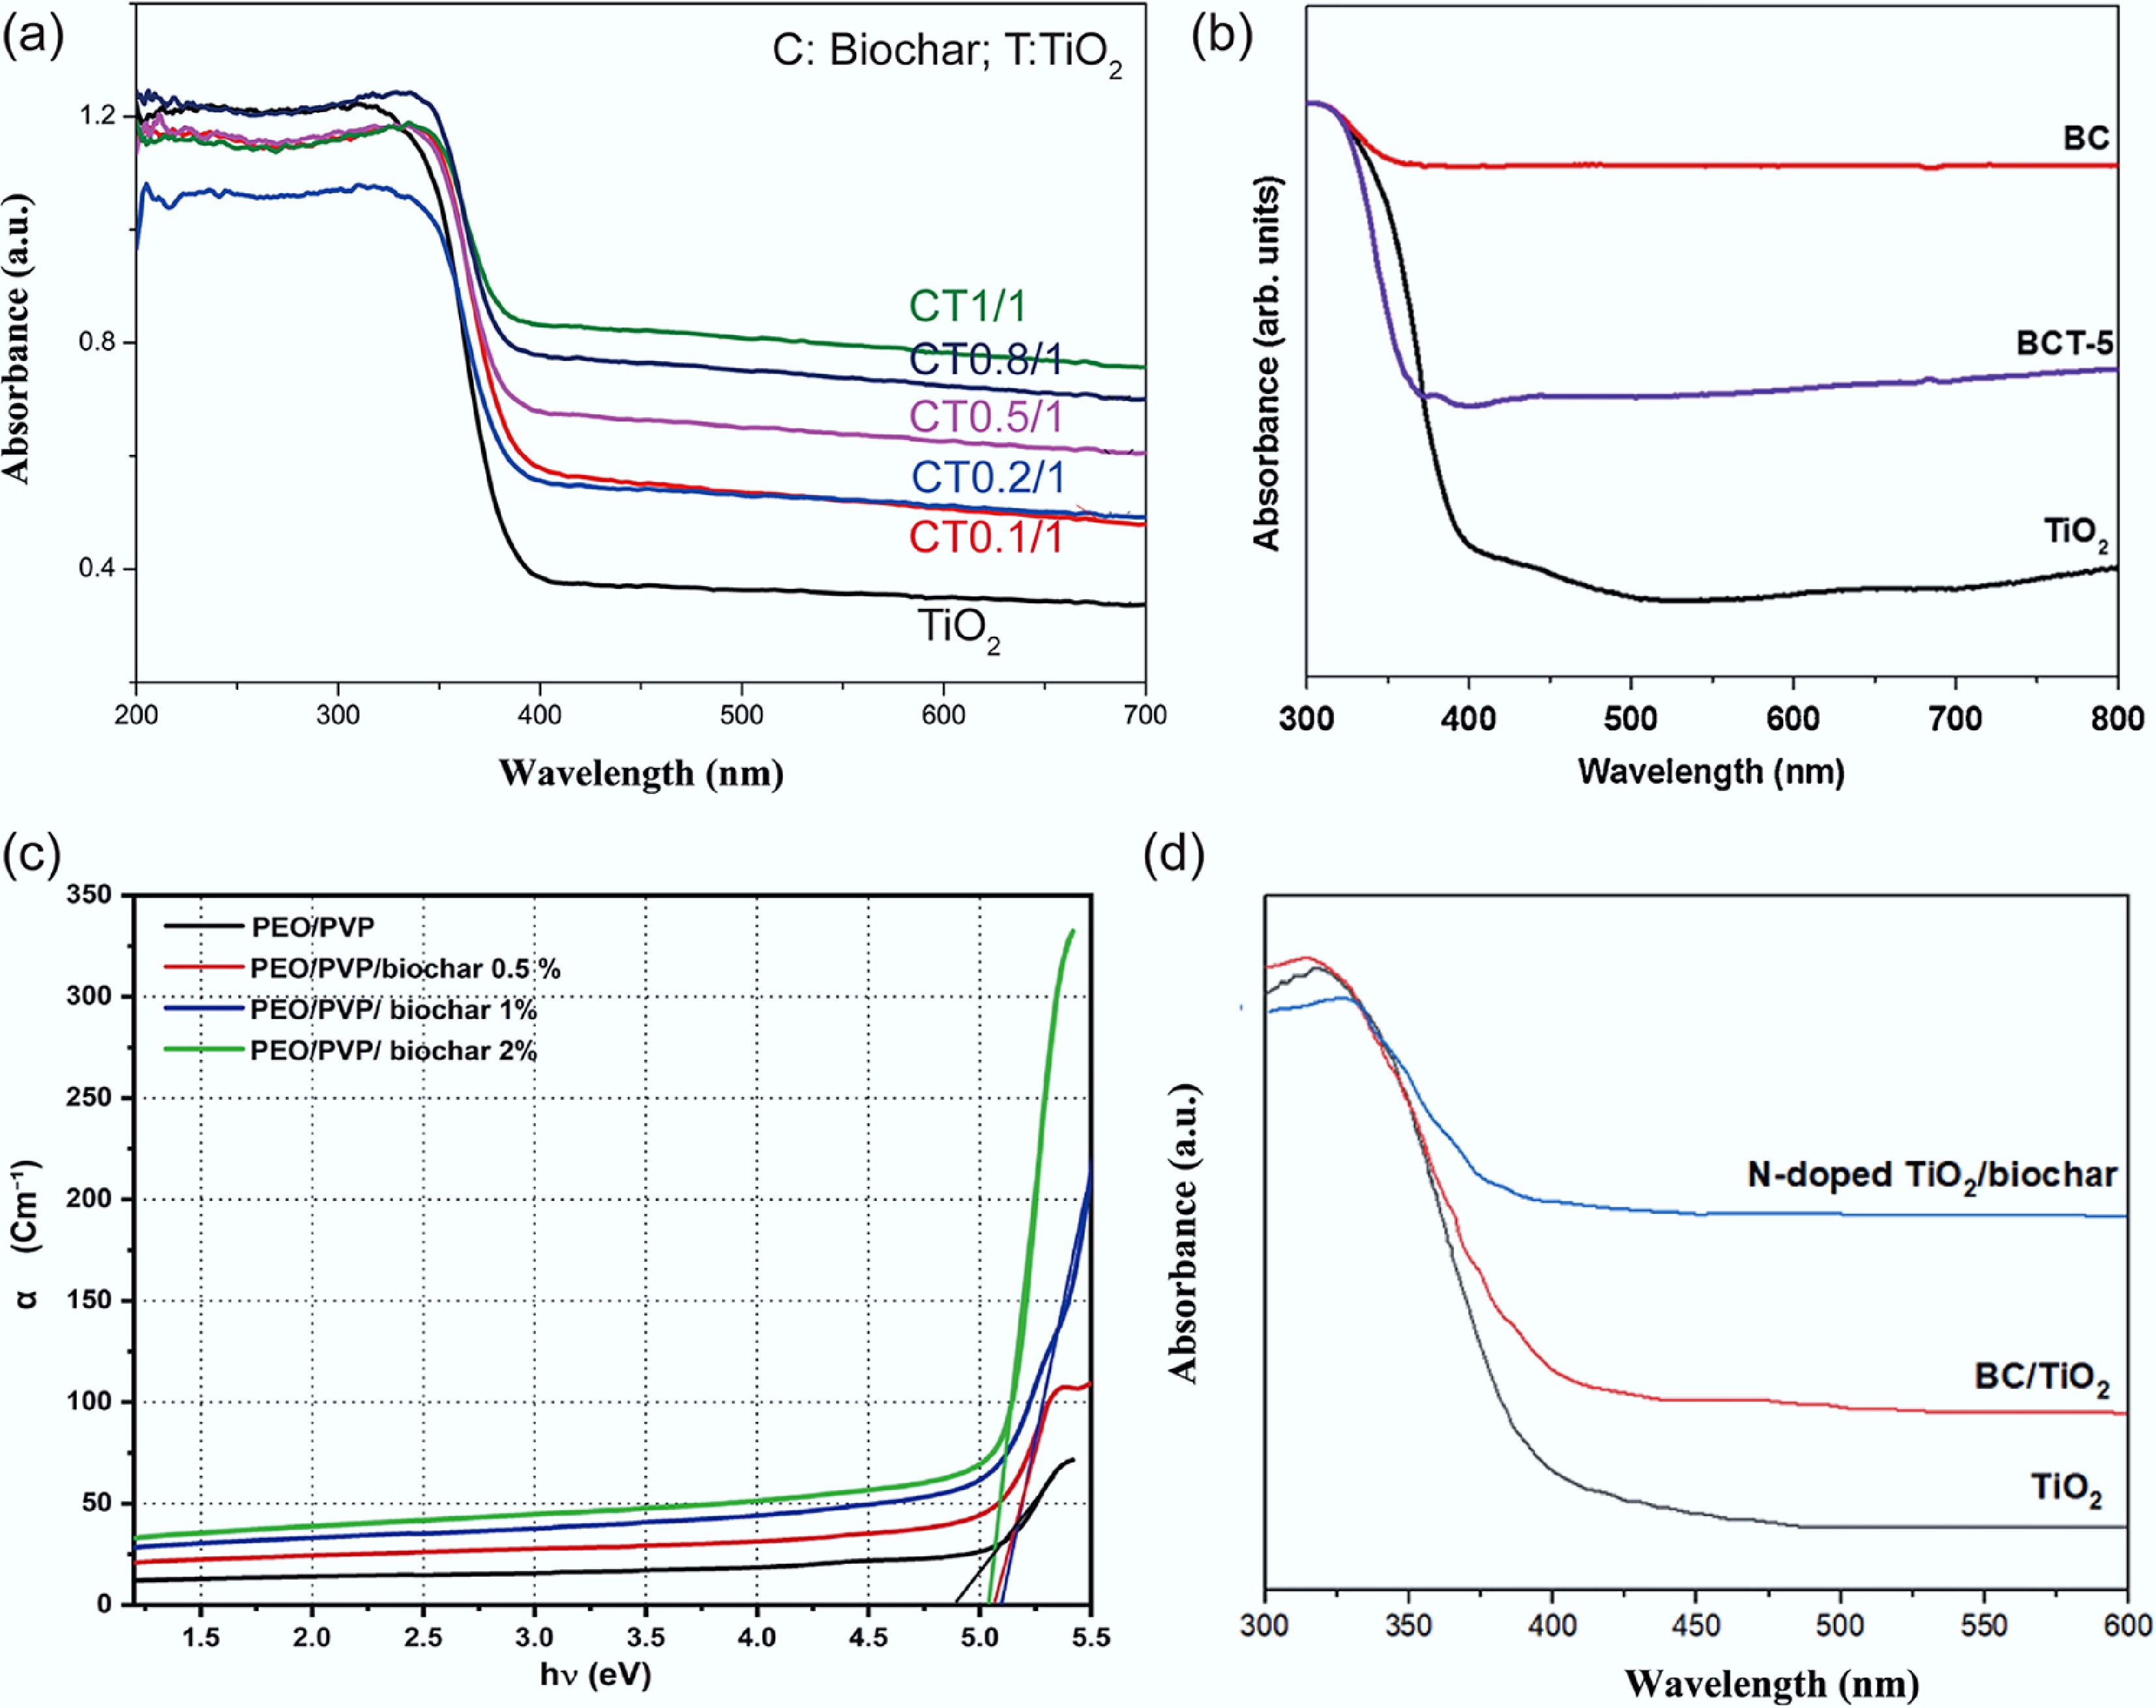
Figure 8.
(a) UV–vis diffuse reflectance spectra of TiO2 and biochar/ TiO2 composites[93]. (b) UV–vis diffuse reflectance spectra of biochar, TiO2, and biochar/TiO2 composites[94]. (c) Absorption coefficient (α) vs photon energy (hν) of PEO/PVP/biochar composite[95]. (d) UV-vis spectra of TiO2, BC/TiO2, and N-doped TiO2/biochar powder[96].
-
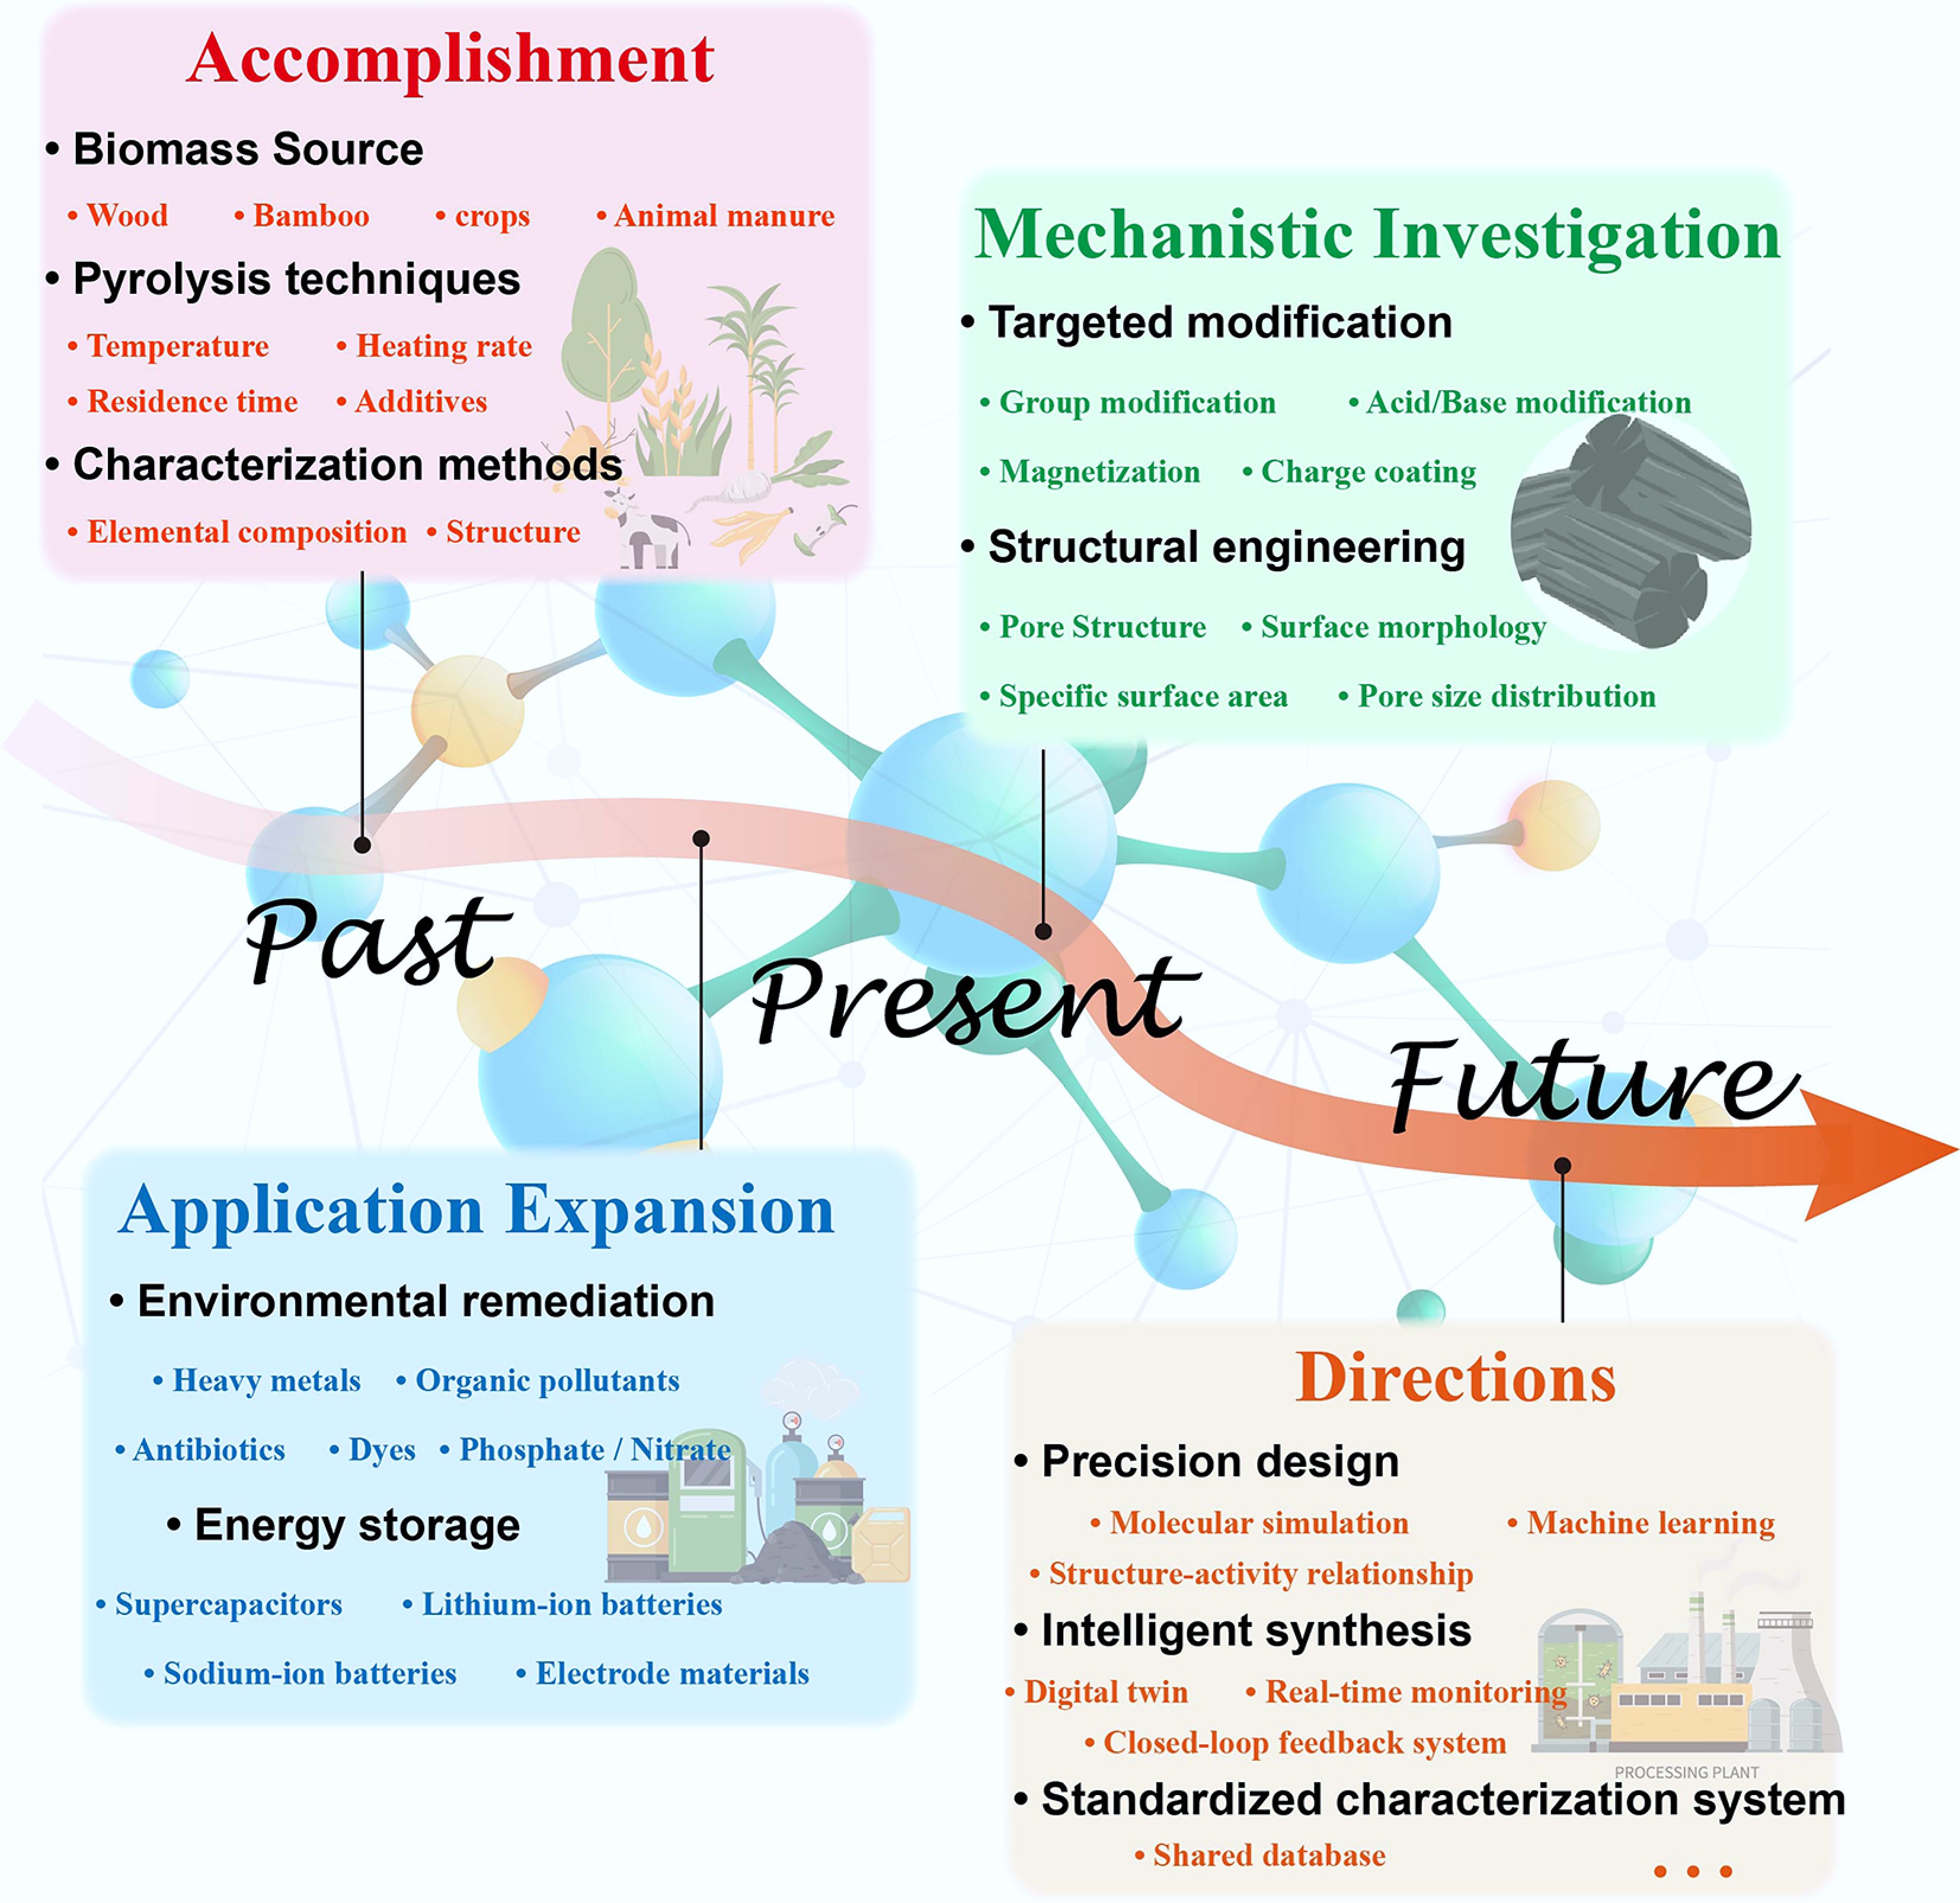
Figure 9.
Roadmap for the development of biochar.
-
Feedstock
typeSynthesis strategy Specific conditions Pore volume (cm3/g) Pore size Specific surface area (m2/g) Ref. Poplar wood Medium-temperature pyrolysis → High-temperature annealing → Air oxidation activation N2, 500 °C, 1 h, 1,000 °C, 2 h. Air, 450 °C, 1 h / Channel:
10–80 μm663 [23] Inert atmosphere high-temperature pyrolysis → Metal-induced activation FeCl3, CoCl2
Ar, 800 °C, 1 h/ Average pore size: 0.5 nm 334 [24] Low-temperature pre-carbonization → High-temperature pyrolysis under inert atmosphere → CO2 physical activation → Salt-assisted structure regulation 240 °C, 6 h, Ar, 1,000 °C, 6 h. CO2, 800 °C, 10 h. Salt impregnation, 150 °C, 2 h / 8–13 μm,
30–50 μm810 [25] Balsa wood Inert atmosphere high-temperature pyrolysis → Alkali impregnation and chemical activation Ar, 1,000 °C, 6 h, Ultrasonic.
Alkali impregnation, N2, 700 °C,
2 h/ Average pore size: 40 μm 809 [11] Hydrothermal precursor construction → Oxidative modification → High-temperature pyrolysis under inert atmosphere Impregnation dopamine, Hydrothermal,
Co(NO3)2, 60 °C, 2 h, H2O2, 2h. N2, 800 °C, 2 h0.163 Average pore size: 2.43 nm 110 [26] Inert atmosphere pyrolysis → Metal-induced activation FeCl3 impregnation, N2, 600 °C,
2 h0.118 Average pore size: 3.88 nm 275 [27] Pine wood Inert atmosphere high-temperature pyrolysis → Doping/metal-induced activation NH4Cl impregnation, Ar, 1,000 °C, 3 h. CuCl2 impregnation, Ar, 1,000 °C, 3h 0.250 Average pore size: 2.55 nm 582 [28] Inert atmosphere high-temperature pyrolysis → Metal-induced structure regulation 800 °C, 0.5 h, N2. Ni(NO3)2·6H2O, 800 °C, 1 h, N2 0.804 Average pore size: 3.96 nm 813 [29] Pyrolysis and annealing in an inert atmosphere 500 °C, 3 h and 450 °C, 4 h, N2 0.197 Average pore size: 2.01 nm 393 [19] Bamboo Hydrothermal carbonization → Chemical activation → Medium-temperature pyrolysis activation Hydrothermal, 200 °C, 6 h. H3PO4 impregnation, 600 °C, 2 h 1.09 Average pore size: 2.42 nm 1,798 [30] Low-temperature pre-carbonization in an inert atmosphere → High-temperature primary carbonization in an inert atmosphere N2, 200 °C, 1 h, 700 °C, 3 h 1.51 Average pore size: 2.28 nm 2,715 [20] Introduction of nitrogen source and gaseous foaming agent → Alkali impregnation and chemical activation → Microwave rapid pyrolysis/activation Urea, urea nitrate, KOH, microwave, 460 W, 30 min 0.66 1–5 nm 1,195 [31] Rice husk Medium and high temperature carbonization 395–618 °C, 4 h 0.255 / / [32] Corn cob 0.243 / / Bamboo Intermediate-temperature pyrolysis under an inert atmosphere 500 °C, 1 h, N2 0.099 6.24 nm 71 [21] Rice husk 0.039 3.42 nm 29 Corn cob 0.023 2.39 nm 10 Sewage sludge Medium temperature carbonization 400 °C, 1 h / 10.6 nm 1 [33] Pine needles / 2.16 nm 430 Pineapple leaves Medium and high temperature carbonization 300–700 °C, 2 h 0.01–0.1 1–9 nm 1–215 [18] Banana stems 0.01–0.18 2–8 nm 3–335 Sugarcane bagasse 0.01–0.1 2–6.5 nm 2–195 Horticultural substrate 0.01–0.09 3–16 nm 2–120 Chicken manure Calcination at 550–950 °C for 4 h / 15.4–15.7 nm 11 [34] Swine manure Intermediate-temperature pyrolysis under an inert atmosphere Pyrolysis at 500–650 °C for 2 h
in N20.032–0.038 15.4–26.0 nm 6–8 [35] Pyrolysis at 500 °C for 4 h in Ar 0.021 6.76 nm 13 [36] Cow manure Intermediate-temperature pyrolysis under an inert atmosphere → Metal-induced structure regulation Impregnation with CuSO4, Pyrolysis at 500 °C for 4 h in Ar 0.031 4.85 nm 26 Table 1.
Pore structure characteristics of various biochars
-
Feedstock type Synthesis strategy Specific conditions Hardness (GPa) Modulus (GPa) Ref. Pinewood Medium and low temperature carbonization 450 °C, 10 min 0.43 4.9 [51] Birch wood 300 °C, 1 h 0.27 3.9 [52] Chicken litter 450 °C, 20 min ~0.75 ~5 [38] Spruce wood Medium and high temperature carbonization 700–2,000 °C, 2h 4–5 30–40 [50] Sewage sludge 680 °C, 10 min ~2.5 ~10 [38] 90% softwood and 10% hardwood − − 0.28 5.1 [53] Fruit pit 0.22 3.4 Pine bark High temperature carbonization 800 °C, 1 h ~0.47 ~4.5 [54] Gluten 0.5 7.8 Pine sawdust 900 °C, 1 h 4.29 25 [38] Table 2.
Hardness and modulus of different types of biochar measured by nanoindentation
-
Feedstock type Synthesis strategy Specific conditions Thermal conductivity (W/m∙K) Ref. Lemon peel Medium and low temperature carbonization 180 °C, 1 h 0.84 [65] Wood offcuts 350–400 °C 0.079–0.132 [63] Phoenix leaf 450–600 °C, 2 h 0.056–0.06 [59] Garlic stem 700 °C, 2 h 0.141 [66] Pine wood High temperature carbonization 1,000 °C, 1 h 0.222 [58] Copper-based preservatives, 1,000 °C, 1 h 0.395 Bamboo 1,000 °C, 6 h 0.3–0.7 [61] Peanut shell 900 °C, 2 h combined with stearic acid (SA) 0.53 [67] Poplar wood 0.38 Corn straw 0.32 Table 3.
Thermal conductivity of different types of biochar
Figures
(9)
Tables
(3)