-
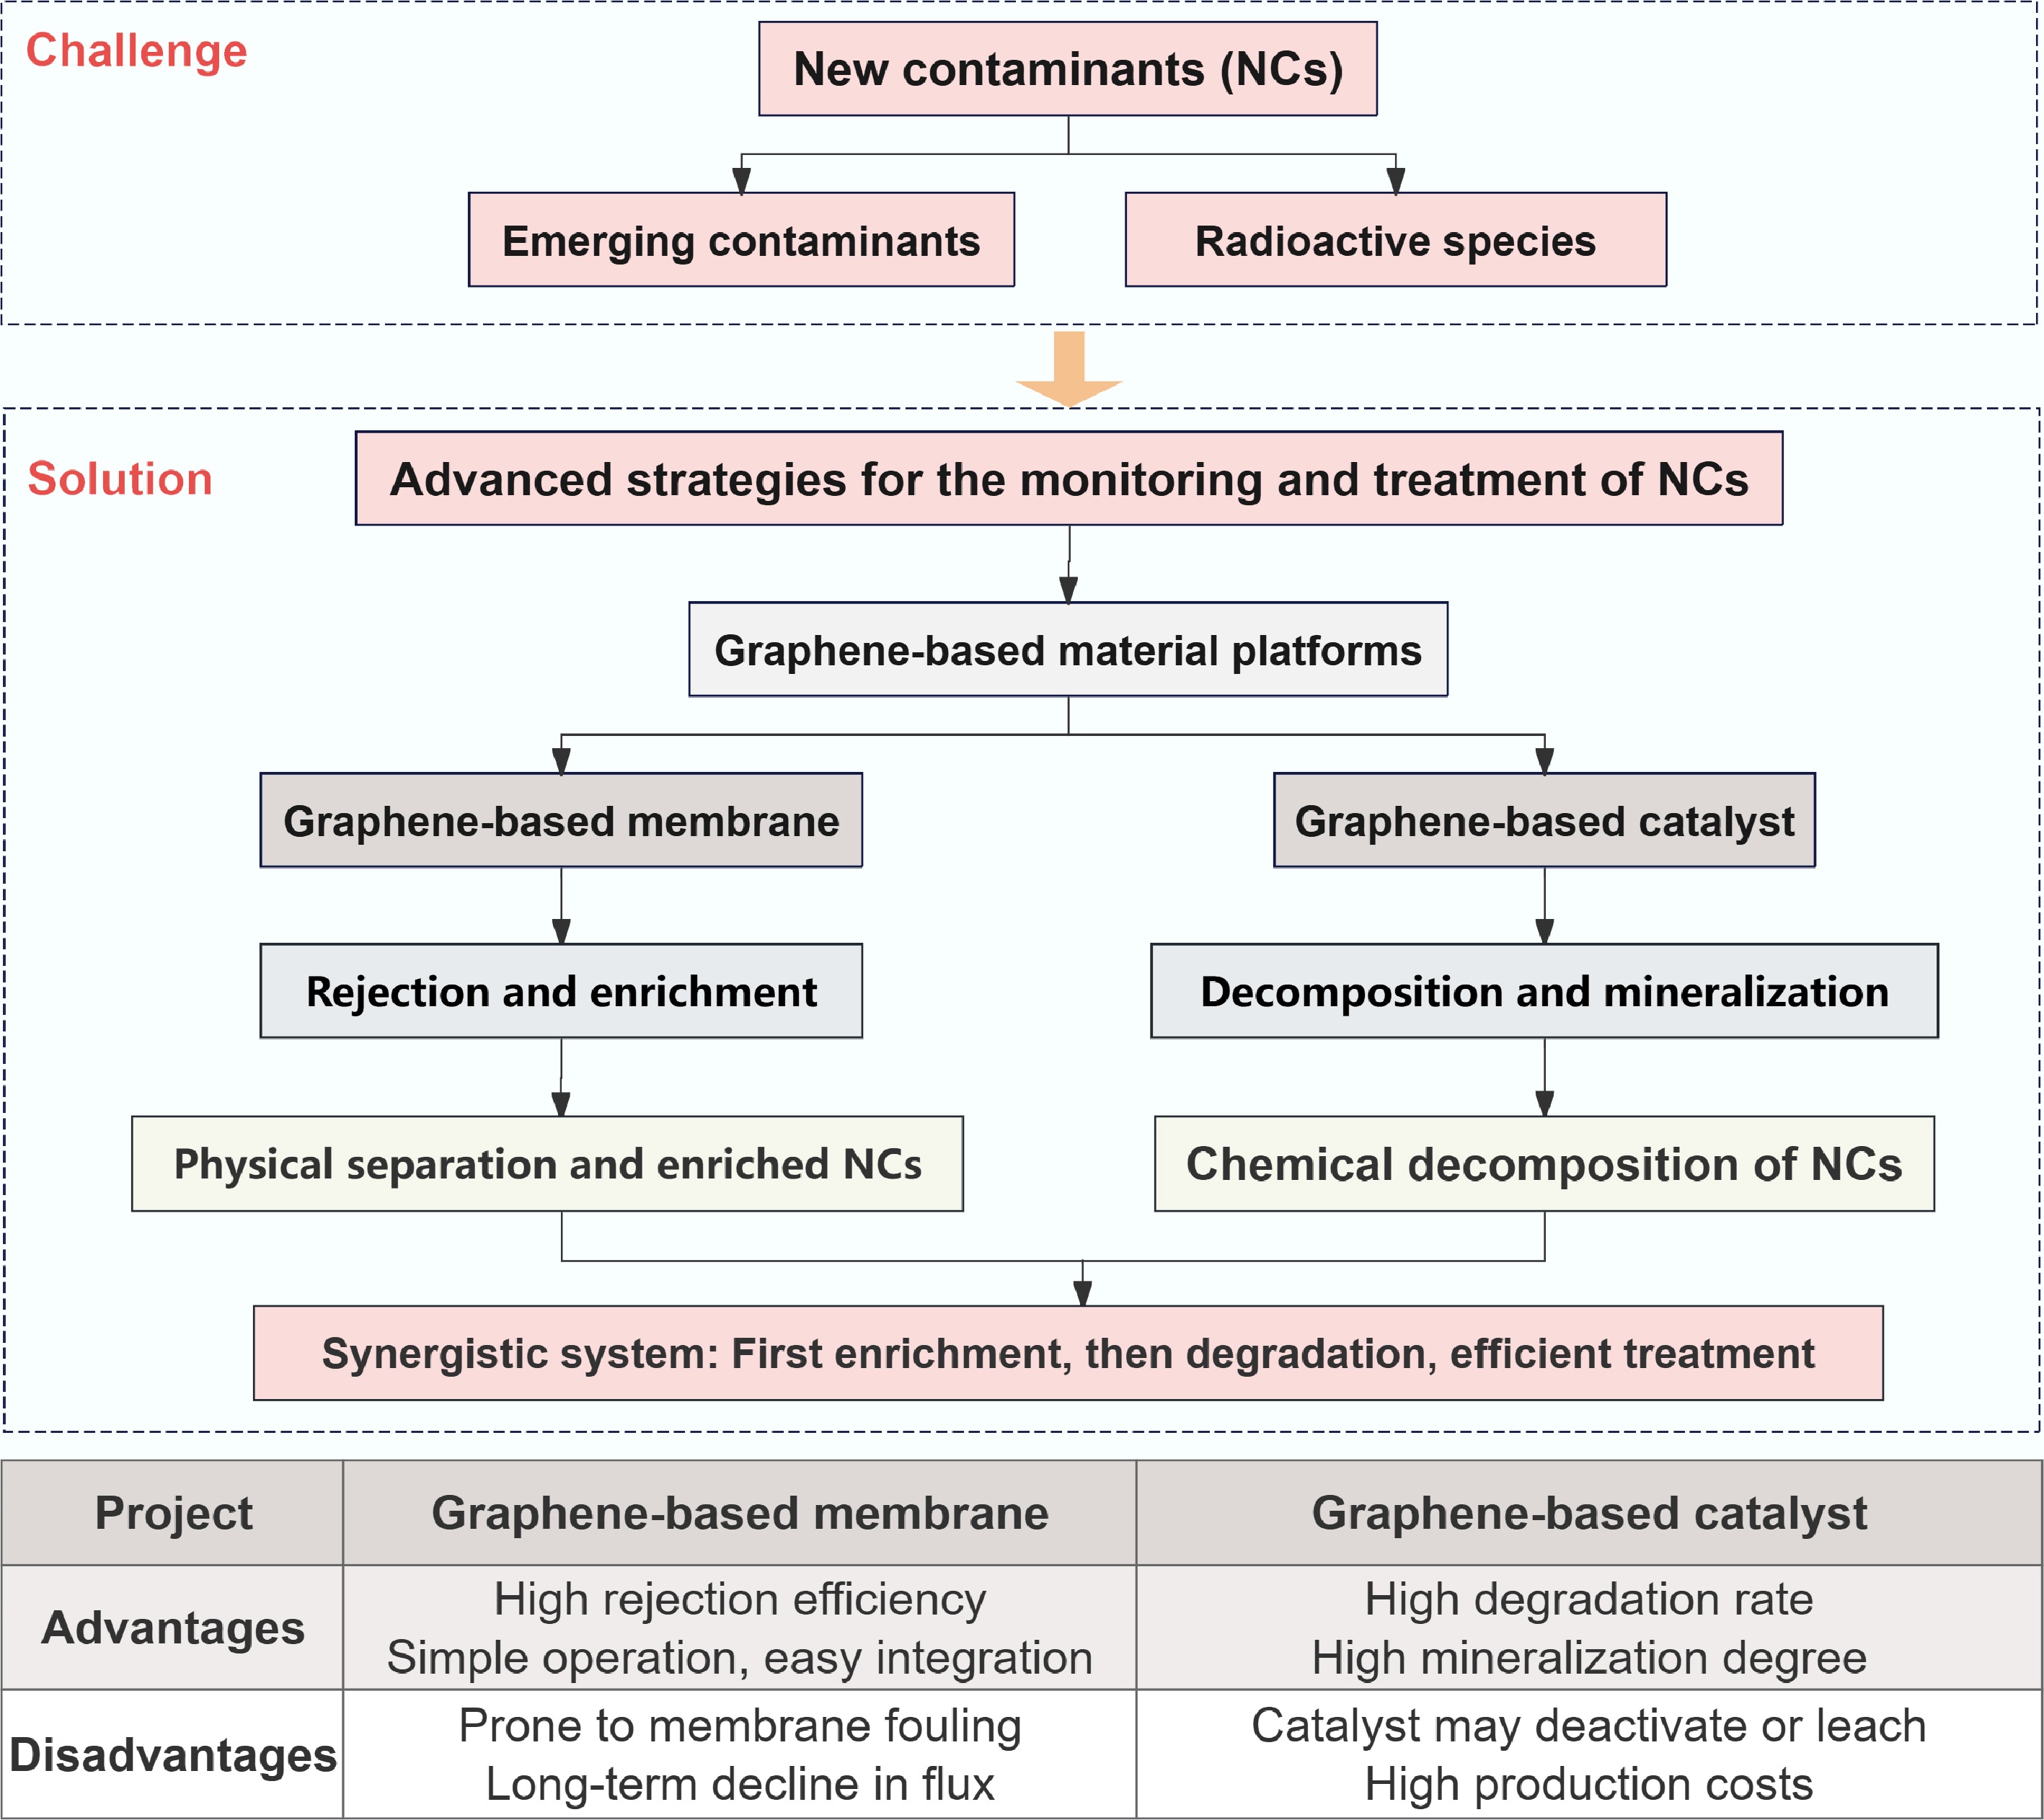
Figure 1.
Framework for graphene-based material platforms in the mitigation of NCs.
-
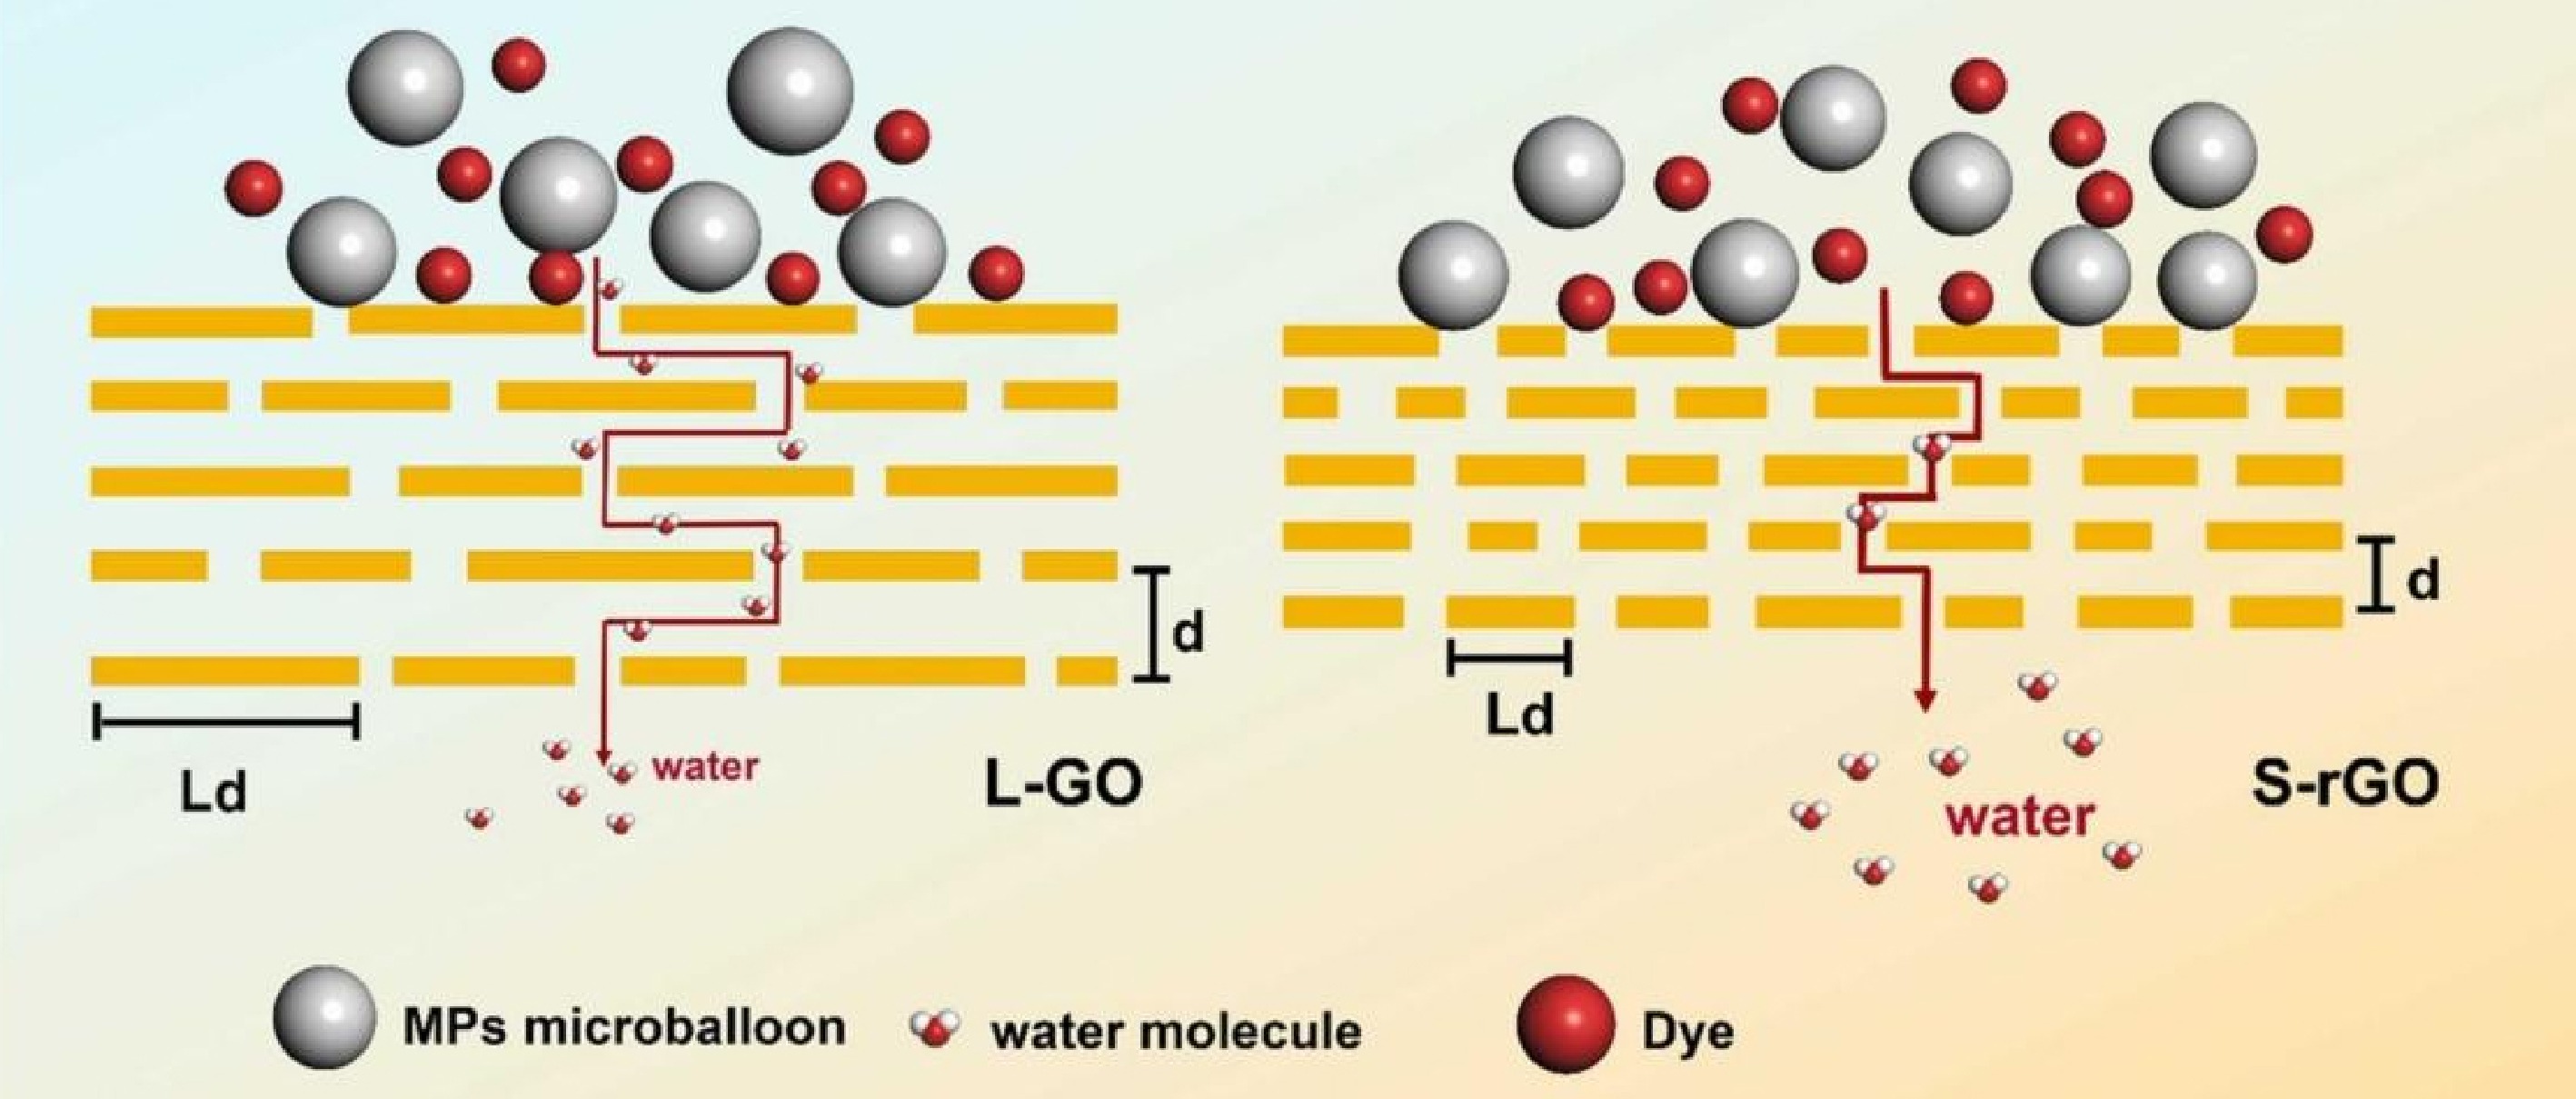
Figure 2.
Water transport pathways and rejection mechanisms of graphene-based membrane[30].
-
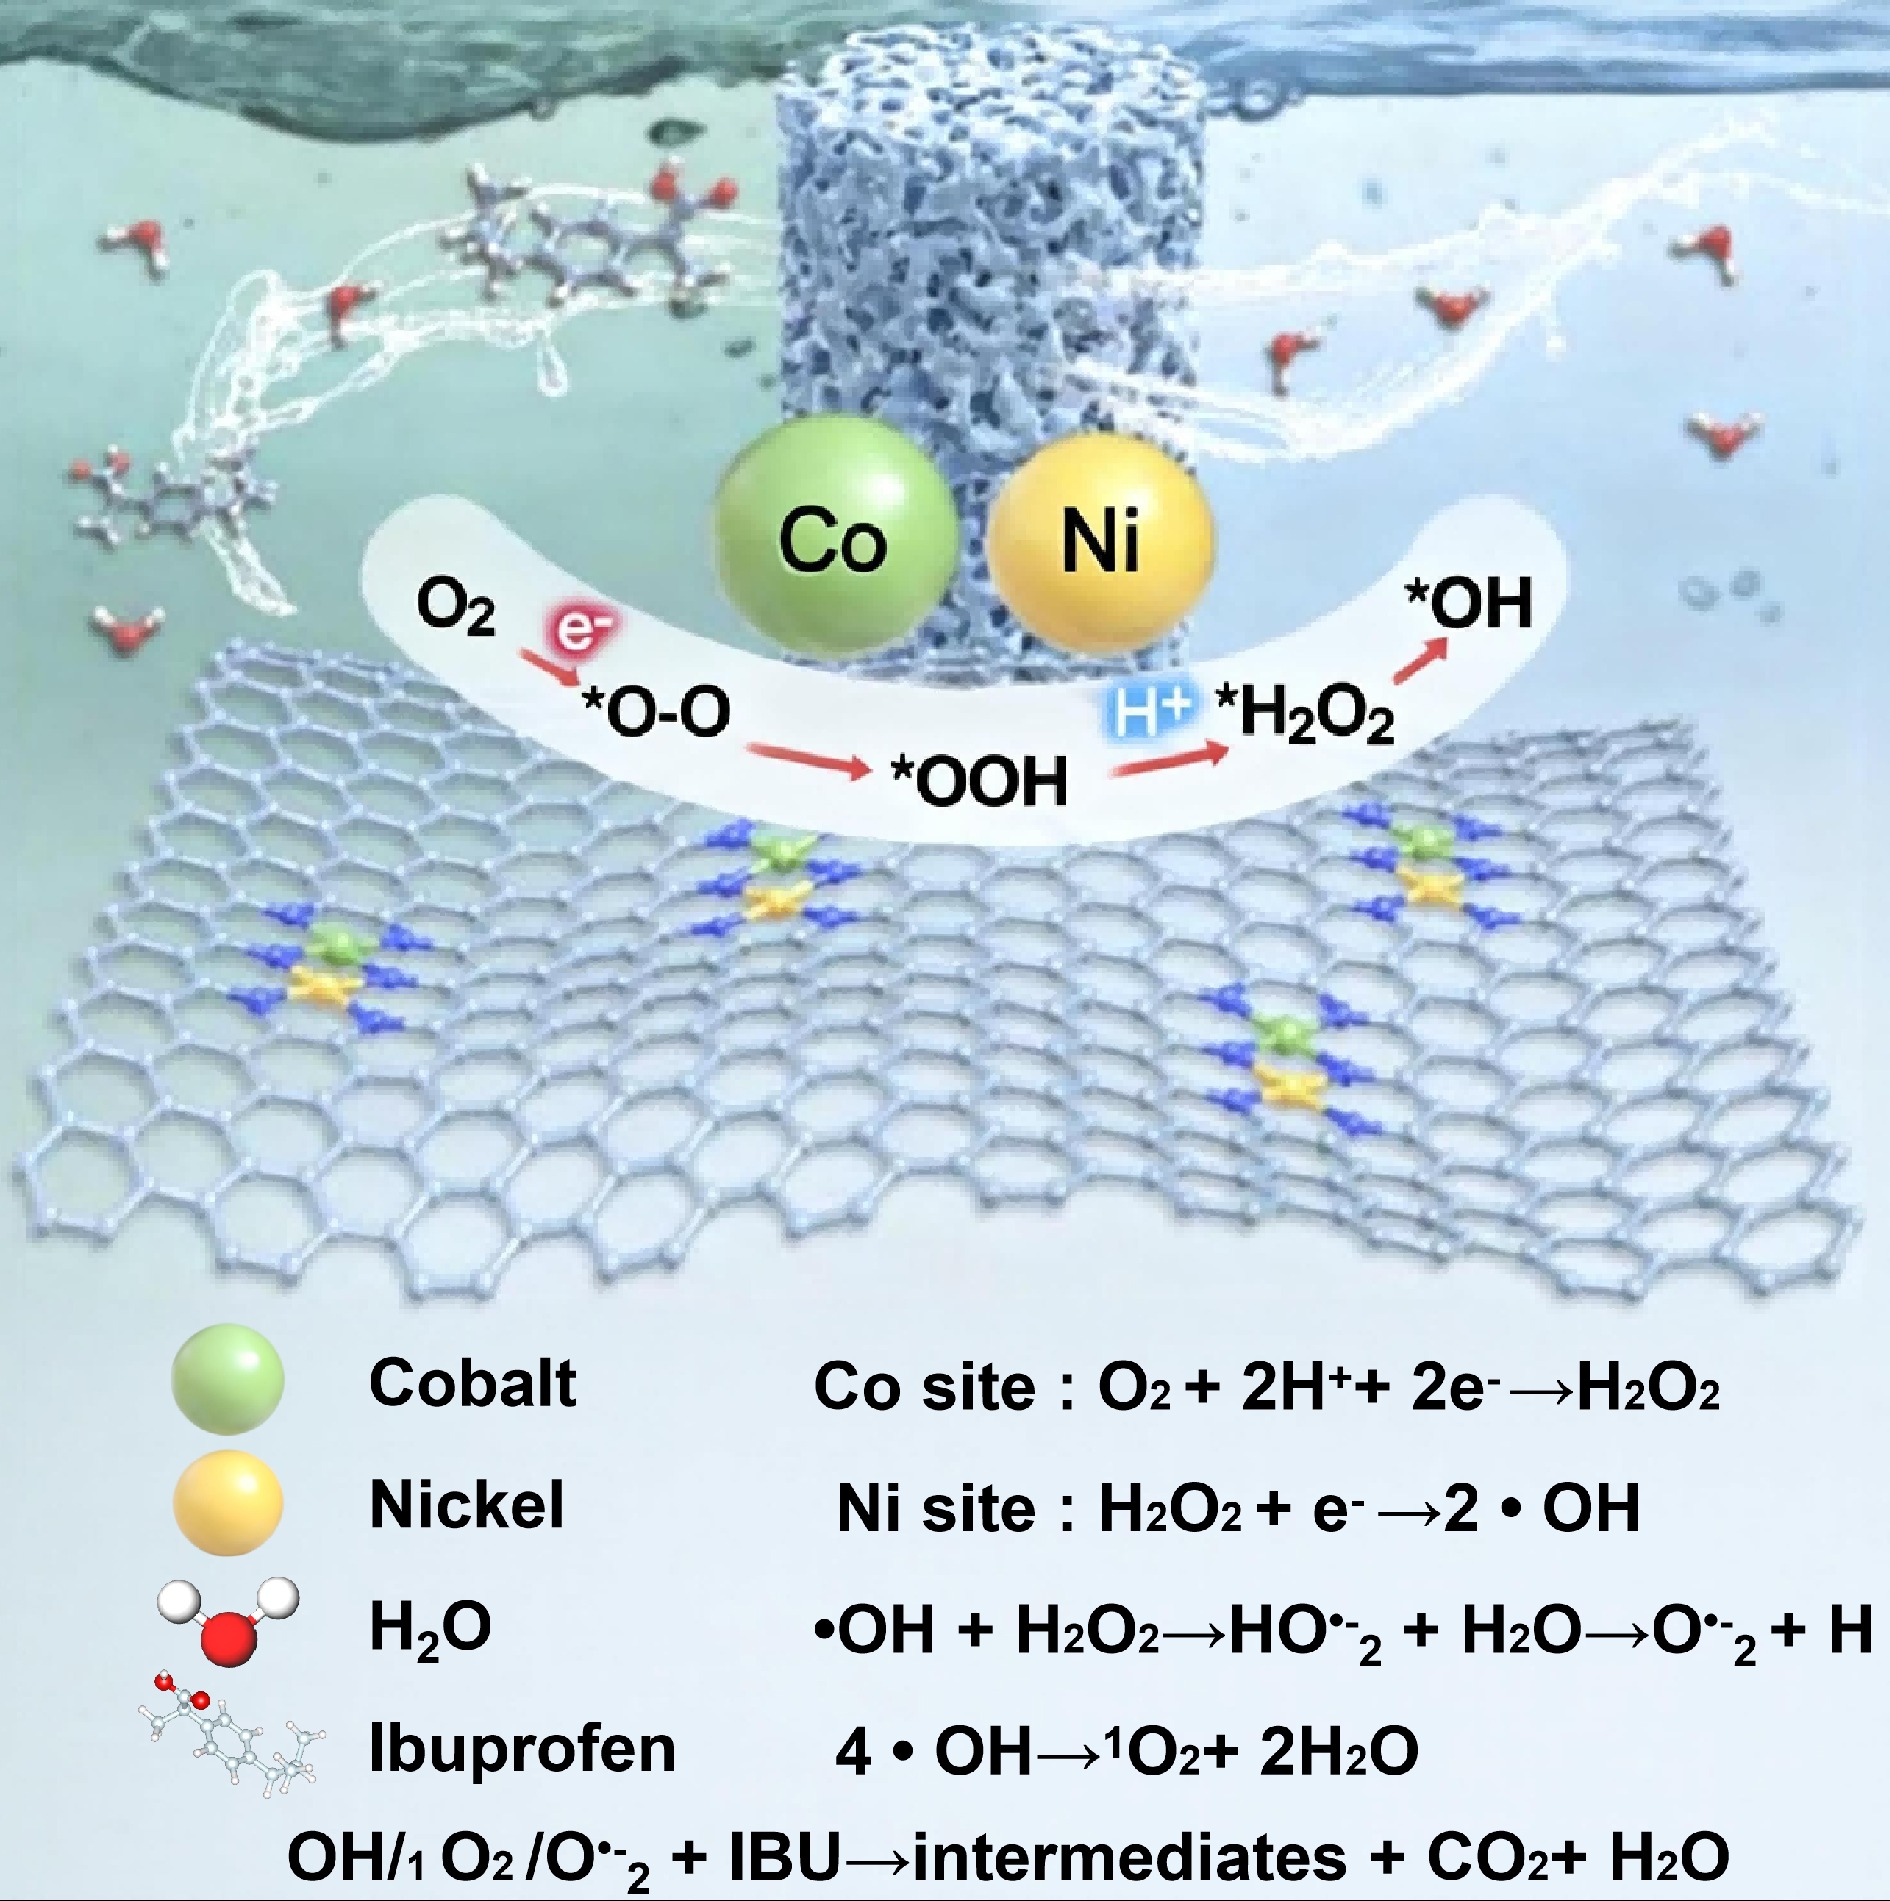
Figure 3.
Mechanism of the electro-Fenton process for the treatment of emerging contaminants[56].
-
Membrane
typeContaminant Concentration (mg L−1) Rejection (%) Water permeance
(L m−2 h−1 bar−1)GO-βCD membrane[31] PFAS 0.1 90.0 22 NaOH-rGO membrane[32] MPs 10 99.9 484.2 LGO membrane[33] MPs 1 99.9 3,396 GO/ZrT-1-NH2 membrane[34] Antibiotics 100 99.0 10 G10(1)/P1.5-F100µL
membrane[35]Pendimethalin 10 99.9 20.7 GO-M-PhA-30
membrane[36]Pendimethalin 50 99.4 19.0 rGO membrane[37] Co2+ 22.7 99.9 72.4 CE7@ membrane[38] Cs+ 20 94.4 15.8 G/D/Z/P membrane[39] Cs+ 0.2 21.8 15,371 Table 1.
Separation performance of various graphene-based membranes
-
Graphene-based catalyst Contaminant Concentration
(mg L−1)Degradation efficiency (%) CMCD-TiO2@
Fe3O4@rGO[59]Tetracycline 20 83.3 MnFe2O4@
Bi2WO6-GO[60]Tetracycline 10 99.3 rGO-TiO2[61] Diclofenac 10 85.5 rGO-CNCF[62] Sulfamethazine 10 99.9 Ti/TiO2-rGO[63] PFOA 50 70 AgBr/GO/Bi2WO6[64] Tetracycline / 84 GO/SCN[65] Bisphenol A 20 89.5 Pt/TiO2@NRGO[66] Tetracycline 27 81 Fe/g-C hybrid[67] PFOA 1 > 85 Table 2.
Catalytic performance of various graphene-based catalysts
Figures
(3)
Tables
(2)