-
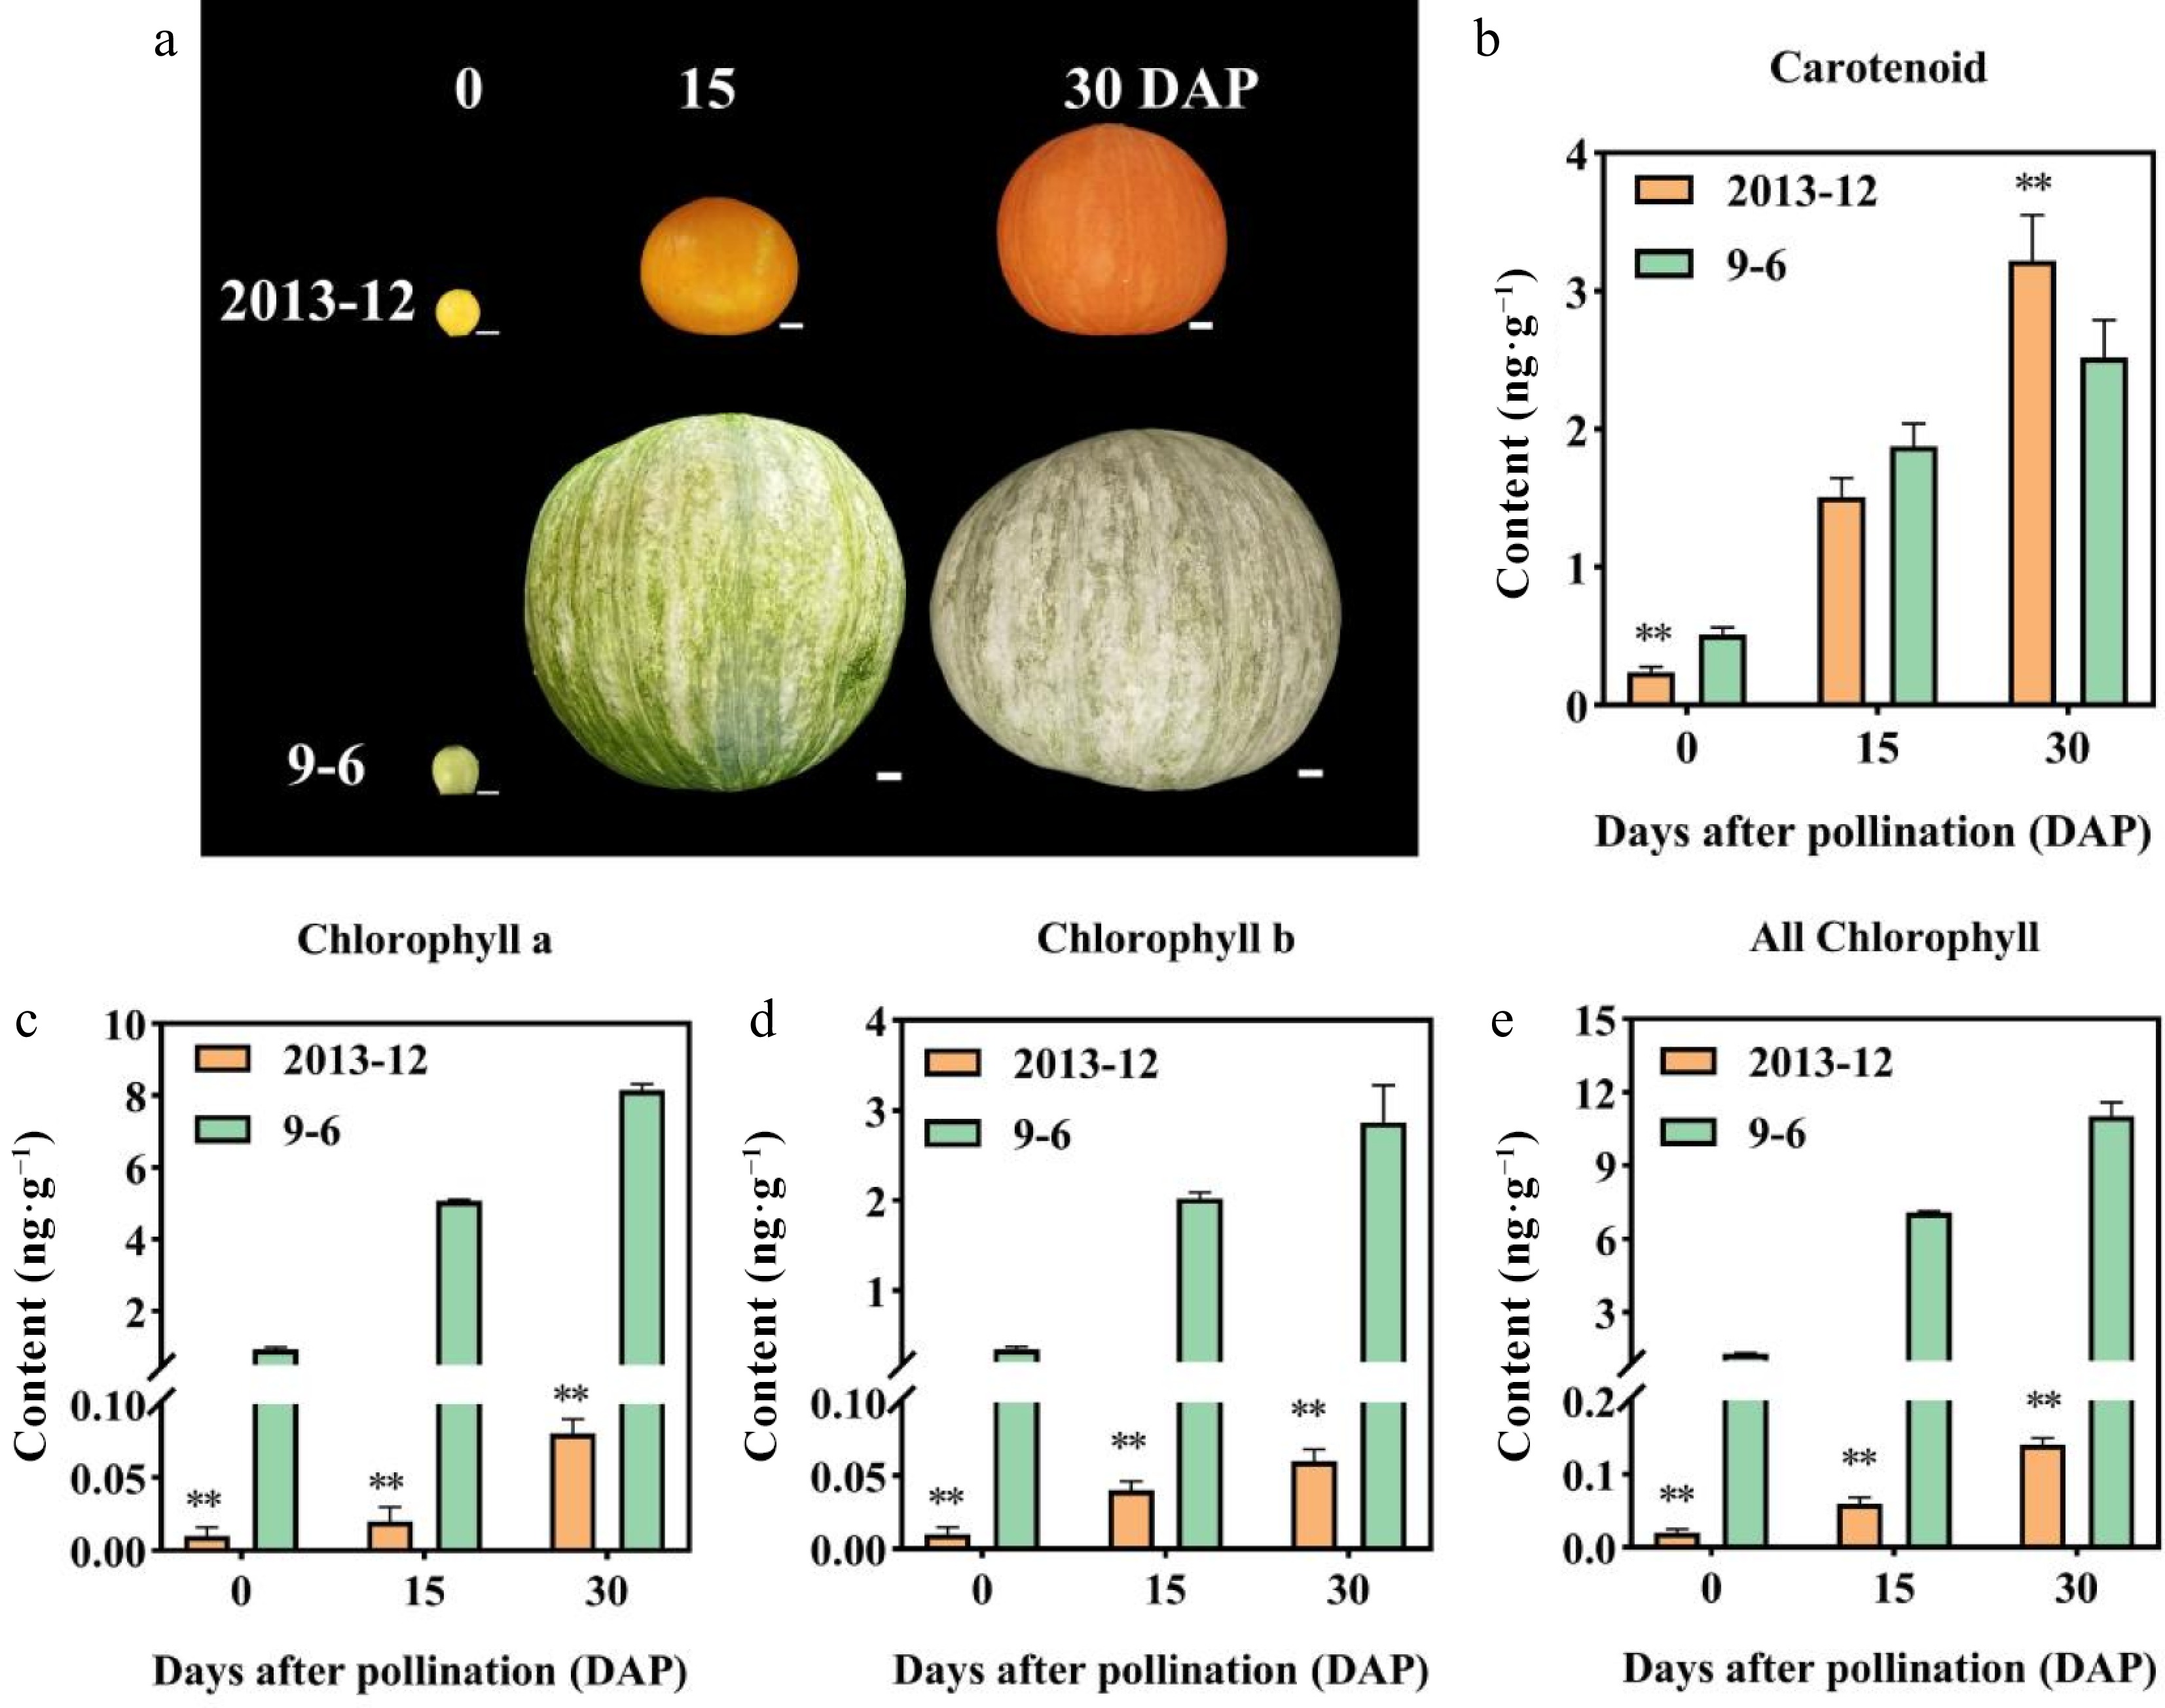
Figure 1.
Peel color, pigment content in fresh fruit peel, and microscopic observation of the mature fruit peel in Cucurbita maxima. (a) Peel color of the two inbred lines at 0, 15, and 30 DAP. '2013-12': Red peel. '9-6': Gray peel. (b)–(e): Pigment contents of fruit peel with fresh weight in the two materials at 0, 15, and 30 DAP. Values are the average ± SD of three replicates. Significant differences are indicated by asterisks, * indicates a significant difference (0.05 > p ≥ 0.01), and ** represents an extremely significant difference (0.01 > p ≥ 0.001). DAP: Days after pollination.
-
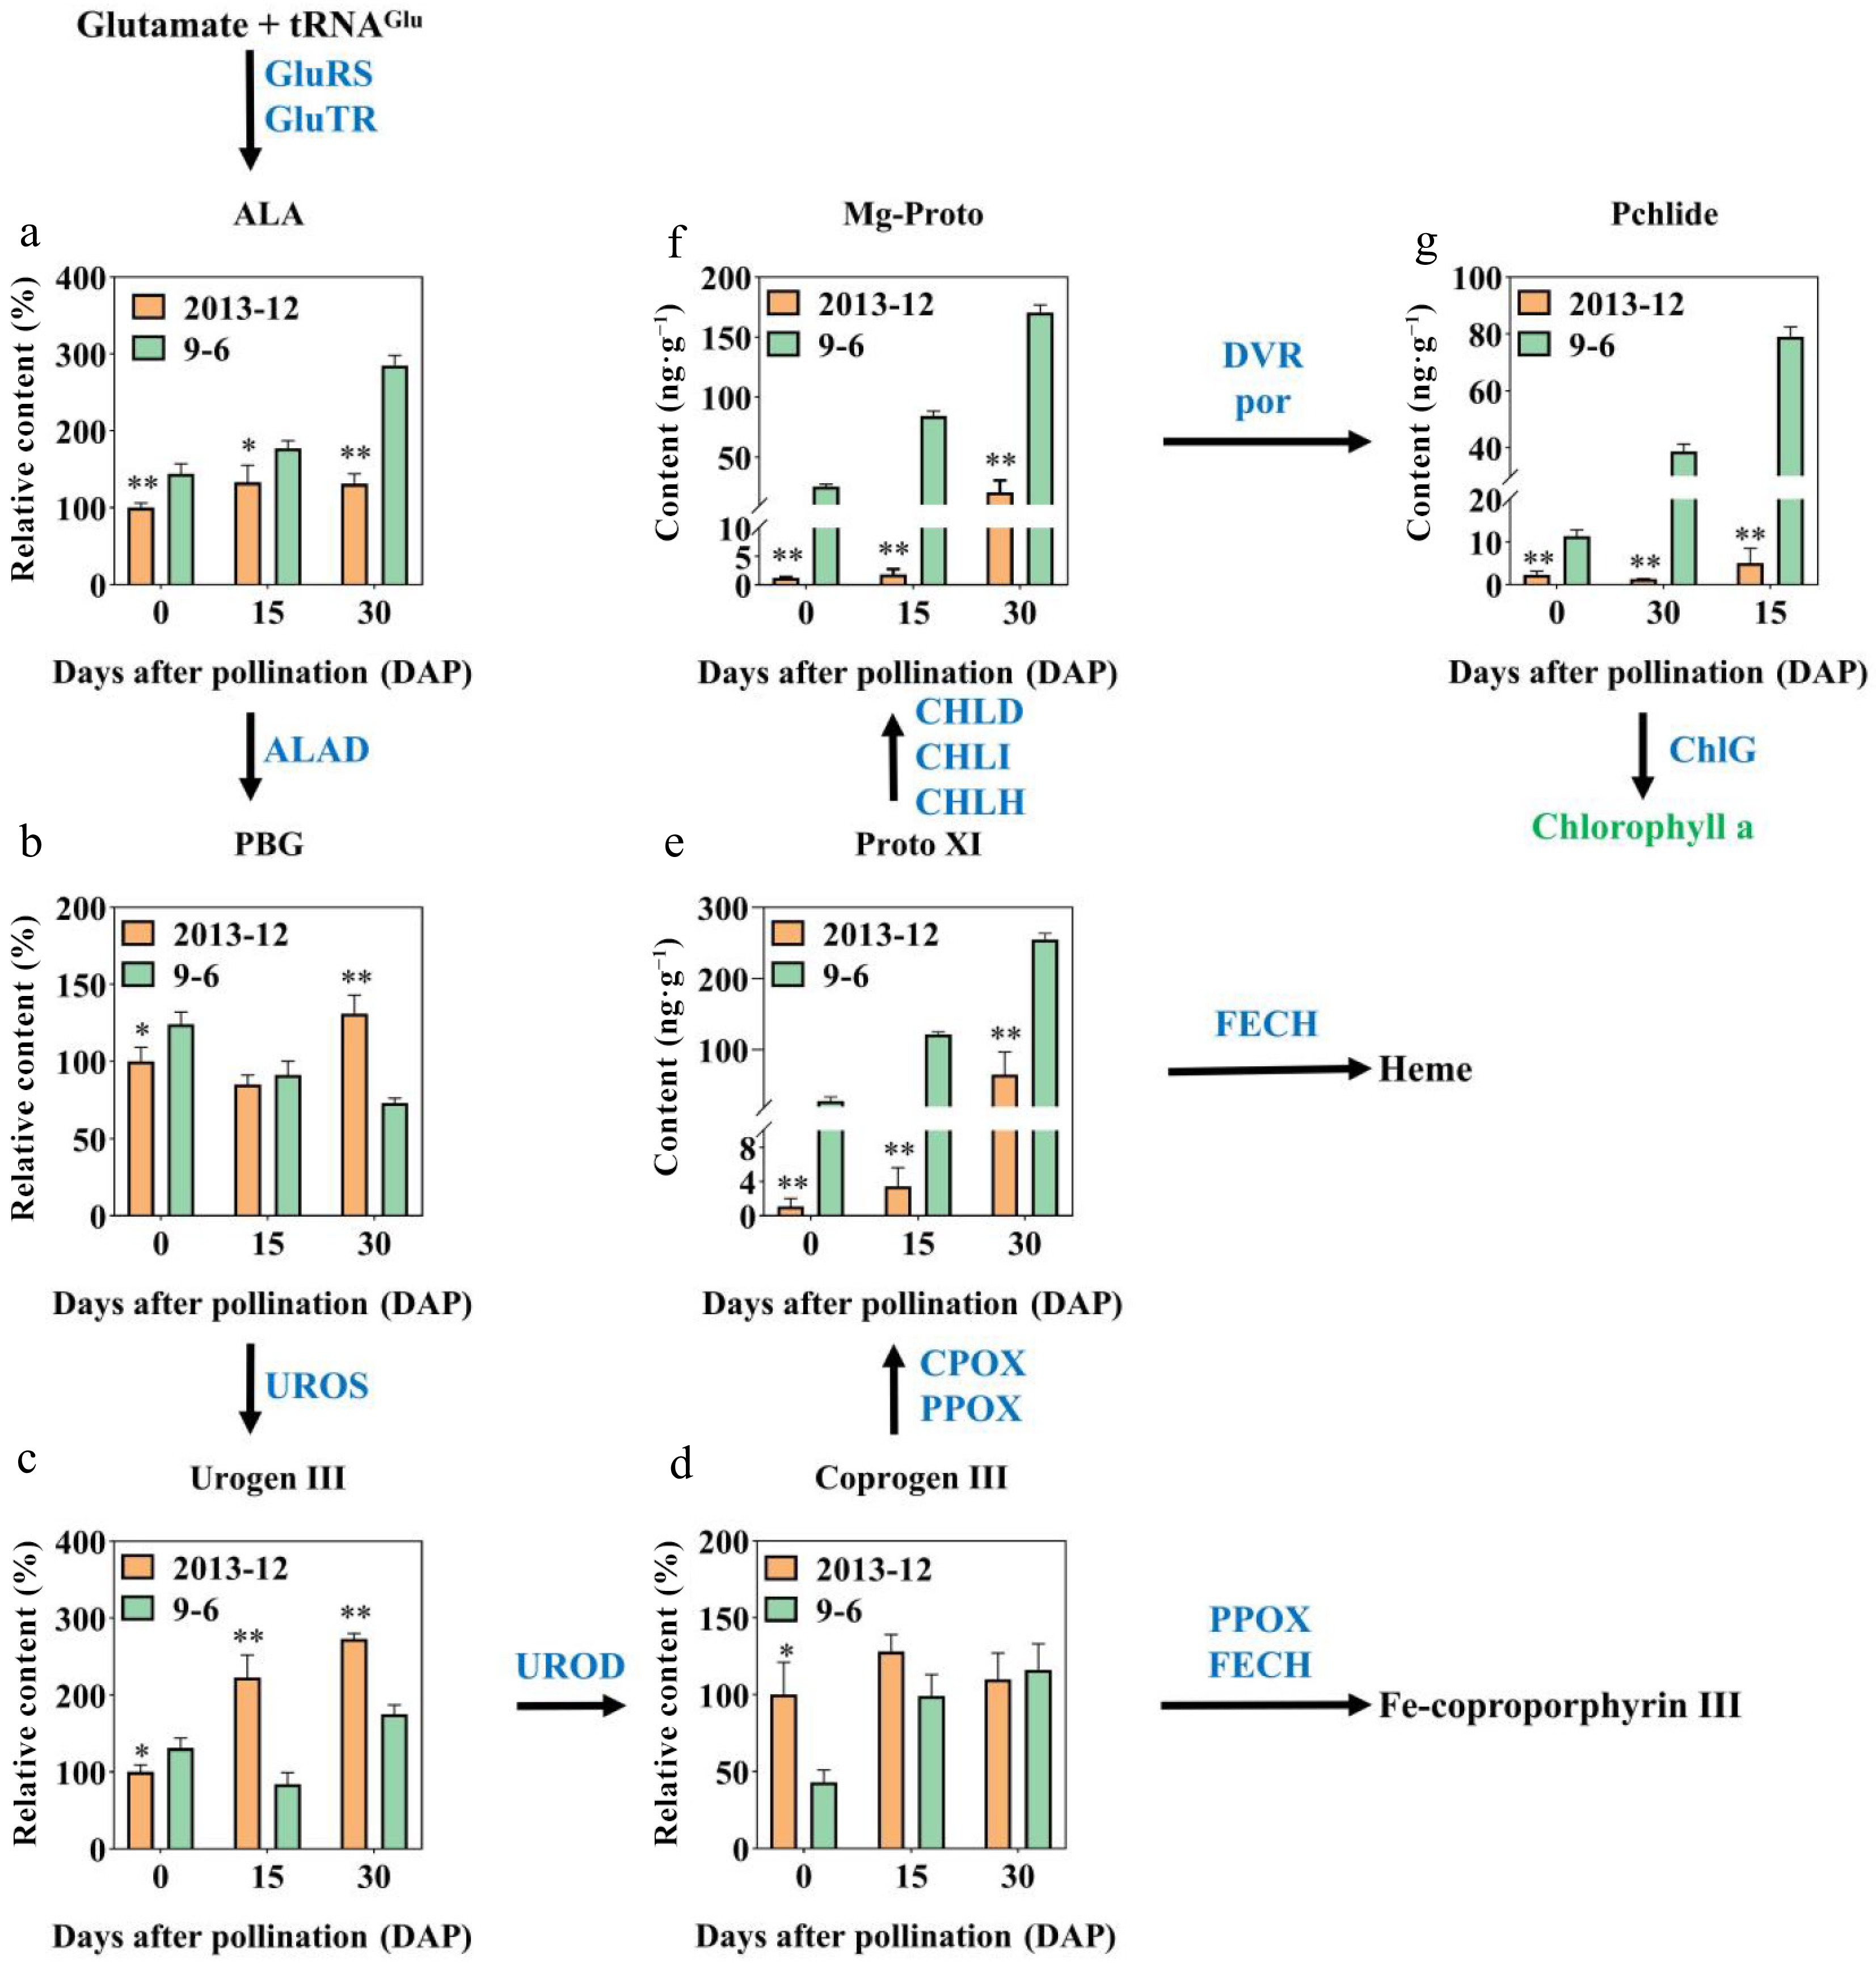
Figure 2.
Relative contents of precursors involved in chlorophyll synthesis of '2013-12' and '9-6' at 0, 15, and 30 DAP. (a) ALA; (b) PBG; (c) UrogenI II; (d) Coprogen III; (e) Proto XI; (f) Mg-Proto; (g) Pchlide. This pathway was constructed on the basis of the KEGG pathway. Enzymes involved in chlorophyll biosynthesis and metabolic pathways are shown in blue. The contents of fruit peel with fresh weight were calculated. The content of '2013-12' 0 DAP was set as 100% to calculate the relative content at 15 DAP and 30 DAP of '2013-12', and the three periods of '9-6'. The values are the average ± SD of three replicates. Significant differences are indicated by asterisks; * indicates a significant difference (0.05 > p ≥ 0.01), and ** represents an extremely significant difference (0.01 > p ≥ 0.001).
-
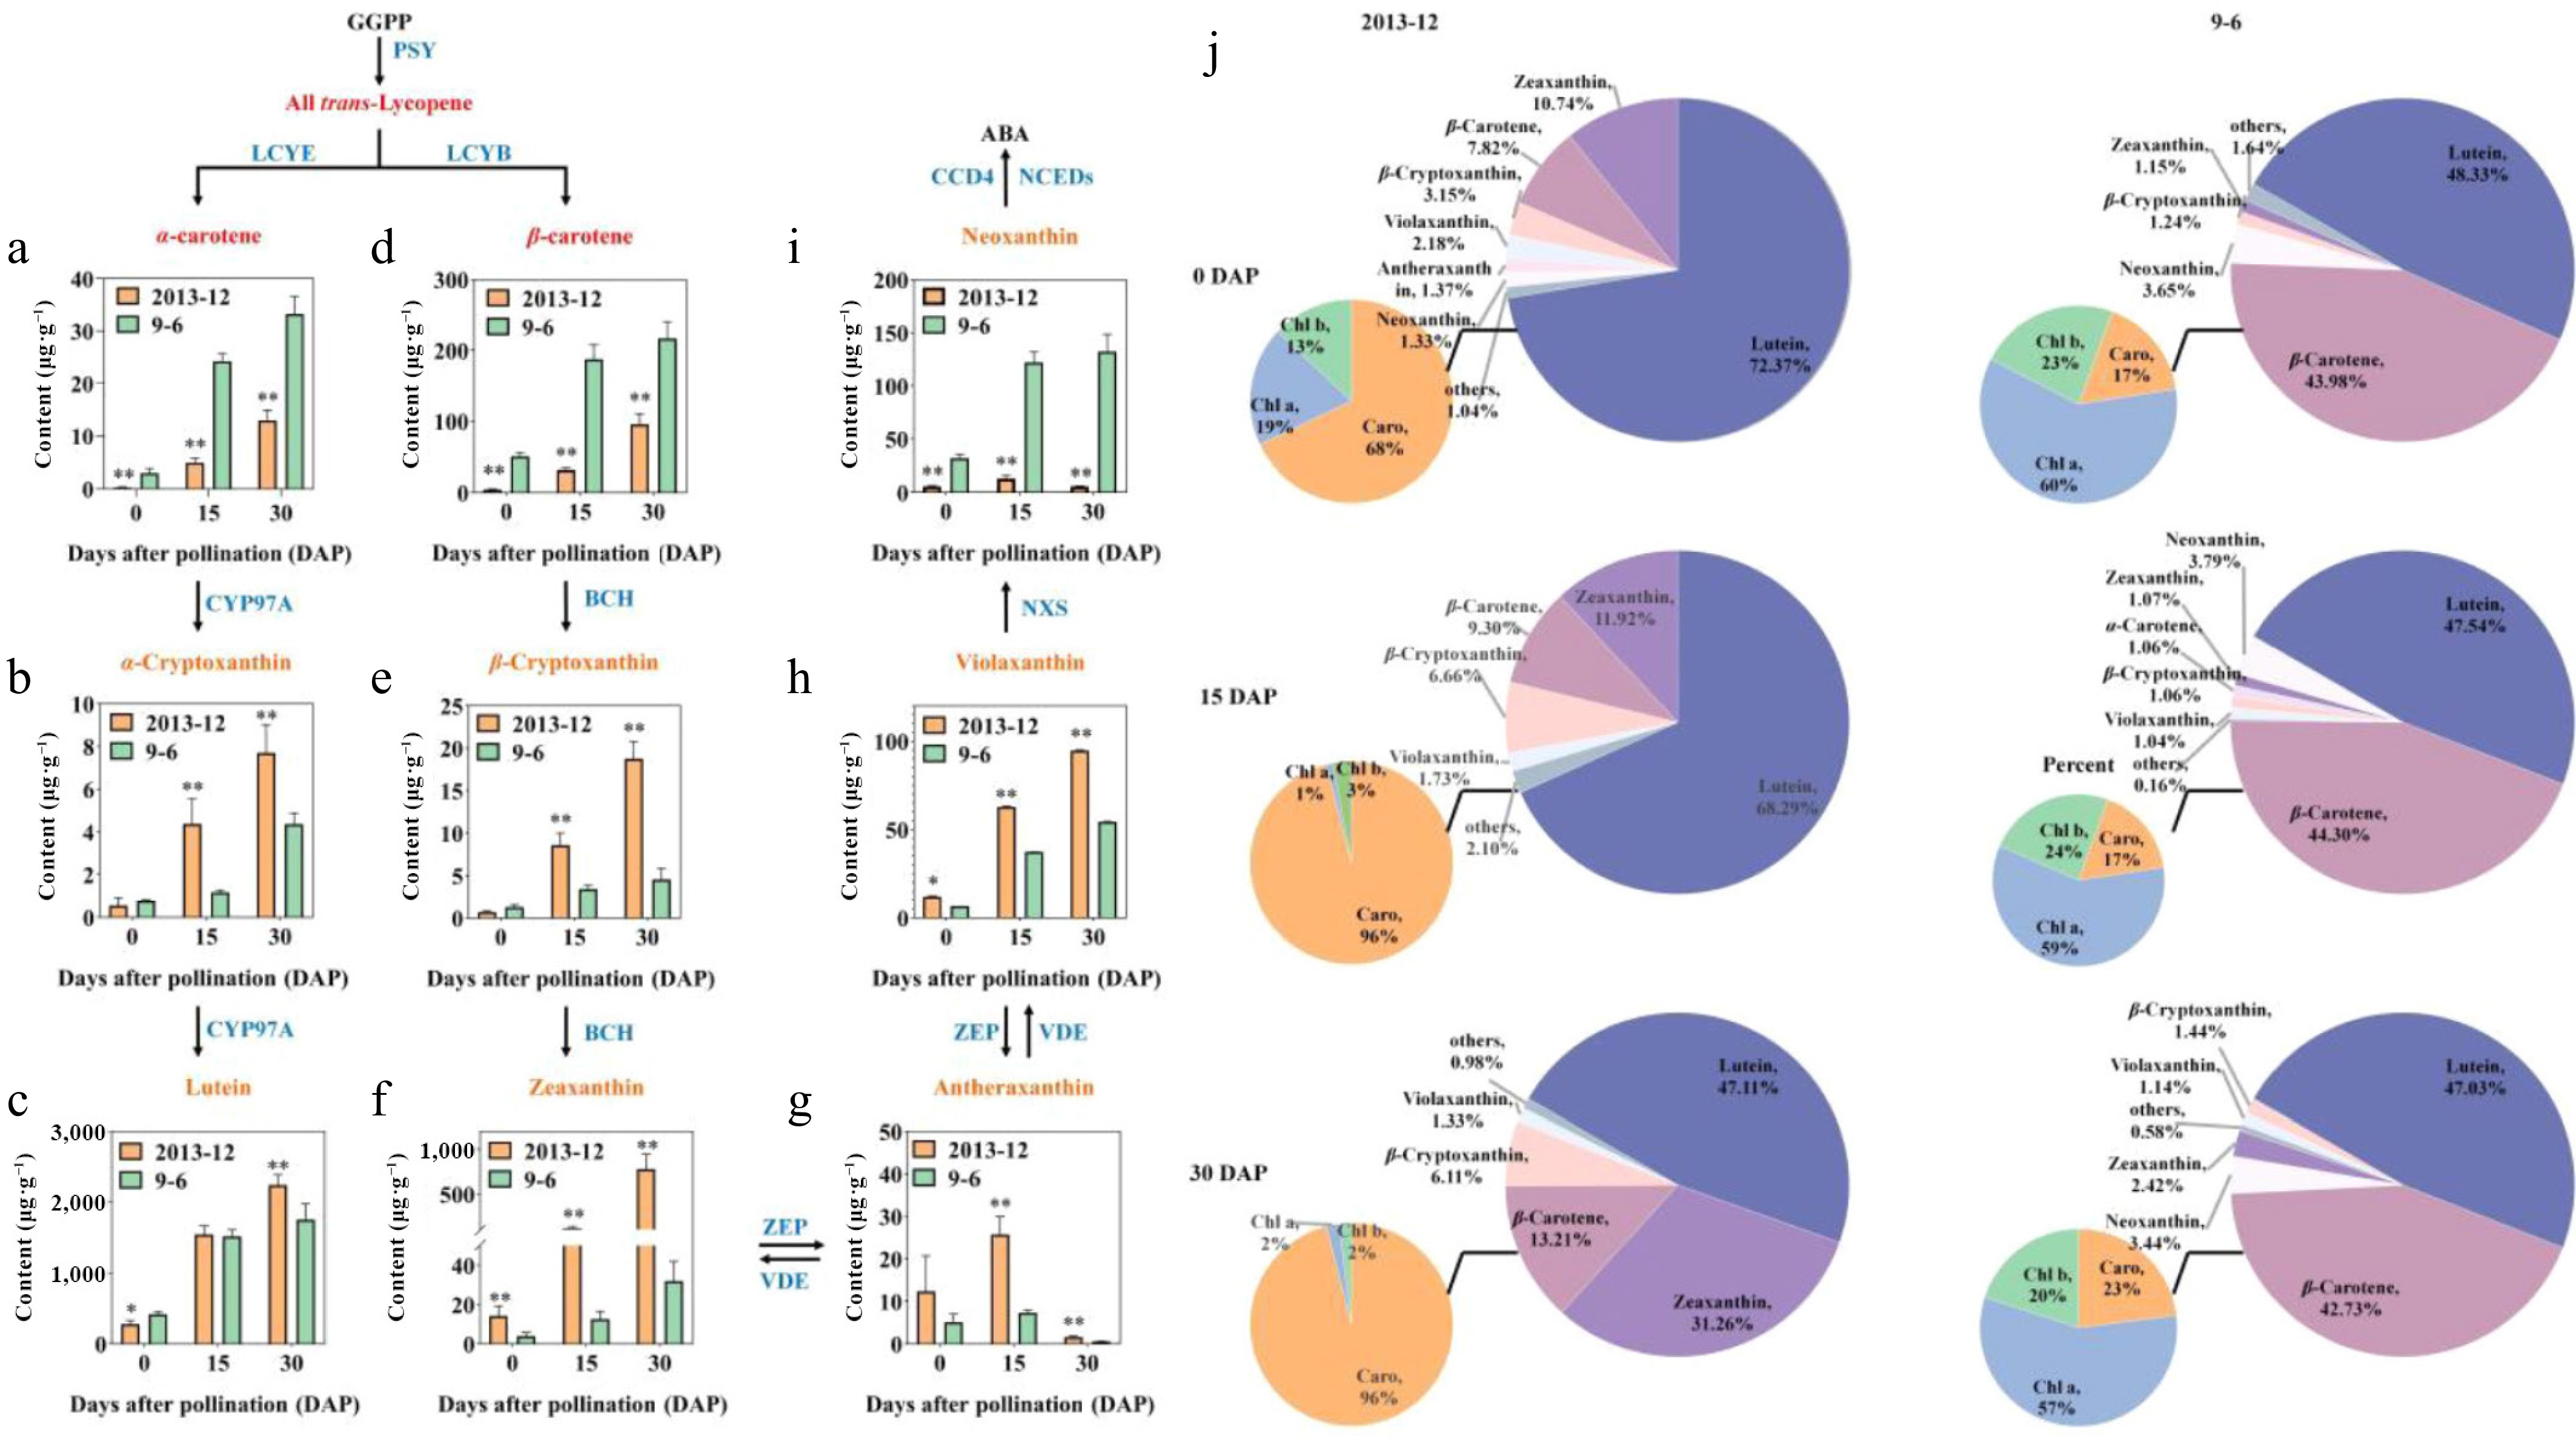
Figure 3.
The major carotenoid contents of Cucurbita maxima fresh peels. (a) α-carotene; (b) α-cryptoxanthin; (c) lutein; (d) β-carotene; (e) β-cryptoxanthin; (f) Zeaxanthin; (g) antheraxanthin; (h) violaxanthin; (i) neoxanthin. The pathway was constructed on the basis of the KEGG pathway. Enzymes involved in the carotenoid biosynthesis and metabolic pathways are shown in blue. The contents of fruit peel with fresh weight were calculated. The values are the average ± SD of three replicates. Significant differences are indicated by asterisks; * indicates a significant difference (0.05 > p ≥ 0.01), and ** represents an extremely significant difference (0.01 > p ≥ 0.001). j Pie chart of the major carotenoid contents in peel.
-
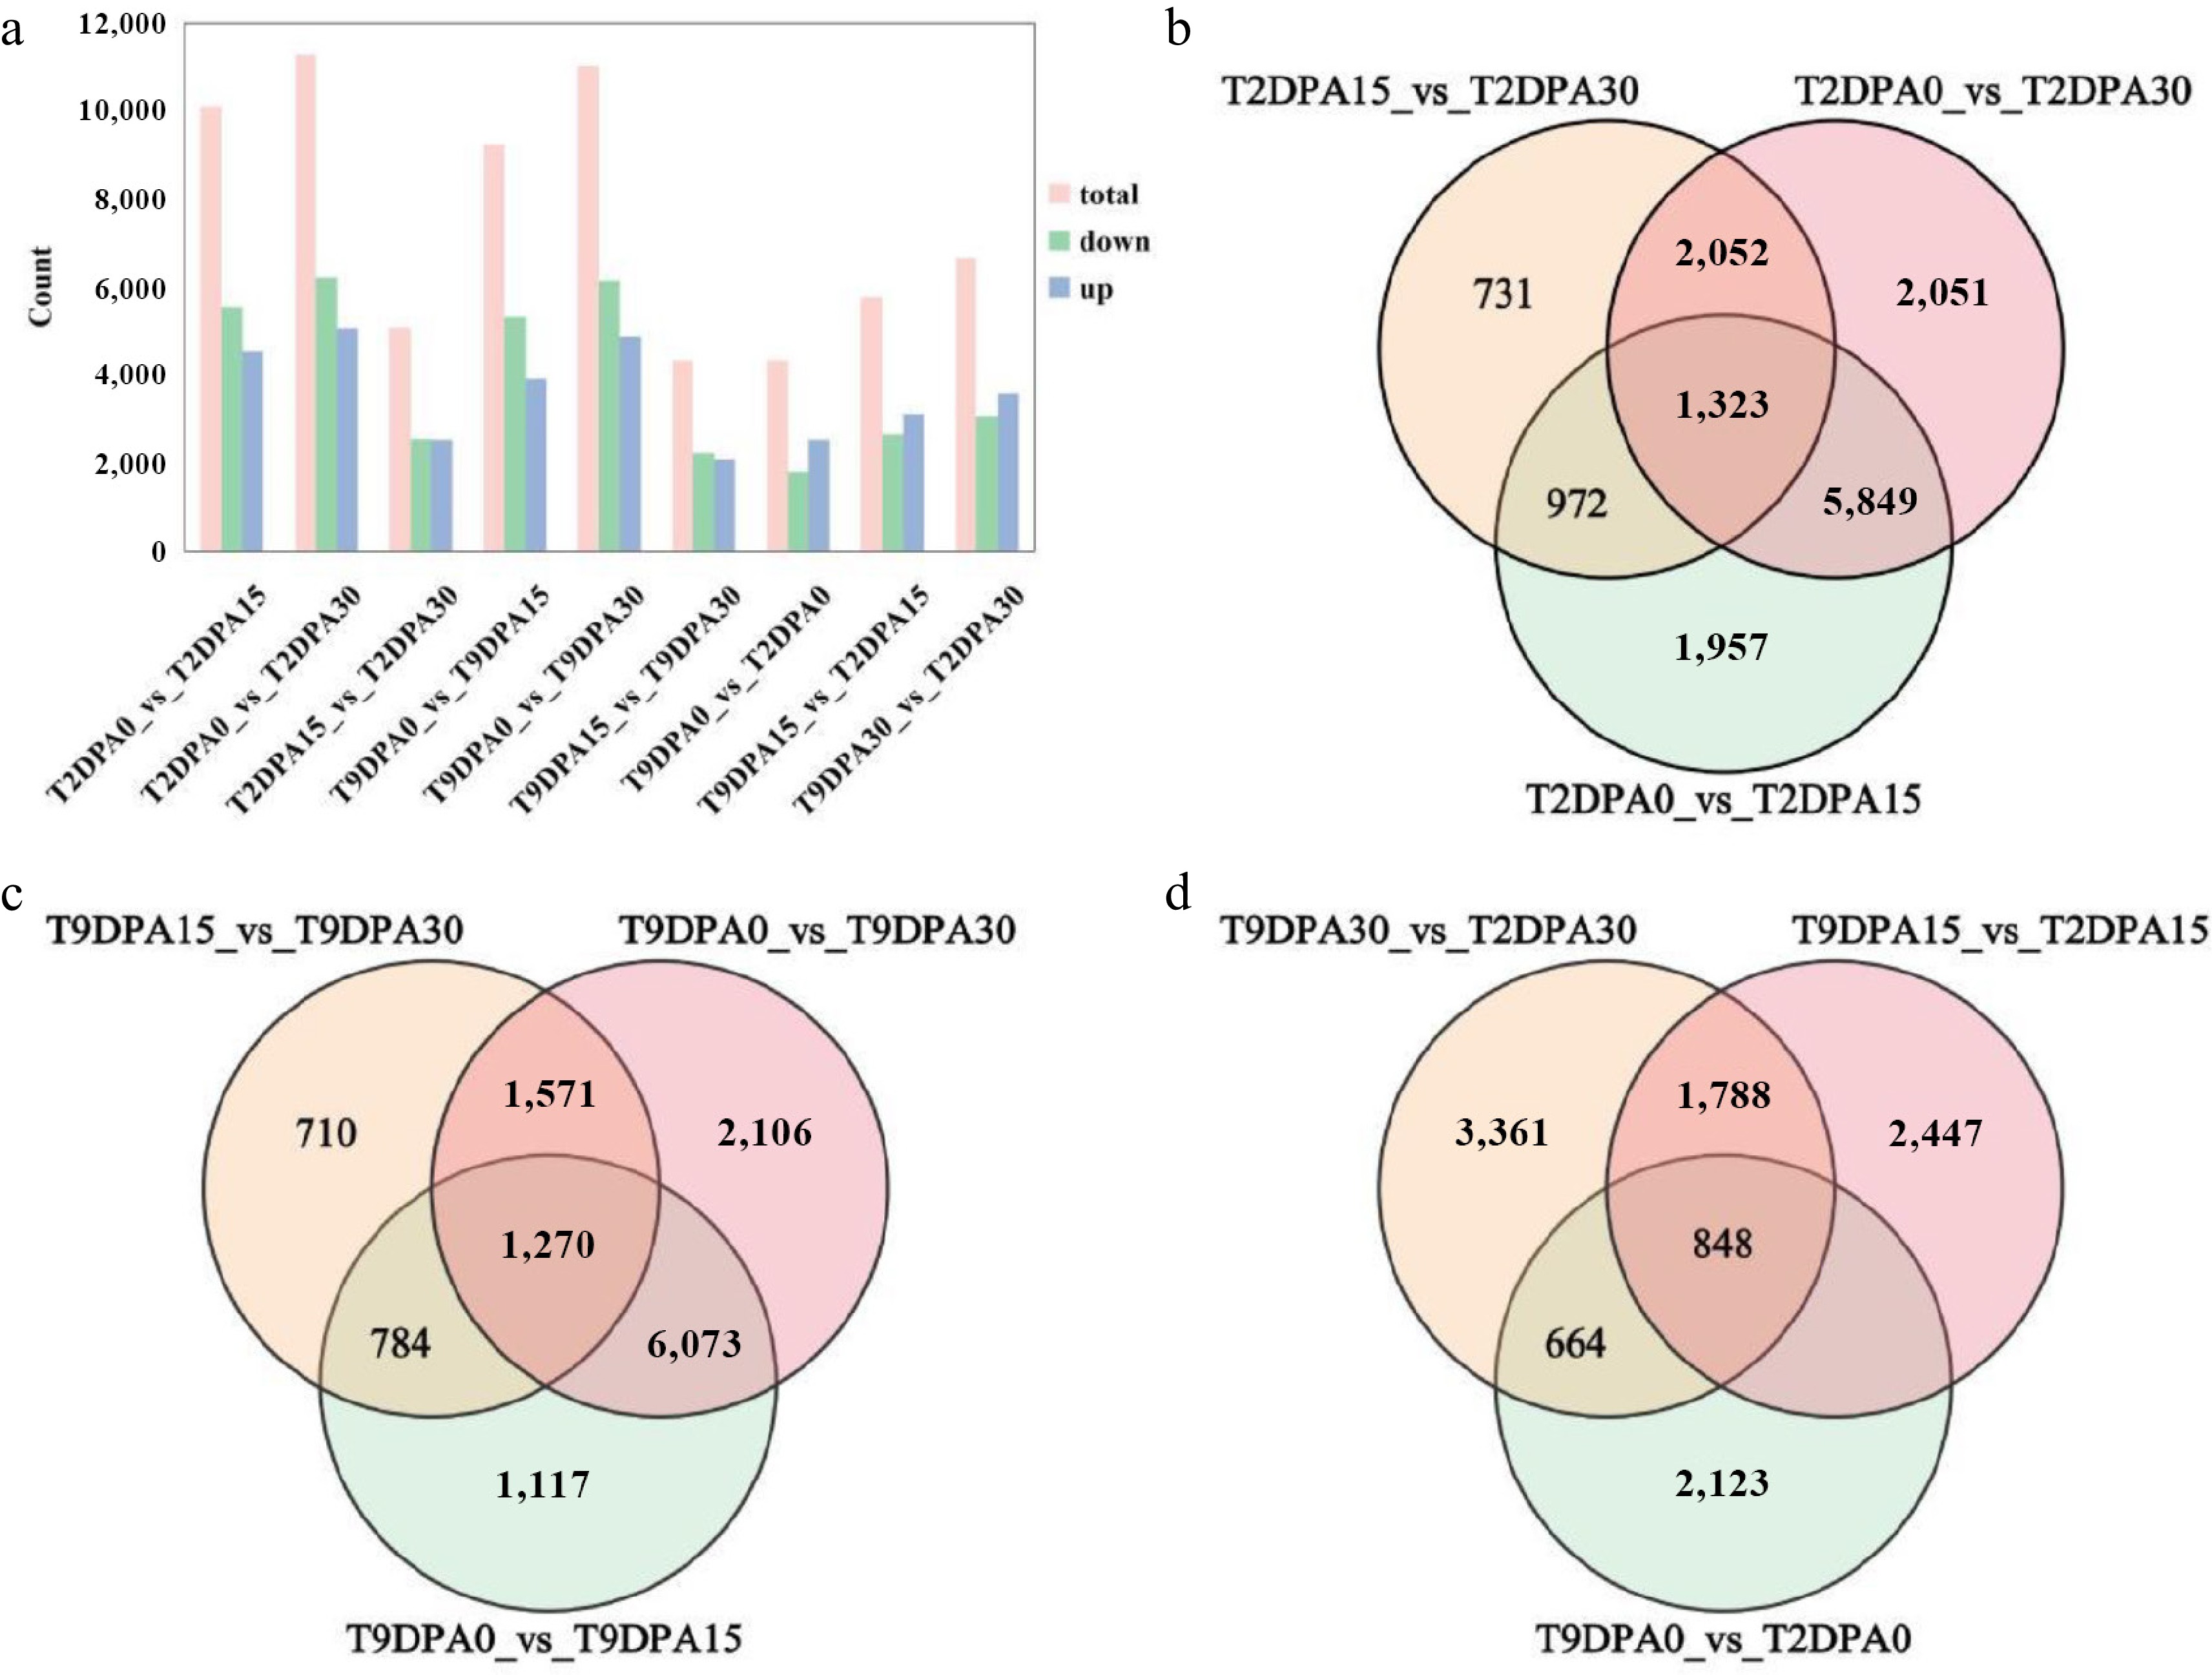
Figure 4.
Statistics of differentially expressed genes in the peel of Cucurbita maxima. (a) Statistics of differentially expressed genes in peel; the vertical axis represents the number of differentially expressed genes. The bar values are averages of three replicates. Venn diagram depicting the shared and specific genes in the peels of the (b) '2013-12', and (c) '9-6 inbred lines during different fruit development periods. (d) Venn diagram depicting the shared and specific genes in the peels of the two inbred lines during the same fruit development periods. 9DPA0: fruit of '9-6' at 0 DAP; 9DPA15: fruit of '9-6' at 15 DAP; 9DPA30: fruit of '9-6' at 30 DAP; 2DPA0: fruit of '2013-12' at 0 DPA; 2DAP15: fruit of '2013-12' at 15 DAP; 2DPA30: fruit of '2013-12' at 30 DAP.
-
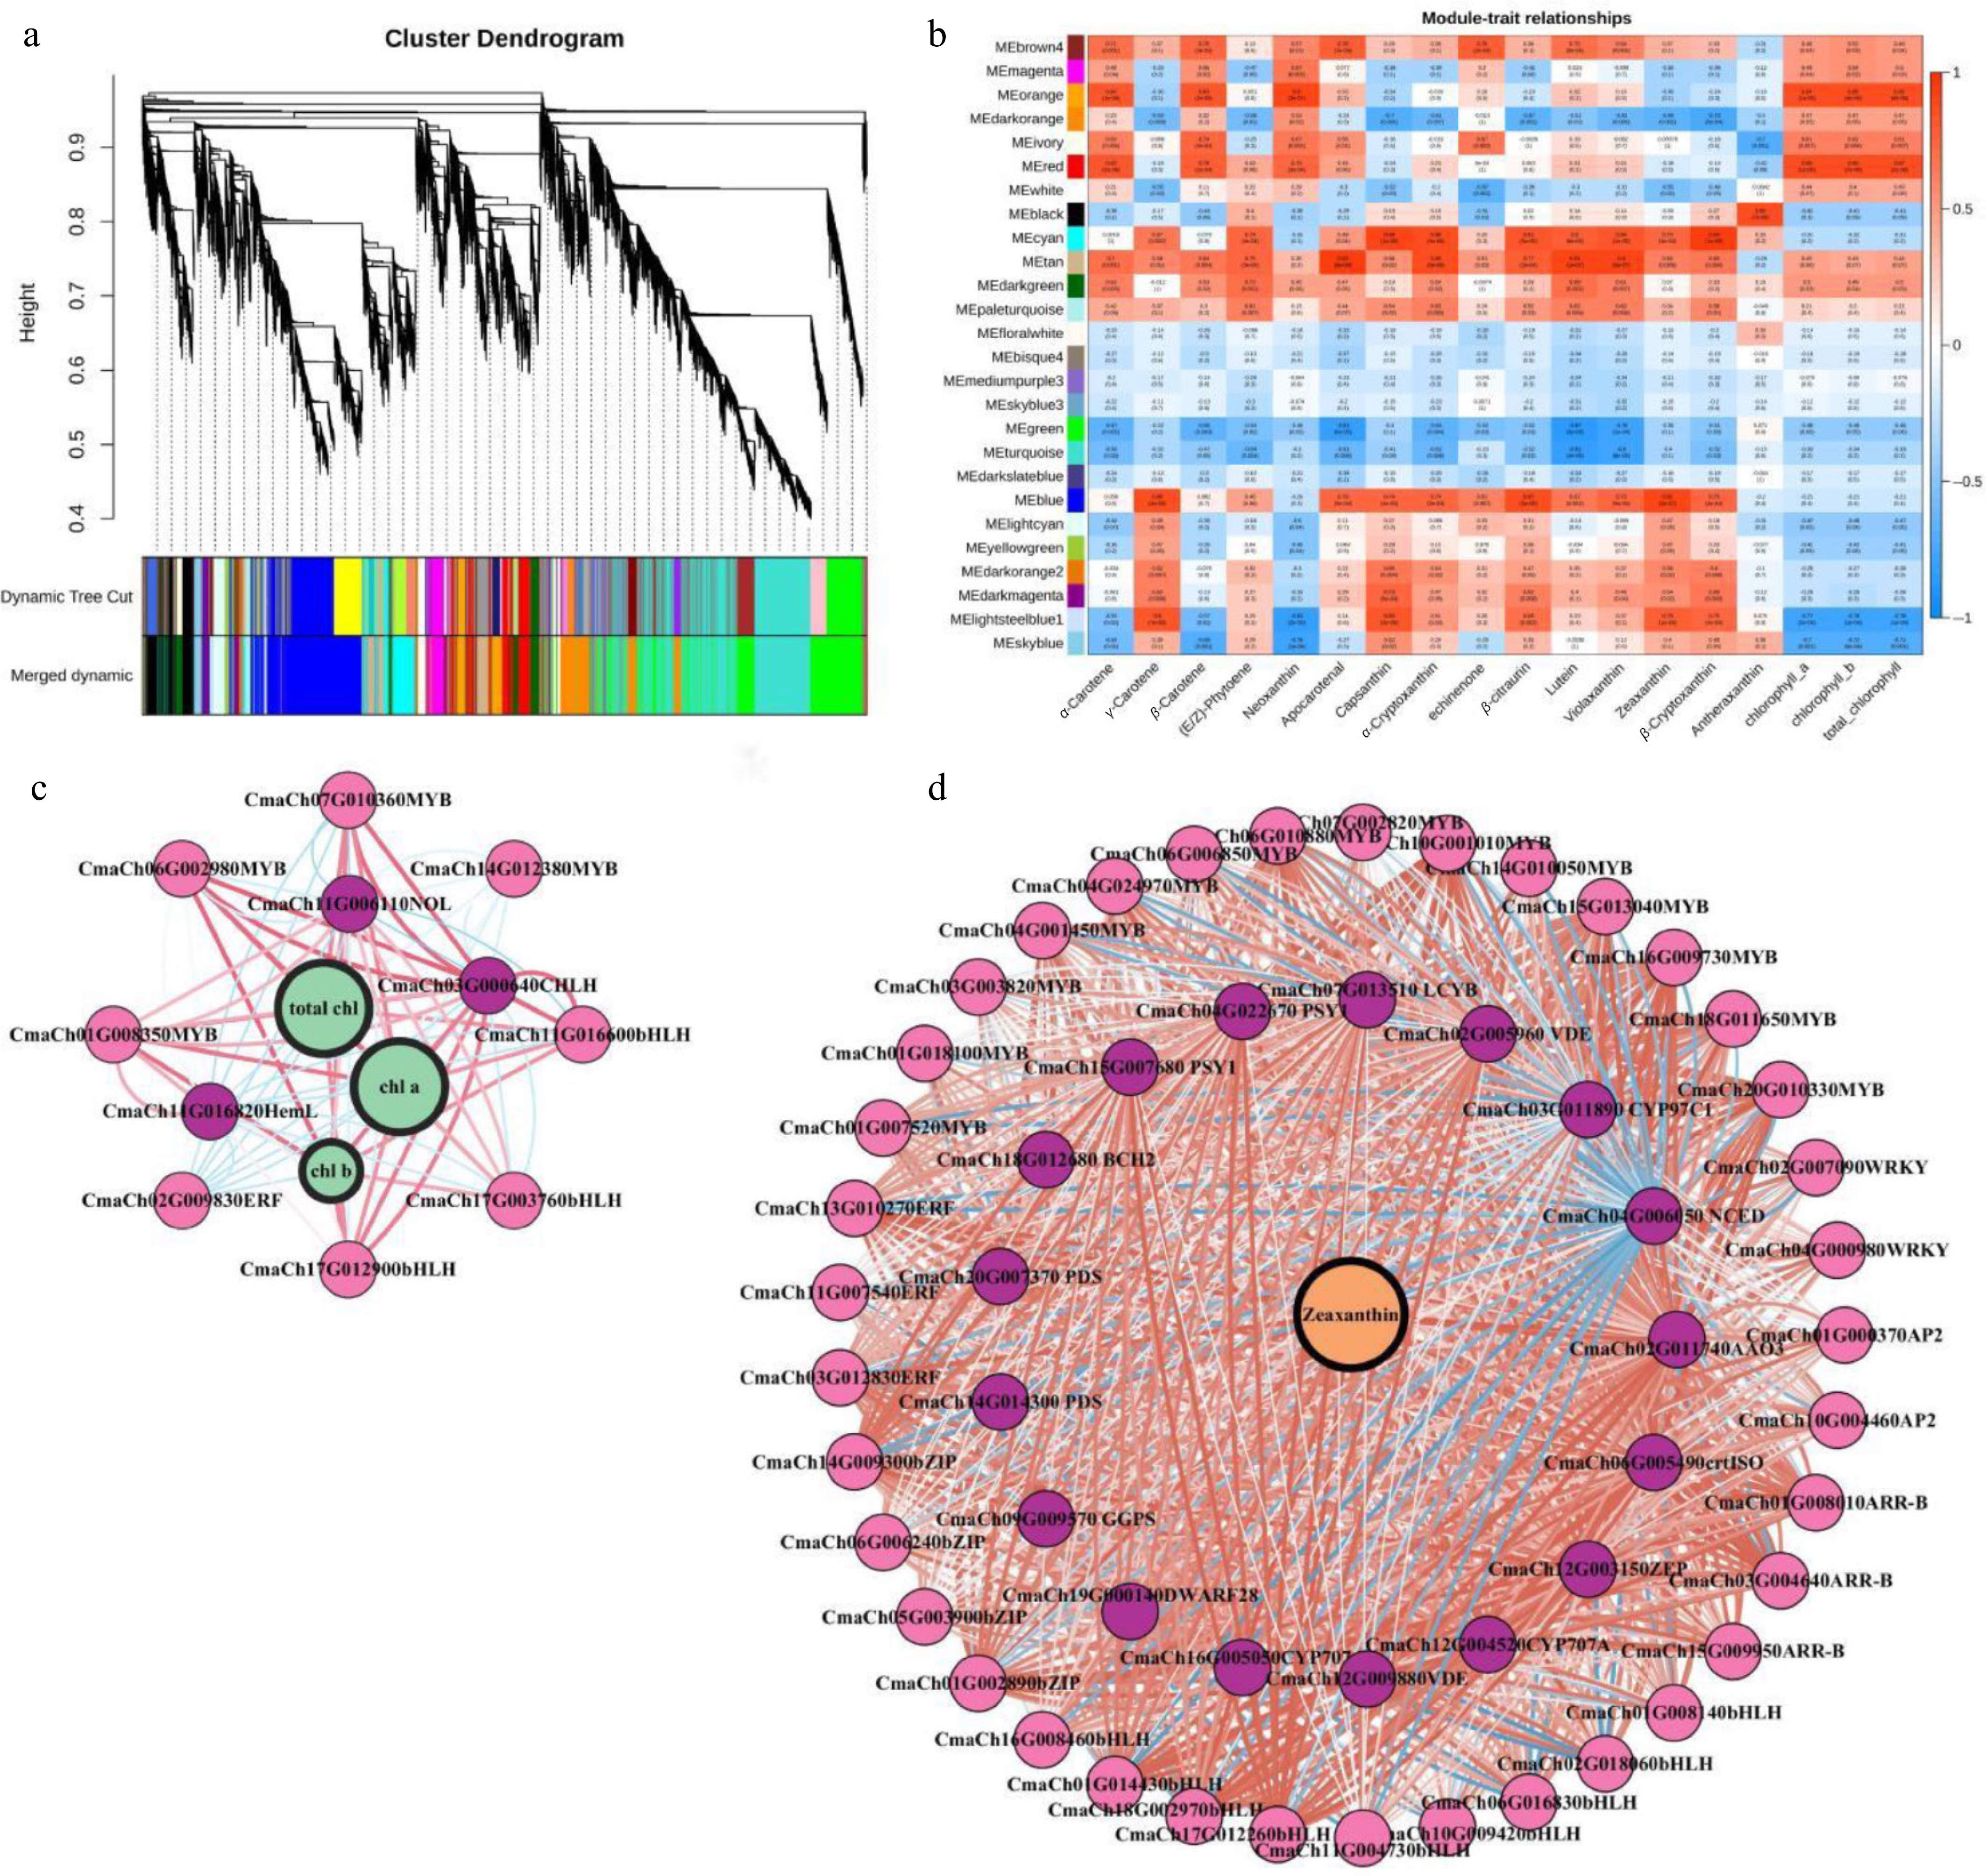
Figure 5.
WGCNA of transcriptomic dates. (a) Tree maps of 21,395 DEGs were constructed via hierarchical clusters with topological overlap dissimilarity. Each gene is depicted by leaves on a branch of the tree map. The height on the y-axis represents the coexpression distance between two DEGs. The dynamic trees were cut and identified by a merge threshold of 0.85 and constructed into main branches with 26 different coexpression modules. (b) The correlation between the module characteristic gene (ME, row), and the content of each pigment category (column) in pumpkin peel. The red and blue colors indicate the pertinent intensity and orientation, respectively. The numbers in the pane represent the partial Pearson correlations, and the corresponding p values are shown in parentheses. (c) Subnetwork of zeaxanthin, structural genes related to the anabolic pathway of carotenoids and putative TFs from the blue module. (d) Subnetwork of genes related to chlorophyll metabolism and catabolism and putative TFs from the orange and red modules. The red circles indicate the metabolites. The green circles represent the pathway genes. The gray circles indicate the TFs. The lines between the two dots represent the relationship of their interactions. The red and blue lines represent positive or negative relationships, respectively, between metabolites and genes or between two genes. The width of the lines represents the strength of the correlation. The width of the label lines denotes the FC between different samples.
-
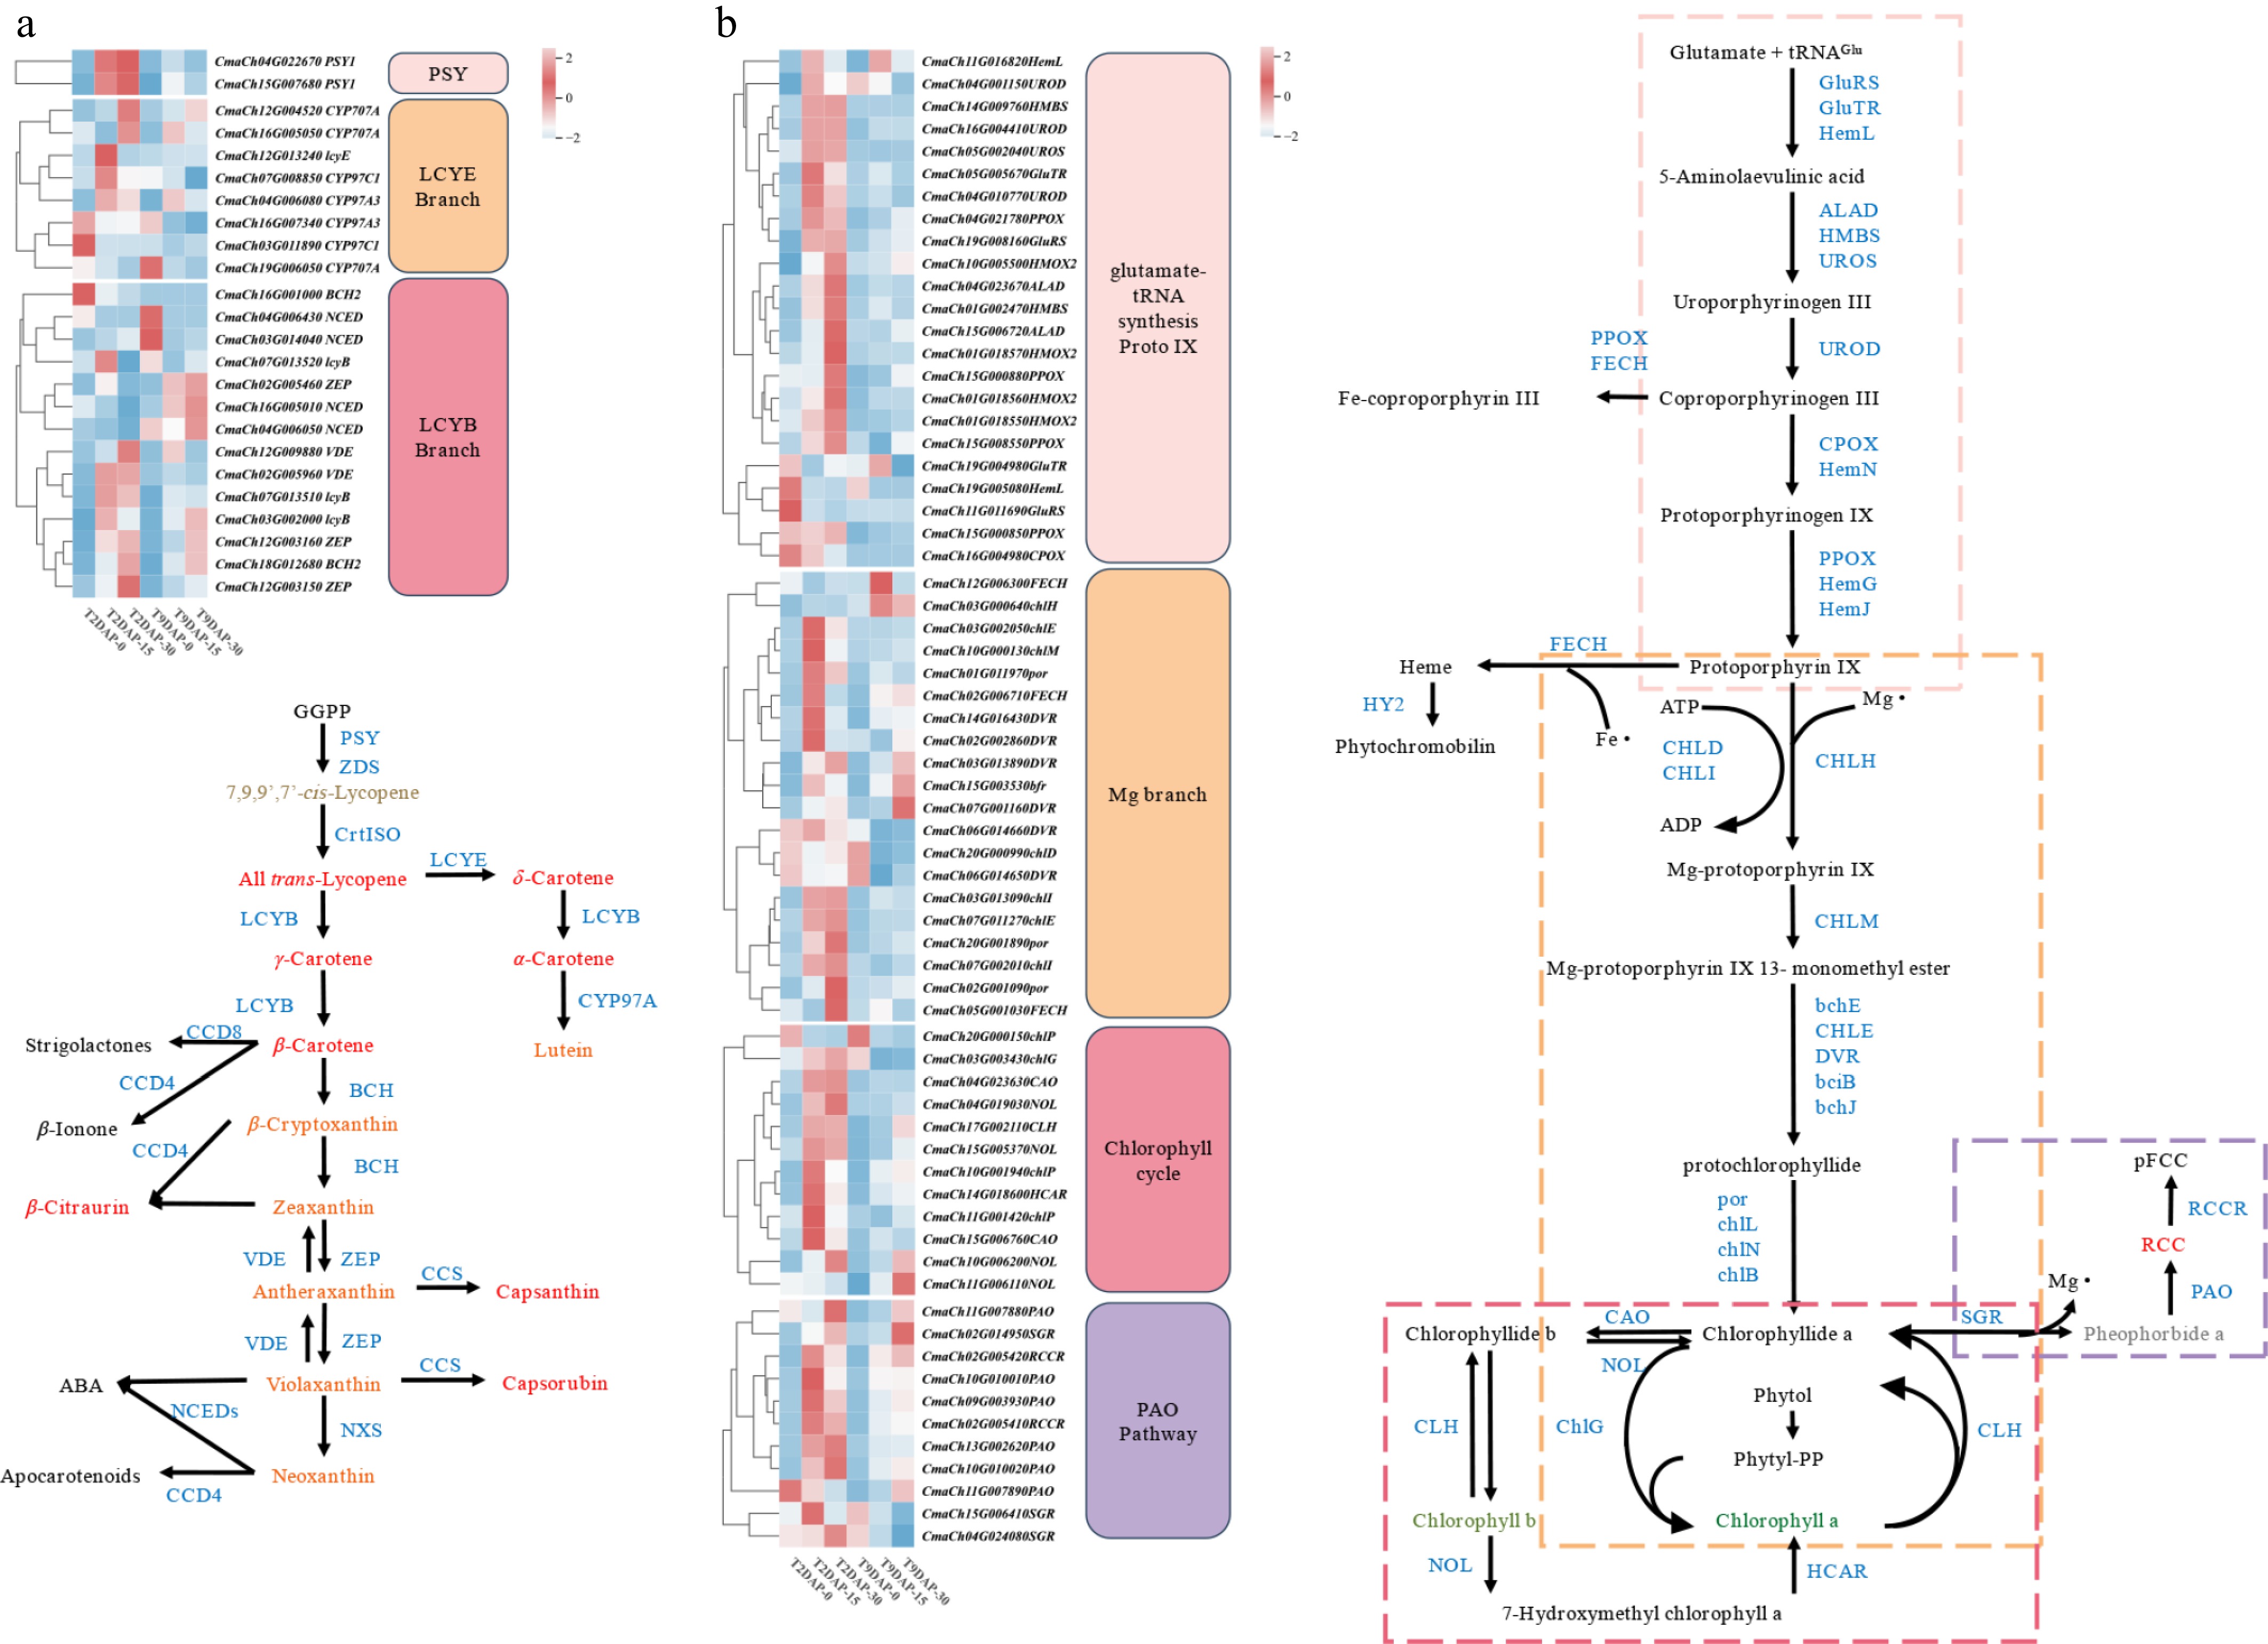
Figure 6.
Heatmap of the DEGs in the three fruit development periods of '2013-12' and '9-6'. (a) DEGs involved in carotenoid biosynthesis. (b) DEGs involved in chlorophyll metabolism. The level of gene expression was quantified as the mean FPKM value across three biological replicates for each sample. The red and green colors in the heatmap represent the expression level of each gene. Enzymes involved in carotenoid biosynthesis, chlorophyll biosynthesis and metabolic pathways are blue in color. The small blue dotted box indicates the glutamate-tRNA to Proto IX process, the orange dotted box indicates the 'Mg branch', the blue dotted box indicates the 'chlorophyll cycle', and the red dotted box indicates the 'PAO pathway'.
-
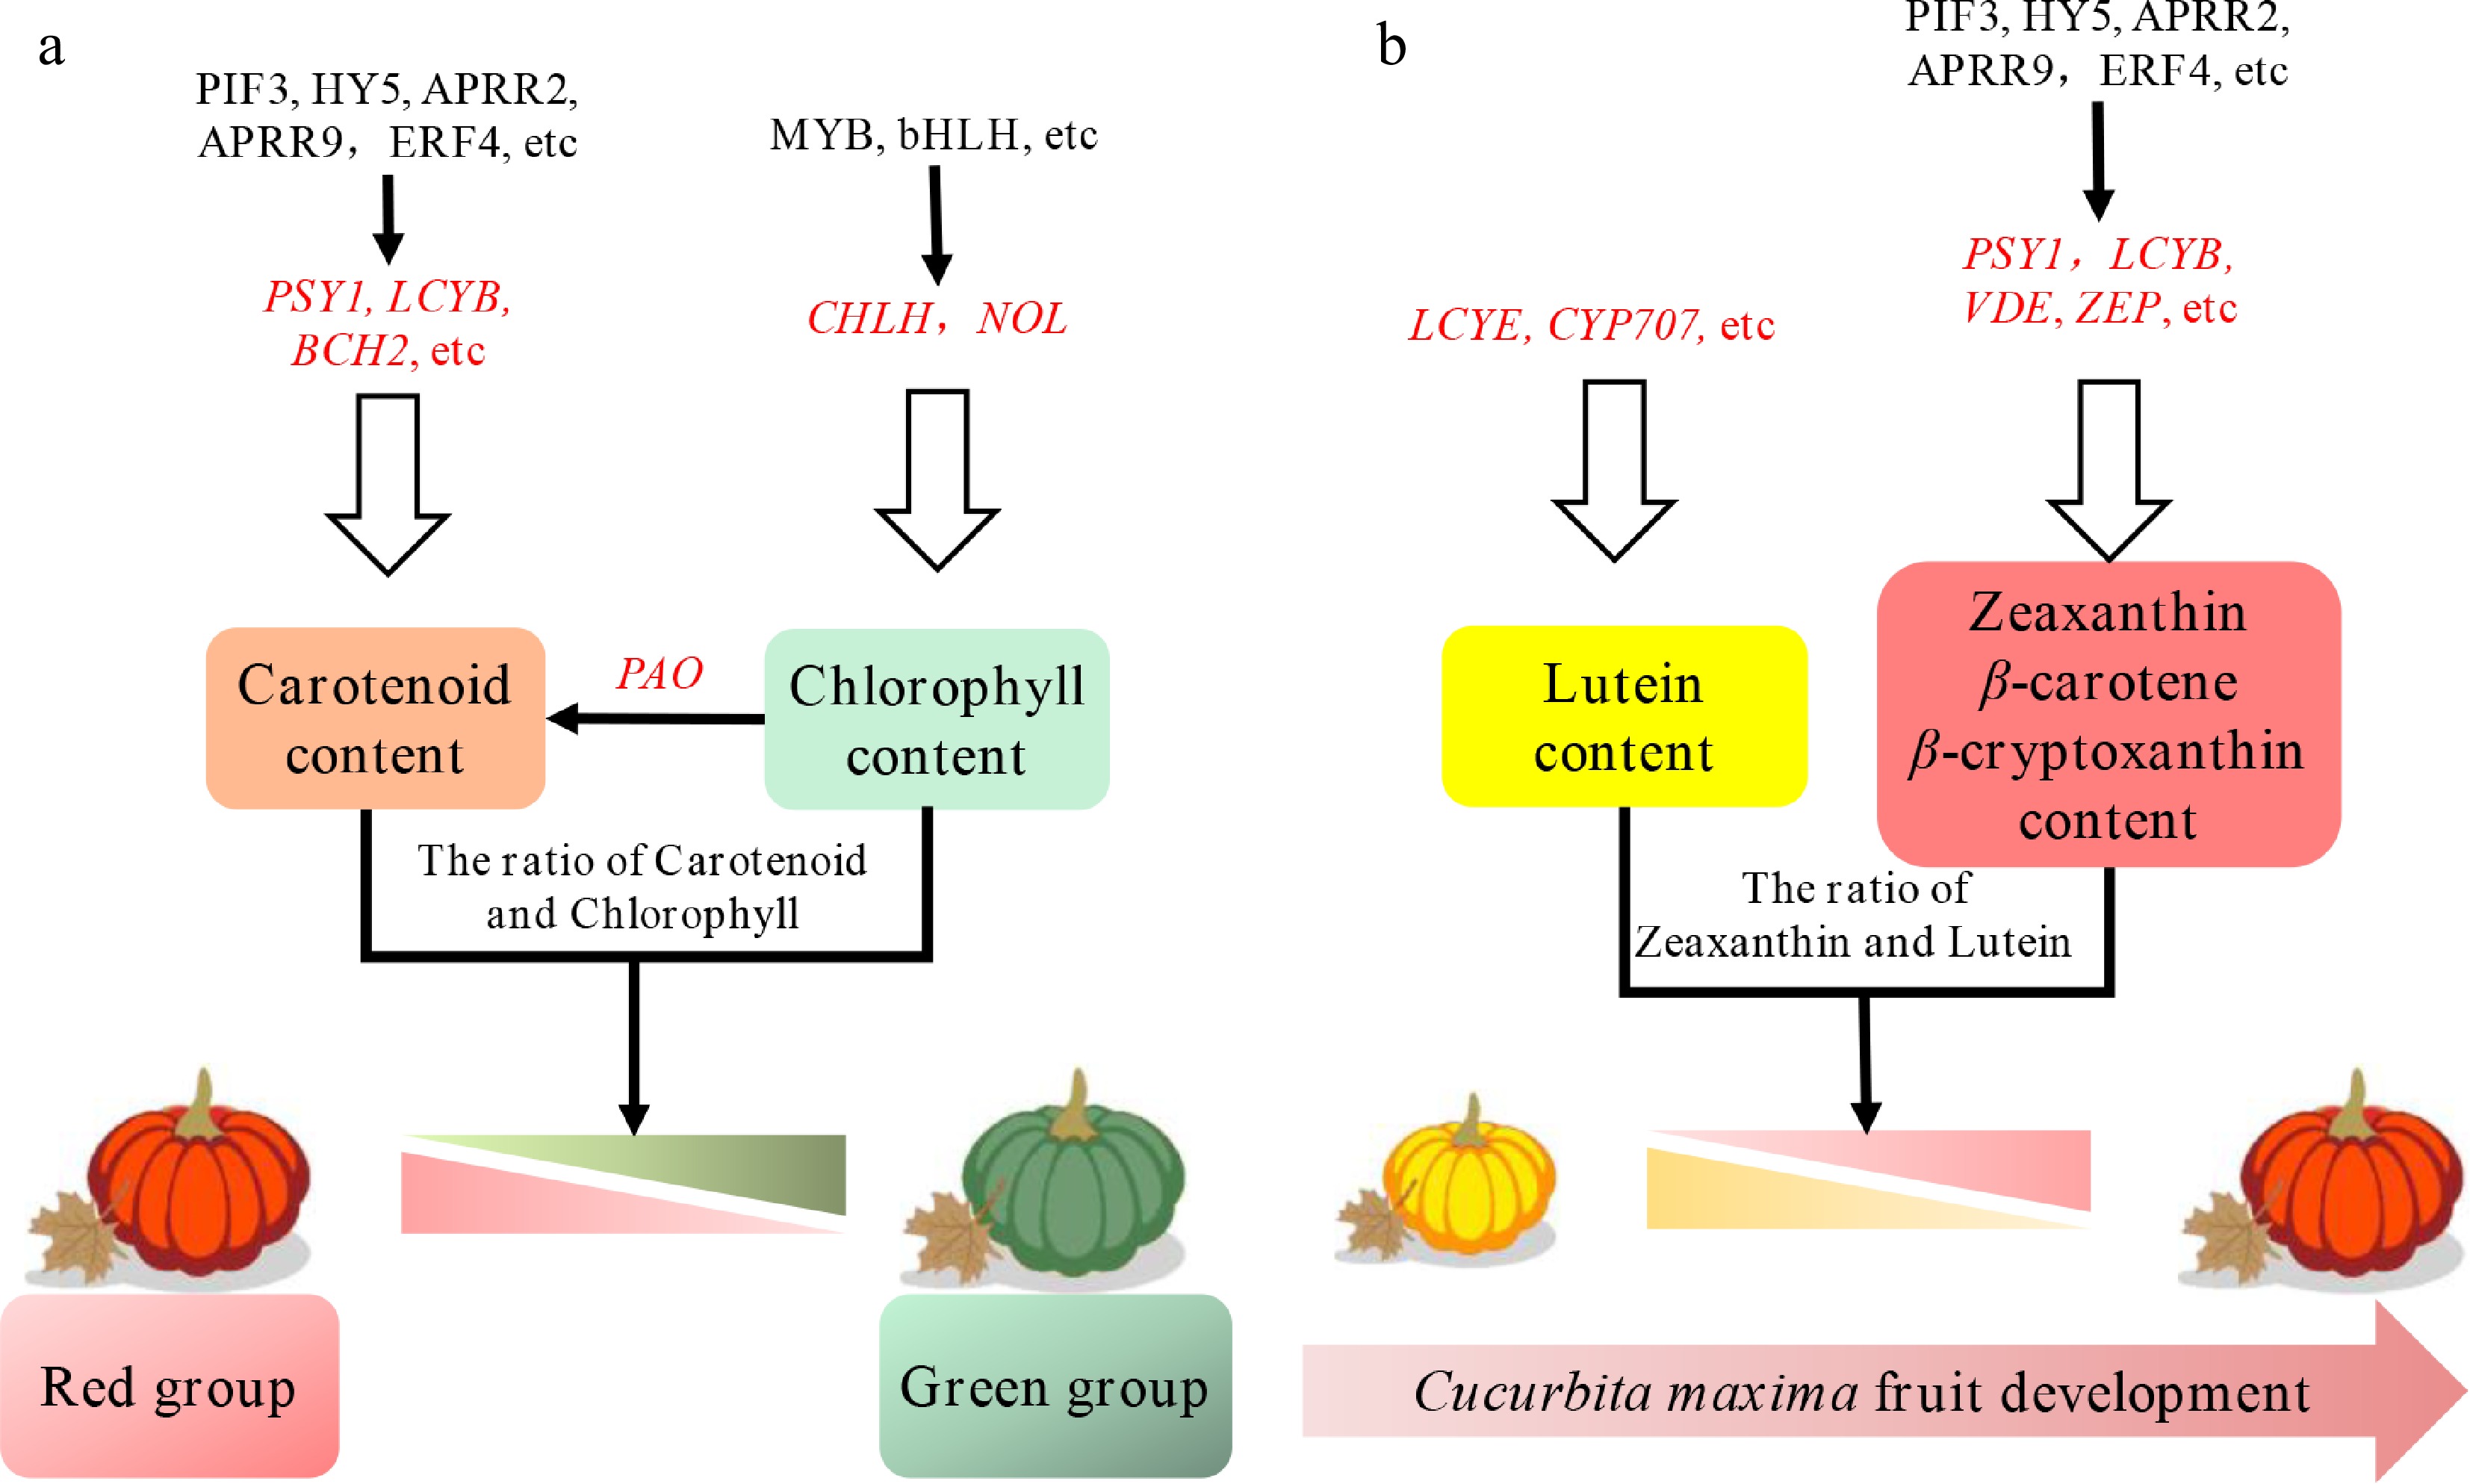
Figure 7.
Proposed model of anabolic and catabolic pathways for carotenoids and chlorophyll in Cucurbita maxima peel. (a) The proposed model with mature peels in the red and green groups. (b) The proposed model with a young yellow peel, and red mature peel. The genes in red represent TFs. The genes in black are pathway genes. The red triangle and the green triangle represent the coloration levels of the pumpkin peel from dark to light.
-
DAP Material Chl a (mg/g) Chl b (mg/g) Total chlorophyll
(mg/g)Carotenoid
(mg/g)Chl a/Chl b Caro/Chl 0 2013-12 0.01 ± 0.006 dD 0.01 ± 0.005 dC 0.02 ± 0.005 dD 0.24 ± 0.04 eD 1 ± 0.001 bAB 10.78 ± 2.91 bB 0 9-6 0.94 ± 0.05 cC 0.35 ± 0.03 cC 1.29 ± 0.04 cC 0.51 ± 0.05 eD 2.71 ± 0.08 aA 0.40 ± 0.05 cC 15 2013-12 0.02 ± 0.01 dD 0.04 ± 0.006 cdC 0.06 ± 0.008 dD 1.51 ± 0.14 dC 0.5 ± 0.08 cB 22.75 ± 3.81 aA 15 9-6 5.07 ± 0.03 bB 2.02 ± 0.07 bB 7.09 ± 0.05 bB 1.88 ± 0.16 cBC 2.51 ± 0.1 aA 0.27 ± 0.02 cC 30 2013-12 0.08 ± 0.01 dD 0.06 ± 0.008 cdC 0.14 ± 0.009 dD 3.22 ± 0.33 aA 1.34 ± 0.31bcB 23.19 ± 3.98 aA 30 9-6 8.15 ± 0.71 aA 2.87 ± 0.41 aA 11.02 ± 0.56 aA 2.25 ± 0.27 bB 2.84 ± 0.39 aA 0.20 ± 0.01 cC Note: The chlorophyll and carotenoid content of fruit peel with fresh weight. Lowercase letters indicates significant difference (0.05 > p ≥ 0.01), and uppercase letters represent extremely significant difference (p < 0.01). Table 1.
Chlorophyll and carotenoid content of fruit peel at different development periods of Cucurbita maxima fruit.
Figures
(7)
Tables
(1)