


-
Cucurbita maxima Duchesne represents a significant economic crop species of the Cucurbita genus. The peel color changes with the development process of fruit[1]. Cucurbita maxima contains a diverse array of peel colors, including yellow, orange, red, green, gray, white-gray, and others. These colors can be classified into three series (red, yellow, and green) using a colorimeter. The red and yellow groups usually contain high amounts of carotenoids and little chlorophyll. The green group, which includes green, dark green, and gray colors, contains significantly higher chlorophyll content than the other groups[2]. Metabonomic analysis has revealed that the presence of carotenoids in the peel of pumpkin fruit are primarily lutein, α-carotene, β-carotene, zeaxanthin, and violaxanthin[3]. The yellow peel mainly contains lutein, and the red peel mainly contains lutein, β-carotene, β-cryptoxanthin, and zeaxanthin. The peels of the green group mainly accumulate lutein, β-carotene, and violaxanthin[2]. Different carotenoid content and ratio changes with different peel colors and species. The red group peel pumpkin does not need to be peeled during the process of pumpkin powder production, which is more convenient than the green group. In addition, the color of the ripe fruit is more attractive to animals than the color of the young fruit, helping the plants disperse their seeds. Hence, studying the peel coloration mechanism of pumpkin production holds immense significance.
The ultimate determination of plant color relies on the ratio of the carotenoid and chlorophyll content[4]. As a naturally occurring pigment, carotenoid is a significant developmental signal in leaves, flowers, and fruit that respond to light efficiently by trapping and safeguarding tissues from the harmful effects of photooxidative damage[1,5]. Isopentenyl diphosphate isomerase (IPP), predominantly sourced from the methyl-D-erythritol 4-phosphate (MEP) pathway, is a precursor in carotenoid synthesis[6]. After the undergoes catalysis by geranylgeranyl diphosphate synthase (GGPPS), the IPP results in the production of geranylgeranyldiphosphate (GGPP) alongside its isomer, dimethylallyl diphosphate (DMAPP). GGPP serves as a ubiquitous precursor in the biosynthetic pathways of carotenoids, chlorophyll, and other plant hormones such as gibberellin, abscisic acid, and so on. The GGPP condenses into phytoene under the catalysis of the phytoene synthase (PSY), and ultimately yields each carotenoid compound after diverse reactions, including condensation, dehydrogenation, cyclization, hydroxylation, and epoxidation[7].
Chlorophylls play a crucial role in photosynthesis for it harness the light energy, and participates in energy transfer by electron transfer and conjugate transfer for further utilization. In higher plants, the chlorophyll mainly contains chlorophyll a (Chl a) and chlorophyll b (Chl b) and is synthesized through two distinct biosynthetic pathway. One is the reaction process from L-glutamyl-tRNA towards protoporphyrin IX (protoIX), and subsequently to chlorophyll. This process is divided into four parts ('Glutamate-tRNA to Proto IX process', 'Mg branch', 'chlorophyll cycle', and 'PAO pathway'). The other one converts the fundamental substrate GGPP into chlorophyll a under the influence of the enzyme geranylgeranyl reductase (GGR)[7]. The GRP recruiting proteins orchestrate the channeling of GGPP towards the chlorophyll biosynthesis process in rice[8]. Some studies have revealed that the significant degradation or hindered synthesis of chlorophyll leads to an elevated proportion of carotenoids among total pigments and ultimately culminating in leaf yellowing[9]. The fruit is a metamorphosic leaf, and the coloration process of the fruit peel is similar to that of the leaves. This phenomenon has been confirmed in tomato (Solanum lycopersicum), common bean, and many other fruits[10].
Recently, conjoint analysis of the transcriptome and metabolome has been extensively employed to delve into the underlying mechanisms governing color formation in Cucurbita crops. In young cucumber fruit, the low expression of 4CL, CHS, and UFGT could lead to the reduction in naringenin chalcone, naringenin, and anthocyanidin, and a response to light green skin[11]. Compared with yellow peels, the formation of gray-green and dark-green fruit peel color in melon was determined by the upregulated genes F3H, IFS, FNSFLS, two 4CL genes, and three F30H genes. These genes regulate the accumulation of flavonoids, flavanones, flavonols, and isoflavones. They also downregulated genes, two ANS and UFGT, that participate in the accumulation of anthocyanidin[12]. In the peels of young zucchini fruit, the carotenoids that accumulate in orange, yellow, and green fruits are lutein, antheraxanthin, zeaxanthin, neoxanthin, and β-cryptoxanthin. The transcription levels of selected pivotal genes, including PSY1, LCYE2, RCCR3, and several critical TFs, such as PIF4, APRR2, bHLH128, and ERF4, are strongly correlated with the pigment content of the peel[13]. Other studies in Cucurbita crops have indicated that the ratio of the branching enzymes LCYE and LCYB determines the production content of lutein or β-carotene and ultimately affects the fruit color[14,15]. Furthermore, LCYE and CCD4 regulate the color of both the flesh and peel[16]. Most studies on genes related to peel color have focused on C. pepo, while studies on C. maxima are still limited. Additionally, the molecular mechanism of pigment accumulation in pumpkin fruits remains to be explored. In the present study, transcriptome and metabolite analyses of peel color were conducted between red peel color and gray peel color pumpkin inbred lines at three fruit development stages. The pertinent DEGs were subsequently filtered via weighted gene coexpression network analysis (WGCNA). Current studies endeavor to clarify the molecular mechanisms that underlie the coloration patterns observed in the red and gray fruit peels of pumpkins by analyzing the expression of the identified key hub genes.
-
The pumpkin inbred line '2013-12' (C. maxima), which has a red peel, and the pumpkin inbred line '9-6' (C. maxima), which has a gray peel, were used as the plant materials in this study. The pumpkin seeds utilized in this research were supplied by the Pumpkin Molecular Breeding Laboratory, College of Horticulture and Landscape at Northeast Agricultural University. Pumpkin plants were grown from May 2020 to September 2020 on the farm of 'XiangYang' (at approximately 126.9129211° N, 45.75432096° E) in Harbin, Heilongjiang province, China. The peel materials were sampled at 0, 15, and 30 days after pollination (DAP) (Fig. 1a). Fruit peels were collected from three individual plants (with only one fruit per plant being pollinated), and mixed into one sample, and three biological replicates were conducted for each pumpkin peel sample. The peels of each material were promptly frozen in liquid nitrogen, and subsequently stored under at −80 °C.
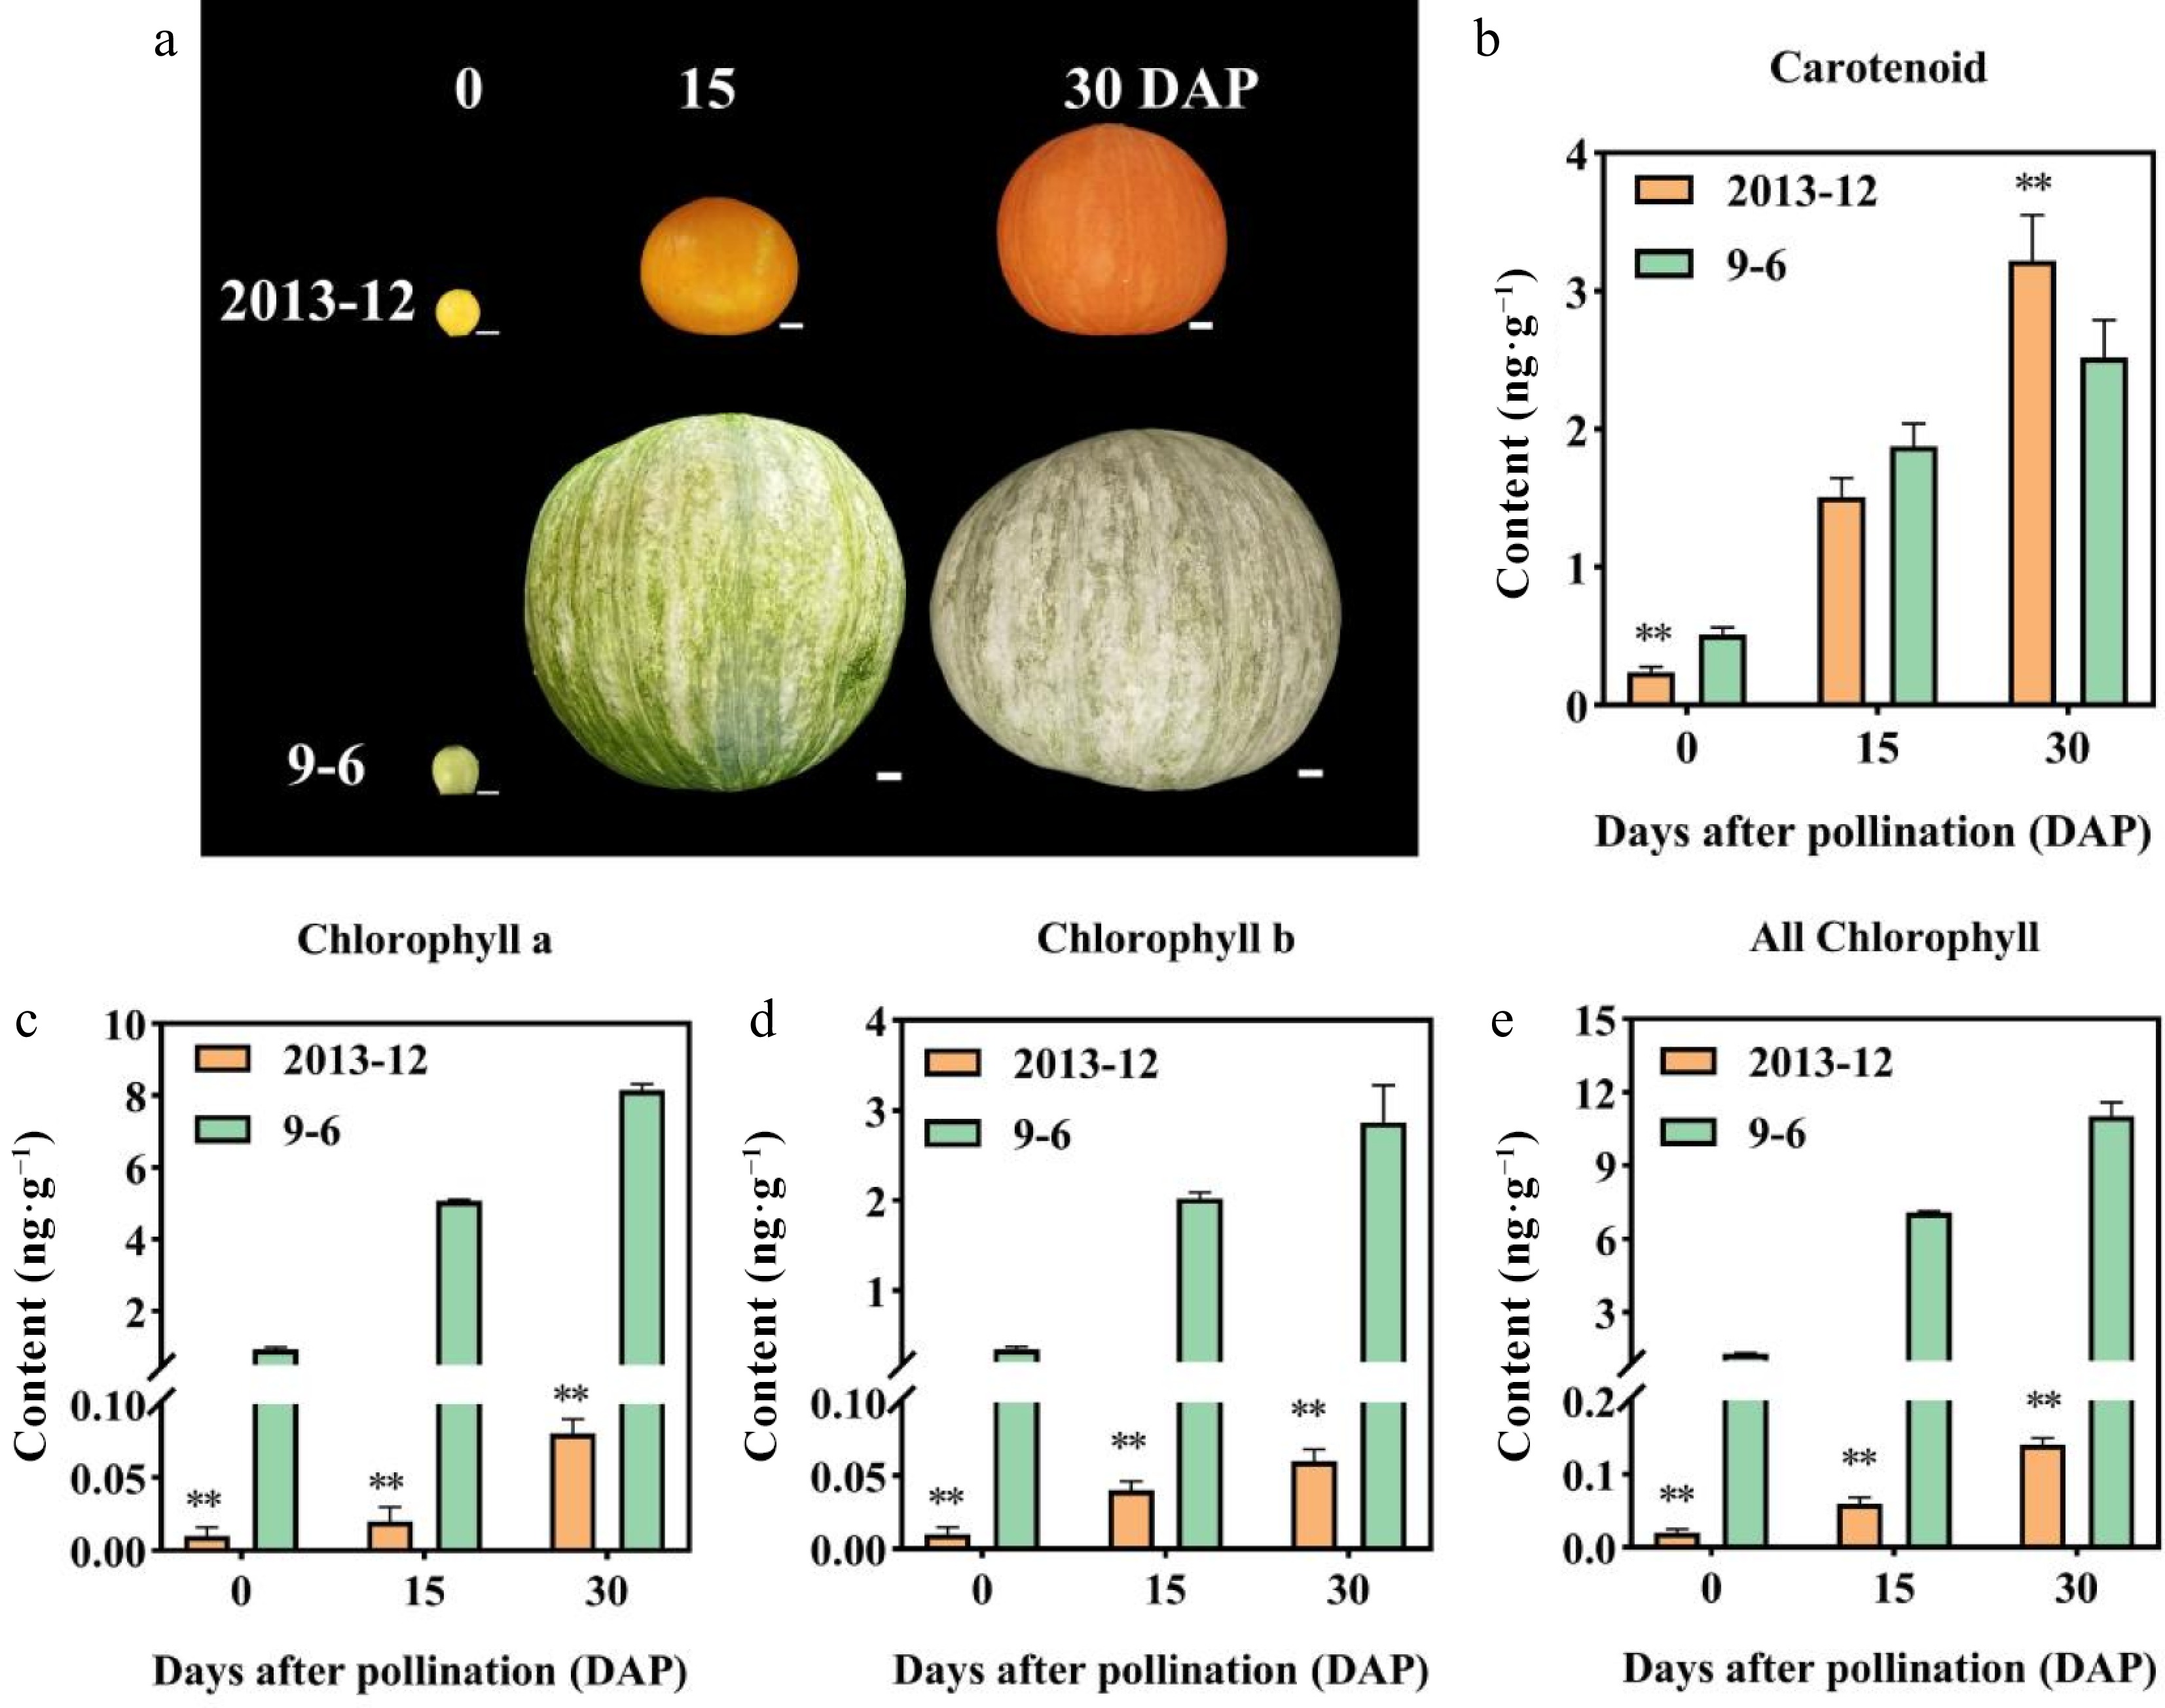
Figure 1.
Peel color, pigment content in fresh fruit peel, and microscopic observation of the mature fruit peel in Cucurbita maxima. (a) Peel color of the two inbred lines at 0, 15, and 30 DAP. '2013-12': Red peel. '9-6': Gray peel. (b)–(e): Pigment contents of fruit peel with fresh weight in the two materials at 0, 15, and 30 DAP. Values are the average ± SD of three replicates. Significant differences are indicated by asterisks, * indicates a significant difference (0.05 > p ≥ 0.01), and ** represents an extremely significant difference (0.01 > p ≥ 0.001). DAP: Days after pollination.
Determination of the pigment content and precursors of chlorophyll synthesis in the fruit peel
-
The 0, 15, and 30 DAP peel flesh samples of '2013-12' and '9-6' were used as materials for the detection described below. The Chl a, Chl b, chlorophyll, and carotenoid content were detected using the 'acetone extraction method'[13]. The absorption values were measured with a spectrophotometer (Epoch, Bio Tek Instruments Inc., USA) at 665, 649, and 470 nm. Three technical replicates were conducted for each treatment.
5-aminolevulinic acid (ALA) content was determined using methods as described by Zheng et al.[17]. Porphobilinogen (PBG) content was determined as follows: 0.5 g of ground peel was placed into a 10 mL centrifuge tube, and 5 mL of extraction buffer (0.6 M Tris, 0.1 M EDTA, pH = 8.2) was added. After the mixture was fully homogenized, it was centrifuged at 12,000 rpm for 10 min. A total of 1.2 mL of the supernatant was collected, and an equal volume of Ehrlich reagent was added to the solution. The mixture was then allowed to react for 15 min in the dark, and the absorbance was measured at 553 nm (molar extinction coefficient: 7.2 × 10⁴ L·mol−1·cm−1).
Uroporphyrinogen III (Urogen III), and coprophyrin III (Coprogen III) were determined according to the methods of Kang et al.[18]. Proto IX, magnesium protoporphyrin (Mg-Proto), and protodephytyl chlorophyllate (Pchlide) content were determined using the following method: 0.5 g of ground peel was placed in a 50 mL centrifuge tube with 15 mL of 80% alkaline acetone. Fully homogenized solutions were then centrifuged at 12,000 rpm (4 °C) for 10 min. 80% acetone was added to the supernatant until the volume reached 20 mL, and the absorbance of the solution was measured at A575, A590, and A628 nm. The calculation formulas of protoporphyrin IX, magnesium protoporphyrin, and protophytyl chlorophyllate (μg/g) were as follows:
Mg-Proto IX = 0.06077A590 − 0.01937A575 − 0.003423A628
Proto IX = 0.18016A575 − 0.04036A628 − 0.04515A590
Pchlide = 0.03563A628 + 0.007225A590 − 0.02955A575
Content = C × 20 mL/0.5 g
Extraction, identification, and quantification of carotenoids
-
The freeze-dried peel samples were ground into powder with a ball mill (30 Hz, 1 min). Fifty mg of samples with an appropriate amount of internal standard was taken for extraction, with a mixed solution of n-hexane/acetone/ethanol (1:1:2, v/v/v) containing 0.01% BHT (g/mL). The sample was vortexed for 20 min, extracted, and centrifuged to combine with the supernatant. The extract was concentrated, reconstituted with a methanol/methyl tert-butyl ether solution (3:1, v/v), filtered through a 0.22 μm membrane, and stored in a brown injection vial for LC-MS/MS analysis. The carotenoid metabolites were detected via liquid chromatography‒mass spectrometry (LC-MS/MS), and the methods used were consistent with those used by Zhao et al.[19]. The carotenoid categories detected are shown in Supplementary Table S1.
The data acquisition instrument system mainly includes ultra-performance liquid chromatography (UPLC) (ExionLC™ AD,
https://sciex.com.cn/ ) and tandem MS/MS (QTRAP® 6500+,https://sciex.com.cn/ ). The conditions of the liquid phase and mass spectrometry were as follows: the MetWare database (MWDB) in Wuhan, China, which relies on standard substances and mass spectrometry data, was utilized for metabolite identification and quantification. Quantitation was conducted using triple-quadrupole mass spectrometry in multiple reaction monitoring (MRM) mode. In MRM, the quadrupole filters out precursor ions of the target substance and eliminates ions from other molecular weights to reduce interference. These precursor ions are then fragmented and filtered by the triple quadrupole to select specific fragment ions, improving quantification accuracy and repeatability. After mass spectrometry data were collected from various samples, chromatographic peaks of the target compounds were integrated for quantitative analysis. Data T-tests were performed using MetaboAnalyst (www.metaboanalyst.ca/ ).RNA-seq analysis
-
The 0, 15, and 30 DAP peel samples of '2013-12' and '9-6' stored at −80 °C were used as plant materials. T2 represents the red peel line '2013-12', and T9 represents the gray peel line '9-6'. Three distinct biological replicates were carried out for each treatment. Total RNA from pumpkin fruit peel samples was extracted with an RNA prep Pure polysaccharide polyphenol plant total RNA extraction kit (TIANGEN DP441, China). After the synthesis of the first and second strand cDNA, and purification of double-stranded cDNA by AMPure XP beads, the cDNA library was constructed with Mateware according to the methods of Xu et al.[13]. The clean reads were preliminary quantified with a Qubit 2 instrument. Fluorometer and accurate quantification via qRT-PCR were mapped to the reference genome of pumpkin v 1.1 (
http://cucurbitgenomics.org/v2/organism/11 ) via HISAT2. Co-expression network analysis was performed using the R-based weighted gene correlation network analysis (WGCNA) package with default parameters[20]. The varFilter function of the R language genefilter package was used to remove genes with low expression levels in all samples. Modules based on the correlation between gene expression levels were identified, and a correlation matrix between each module and the sample was calculated using the R-based WGCNA software package. The module network was visualized using Cytoscape software (v.3.7.2). Differential expression analysis was performed via DESeq2 (|log2-fold change| ≥1, and FDR < 0.05), to obtain a set of genes that were differentially expressed between two biological samples. Heatmaps and Venn diagrams were generated via TBtools software. Identified gene sequences were analyzed via Gene Ontology annotation to detect significant GO terms in the DEGs, and the KEGG database was employed to identify enriched pathways.Quantitative real-time PCR analysis
-
The 0, 15, and 30 DAP peel samples of '2013-12' and '9-6' stored at −80 °C were used as materials. The experimental methods used for first-strand cDNA synthesis and qRT-PCR were the same as those described by Luo et al.[14]. The primer sequences used in this study are listed in Supplementary Table S2. Each detection was conducted in triplicate.
Statistical analyses
-
Each experiment was conducted in triplicate, and the values are shown as mean ± standard deviation (SD). SPSS Statistics 26.0 software was applied to assess the significant differences (p < 0.05), using one-way analysis of variance (ANOVA), followed by Duncan's multiple range test. The correlation analysis between the metabolite content of carotenoids and the expression levels of genes related to metabolic pathways was conducted by the tool of multi-omics correlation clustering in the Maiwei Cloud platform (
https://cloud.metware.cn/#/tools/detail?id=44 ). -
The fruit peel colors of '2013-12' and '9-6' at 0, 15, and 30 DAP are illustrated in Fig. 1a. The peel color of the ovaries and mature fruits clearly differed between the two materials. The fruit peel of '2013-12' was yellow at 0 DAP, and gradually turned from orange to red from 15 to 30 DAP. The fruit peel of '9-6' was green at 0 DAP with no stripe, and gradually turned into gray with green stripes from 15 to 30 DAP.
Furthermore, the pigment content, including total chlorophyll and carotenoids in pumpkin peel, were measured at 0, 15, and 30 DAP (Fig. 1b–e). The chlorophyll and carotenoid content in '9-6' and '2013-12' fruit peel increased continuously with the development of pumpkin fruit. The chlorophyll content in the fruit peel of '2013-12' was significantly lower than that in '9-6' during fruit development. The content of Chl a, Chl b, and total chlorophyll in '2013-12' were 99.02%, 97.91%, and 98.73% lower than those in '9-6' at 30 DAP, respectively. The carotenoid content in the peel of '2013-12' was 30.12% greater than that in '9-6' at 30 DAP and lower than that in '9-6' at 0 and 15 DAP. In addition, the chlorophyll a/b (Chl a/Chl b) ratio of '9-6' was significantly greater than that of '2013-12', whereas the carotenoid/chlorophyll (Caro/Chl) ratio of '2013-12' was significantly greater than that of '9-6'.
In '2013-12', the content of carotenoids increased sharply with the fruit development. The ratio of Caro/Chl increased significantly during fruit development. The ratio of Chl a/Chl b gradually decreased from 0–15 DAP and then increased back to 1.34 at 30 DAP (Table 1). This evidence indicates that the peel color of '2013-12' was mainly determined by the content of carotenoid. In '9-6', the chlorophyll content was significantly greater than the carotenoid content. The content of chlorophyll a was significantly greater than that of chlorophyll b, indicating that the color of '9-6' peels is mainly related to chlorophyll a. The ratios of Caro/Chl and Chl a/Chl b in fruit peels did not significantly differ during fruit development. As a consequence, the observations of peel coloration were largely consistent with the pigment accumulation pattern. The coloration of '9-6' fruit is mainly determined by the increase in pigment content rather than the ratio.
Table 1. Chlorophyll and carotenoid content of fruit peel at different development periods of Cucurbita maxima fruit.
DAP Material Chl a (mg/g) Chl b (mg/g) Total chlorophyll
(mg/g)Carotenoid
(mg/g)Chl a/Chl b Caro/Chl 0 2013-12 0.01 ± 0.006 dD 0.01 ± 0.005 dC 0.02 ± 0.005 dD 0.24 ± 0.04 eD 1 ± 0.001 bAB 10.78 ± 2.91 bB 0 9-6 0.94 ± 0.05 cC 0.35 ± 0.03 cC 1.29 ± 0.04 cC 0.51 ± 0.05 eD 2.71 ± 0.08 aA 0.40 ± 0.05 cC 15 2013-12 0.02 ± 0.01 dD 0.04 ± 0.006 cdC 0.06 ± 0.008 dD 1.51 ± 0.14 dC 0.5 ± 0.08 cB 22.75 ± 3.81 aA 15 9-6 5.07 ± 0.03 bB 2.02 ± 0.07 bB 7.09 ± 0.05 bB 1.88 ± 0.16 cBC 2.51 ± 0.1 aA 0.27 ± 0.02 cC 30 2013-12 0.08 ± 0.01 dD 0.06 ± 0.008 cdC 0.14 ± 0.009 dD 3.22 ± 0.33 aA 1.34 ± 0.31bcB 23.19 ± 3.98 aA 30 9-6 8.15 ± 0.71 aA 2.87 ± 0.41 aA 11.02 ± 0.56 aA 2.25 ± 0.27 bB 2.84 ± 0.39 aA 0.20 ± 0.01 cC Note: The chlorophyll and carotenoid content of fruit peel with fresh weight. Lowercase letters indicates significant difference (0.05 > p ≥ 0.01), and uppercase letters represent extremely significant difference (p < 0.01). Determination of precursors in the chlorophyll synthesis of pumpkin peel
-
Hindering certain steps of the chlorophyll biosynthesis and metabolism pathway would lead to an accumulation of precursor substances and molecules. Therefore, through determining some chlorophyll pathway precursor molecule content in pumpkin peels, we can preliminarily speculate the reasons for the difference in chlorophyll content between '2013-12' and '9-6' pumpkin peel. In this study, the content of the biosynthetic precursors ALA, PBG, Urogen III, Coprogen III, Proto IX, Mg-Proto, and Pchlide were measured. The results are shown in Fig. 2. As the fruit ripened, the accumulation of Urogen III, Proto IX, Mg-Proto, and Pchlide in '2013-12' and '9-6' gradually increased; addiitionally ALA and Coprogen III gradually increased in '9-6' peel. The ALA content in '9-6' was significantly greater than that in '2013-12' across the three developmental stages. During the fruit development, the precursor content, including PBG, Urogen III, and Coprogen III in '2013-12' were not significantly different than those in the '9-6' pumpkins. During the whole fruit development period, the Proto IX, Mg-Proto, and Pchlide contents of '2013-12' fruits were significantly lower than those of '9-6' fruits (3-35, 8-46, and 5-29 times, respectively). These three intermediates of chlorophyll synthesis in '9-6' gradually increased with fruit development, and were significantly greater than those in '2013-12'. The accumulation pattern was similar to that of the chlorophyll content. Therefore, chlorophyll synthesis in '2013-12' peels is blocked between Coprogen III and Proto IX, resulting in a low chlorophyll content.
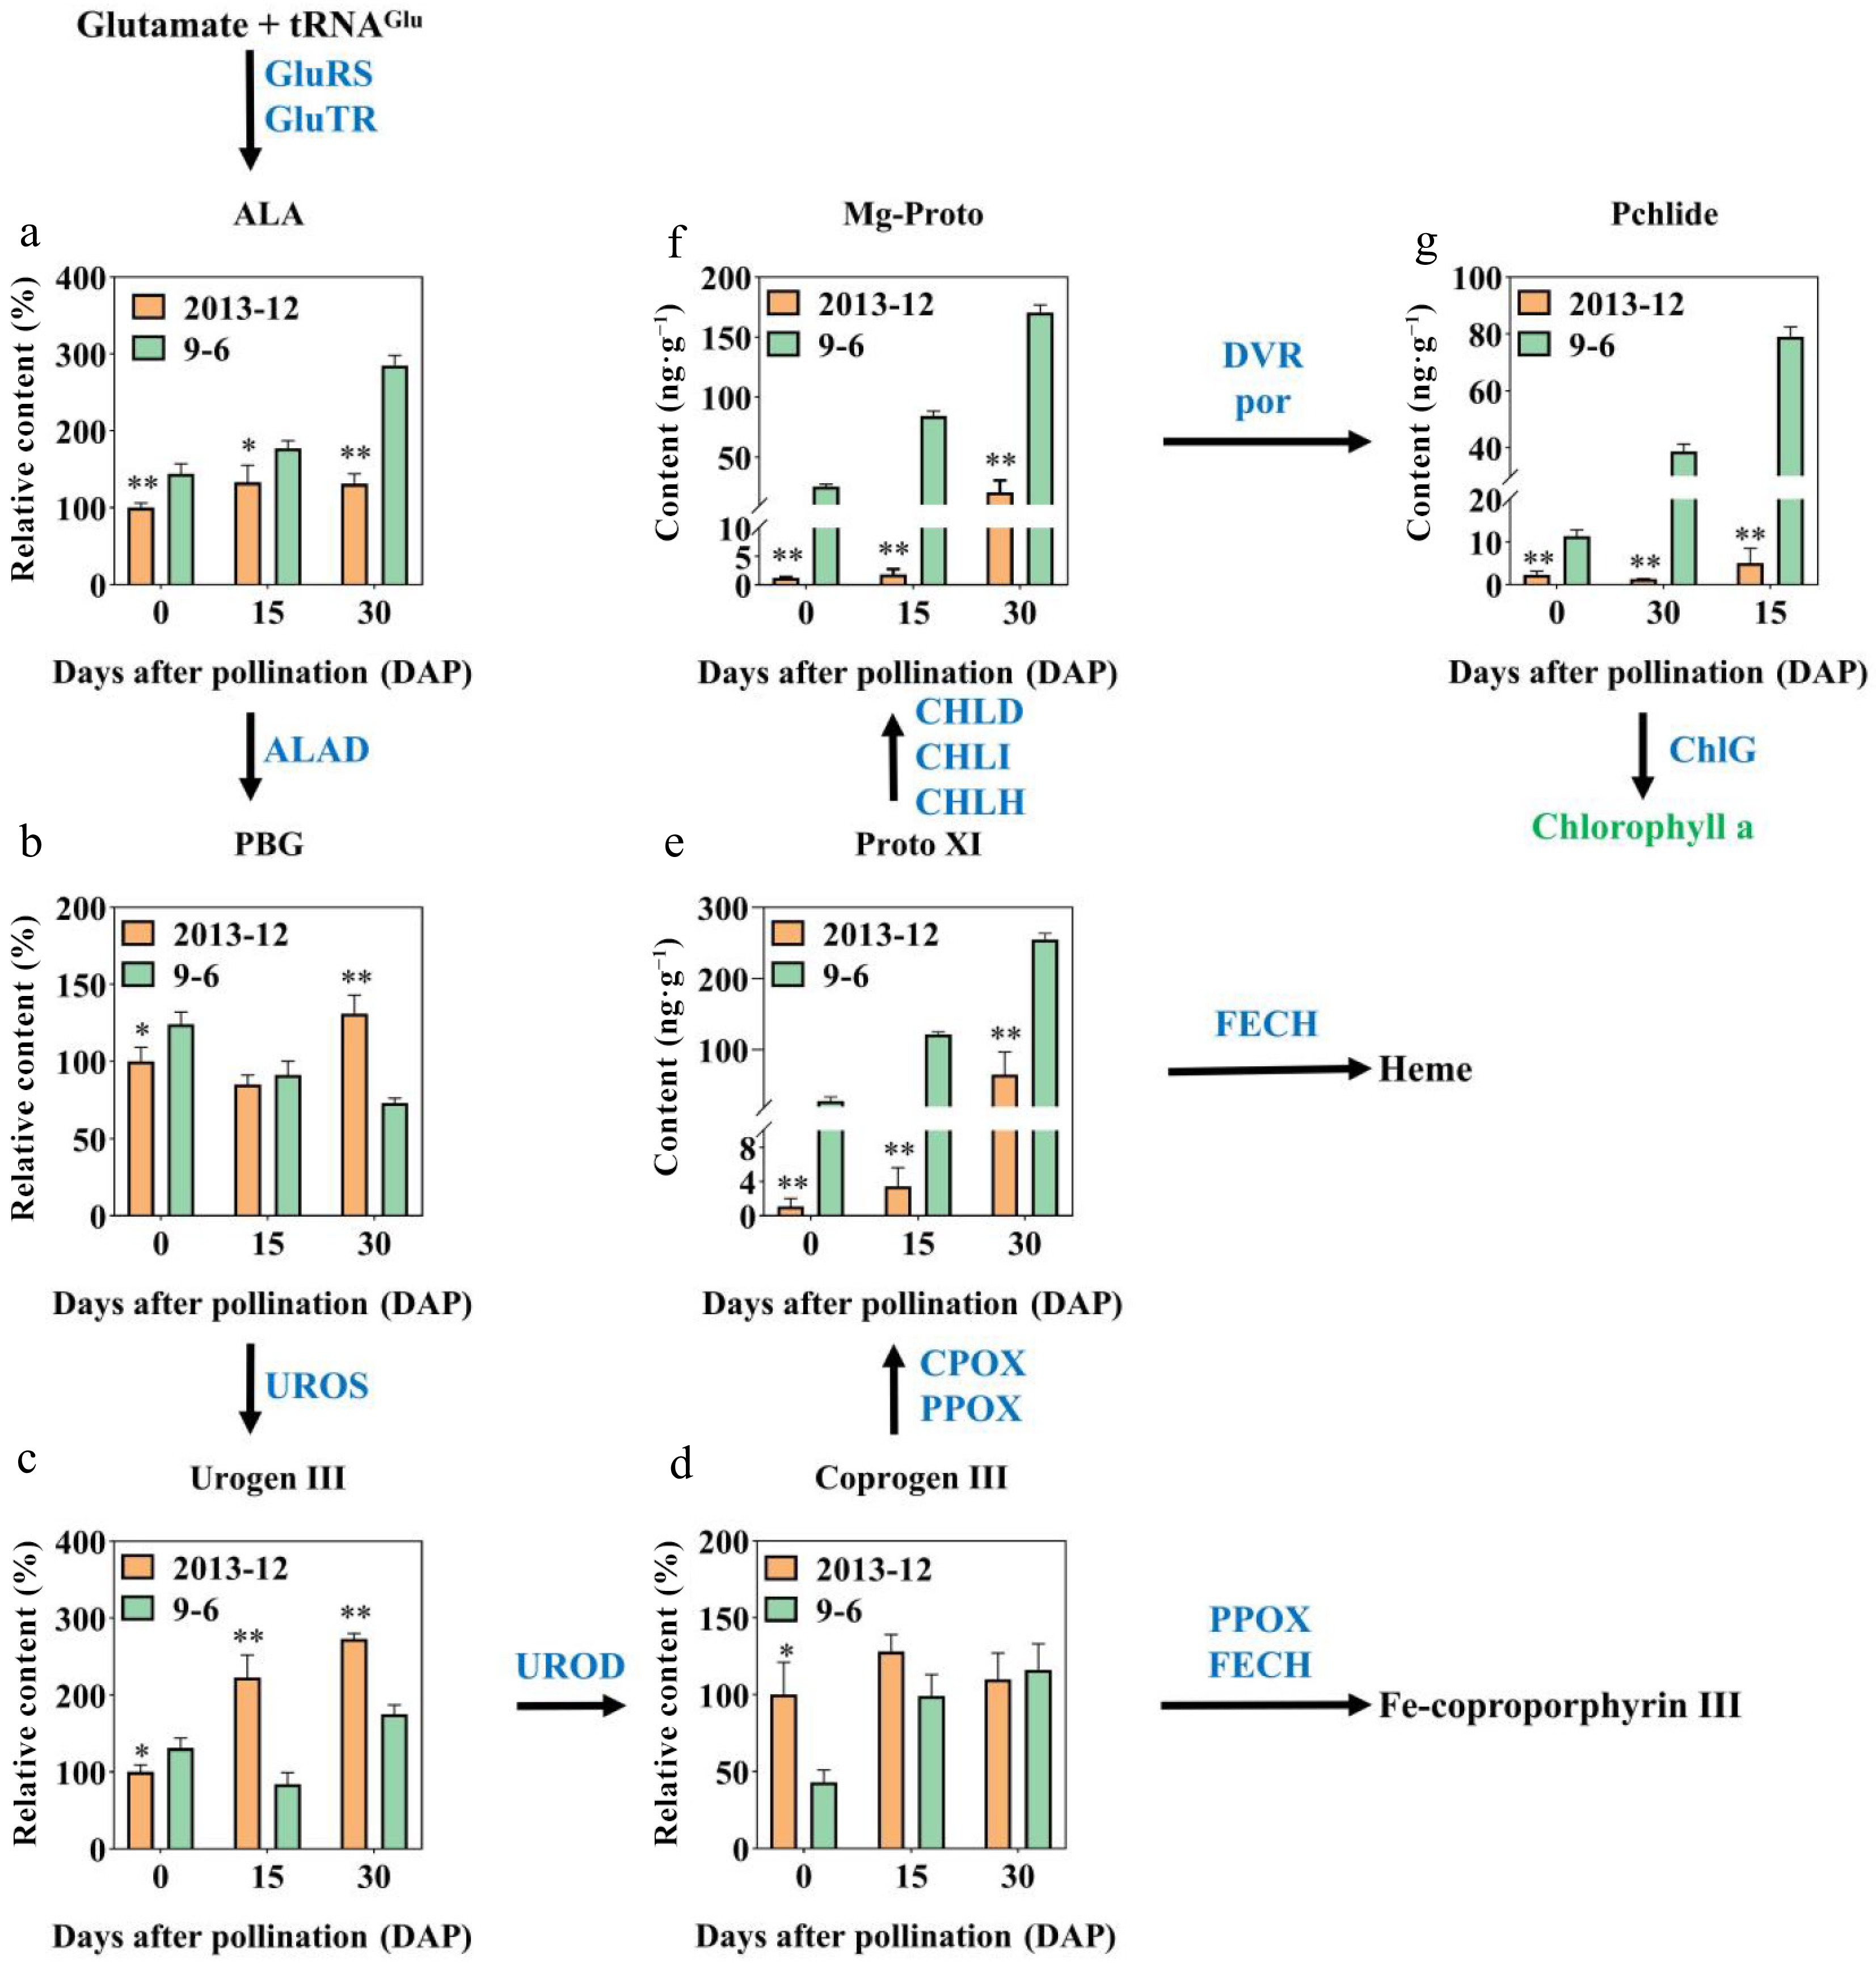
Figure 2.
Relative contents of precursors involved in chlorophyll synthesis of '2013-12' and '9-6' at 0, 15, and 30 DAP. (a) ALA; (b) PBG; (c) UrogenI II; (d) Coprogen III; (e) Proto XI; (f) Mg-Proto; (g) Pchlide. This pathway was constructed on the basis of the KEGG pathway. Enzymes involved in chlorophyll biosynthesis and metabolic pathways are shown in blue. The contents of fruit peel with fresh weight were calculated. The content of '2013-12' 0 DAP was set as 100% to calculate the relative content at 15 DAP and 30 DAP of '2013-12', and the three periods of '9-6'. The values are the average ± SD of three replicates. Significant differences are indicated by asterisks; * indicates a significant difference (0.05 > p ≥ 0.01), and ** represents an extremely significant difference (0.01 > p ≥ 0.001).
Carotenoid identification in pumpkin peel
-
Sixty eight carotenoids, including six carotenoids, 47 carotenoid esters, and 15 luteins, were detected in the peel of '2013-12' and '9-6' pumpkins at three developmental stages (Supplemental Table S3). These carotenoids were grouped into nine categories for further analysis (Fig. 3a–g). The pie chart of the pigment ratio in Fig. 3h was drawn in combination with the pigment content measured in Fig. 1.
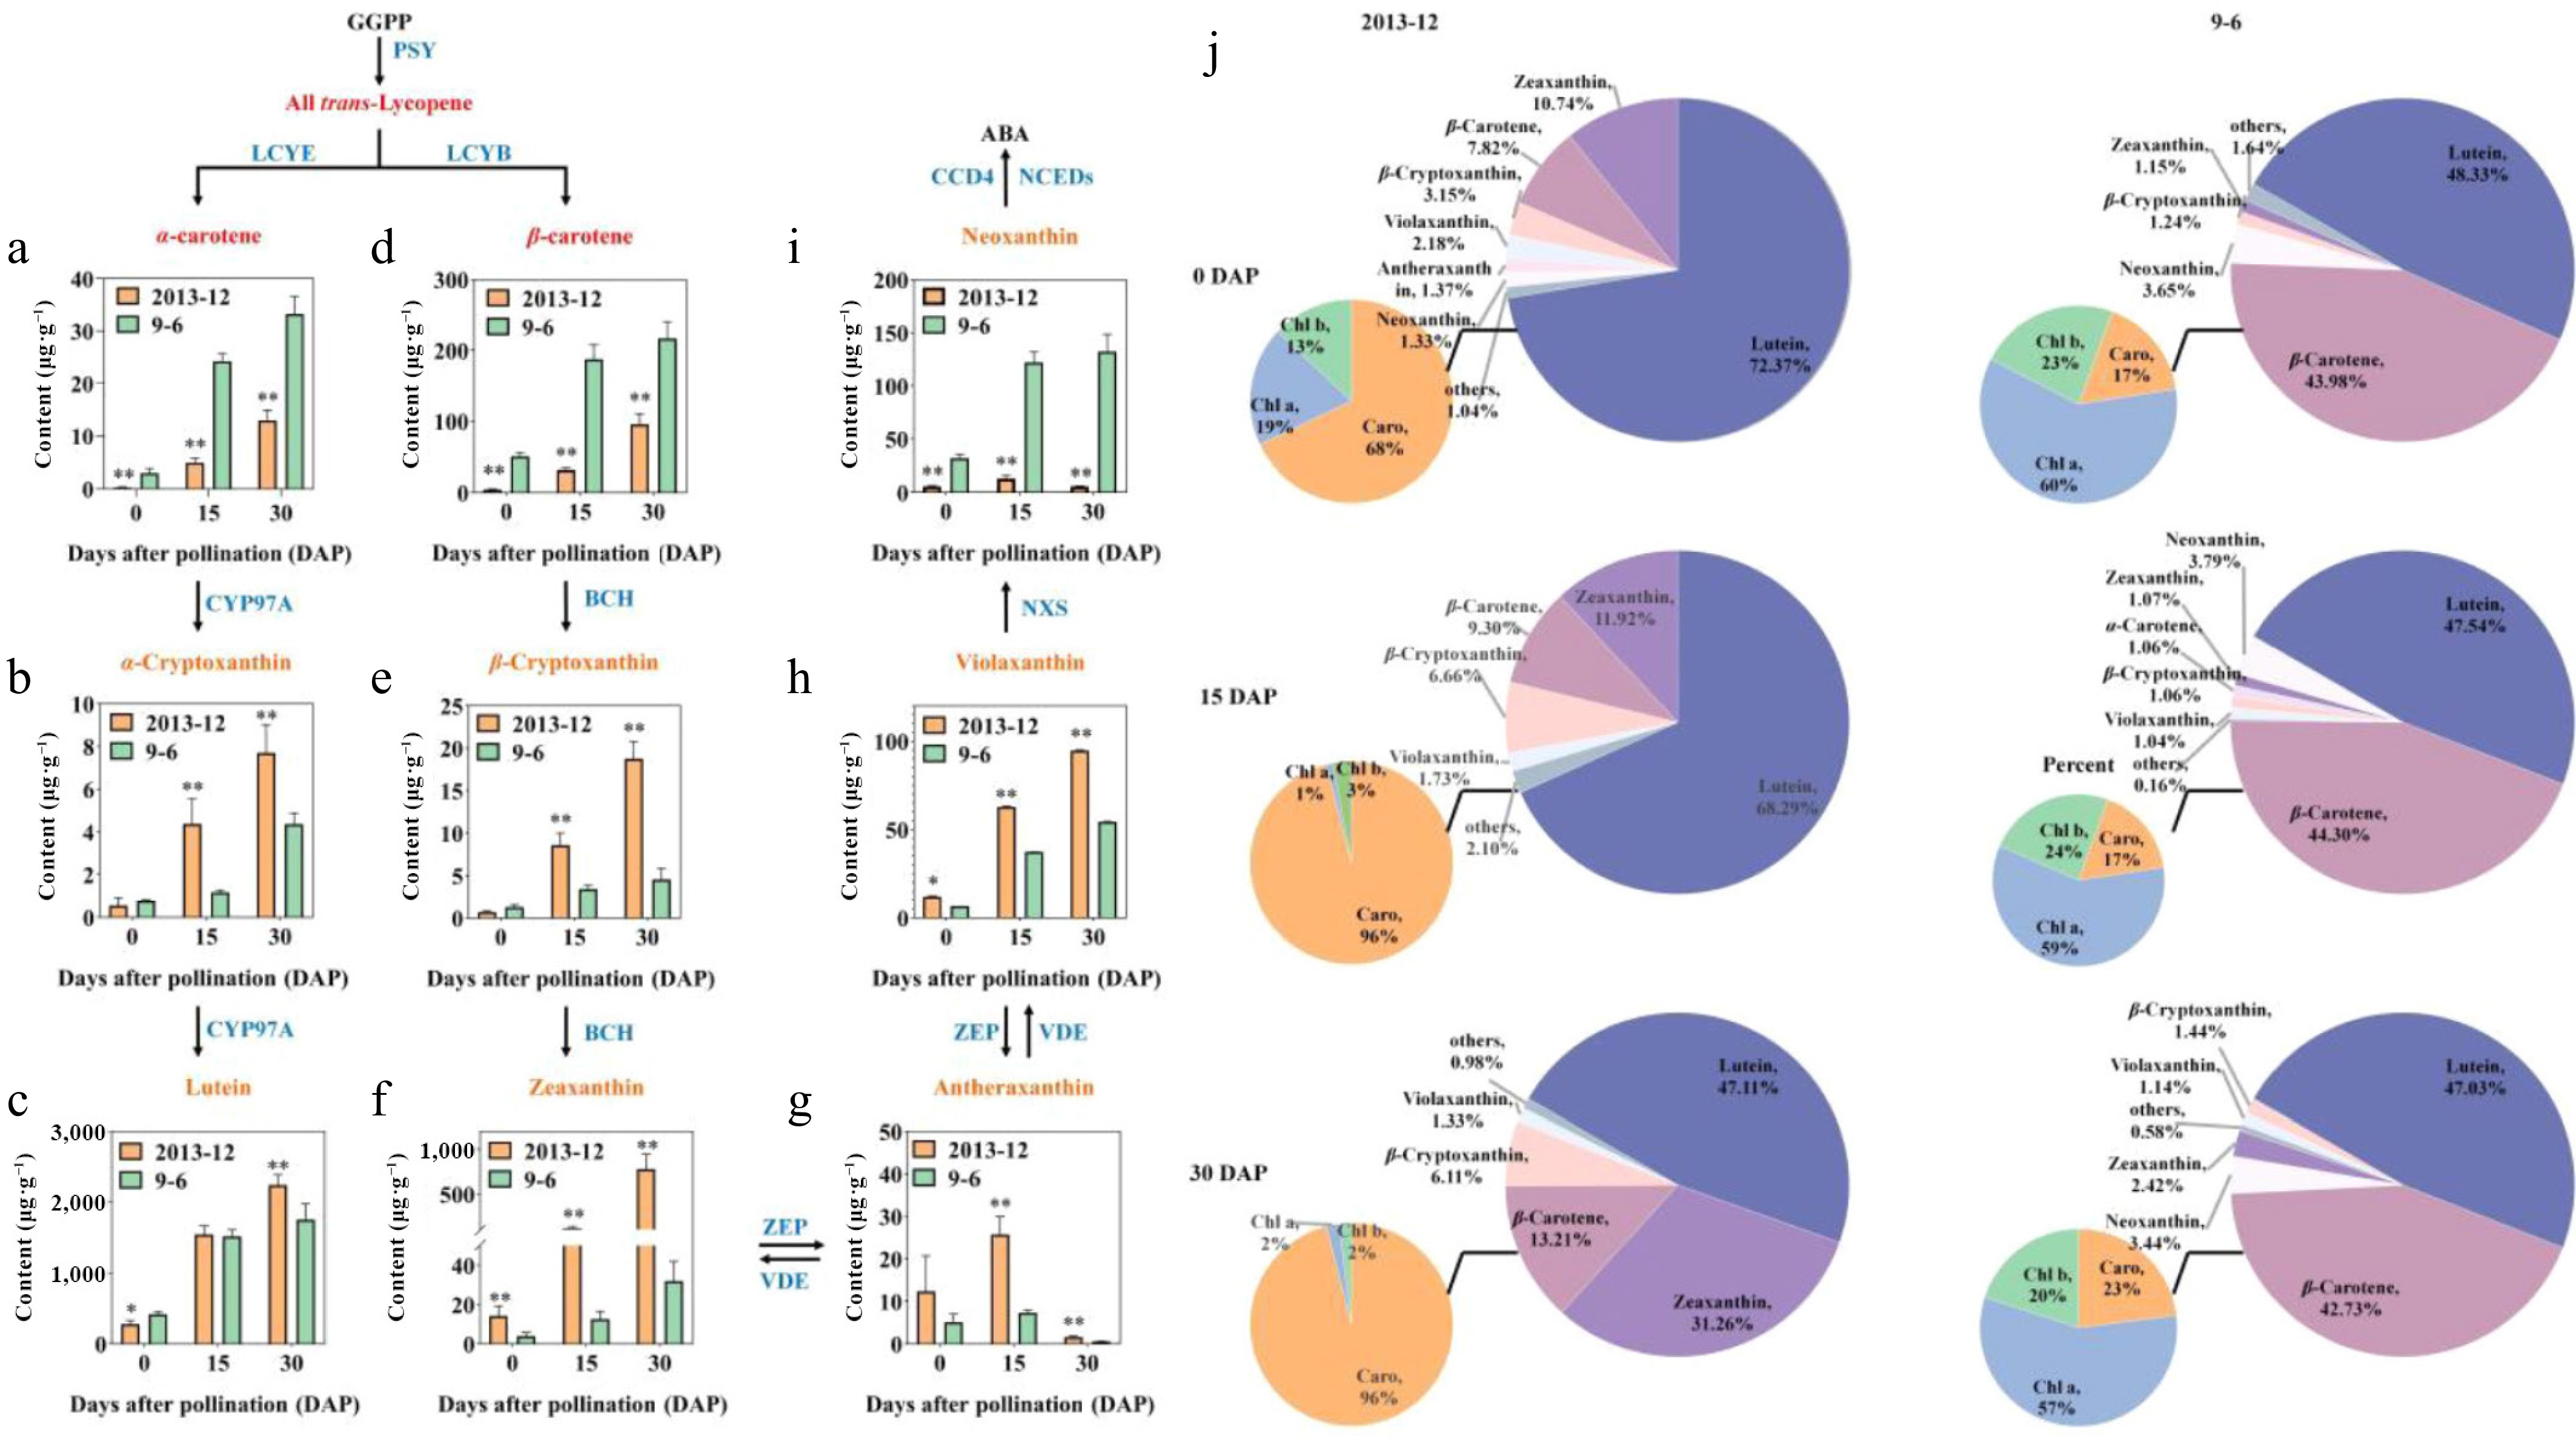
Figure 3.
The major carotenoid contents of Cucurbita maxima fresh peels. (a) α-carotene; (b) α-cryptoxanthin; (c) lutein; (d) β-carotene; (e) β-cryptoxanthin; (f) Zeaxanthin; (g) antheraxanthin; (h) violaxanthin; (i) neoxanthin. The pathway was constructed on the basis of the KEGG pathway. Enzymes involved in the carotenoid biosynthesis and metabolic pathways are shown in blue. The contents of fruit peel with fresh weight were calculated. The values are the average ± SD of three replicates. Significant differences are indicated by asterisks; * indicates a significant difference (0.05 > p ≥ 0.01), and ** represents an extremely significant difference (0.01 > p ≥ 0.001). j Pie chart of the major carotenoid contents in peel.
With the development of fruit, the content of carotenoids in the peel materials of the two inbred lines gradually increased, except for antherxanthin and neoxanthin. The main carotenoids that accumulated in '2013-12' were lutein > zeaxanthin > β-carotene > β-cryptoxanthin. In the 0-30 DAP period, lutein accumulated rapidly, which was significantly greater than that of the other components. The lutein content was always significantly greater than the other carotenoid components during the whole fruit development stages, and the lutein content in the 30-d period was approximately ten times that in the 0-d period. However, the lutein proportion gradually decreased from 72.37% in the 0 DAP period, to 47.11% in the 30 DAP (Fig. 3h). The accumulation of β-carotene, β-cryptoxanthin, and zeaxanthin in '2013-12' at 30 DAP significantly increased, and was 37 times, 21 times, and 24 times greater than that at 0 DAP, respectively. The proportions of zeaxanthin, β-carotene, and β-cryptoxanthin in '2013-12' also increased, and were 11.92%, 9.30%, and 3.1% to 31.26%, 13.21%, and 6.66% greater, respectively, at 30 DAP than at 0 DAP. On the basis of the above results, it is speculated that the substrate mainly flows to the LCYE branch in the early stage, whereas the LCYB branch gradually became active in the later developmental stage of fruit in '2013-12'. The increasing content and proportions of LCYB branches, for example, zeaxanthin, β-carotene, and β-cryptoxanthin, especially zeaxanthin in '2013-12', may have caused the peel color to change from yellow to red during fruit development.
The main pigments that accumulated in '9-6' were lutein > β-carotene. With the development of fruit, the content of carotenoid components gradually increased, and the proportions remained stable. This result indicated that the color formation of the ripe peel of '9-6' was related mainly to the pigment content, and was not strongly related to the proportion.
Furthermore, the carotenoid with the greatest accumulation in the two inbred lines was lutein, whose relative content in '2013-12' was significantly lower than that in '9-6' (138.18 μg·g−1 lower) at 0 DAP, while significantly greater than that in '9-6' (486.52 μg·g−1 higher) at 30 DAP (Fig. 3h). The carotenoid with the greatest difference between the two inbred lines was zeaxanthin. The relative content of zeaxanthin in '2013-12' was significantly greater than that in '9-6' during fruit development, with '2013-12' fruits having 10.16, 103.82, and 746.84 μg·g−1 more zeaxanthin than the '9-6' fruits at 0, 15, and 30 DAP, respectively.
Transcriptomic analysis and functional annotation of pumpkin peels via the GO and KEGG databases
-
A comprehensive set of 18 cDNA libraries sourced from two distinct pumpkin peels at three crucial fruit developmental stages was meticulously constructed for subsequent high-throughput sequencing analysis. After filtering raw data, an average of 45.32, 44.54, and 41.74 million clean reads were identified from T2DPA0, T2DPA15, and T2DPA30, respectively. On average, 49.05, 43.09, and 54.57 million clean reads were identified from each of the T9DPA0, T9DPA15, and T9DPA30 samples, respectively. The average GC content ranged from 41.67% to 45.42%. All of the Q30 values were above 93% (Supplemental Table S4). The alignment efficiency of the clean reads with the Cucurbita maxima reference genome (version 1.1) ranged from 90.6% to 95.79% when HISAT2 was used (Supplemental Table S5). The reproducibility of the biological duplicates and differences were verified by the results of correlation and PCA analysis across the six treatments. (Supplementary Fig. S1a, S1b). These all indicated high data reliability.
On the basis of the results above, a comprehensive analysis yielded a total of 21,395 differentially expressed genes (DEGs) across six comparative components. (Fig. 4a, Supplementary Table S6). In '2013-12', 10,101 DEGs were identified between T2DPA0 and T2DPA15, including 4,538 upregulated, and 5,563 downregulated DEGs; 11,275 DEGs were identified between T2DPA0 and T2DPA30, including 5,069 upregulated, and 6,206 downregulated DEGs; and 5,078 DEGs were acquired between T2DPA15 and T2DPA30, including 2,535 upregulated, and 2,543 downregulated DEGs. In '9-6', 9,244 DEGs were identified between T9DPA0 and T9DPA15, including 3,925 upregulated, and 5,319 downregulated DEGs; 11,020 DEGs were gained between T9DPA0 and T9DPA30, including 4,878 upregulated, and 6,124 downregulated DEGs; and 4,335 DEGs were identified between T9DPA15 and T9DPA30, including 2,097 upregulated, and 2,338 downregulated DEGs. There were more downregulated genes than upregulated genes in both '2013-12' and '9-6'. The results revealed that the gene expression patterns in 0 DAP fruit peels might be quite different from those in 15 DAP and 30 DAP fruit peels. The regulatory mechanism of peel color in young fruits may differ from that in the maturing period.
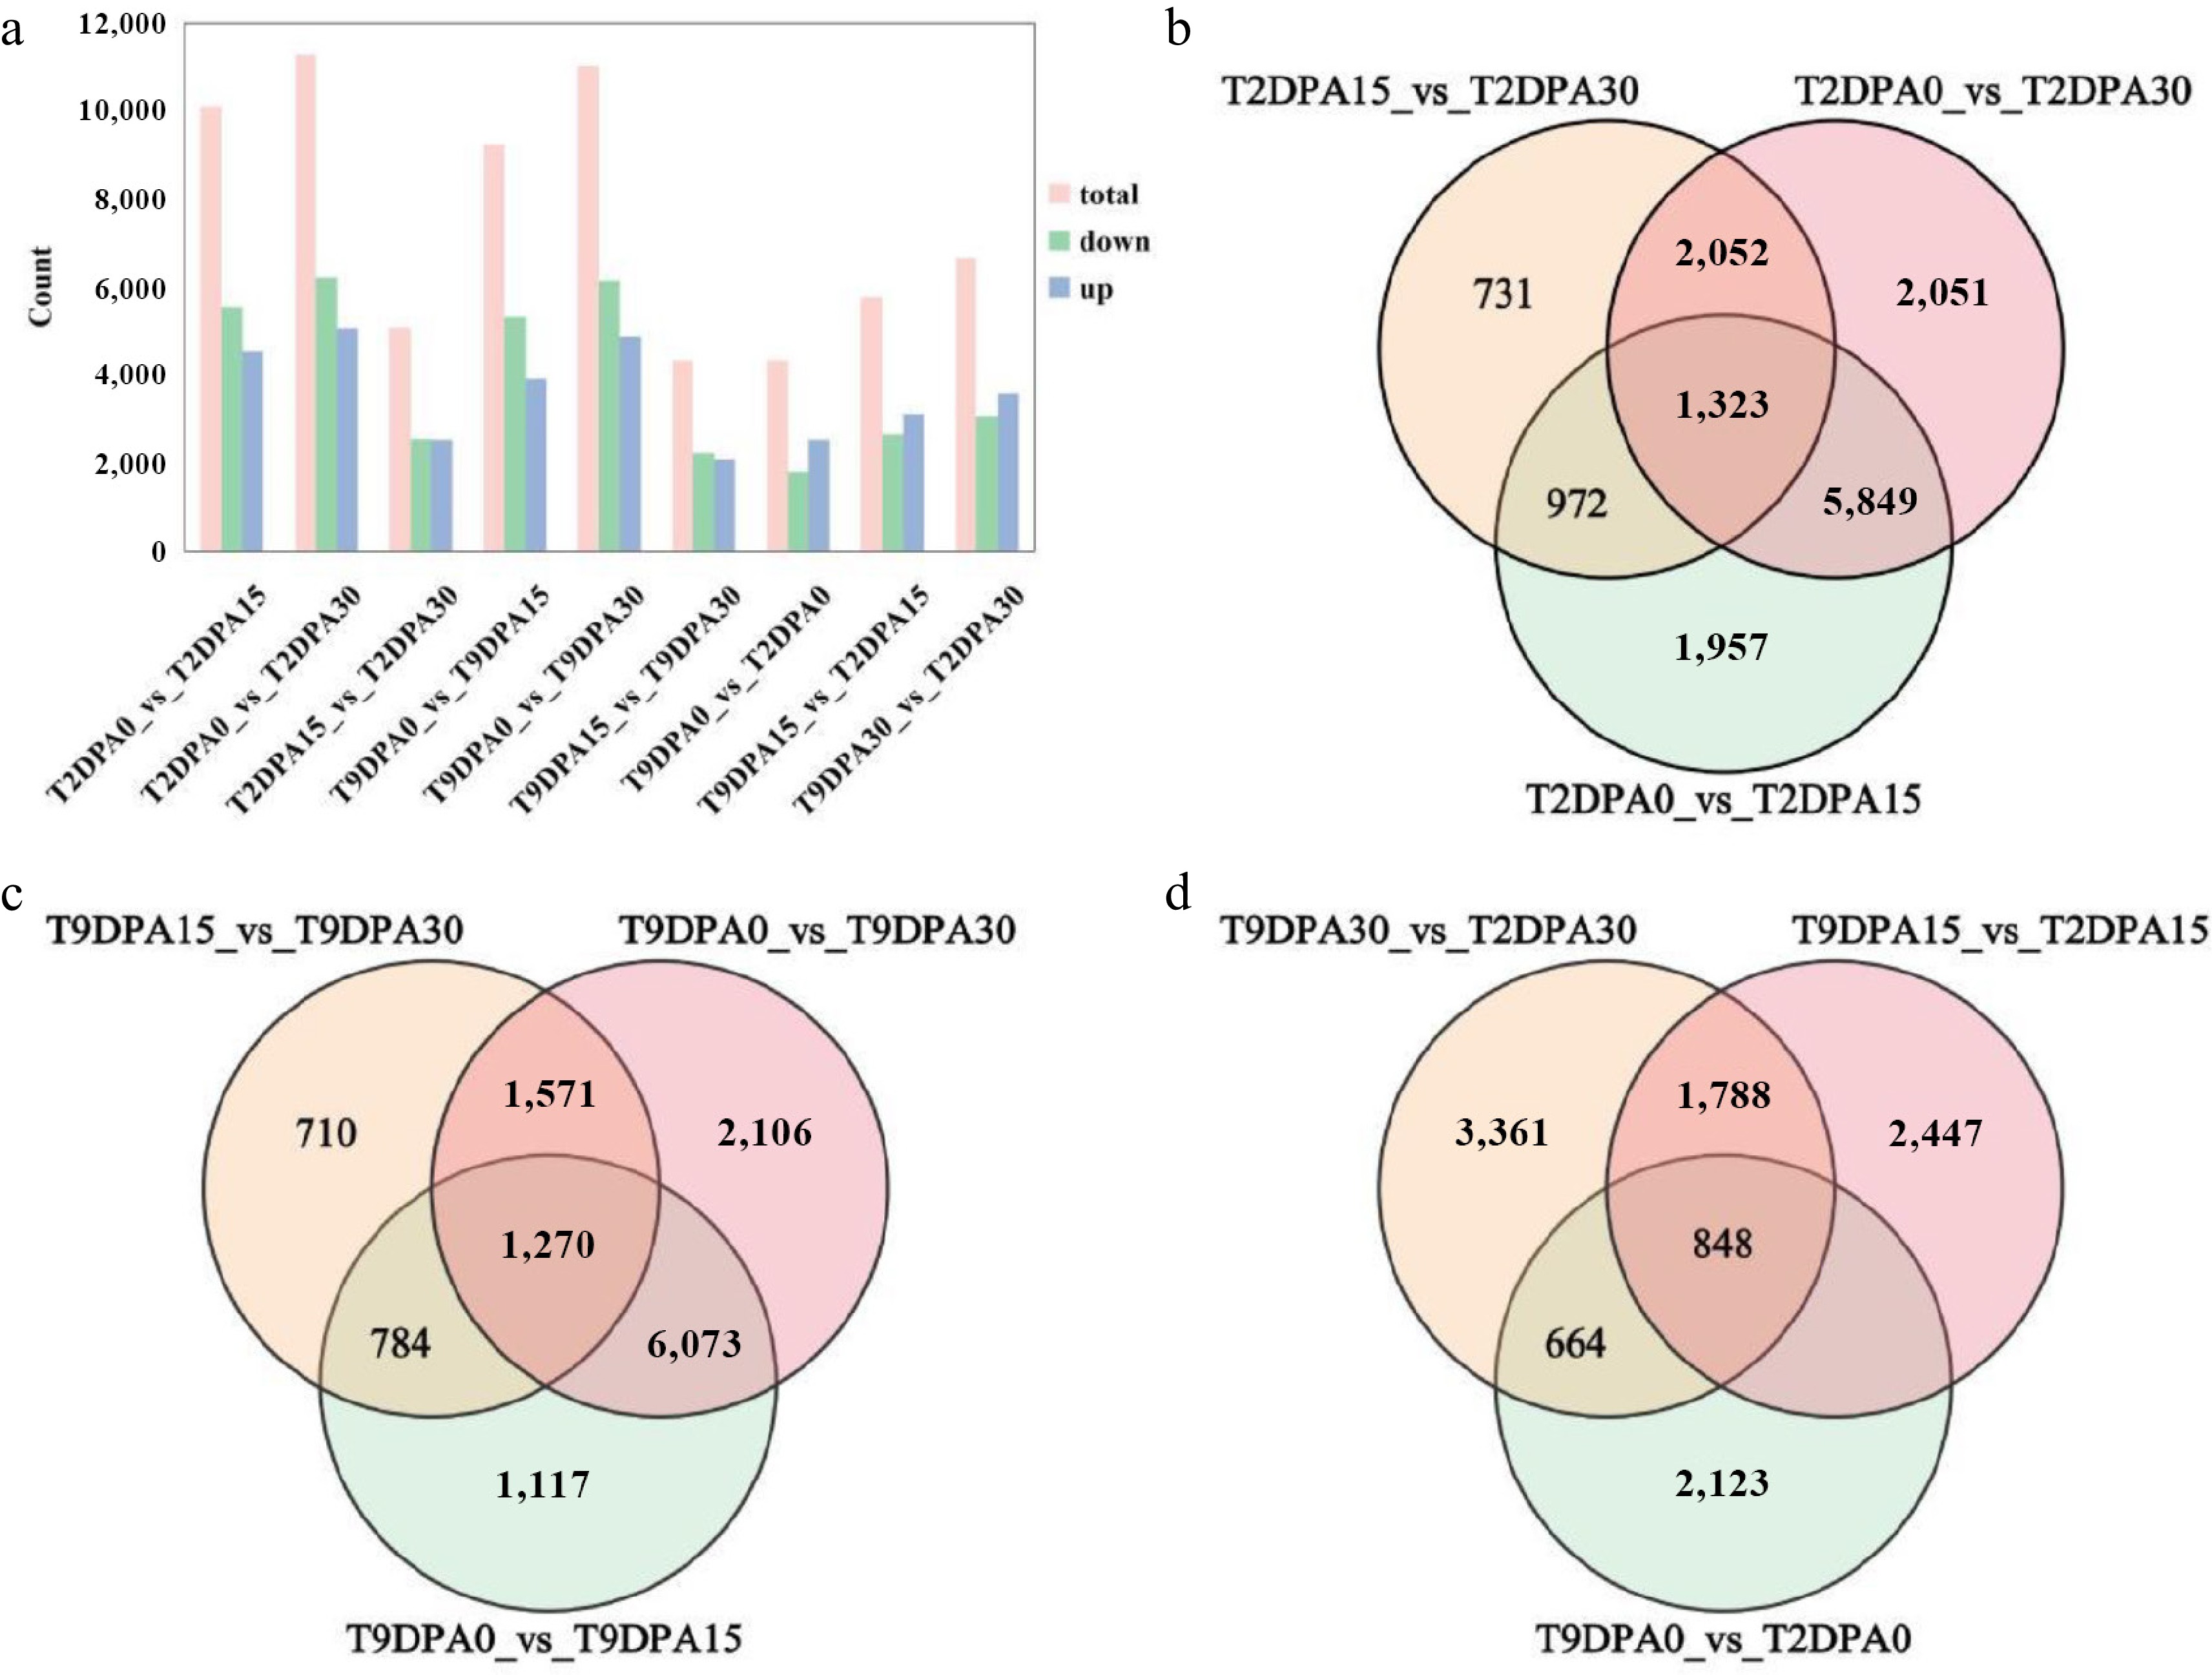
Figure 4.
Statistics of differentially expressed genes in the peel of Cucurbita maxima. (a) Statistics of differentially expressed genes in peel; the vertical axis represents the number of differentially expressed genes. The bar values are averages of three replicates. Venn diagram depicting the shared and specific genes in the peels of the (b) '2013-12', and (c) '9-6 inbred lines during different fruit development periods. (d) Venn diagram depicting the shared and specific genes in the peels of the two inbred lines during the same fruit development periods. 9DPA0: fruit of '9-6' at 0 DAP; 9DPA15: fruit of '9-6' at 15 DAP; 9DPA30: fruit of '9-6' at 30 DAP; 2DPA0: fruit of '2013-12' at 0 DPA; 2DAP15: fruit of '2013-12' at 15 DAP; 2DPA30: fruit of '2013-12' at 30 DAP.
Two inbred lines compared during the same fruit development period (Fig. 4a, Supplementary Table S6) revealed 4,337 DEGs at T2DPA0 and T9DPA0, including 2,535 upregulated, and 1,802 downregulated DEGs; 5,785 DEGs were obtained at T2DPA15 and T9DPA15, including 3,123 up regulated, and 2,653 downregulated DEGs; and 6,661 DEGs were identified at T2DPA30 and T9DPA30, including 3,080 upregulated, and 3,581 downregulated DEGs. The two inbred lines presented the greatest number of DEGs between 0 DAP and 30 DAP, and the lowest number of DEGs between 15 and 30 DAP. There were more upregulated genes than downregulated genes. There were large differences in the peel color between '2013-12' and '9-6' throughout the whole fruit development stage. The genes involved in regulating peel color in the mature stage of the two inbred lines may be more complex than those in the early stage.
A Venn diagram was constructed to analyze the genes related to peel color changes during fruit development, which were divided into three comparison groups (Fig. 4b–d). A total of 5,849, 2,052, and 972 distinct DEGs were acquired from T2DPA0 vs T2DPA15, T2DPA15 vs T2DPA30, and T2DPA0 vs T2DPA30, respectively. There were 1,323 common DEGs in the three comparison groups above (Fig. 4b), which might include key genes associated with the accumulation of carotenoids, especially those in the LCYB branch. Moreover, 6,073, 1,571, and 784 distinct DEGs were identified from T9DPA0 vs T9DPA15, T9DPA15 vs T9DPA30, and T9DPA0 vs T9DPA30, respectively. A total of 1,270 common DEGs were obtained in the three comparison groups above (Fig. 4c), which might be related to the biosynthesis and metabolism of chlorophyll. In general, these DEGs may include key genes related to pigment accumulation and fruit coloration in the peel during whole fruit development. Additionally, 702, 1,788, and 664 distinct DEGs were obtained from the comparison groups of T2DPA0 vs T9DPA0, T2DPA15 vs T9DPA15, and T2DPA30 vs T9DPA30, respectively. A total of 848 DEGs were identified in all three comparison groups above (Fig. 4d). These genes might include the key factors that participate in the accumulation and composition of pigments in the peel during fruit development and are associated with differences in peel coloration between '2013-12' and '9-6'. Among the crucial genes in the chlorophyll synthesis pathway, CmaCHLH was among the 848 DEGs. The following analysis focused on the genes involved in the synthesis and metabolism of carotenoids and chlorophyll.
Furthermore, 6,073, 1,571, and 784 unique differentially expressed genes (DEGs) were identified from the comparisons between T9DPA0 and T9DPA15, T9DPA15 and T9DPA30, and T9DPA0 and T9DPA30, respectively.
The functions of the DEGs were annotated and classified into 58 subcategories using the GO database. Cellular components mainly included cells, cell parts, and organelles. The enriched molecular functions included binding, catalytic activity, and transcription regulator activity. Biological processes consisted of cellular processes, metabolic processes, and responses to stimuli. The number of genes in these subcategories are presented in Supplementary Table S7. GO enrichment analysis demonstrated that photosynthesis, tetrapyrrole binding, and chlorophyll binding were significantly enriched in the fruit development period of '2013-12'. The cell cycle process, auxin-activated signaling pathway, tetrapyrrole binding, and heme binding terms were significantly enriched in the fruit development period of '9-6'. Secondary metabolic processes, photosynthesis, the MCM complex, the Photosystem, Photosystem I, tetrapyrrole binding, heme binding, and chlorophyll binding were significantly enriched during the same fruit development period in '2013-12' vs '9-6' (Supplementary Fig. S2).
Through enrichment analysis of the KEGG pathways, DEGs from the nine comparison groups mentioned above were annotated to 134 pathways. The most significantly enriched pathways included biosynthesis of secondary metabolites, photosynthesis-antenna proteins, plant hormone signal transduction, plant-pathogen interaction, the MAPK signaling pathway, amino acid biosynthesis, and porphyrin and chlorophyll metabolism (Supplemental Fig. S3). These findings implied that the photosynthesis, chloroplast development, and secondary metabolite biosynthesis are potentially pivotal for the coloration of pumpkin peel.
Weighted gene coexpression network analysis of transcriptomic data
-
To identify candidate genes associated with fruit peel color, WGCNA data of pumpkin peel revealed module-specific genes, key genes within modules, intermodule relationships, and correlations with sample traits[21]. A cluster tree based on the correlation between expression levels was constructed. Total DEGs (FPKM value > 1) in 18 samples (fruit peel samples at 0, 15, and 30 DAP from the '2013-12', and '9-6' inbred lines) were divided into 26 coexpression modules (Fig. 5a, Supplementary Table S8). There were 4,810 coexpressed genes in the blue module. The blue module exhibited a notable positive correlation with zeaxanthin (r = 0.92, p = 9e-08). There were 1,502 coexpressed genes in the red module, and 1,033 coexpressed genes in the orange module. The red and orange modules were positively correlated with Chl a (r = 0.88, p = 1e-06 in red; r = 0.84, p = 1e-05 in orange), Chl b (r = 0.85, p = 7e-06 in red; r = 0.86, p = 4e-06 in orange), and total chlorophyll content (r = 0.87, p = 2e-06 in red; r = 0.85, p = 8e-06 in orange) (Fig. 5b). The expression patterns of genes within the blue, red, and orange modules displayed significant correlations with the accumulation of pigments in pumpkin peel.
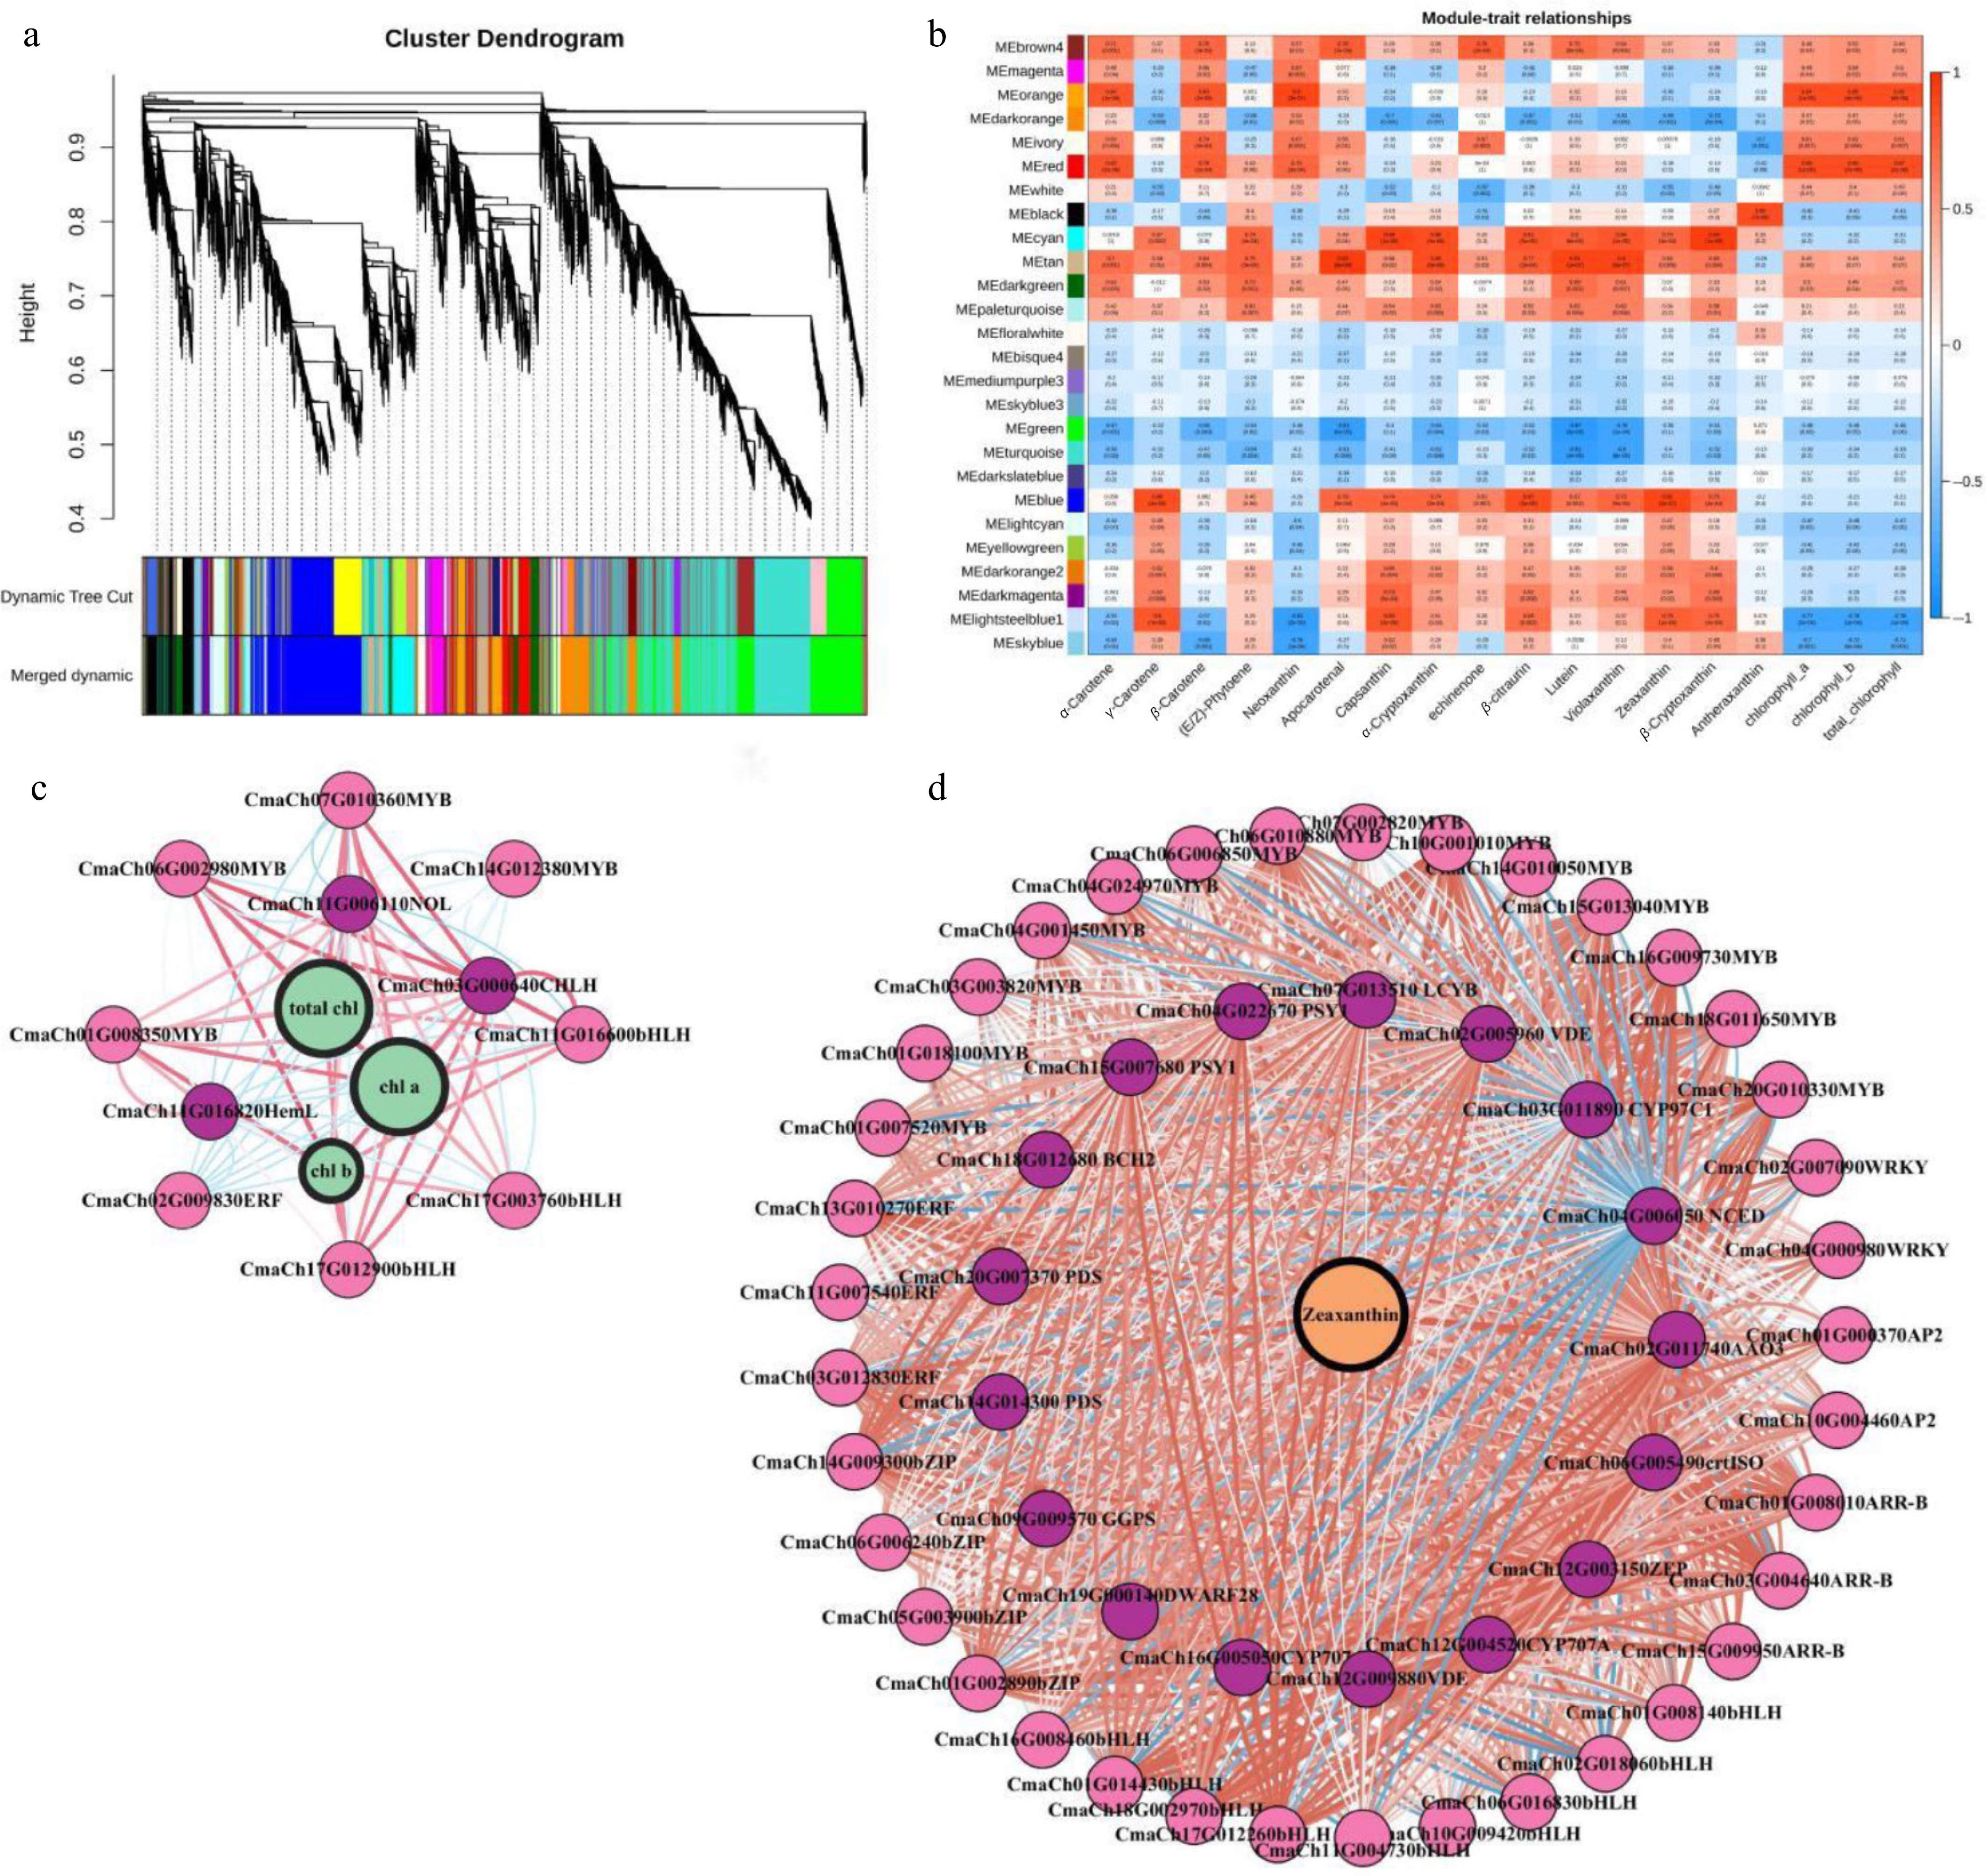
Figure 5.
WGCNA of transcriptomic dates. (a) Tree maps of 21,395 DEGs were constructed via hierarchical clusters with topological overlap dissimilarity. Each gene is depicted by leaves on a branch of the tree map. The height on the y-axis represents the coexpression distance between two DEGs. The dynamic trees were cut and identified by a merge threshold of 0.85 and constructed into main branches with 26 different coexpression modules. (b) The correlation between the module characteristic gene (ME, row), and the content of each pigment category (column) in pumpkin peel. The red and blue colors indicate the pertinent intensity and orientation, respectively. The numbers in the pane represent the partial Pearson correlations, and the corresponding p values are shown in parentheses. (c) Subnetwork of zeaxanthin, structural genes related to the anabolic pathway of carotenoids and putative TFs from the blue module. (d) Subnetwork of genes related to chlorophyll metabolism and catabolism and putative TFs from the orange and red modules. The red circles indicate the metabolites. The green circles represent the pathway genes. The gray circles indicate the TFs. The lines between the two dots represent the relationship of their interactions. The red and blue lines represent positive or negative relationships, respectively, between metabolites and genes or between two genes. The width of the lines represents the strength of the correlation. The width of the label lines denotes the FC between different samples.
The Pearson correlation coefficient (PCC) was set as ≥ 0.85 or ≤ −0.85. Under these conditions, 1,033, 1,502, and 4,810 DEGs were used to construct a coexpression network of the orange, red, and blue modules, respectively (Supplementary Fig. S4). The expression levels of 77 genes from the orange, red, and blue modules, which are highly correlated with peel pigment content, may be considered hub genes involved in three categories: carotenoid (10), and chlorophyll metabolism (3) (involving the CmaCHLH), as well as transcription factors (64) (Fig. 5c, d, Supplementary Table S9).
Certain transcription factors (TFs) may govern these pathways in fruit peel, resulting in various peel colors such as yellow, red, green, and gray. Previous studies have given evidence of ARR-B, AP-2, bHLH, bZIP, ERF, MYB, WRKY, and other genes are crucial for controlling pigment content in plants[22]. Fifty six DETFs were identified as differentially expressed in the gene coexpression network, with a focus on key genes involved in carotenoid and chlorophyll synthesis. Twenty five genes of DETFs in MYB, bHLH, ERF, and NOL family were coexpressed with the content of Chl a, Chl b, and total chlorophyll in peel, and 31 genes of DETFs, in the AP2‐like, APPR2, APRR9, PIF3, IAA, HY5, ERF, MYB, ZIP, bHLH, and WRKY families were coexpressed with the zeaxanthin content in peel (Fig. 5c, d, Supplementary Table S9).
DEGs involved in carotenoid and chlorophyll metabolism
-
Twenty four DEGs were identified according to the carotenoid metabolism pathway during fruit development in the two inbred lines (Fig. 6a, Supplementary Table S10), among which eight key DEGs were inspected by qRT-PCR (Supplementary Fig. S5). Compared with those in the 0 DAP period, the expression levels of most genes in '2013-12' significantly increased at 15 and 30 DAP. The expression of a few genes revealed a decreased trend with the development of fruit. Previous studies have indicated that the PSY gene plays the role as a valve gene in carotenoid metabolism pathways, and determines the final accumulation of carotenoids[22]. Compared with 0 DAP, CmaPSY1 (CmaCh04G022670 and CmaCh15G007680) was significantly upregulated in '2013-12' at 15 and 30 DAP. In the 'LCYB branch', CmaBCH2 gene (CmaCh16G00100) regulates the conversion of β-carotene to β-cryptoxanthin and zeaxanthin, and the expression level of CmaBCH2 in '2013-12' was significantly greater than that in '9-6'. The expression of the CmaNCED gene (CmaCh16G005010), which regulates the ABA production of violaxanthin and neoxanthin, decreased gradually in '2013-12' with the development of fruits. A high expression level at 0 DAP and an expression level that almost approached 0 at 15 and 30 DAP were detected in the fruit peel (FPKM value < 1). Compared with that at 0 DAP, the expression of CmaCh16G005010 was decreased once at 30 DAP. The expression level of another CmaNCED gene (CmaCh04G006430) decreased gradually with the development of fruits in '2013-12'. In the 'LCYE branch', the synthesis of lutein from α-carotene was catalyzed by CmaCYP97A3 (CmaCh16G007340 and CmaCh04G006080). The expression level of CmaCh04G006080 at 15 and 30 DAP was significantly greater than that at 0 DAP (two times greater). There was little difference in the expression level of CmaCh16G007340 during fruit development in '2013-12'.
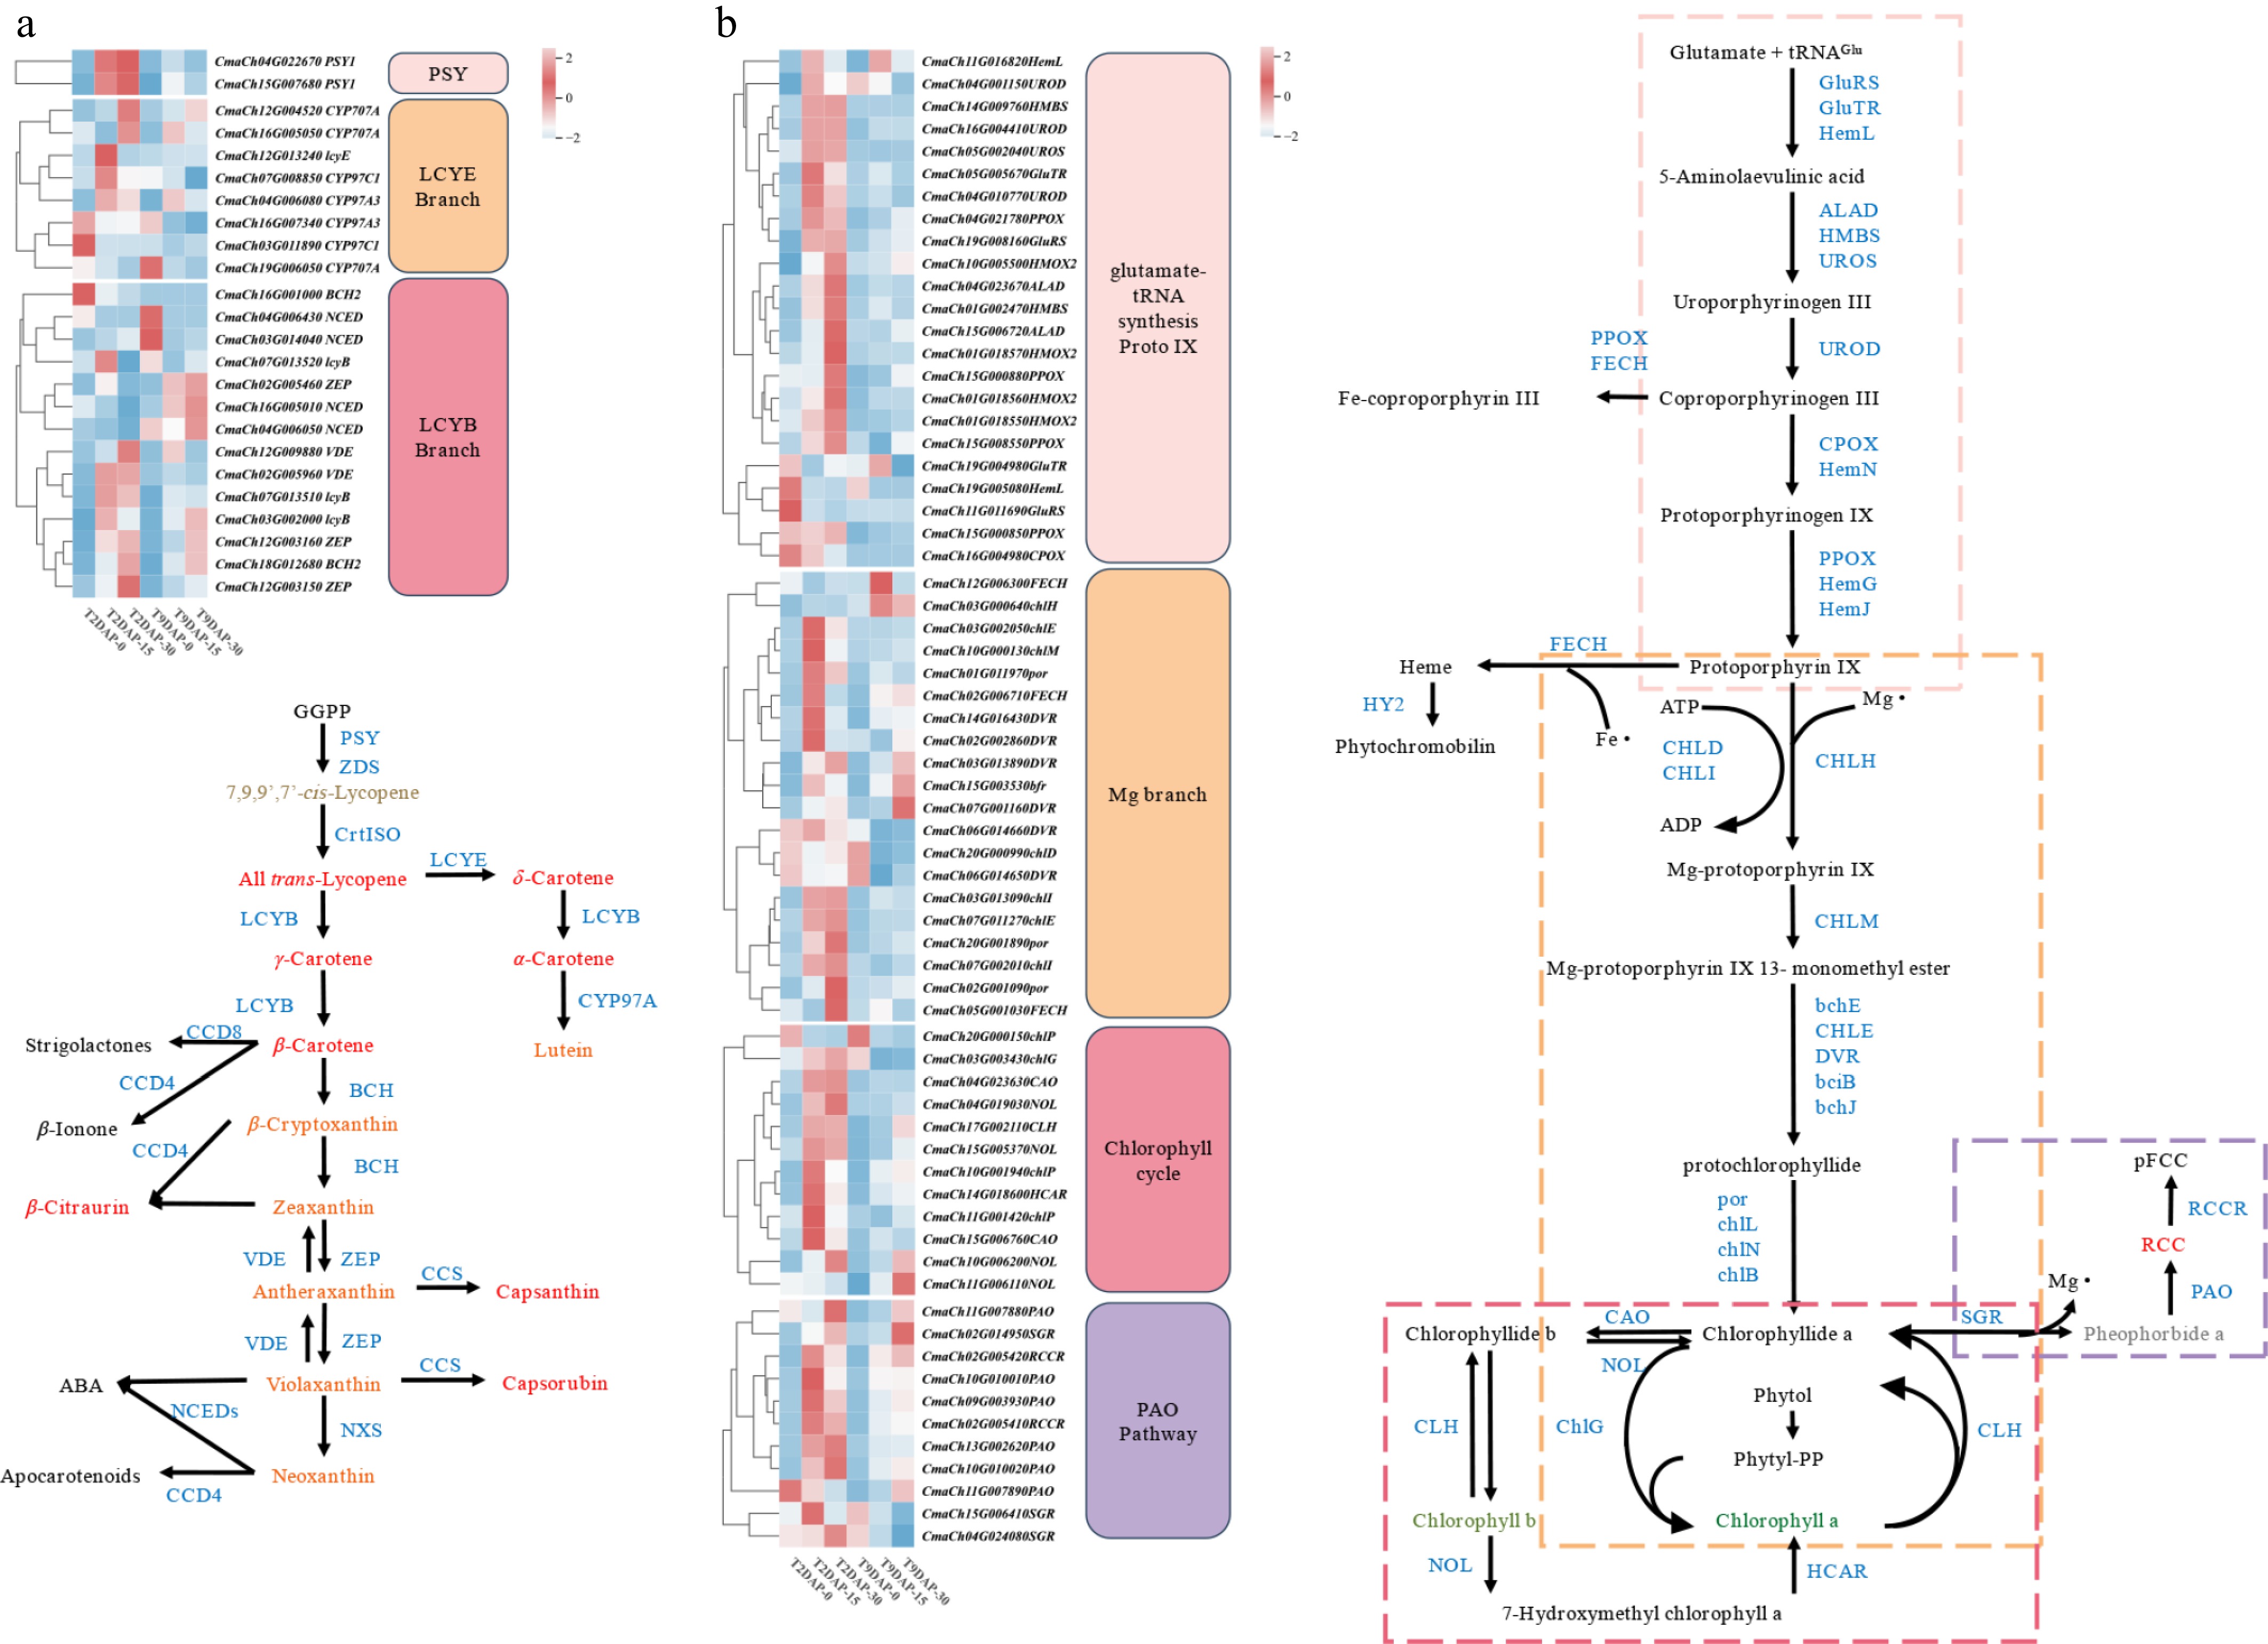
Figure 6.
Heatmap of the DEGs in the three fruit development periods of '2013-12' and '9-6'. (a) DEGs involved in carotenoid biosynthesis. (b) DEGs involved in chlorophyll metabolism. The level of gene expression was quantified as the mean FPKM value across three biological replicates for each sample. The red and green colors in the heatmap represent the expression level of each gene. Enzymes involved in carotenoid biosynthesis, chlorophyll biosynthesis and metabolic pathways are blue in color. The small blue dotted box indicates the glutamate-tRNA to Proto IX process, the orange dotted box indicates the 'Mg branch', the blue dotted box indicates the 'chlorophyll cycle', and the red dotted box indicates the 'PAO pathway'.
The majority of genes in '9-6' tended to increase their expression as the fruits developed. Some genes (CmaCh04G006430, CmaCh19G006050, CmaCh16G007340, and CmaCh03G011890) presented a downward trend with fruit development, which was similar to that in '2013-12' (Fig. 6a). The CmaPSY1 gene increased significantly from 0-15 DAP and decreased slightly from 15-30 DAP. In the 'LCYB branch', the expression level of CmaBCH2 (CmaCh16G00100) almost approached zero in '9-6' (FPKM value < 1), and might respond to the low zeaxanthin content in the fruit peel. The CmaZEP (CmaCh02G005460) gene, which regulates the conversion of zeaxanthin to purplaxanthin, gradually increased in the '9-6'. Compared with that at 0 DAP, the expression level was doubled at 15 and 30 DAP, and was significantly greater at 30 DAP than that in '2013-12', reaching three times greater. Compared with that in the 0 DAP period, the expression of the CmaNCED gene (CmaCh16G005010) in '9-6' gradually increased, which doubled at 15 and 30 DAP. The expression pattern of another CmaNCED gene (CmaCh04G006430) in '9-6' was the same as that in '2013-12'. In the 'LCYE branch', the synthesis of lutein from α-carotene was catalyzed by CmaCYP97A3 (CmaCh04G006080 and CmaCh16G007340). The expression patterns of the two CmaCYP97A3 genes were also similar in '9-6'. The expression level of CmaCh04G006080 was the same as that of '2013-12'. For CmaCh16G007340, compared with those at 0 DAP, the expression level at 15 and 30 DAP in '9-6' were one and two times lower, respectively. To further clarify the connection between the carotenoid metabolites and DGEs in the carotenoid metabolic pathway, the correlation analysis of the metabolite content and the expression levels of DGEs was performed (Supplementary Fig. S6). The total carotenoid was significantly positively correlated with the expression of CmaZEP (CmaCh12G003150), CYP707A (CmaCh12G004520), CmaZEP (CmaCh12G003160), and CmaBCH2 (CmaCh18G012680), indicating that these genes play an important role in the carotenoid accumulation in the fruit peel of pumpkins. Lutein, zeaxanthin, and β-cryptoxanthin, the main carotenoids of fruit peel, were significantly positively correlated with the expression of CmaPSY1 (CmaCh04G022670, CmaCh15G007680), CmalcyB (CmaCh07G013510), CmaCYP707A (CmaCh12G004520), CmaBCH2 (CmaCh18G012680), CmaZEP (CmaCh12G003150, CmaCh12G003160), and CmaVDE (CmaCh02G005960), indicating that these genes might be the key genes that regulate the peel coloration.
Since chlorophyll content is an important factor in determining peel color, 66 DEGs in the chlorophyll metabolic pathway were screened to analyze the synthesis of chlorophyll. As shown in Fig. 6b, compared with those in the 0 DAP period, the expression levels of most synthetic pathway genes significantly increased at 15 and 30 DAP, whereas the increase rate was relatively low from 15–30 DAP. The chlorophyll metabolism process is divided into four parts. In the first ('glutamate-TrNA synthesis Proto IX'), and second ('Mg branch') parts, the CmaCHLH gene (CmaCh03G000640), encoding the H subunit of magnesium chelate, was the only DEG whose expression level was higher in '9-6' than in '2013-12' (the expression multiples were five, five, and four times greater at 0, 15, and 30 DAP, respectively). In the other two parts, the expression changes of most metabolic pathway genes tended to be similar to those of synthetic pathway genes. CmaCAO gene (CmaCh04G023630, CmaCh15G006760), CmaCLH (CmaCh17G002110), CmaNOL (CmaCh15G005370, CmaCh15G005370, and CmaCh10G006200) genes in Part III ('Chlorophyll cycle'), and CmaSGR (CmaCh04G024080) and CmaPAO (CmaCh09G003930, CmaCh10G010010, CmaCh10G010020, CmaCh11G007880, and CmaCh13G002620) genes in Part IV ('PAO Pathway') had significantly higher expression in '2013-12' than in '9-6' during the same developmental period, especially at the 15 and 30 DAP periods. These findings indicate that the greater accumulation of chlorophyll in '9-6' than in '2013-12' may be due to the high expression of the CmaCHLH gene and the low expression of genes related to the chlorophyll cycle and degradation.
-
The primary determinant of Cucurbita crops' coloration is the accumulation and proportionate content of chlorophyll and carotenoids[2,15,23,24]. In young cucumber fruit peel, the Caro/Chl was about 1 (correlation coefficient is 0.991**), except for the white peel color. The Chl a/Chl b ratio is 1:1.7 indicating that Chlb has a greater influence on the peel color[23]. Study on C. maxima found that chlorophyll is the main pigment to determine the green and gray peel colors, and masked the color of carotenoid when the Caro/Chl ratio is lower than 1[2,13]. In the present study, chlorophyll and carotenoid metabolites were detected to identify the cause of the pigment difference between '2013-12' and '9-6'. Compared with '2013-12', the peel color of '9-6' gradually changing from green to dark green was mainly related to the increase in pigment content instead of proportion. The content determination of chlorophyll, and the precursor substances indicated that the synthesis of chlorophyll in '2013-12' peels was blocked between Corogen III and Proto IX. Transcriptome data showed that the CmaCHLH was positively correlated with chlorophyll (including Chl a, Chl b, and total chlorophyll) levels in the two inbred lines by WGCNA analysis (Fig. 5b). It is the only gene that was up-regulated in '9-6' rather than '2013-12' in the chlorophyll synthesis pathway. The present result is similar to the conclusion in a previous study on colour-leaf formation of Dendrobium catenatum[25]. It is known that CmaCHLH is involved in regulating the formation of the H subunit in magnesium chelatase (Mg-chelatase), which can affect the activity of binding substrate. Low activity of Mg-chelatase would cause albino and etiolation in plants[26]. The insertion of T-DNA in the H subunit resulted in the inactivation of the Mg-chelatase gene in rice, and lead to the formation of yellow-green leaf color mutants[27]. In Cucurbita pepo, CpCHLH had been identified by fine mapping as being responsible for the yellow peel color phenotype[28]. Its mutation could result in a reduction in chlorophyll content and present yellow peel color, while its regulatory mechanism needs further study. In summary, it is speculated that CmaCHLH may be the key gene that leads to the block and affects the chlorophyll content in squash fruit peel.
The key transcription factors involved in light signal transduction have significant effects on chlorophyll synthesis. The expression levels of the bHLH transcription factor genes PIF3 and PIF4 exhibited a positive correlation with the carotenoid content in apricot peel[29], and the HY5 in tomato and Arabidopsis promotes chlorophyll synthesis and accumulation[30]. Meanwhile, HY5 competes with PIF1 in regulating carotenoid accumulation by integrating the cis-element G-box within the PSY promoter[31]. Additionally, the HY5 promotes the accumulation of carotenoids by affecting the translation efficiency of numerous ripening-related genes in tomato fruits[32]. In '2013-12', the expression of CmaPIF3 (CmaCh17G012260) was significantly greater than that in '9-6', especially at 30 DAP (Supplementary Fig. S5). Furthermore, the expression of CmaHY5 (CmaCh05G003900), which is highly correlated with zeaxanthin biosynthesis, was greater in '2013-12' (Supplementary Table S9). CmaPIF3 and CmaHY5 were homologous to the PIF3 and HY5 genes in Arabidopsis (identity = 42.53 and 80.38, respectively), and tomato (identity = 92.3 and 80.38, respectively). There may be a similar gene function in pumpkin. These findings underscore the pivotal roles of CmaPIF3 and CmaHY5 in the peel color regulation of '2013-12'.
Carotenoids are responsible for the depth of yellow to red peel color in C. maxima. The red peel contained more zeaxanthin content than the pale color (orange and yellow), and green peel[2]. This is consistent with the phenomenon observed in this study. Moreover, in zucchini, zeaxanthin was the second highest carotenoid content (less than lutein) in orange peel, and significantly higher than that in yellow and green peel[13]. The accumulation and variety of carotenoid can affect fruit color, which has been confirmed in tomato, citrus, and many other crops[11, 33]. In the carotenoid synthesis pathway, the increasing pigment content of the LCYB branch (zeaxanthin, β-carotene, and β-cryptoxanthin) in '2013-12' speculated that the LCYB branch plays an important role in determining peel colour changes during pumpkin fruit development.
It has been reported that transcription factors (TFs) affect the storage and accumulation of plant pigment. The APRR2 genes positively regulate genes involved in chlorophyll and carotenoid synthesis, enhancing pigment storage[34]. In Cucurbitaceae crops, APRR2 has been confirmed by many studies to be positively correlated with chlorophyll accumulation, and is responsible for green peel color[35−39], and fruit stripe[40]. Members of the highly similar APRR2 gene family are usually formed to gene cluster[37], and these members of the APRR family may enhance the function, or compensate for the functional deficiencies, of APRR2[40]. In the present study, the CmaAPPR2 (CmaCh02G015930) and CmaAPRR9 (CmaCh15G009950) genes potentially correlate with the expression of the CmaPSY and CmaLCYB genes. The expression of the CmaAPRR2 gene (CmaCh02G015930) was extremely significantly correlated with the expression of the CmaPSY (CmaCh15G007680: r = 0.97, p = 0.001; CmaCh15G007680: r = 0.99, p = 0.48e-05), and CmaLCYB (CmaCh07G013510: r = 0.91, p = 0.01) genes. The expression of another CmaAPRR2 (CmaCh02G015920) gene was significantly correlated with CmaPSY (CmaCh15G007680: r = 0.81, p = 0.05), and CmaLCYB (CmaCh07G013510: r = 0.84, p = 0.04) genes. It was indicated that the role of APRR2 in the synergistic regulation of chlorophyll and carotenoid accumulation may involve regulating CmaPSY and CmaLCYB, which were the structural genes involved in the carotenoid biosynthesis pathway, and crucial for the contribution of carotenoids and zeaxanthin accumulation in '2013-12'. The function of APRR2 may involve a more complex mechanism and need further study in Cucurbitaceae crops.
The AP2/ERF superfamily of transcription factors is unique to plants. In tomato fruit, the AP2a negative regulating fruit ripening, and downregulation of AP2a resulted in significant changes in key primary metabolites and carotenoids[41,42]. In pummelo (Citrus maxima), the CitERF23, CitERF27, and CitERF32 genes in the AP2/ERF family were proposed as candidate genes that regulate carotenoid metabolism[33]. Studies suggest that the AP2 may also affect Arabidopsis leaf color by influencing chlorophyll synthesis or degradation genes (such as leaf color change under aging or environmental stress)[43]. In this study, CmaAP2 (CmaCh01G000370/CmaCh10G004460), and CmaERF4 (CmaCh03G012830/CmaCh13G010270) were upregulated in '2013-12', and were also considered to contribute to the accumulation of zeaxanthin in fruit peel. Additionally, mTERFs (mitochondrial transcription termination factors) stimulate leaf coloration by influencing the expression of genes associated with both chloroplasts and nuclei in Arabidopsis[44]. Owing to the changes in chloroplast morphology and plant development, the color of sepals, stems, leaves, and cotyledons in mTERF5 mutants is lighter than that in normal plants[45]. The hindered chloroplast development at an early stage in the mTERF6 mutant caused bleaching, and ultimately the death of the seedlings[46]. The results of this study revealed that mTERF (CmaCh01G016320) was in the blue module, and might be related to the accumulation of zeaxanthin in fruit peel.
Together, a model is formulated upon the basis of pivotal genes identified through gene coexpression network analysis (Fig. 7a). The expression of the key transcription factor genes, PIF3, APRR2, HY5, and ERF4, coupled with important structural genes, PSY1, BCH2, and VDE was highly associated with the pigment level in the red fruit peel. The expression patterns of these genes may potentially regulate the content and category of accumulated carotenoids, particularly zeaxanthin, as well as the degradation of chlorophyll in '2013-12'. The expression of some TF genes, such as bHLH, ERF, and MYB genes, together with some structural genes (e.g., CHLH, NOL, and PAO), may lead to the accumulation of chlorophyll in '9-6'. During fruit development in '2013-12', the increasing ratio of carotenoids in the LCYB branch contributed to the peel coloration changing from yellow to red (Fig. 7b). Zeaxanthin is the key carotenoid that affects the coloration process. The highest proportion (72.37%) of lutein accounted for the light yellow fruit color at 0 DAP. With fruit development, the proportion of lutein decreased, and that of zeaxanthin increased sharply. The color of the fruit gradually changed to red at 15 to 30 DAP. Based on WGCNA analysis, the transcription factor genes PIF3, APRR2, HY5, and ERF4 contributed to the zeaxanthin accumulation pattern (Fig. 5). Furthermore, the correlation between the carotenoid metabolites content and the expression level of DGEs in carotenoid metabolic pathway showed that ZEP and CYP707A were significantly positively correlated with zeaxanthin accumulation (Supplementary Fig. S6). It is speculated that the increase of zeaxanthin can deepen the yellow color into orange or red in Cucurbita peel. The intricate regulatory mechanisms underpinning the proposed model in C. maxima necessitate further exhaustive exploration.
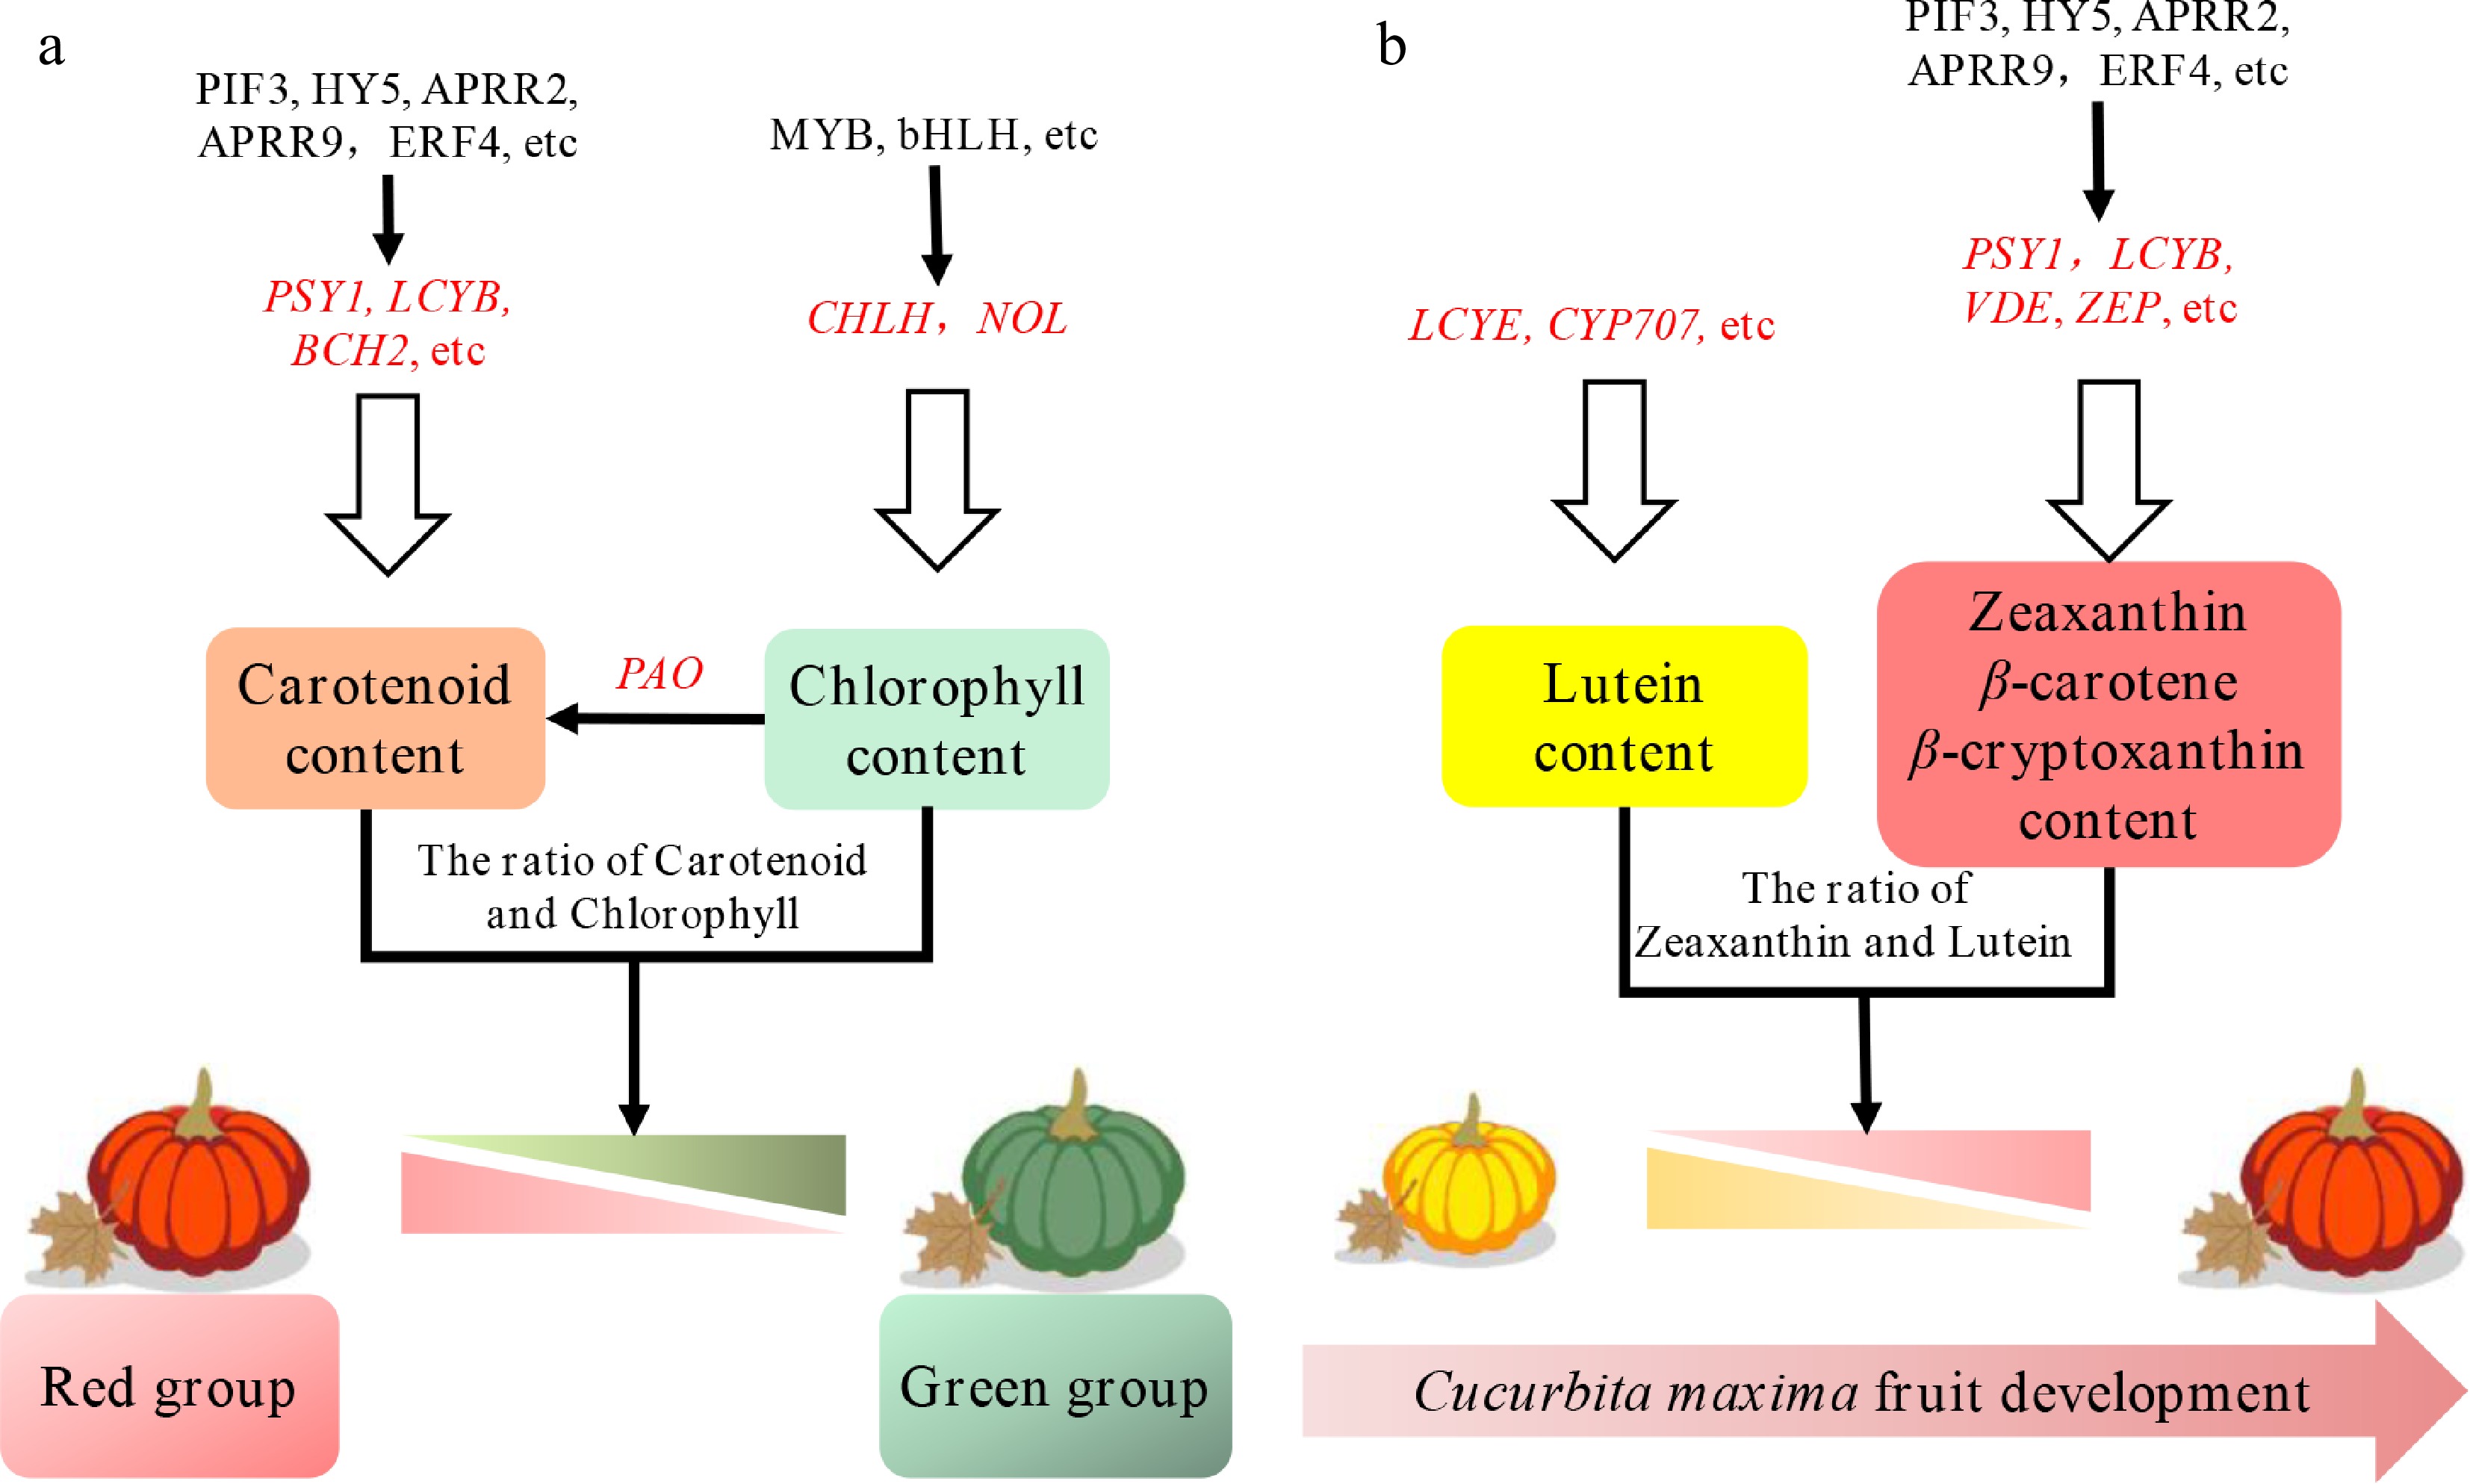
Figure 7.
Proposed model of anabolic and catabolic pathways for carotenoids and chlorophyll in Cucurbita maxima peel. (a) The proposed model with mature peels in the red and green groups. (b) The proposed model with a young yellow peel, and red mature peel. The genes in red represent TFs. The genes in black are pathway genes. The red triangle and the green triangle represent the coloration levels of the pumpkin peel from dark to light.
-
Peel color is an important trait in Cucurbita crops. The peel color of '2013-12' changes from yellow to red during fruit development. The main pigment accumulated in the peel of '2013-12' is carotenoid, and the chlorophyll content remained at a low level during fruit development. The synthesis of chlorophyll was mainly hindered between coproporphyrinogen III and protoporphyrin IX. Metabolome data showed that the main carotenoid accumulated in '2013-12' is lutein > zeaxanthin > β-carotene > β-cryptoxanthin. The highest content and proportion of lutein in peel results in the light yellow fruit color at 0 DAP. With fruit development, the content of carotenoid is increased. The proportion of lutein decreased, and zeaxanthin, β-carotene, and β-cryptoxanthin, especially zeaxanthin, increased sharply. The fruit gradually changed to red from 0 to 30 DAP. The transcriptome results also revealed that the expression levels of CmaPSY1, CmaBCH2, CmaVDE, and other genes in the two carotenoid branches were upregulated, or had high abundance, which were important genes for the formation of red peel.
Chlorophyll has a strong effect on carotenoid content, the peel color of '9-6' fruit is primarily determined by the chlorophyll content. The transcriptome results revealed that the elevated expression of the CmaCHLH gene, in conjunction with the suppressed expression of genes associated with the chlorophyll degradation pathway, contributed to the high chlorophyll accumulation in '9-6'. WGCNA analysis revealed that several pivotal genes, such as PIF3, HY5, APRR2, ERF4, PSY1, BCH2, VDE, and CHLH, potentially play crucial roles in pigment accumulation within pumpkin peel, thereby influencing the development of the peel's distinct coloration.
-
The authors confirm their contributions to the paper as follows: formal analysis: Luo Y, Chi Y, Wang C; data curation: Luo Y, Zhang L; writing−original draft: Luo Y; methodology: Zhang L, Xu Z; visualization: Chi Y, Wang C; software: Wang C; resources, investigation: Xu W; supervision: Xu W, Qu S; validation: Xu Z; writing−review and editing: Wang Y; writing−review and funding acquisition: Qu S. All authors reviewed the results and approved the final version of the manuscript.
-
The raw datasets of RNA-seq generated during the current study are available in the NCBI repository, BioProject ID: PRJNA1178721.
-
The authors declare that they have no conflict of interest.
- Supplementary Table S1 Carotenoids detections of Cucurbita maxima peel.
- Supplementary Table S2 The primer for qRT-PCR of differential expression gene.
- Supplementary Table S3 The carotenoids content of Cucurbita maxima peel.
- Supplementary Table S4 RNA-seq sample sequencing data evalution and statistics.
- Supplementary Table S5 Reads and reference genome mapped data of RNA-seq samples.
- Supplementary Table S6 Unigene function annotation results of RNA-seq.
- Supplementary Table S7 The gene ratio of GO enrichment subcategories.
- Supplementary Table S8 Distribution of gene number in coexpression modules.
- Supplementary Table S9 Candidate genes in orange, red and blue module.
- Supplementary Table S10 The FPKM values of differential expression genes related to carotenoid biosynthesis.
- Supplementary Fig. S1 Correlation (a) and principal component analysis (b) between RNA-seq samples of Cucurbita maxima.
- Supplementary Fig. S2 GO enrichment terms of DEGs.
- Supplementary Fig. S3 KEGG enrichment of DEGs.
- Supplementary Fig. S4 Co-expression and regulation networks of DEGs associated with carotenoid and chlorophyll metabolism.
- Supplementary Fig. S5 qRT-PCR verification of DEGs.
- Supplementary Fig. S6 The correlation between the carotenoid metabolites content and the expression level of DGEs in carotenoid metabolic pathway.
- Copyright: © 2026 by the author(s). Published by Maximum Academic Press, Fayetteville, GA. This article is an open access article distributed under Creative Commons Attribution License (CC BY 4.0), visit https://creativecommons.org/licenses/by/4.0/.
-
About this article
Cite this article
Luo Y, Zhang L, Chi Y, Wang C, Xu W, et al. 2026. Combined analysis of carotenoid and chlorophyll metabolite and the transcriptome to analyze the peel color formation mechanism in pumpkin (Cucurbita maxima). Vegetable Research 6: e004 doi: 10.48130/vegres-0025-0048 

Combined analysis of carotenoid and chlorophyll metabolite and the transcriptome to analyze the peel color formation mechanism in pumpkin (Cucurbita maxima)
- Received: 16 October 2025
- Revised: 03 December 2025
- Accepted: 12 December 2025
- Published online: 31 January 2026
Abstract: The peel color of pumpkin (Cucurbita maxima) gives it its delightful appearance and contributes towards it's economic value. The peel color of Cucurbita maxima changes with the development process of the fruit, and the molecular mechanism of pigment accumulation in pumpkin fruit remains to be explored. The fruit peel of '2013-12' was yellow at 0 DAP, and gradually turned from orange to red, and the fruit peel of '9-6' was green at 0 DAP with no stripe, and gradually turned to gray with green stripes during fruit development. The present findings reveal that the accumulation and ratio of carotenoid and chlorophyll are the key factors affecting the coloration of pumpkin. The results showed that the main pigment accumulated in '2013-12' was carotenoid. With fruit development, the increase of zeaxanthin content and ratio cause the peel color to change from yellow to red. The deepening of '9-6' peel color is mainly related to the pigment content rather than the proportion. Additionally, the expression levels of CmaPSY1, CmaBCH2, CmaVDE, and other genes in the two branches of carotenoid biosynthesis were upregulated, or had high abundance, which are important genes for the formation of red peel. The upregulated expressed CmaCHLH gene, and downregulated expressed chlorophyll degradation pathway-related genes regulated high chlorophyll accumulation in '9-6'. Combining the metabolome data with the transcriptome data, the regulatory pathways of different peel color formation in pumpkin were speculated. The findings in this study contribute to elucidating the novel mechanism that underpins the coloration of pumpkin peel.