-
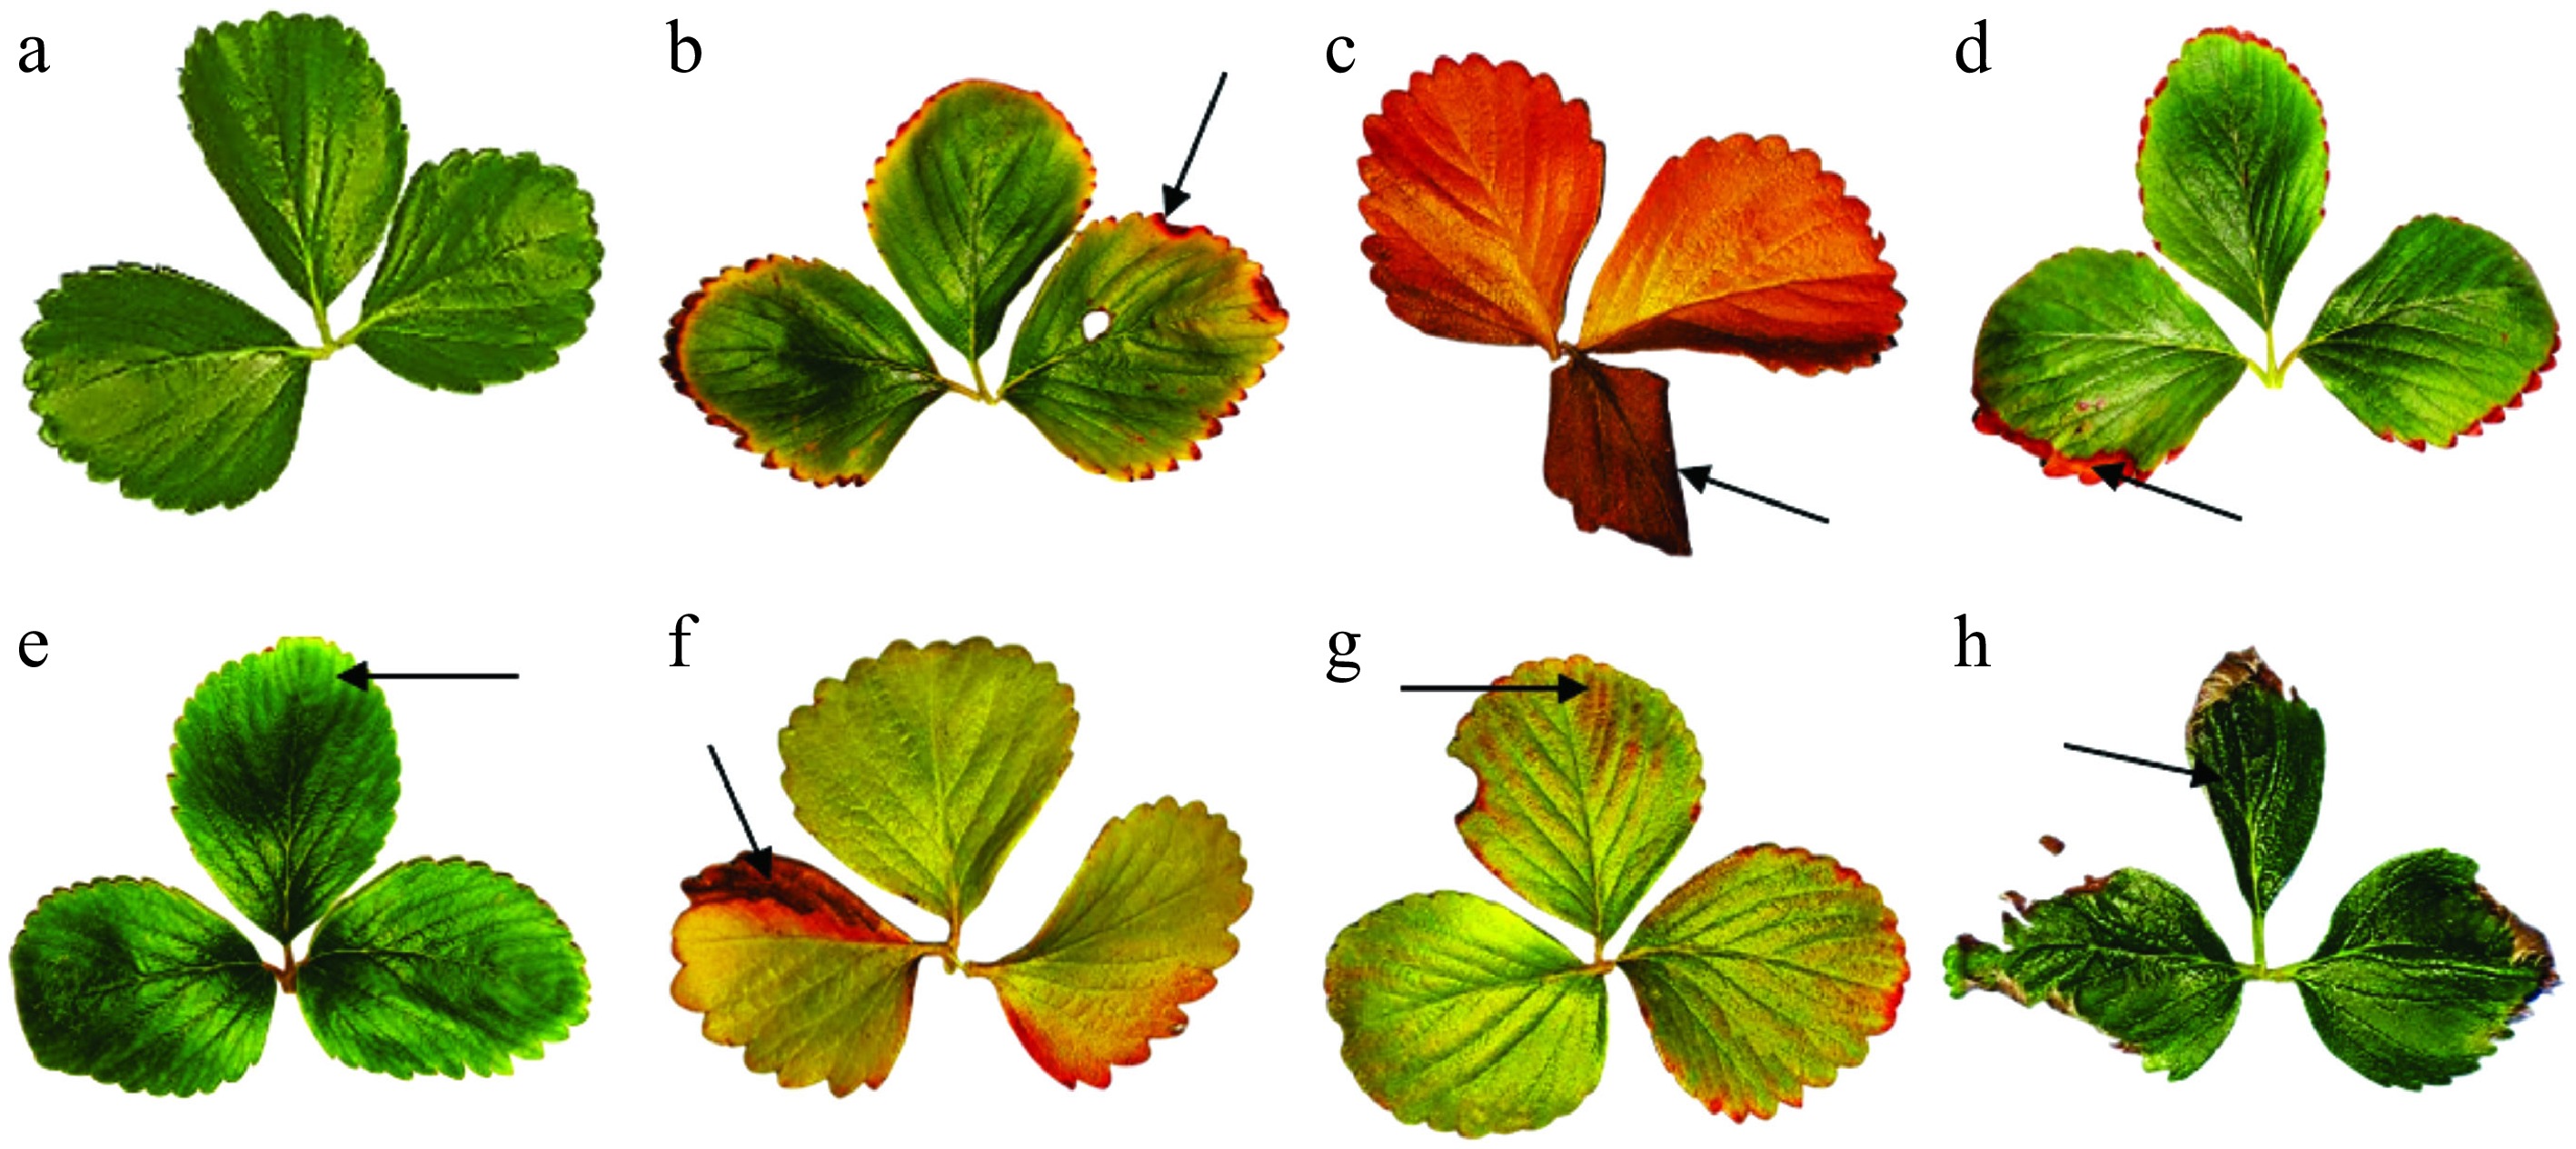
Figure 1.
Leaves classification. (a) Healthy leaves. Unhealthy leaves: (b) Red border. (c) Senescent leaf. (d) Brown border. (e) Chlorosis. (f) Withered. (g) Yellow and red spots. (h) Misshapen. Dark arrows indicate each symptom in unhealthy leaves.
-
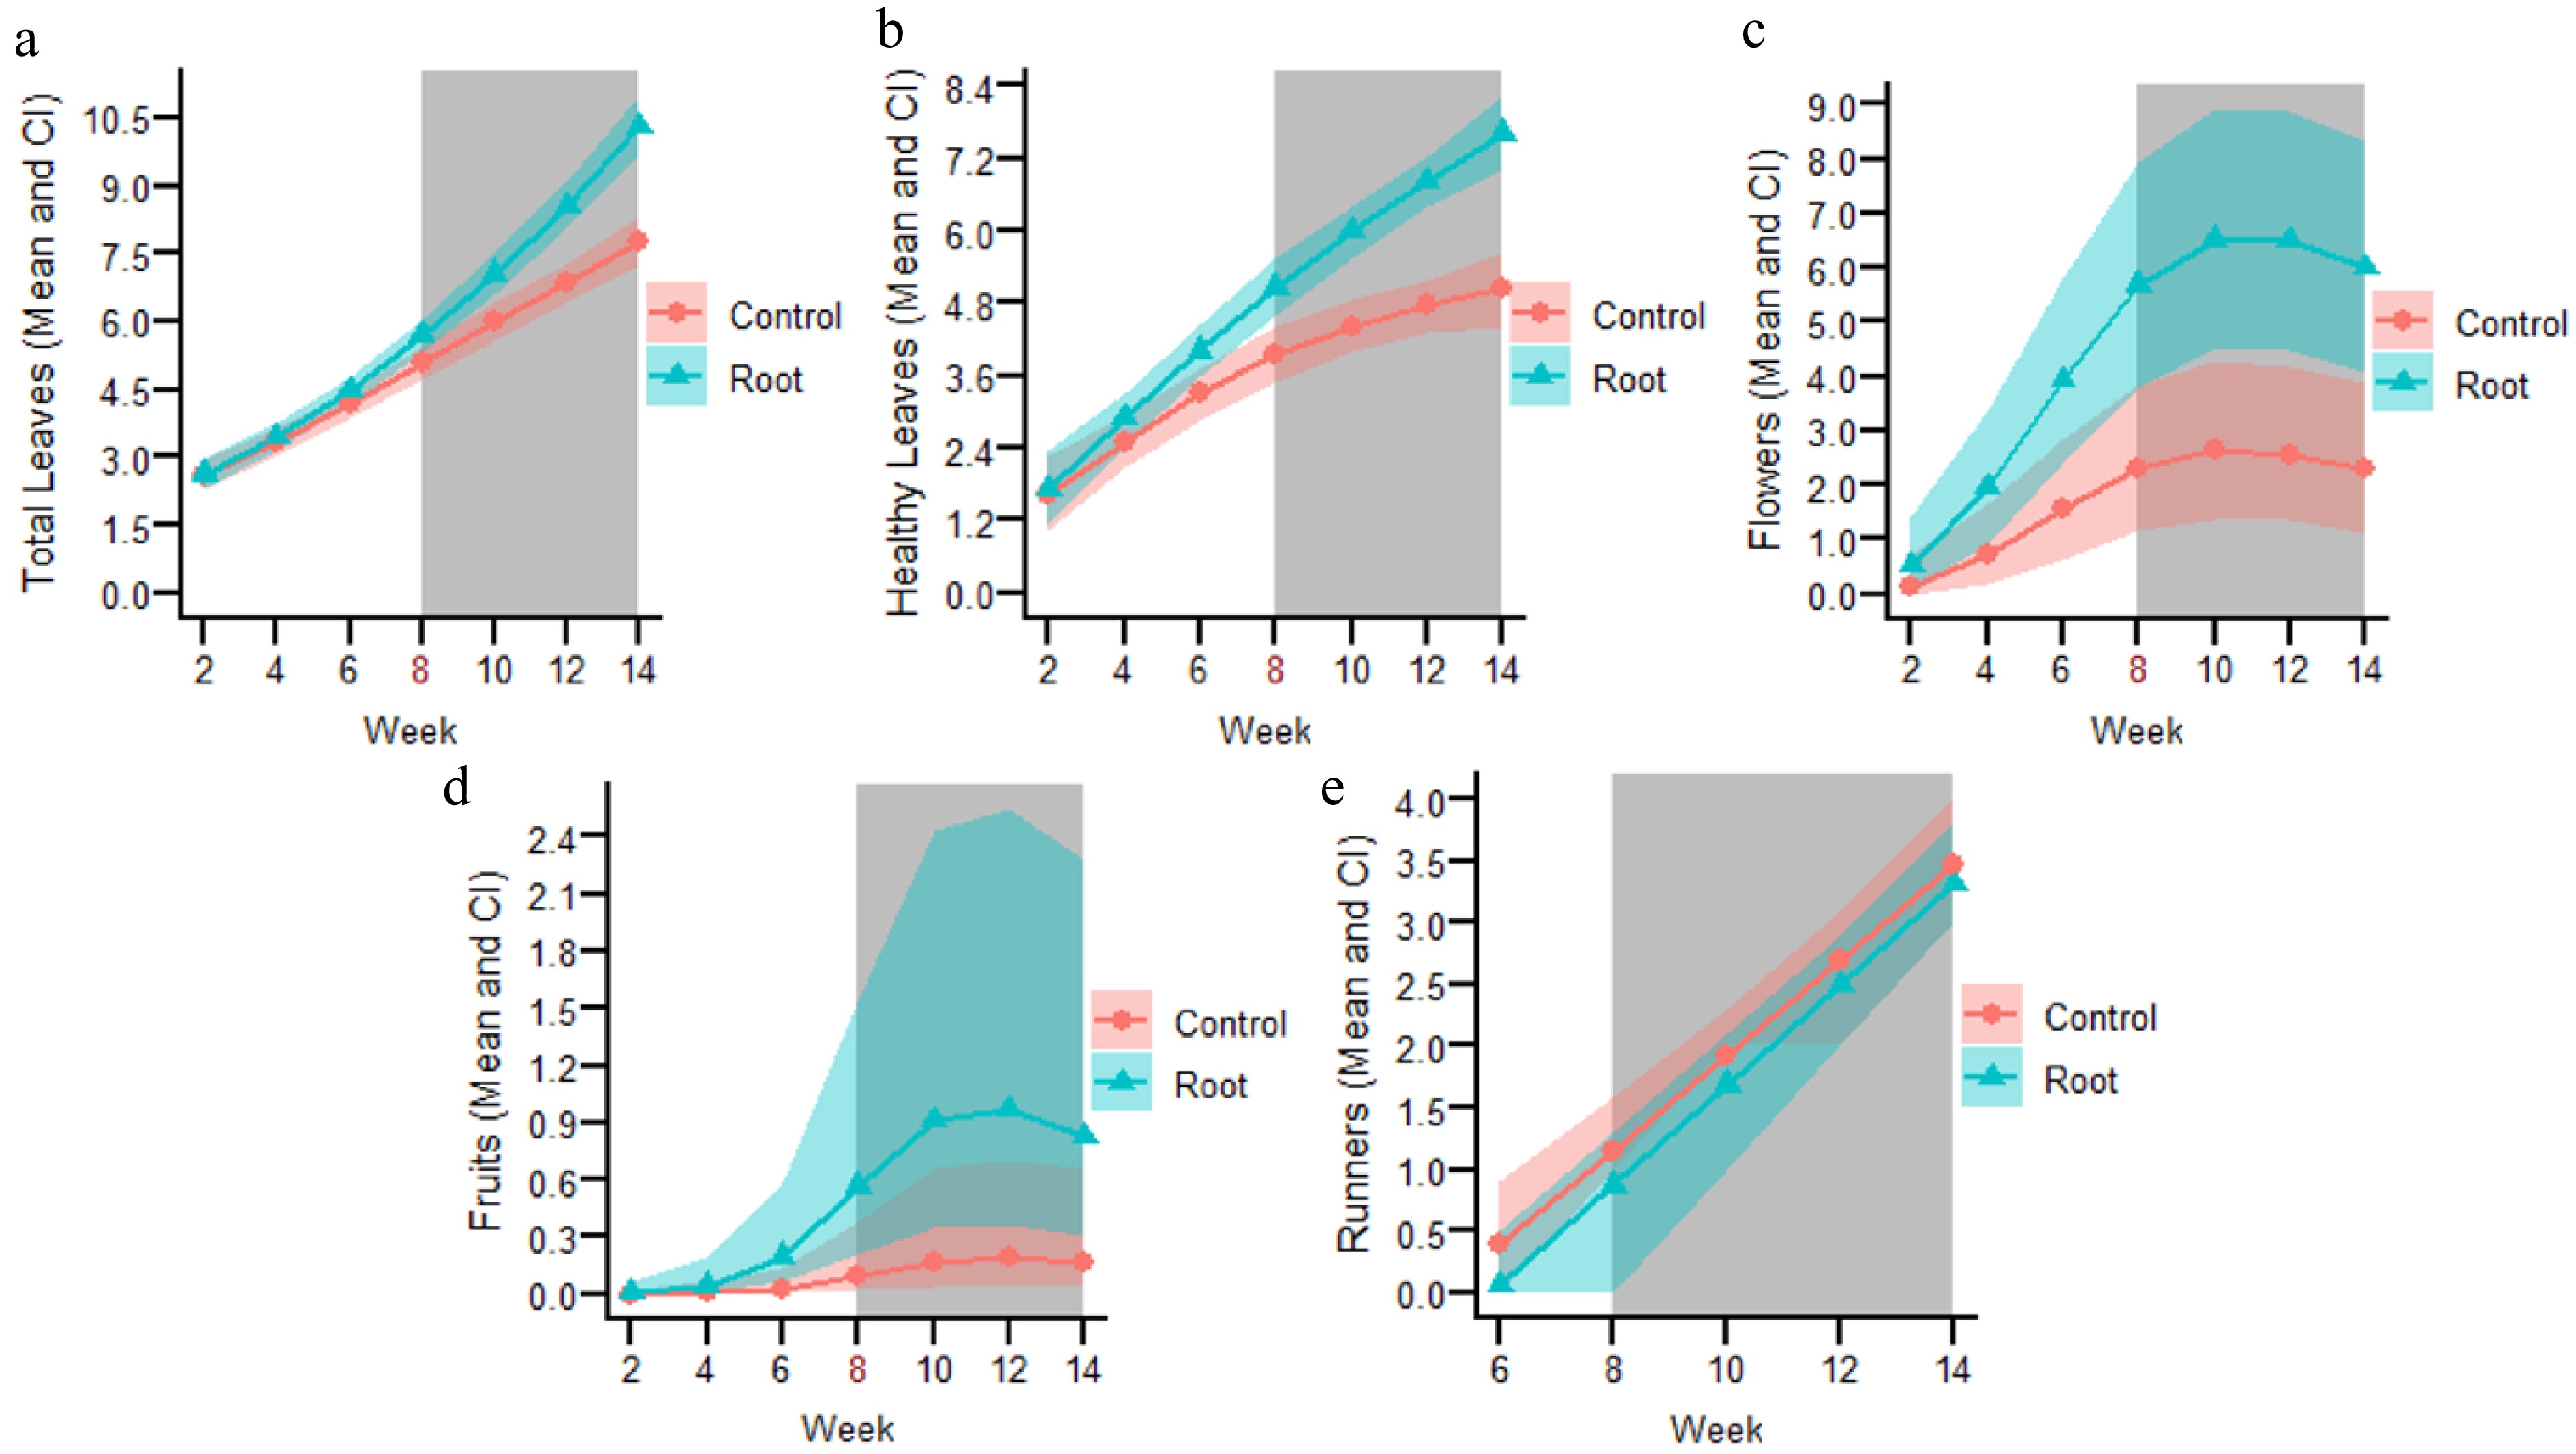
Figure 2.
Fitted lines from selected models for the following variables of the root-inoculated experiment: (a) Total number of leaves. (b) Total number of healthy leaves. (c) Total number of flowers. (d) Total number of fruits. (e) Total number of runners. The number in red on the X axis represents the knot, where the tendencies of each variable changed over time. The grey-shaded background indicates the weeks at which significant differences (p < 0.05) were observed between the root-inoculated and control treatments.
-
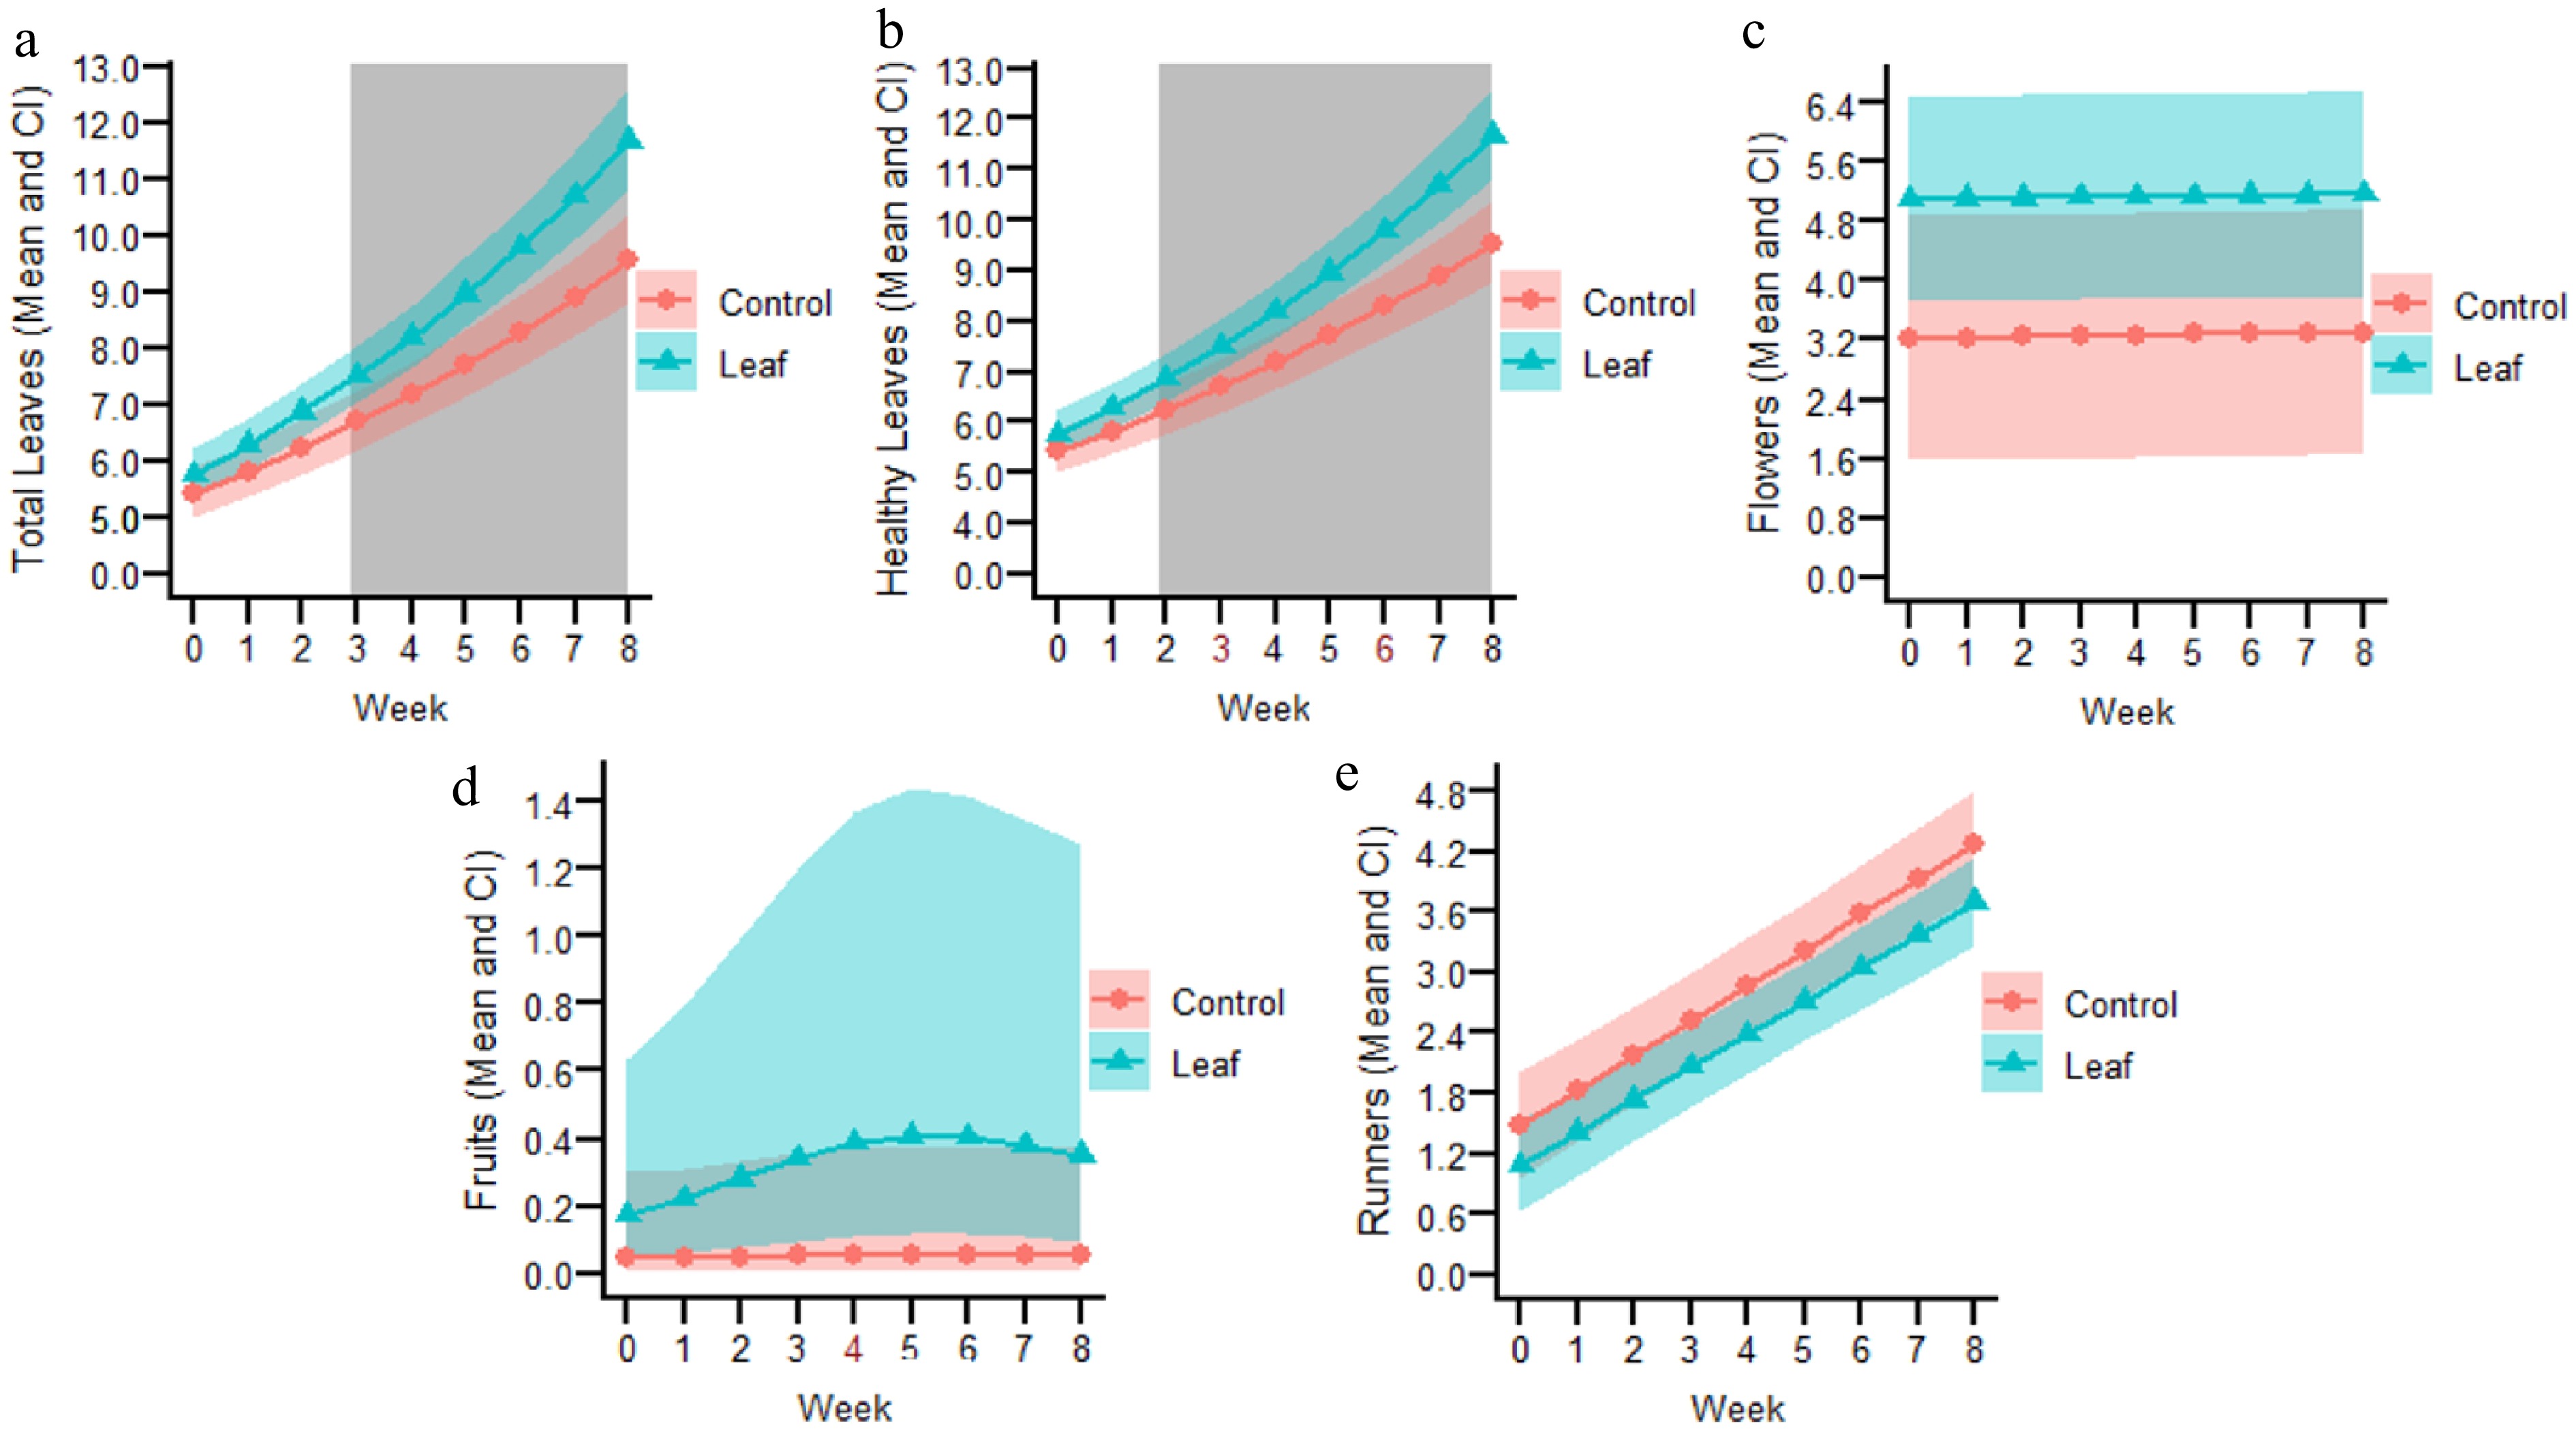
Figure 3.
Fitted lines from selected models for the following variables of the leaf-inoculated experiment. (a) Total number of leaves. (b) Total number of healthy leaves. (c) Total number of flowers. (d) Total number of fruits. (e) Total number of runners. The number in red on the X axis represents the knot, where the tendencies of each variable changed over time. The grey-shaded background indicates the weeks at which significant differences (p < 0.05) were observed between the leaf-inoculated and control treatments.
-
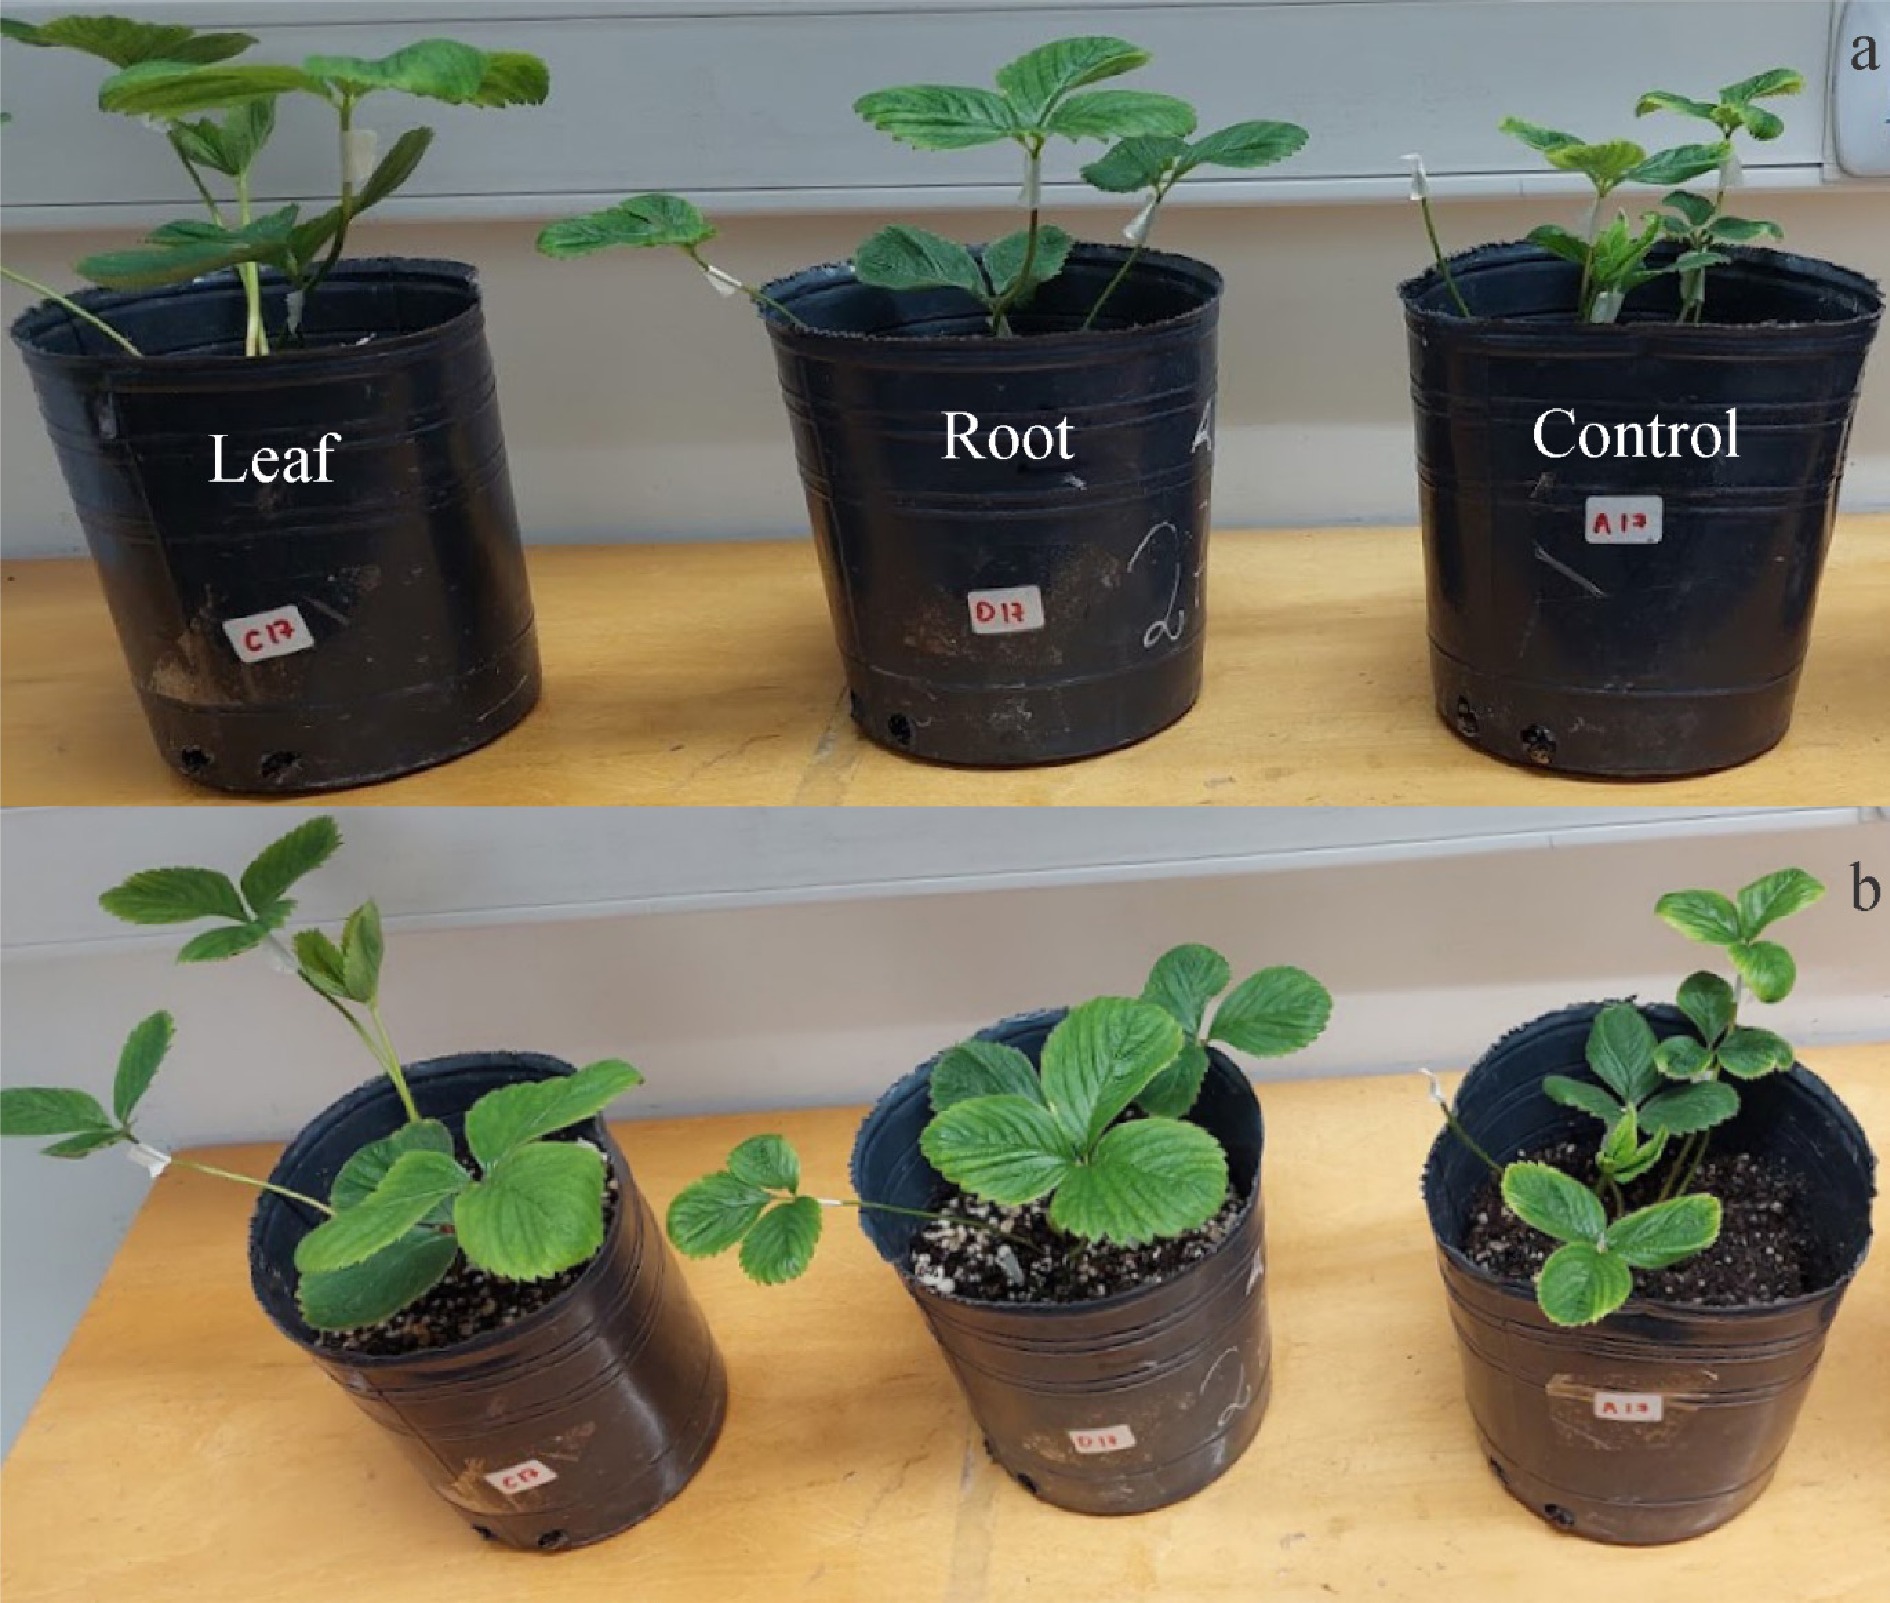
Figure 4.
Lateral view (above) and top view (below) of strawberry plants from the leaf inoculation (left), root inoculation (middle), and control (right) groups.
-
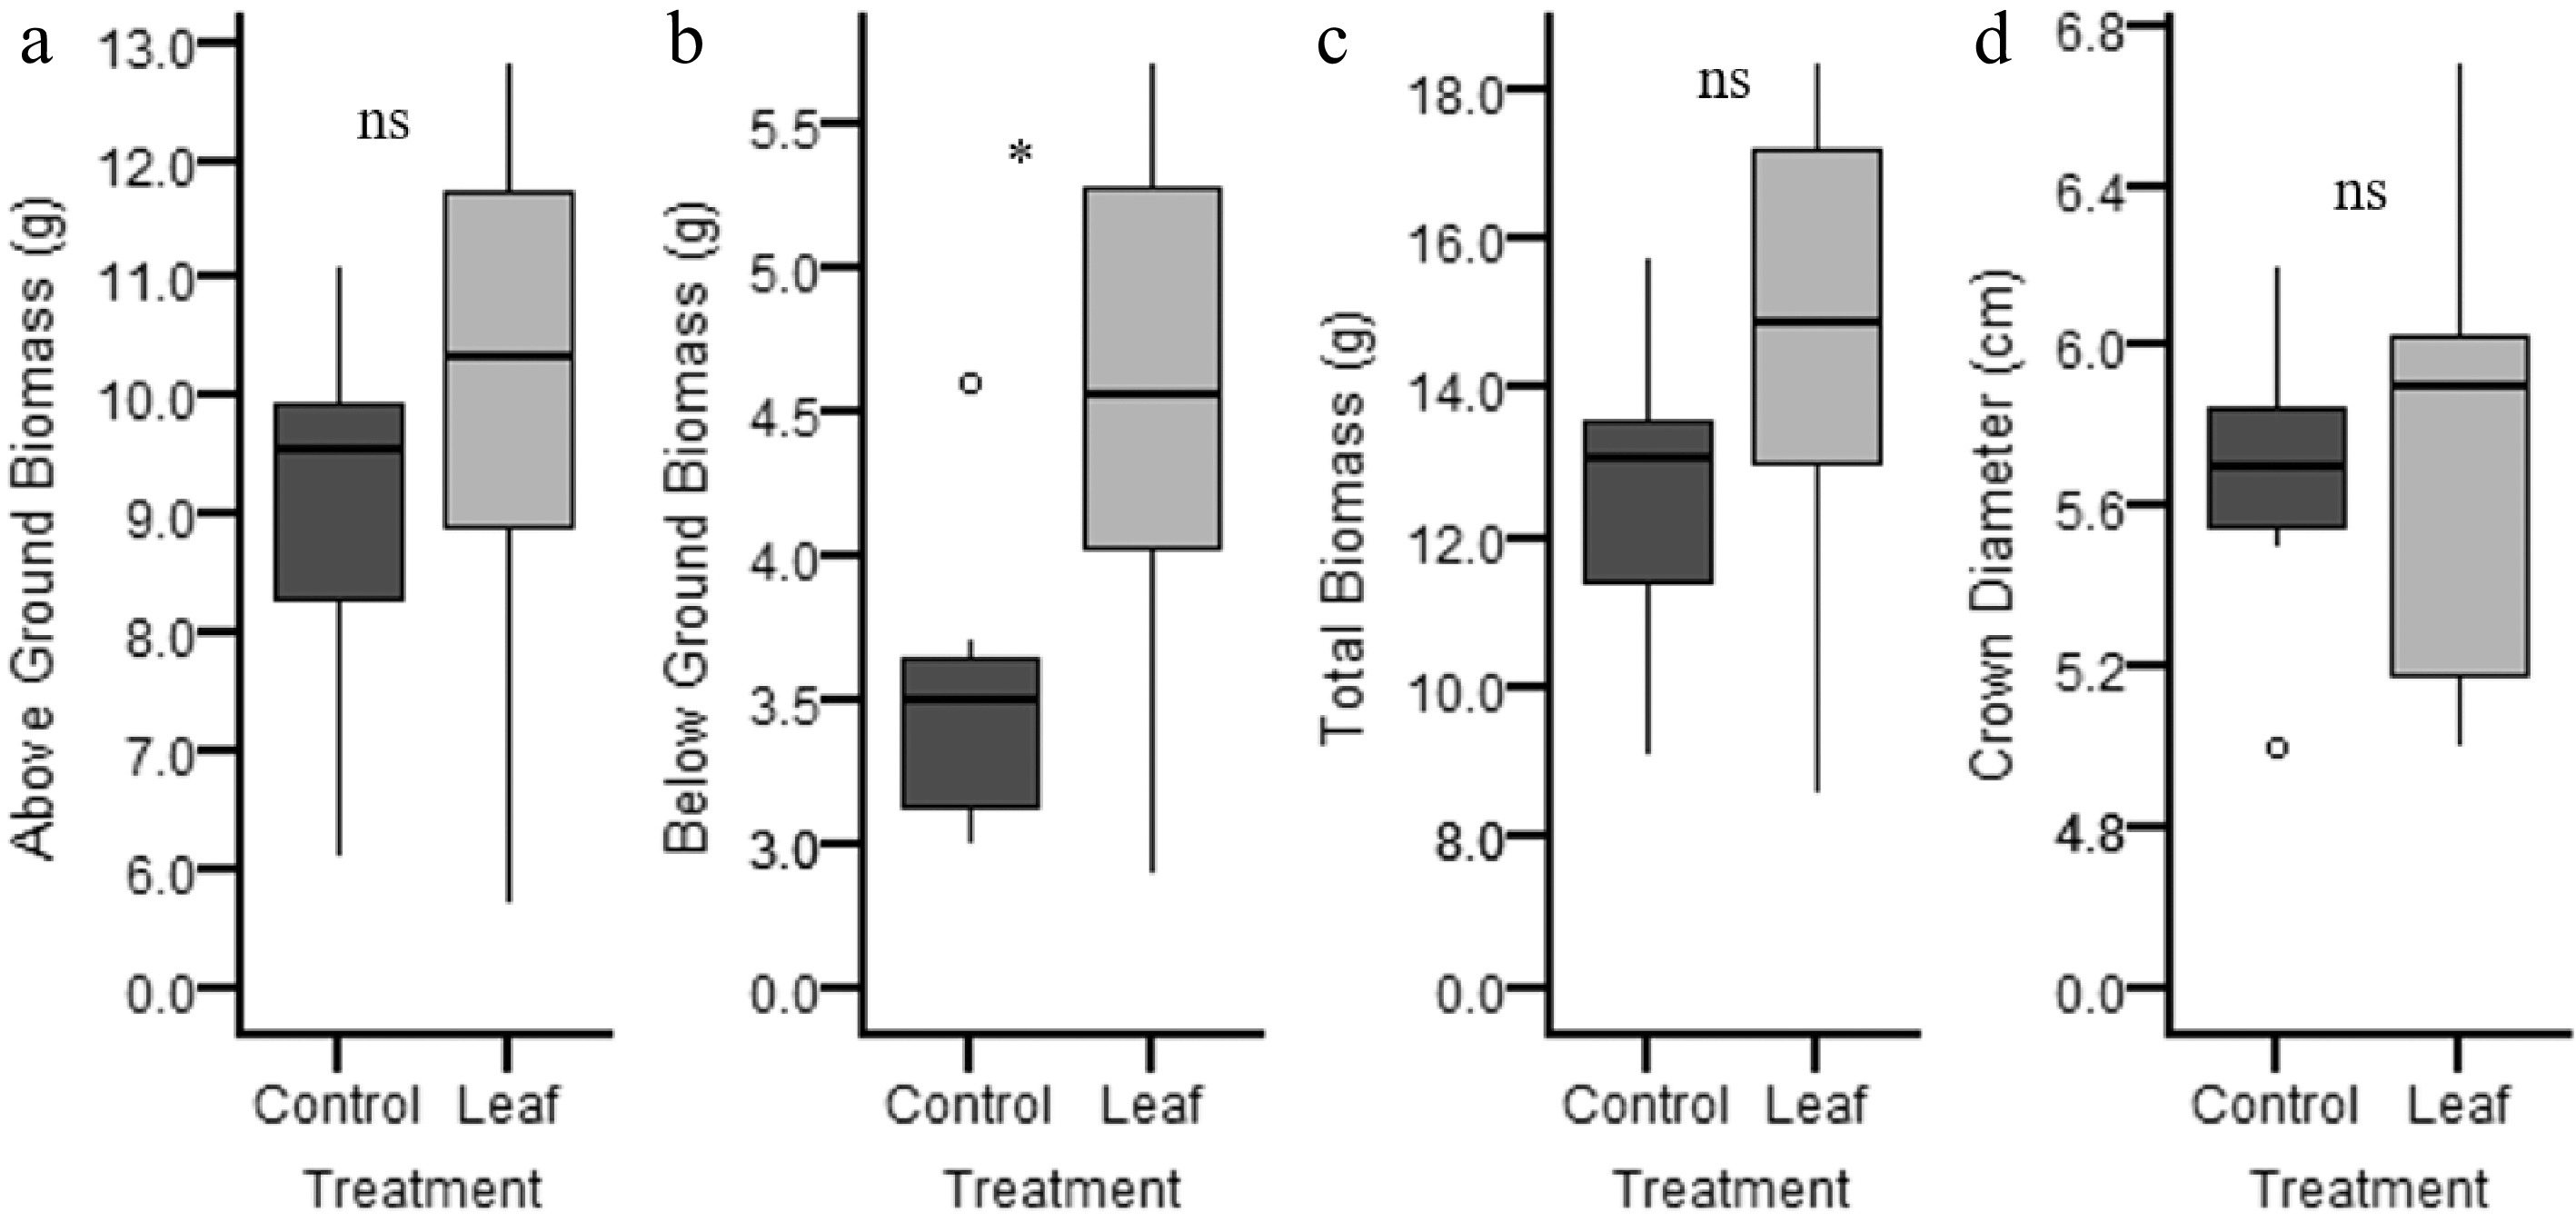
Figure 5.
Boxplot for (a) above-ground, (b) below-ground, and (c) total biomass, plus (d) crown diameter (Y axes are different for each variable) discriminated by treatment: control (light grey) and leaf inoculated (dark grey).
-
Days post inoculation (dpi) Organ harvested Number of plants/fruits Plants with the endophytes (%) Leaf/fruit with endophyte (%) Median (q1–q3) Min–max 7 Old inoculated leaves 10 100 9 (5–14) 4–16 7 Old non-inoculated leaves 10 20 9 (5–12) 5–12 14 Young inoculated leaves 10 90 12 (8–15) 3–29 14 Young non-inoculated leaves 10 40 1 (1–2) 1–3 21 Old non-inoculated leaves 10 20 2 (2–2) 2–2 43 Old non-inoculated leaves 10 0 0 0 7–24 Fruit 13 0 0 0 Table 1.
Percentage of endophytism with P. lilacinum calculated by plants and by leaf/fruit from the leaf inoculated experiment. The last column shows data as median with quartiles, plus minimum and maximum values recorded.
Figures
(5)
Tables
(1)