-
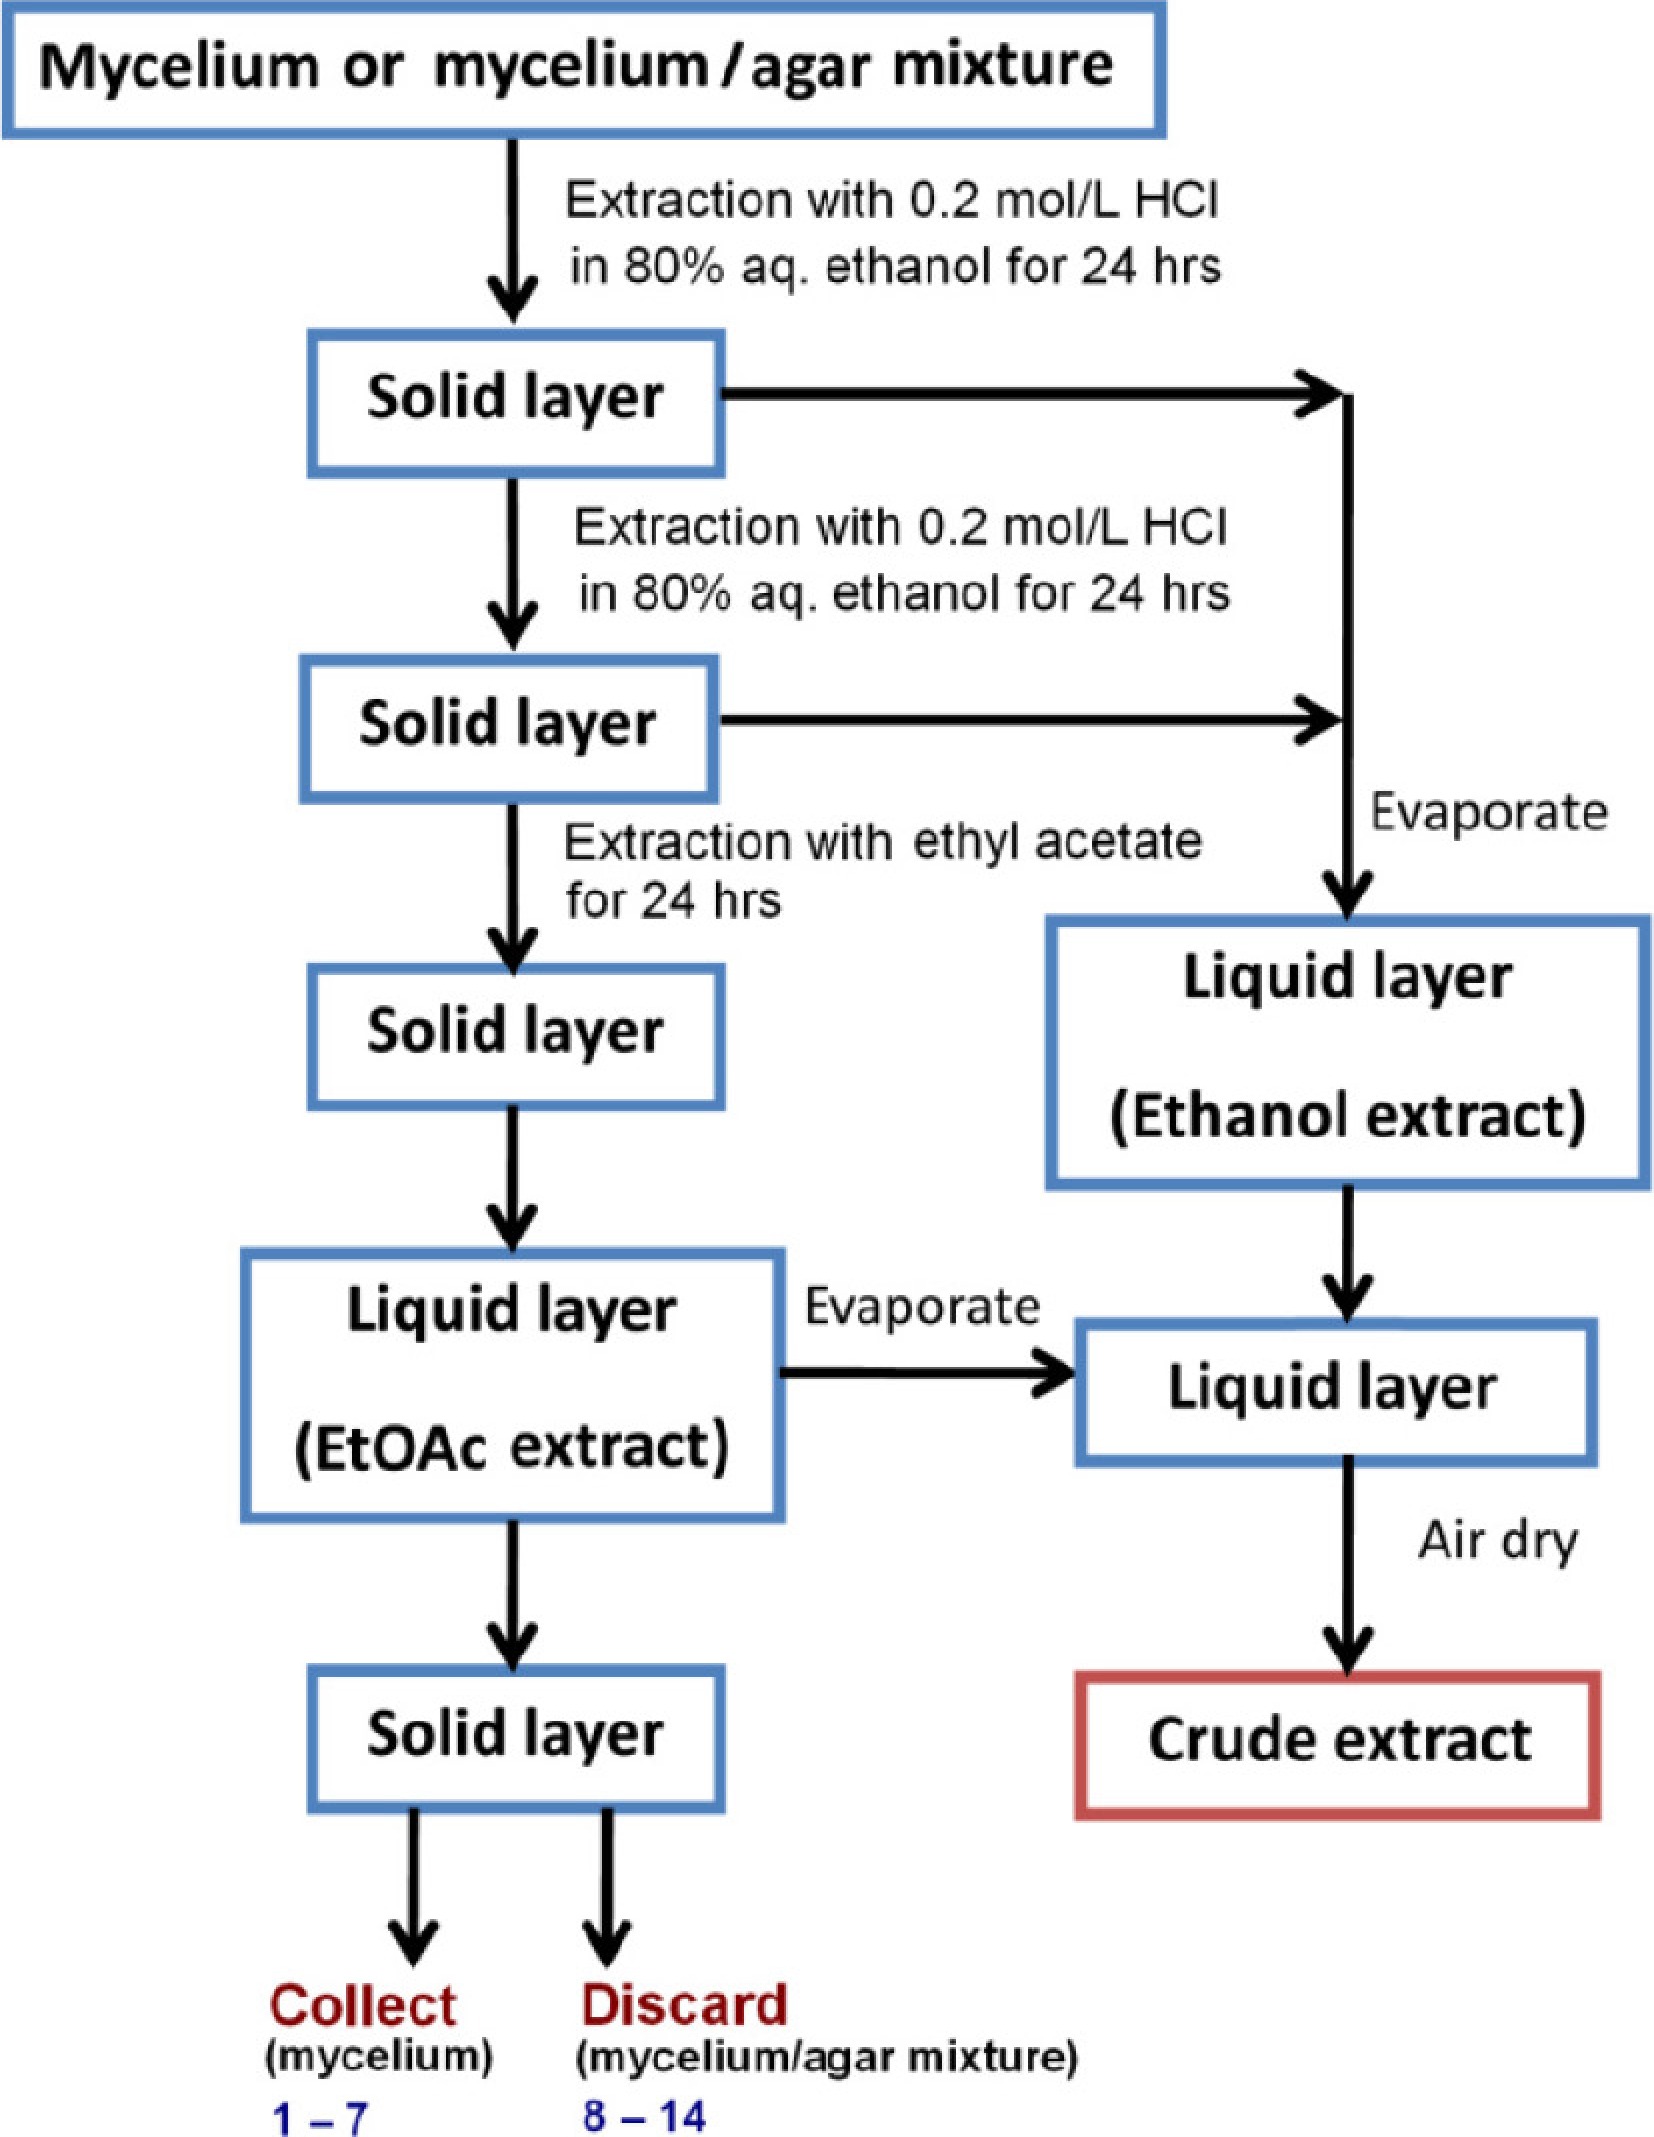
Figure 1.
Preparation of crude extracts.
-
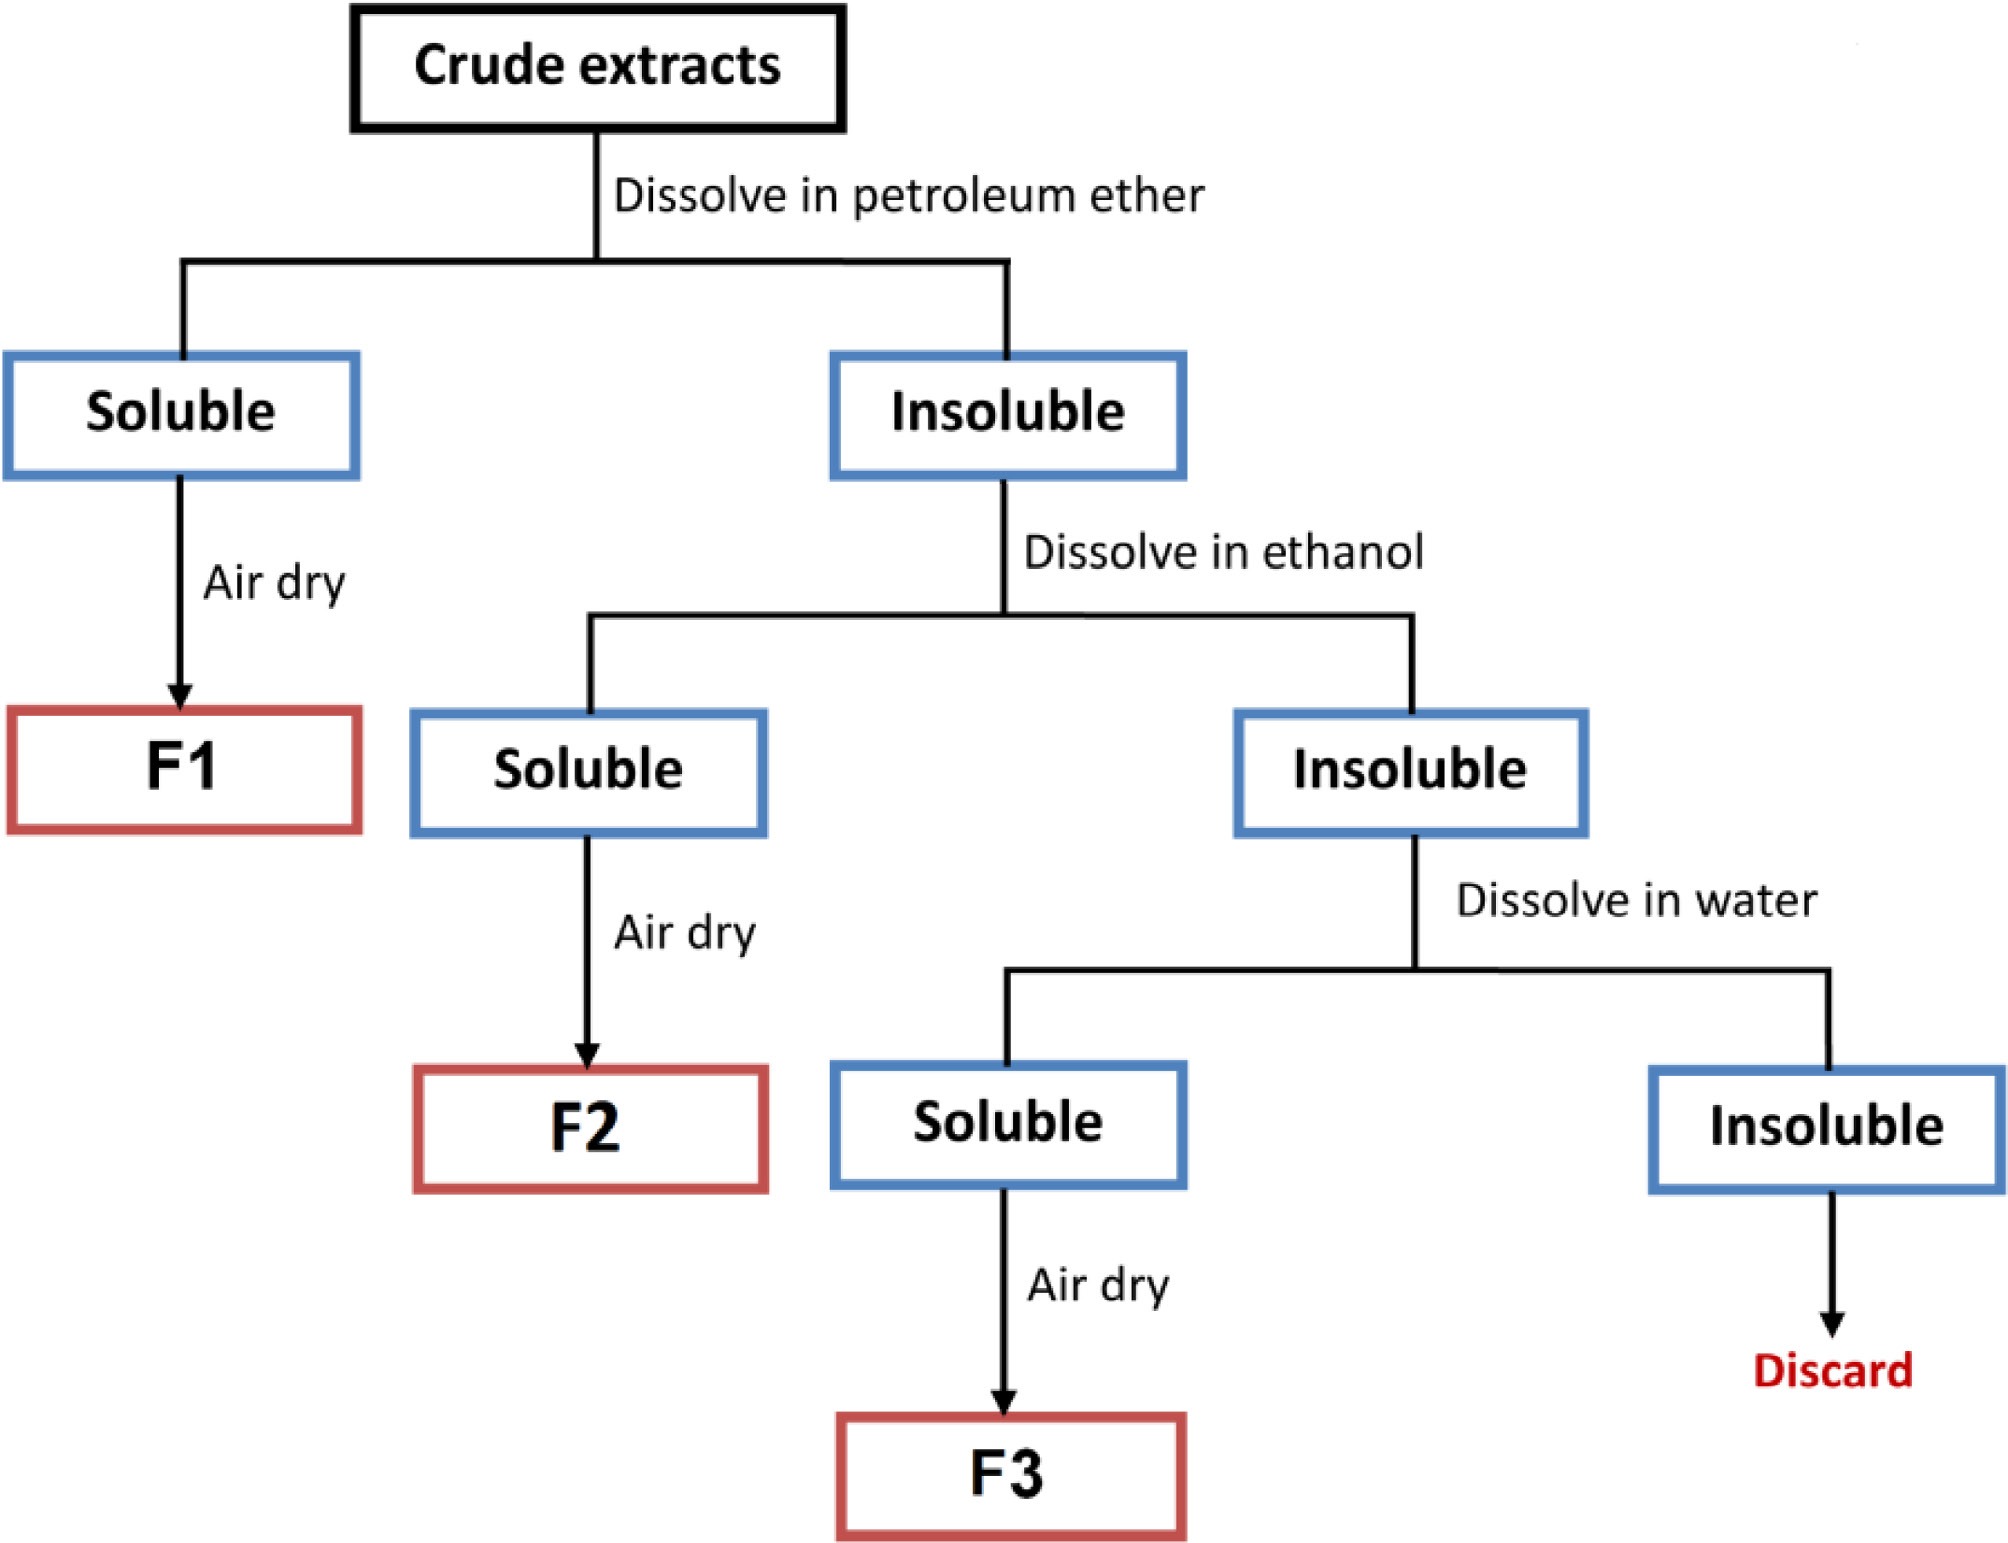
Figure 2.
Fractionation of dried crude extracts.
-
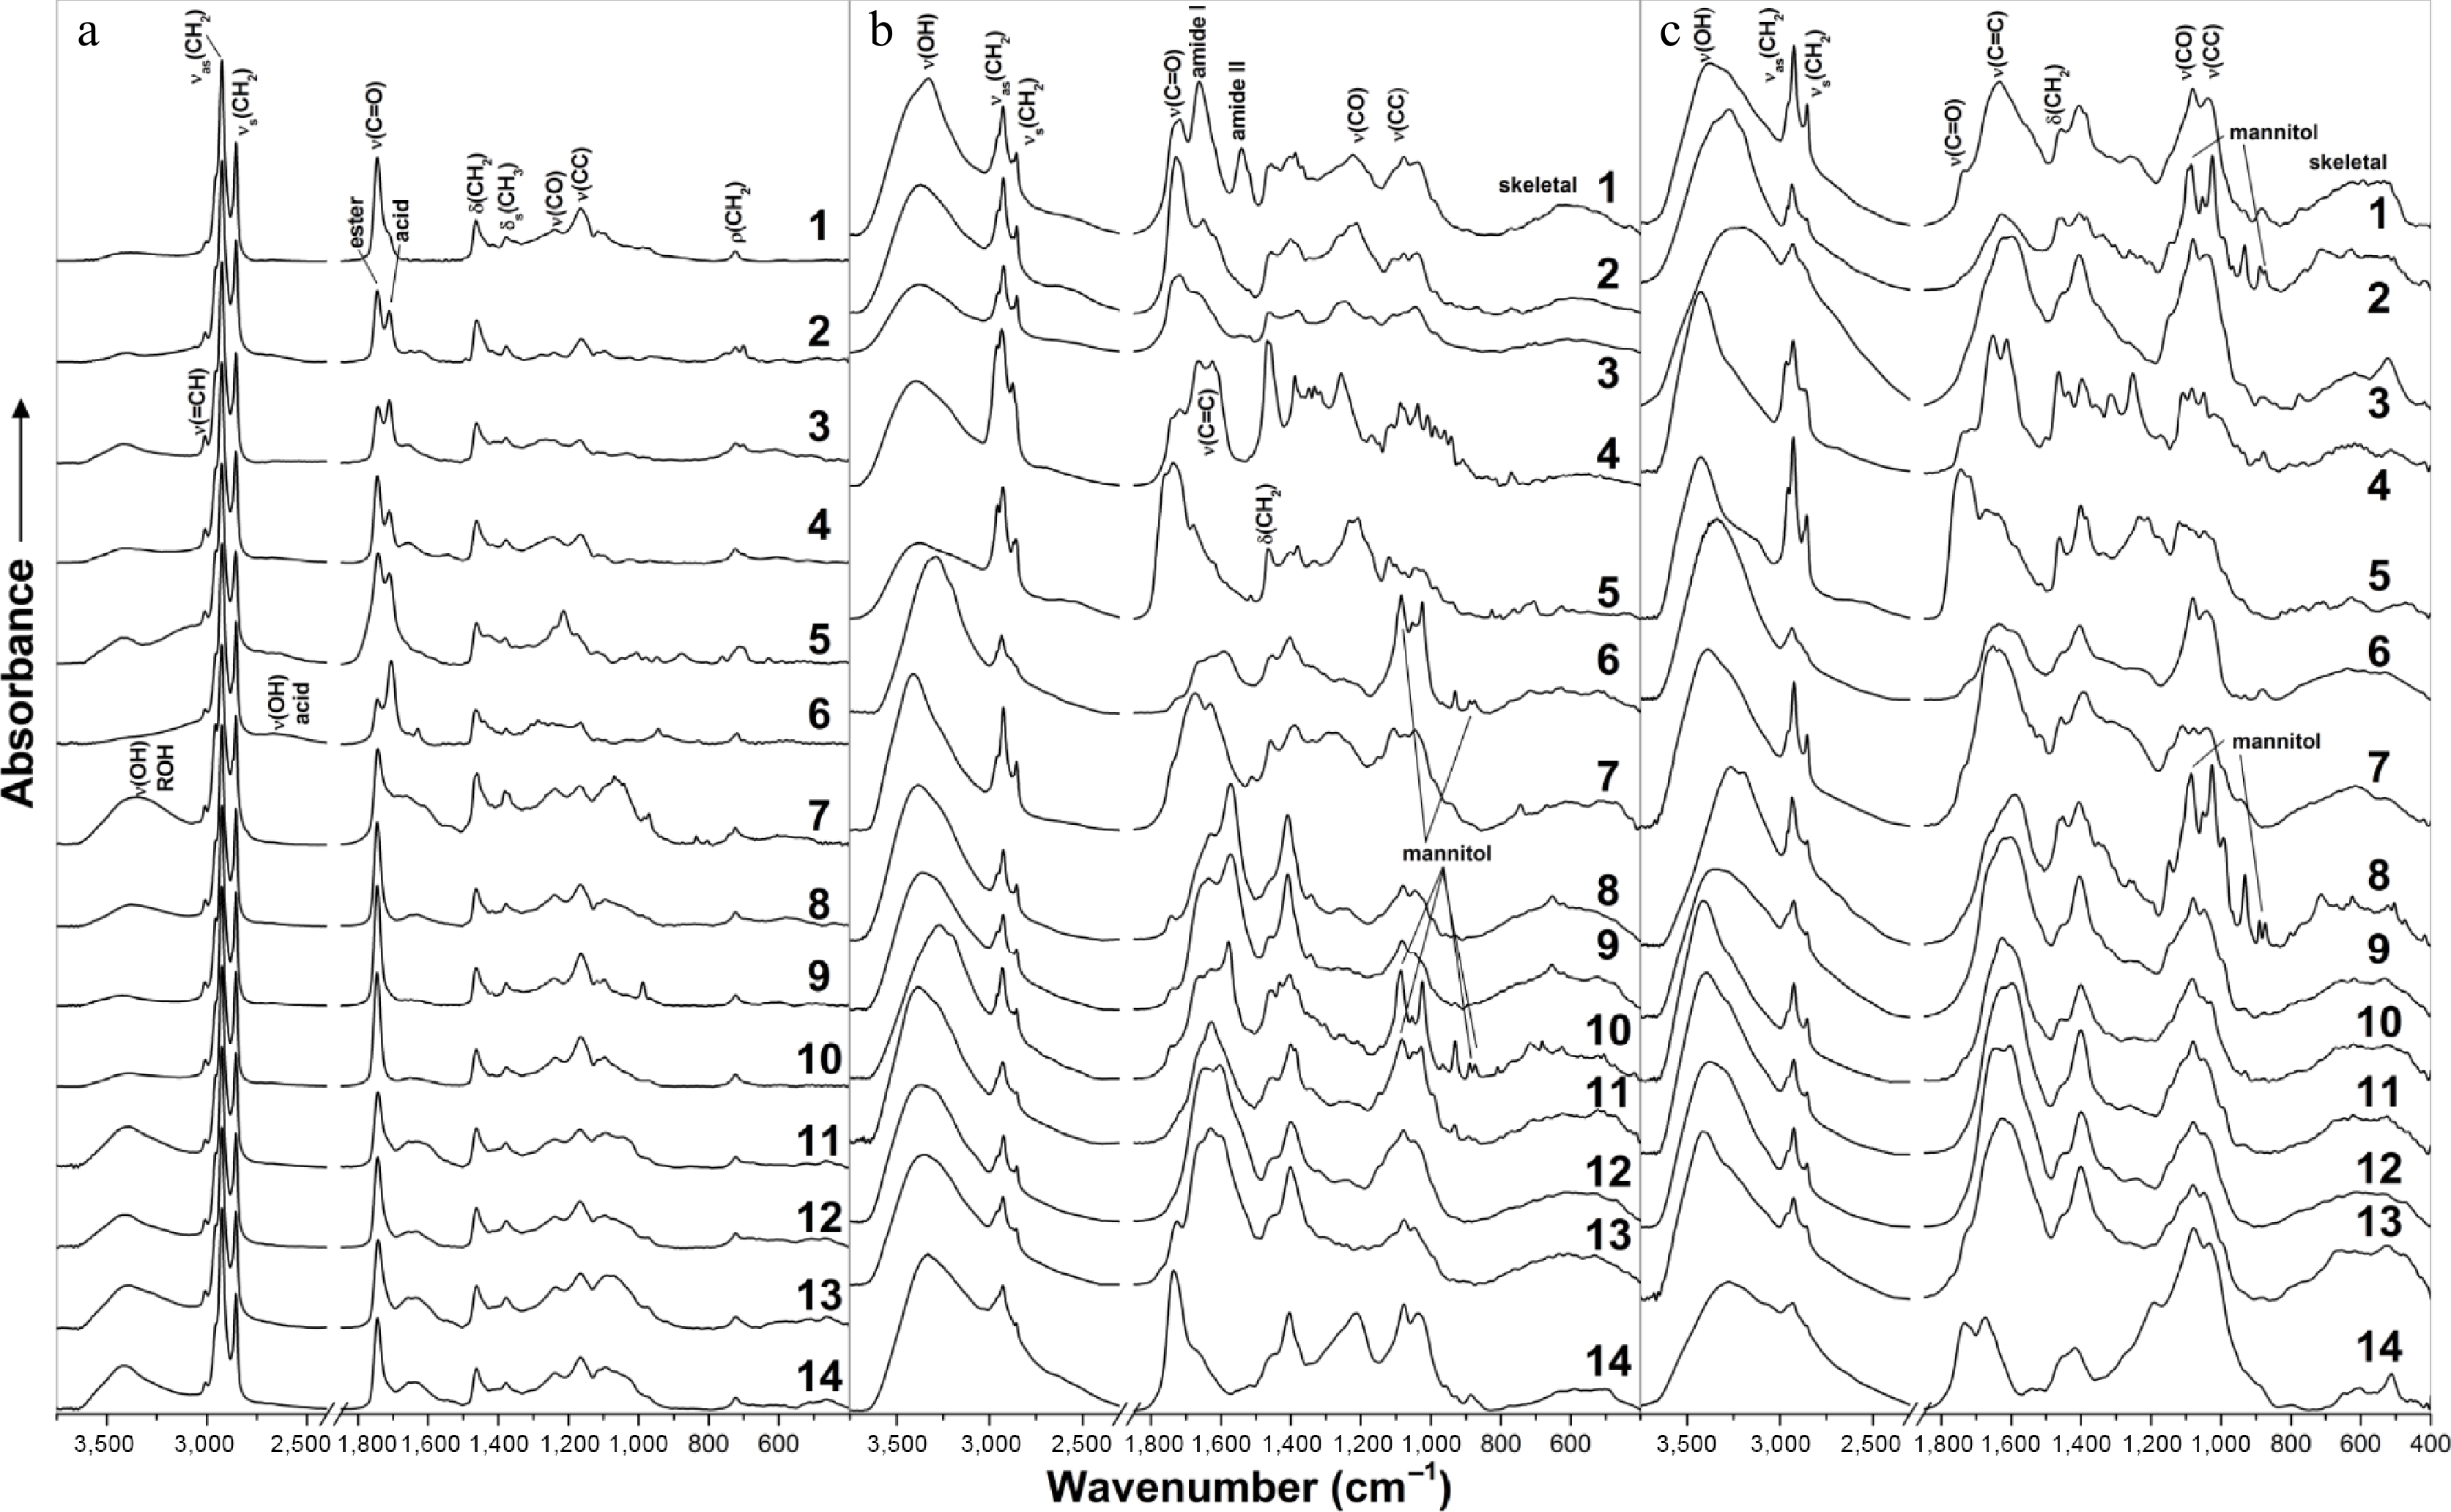
Figure 3.
FTIR spectra of fractions (a) F1, (b) F2, and (c) F3 originated from fungi no. 1 to 14.
-
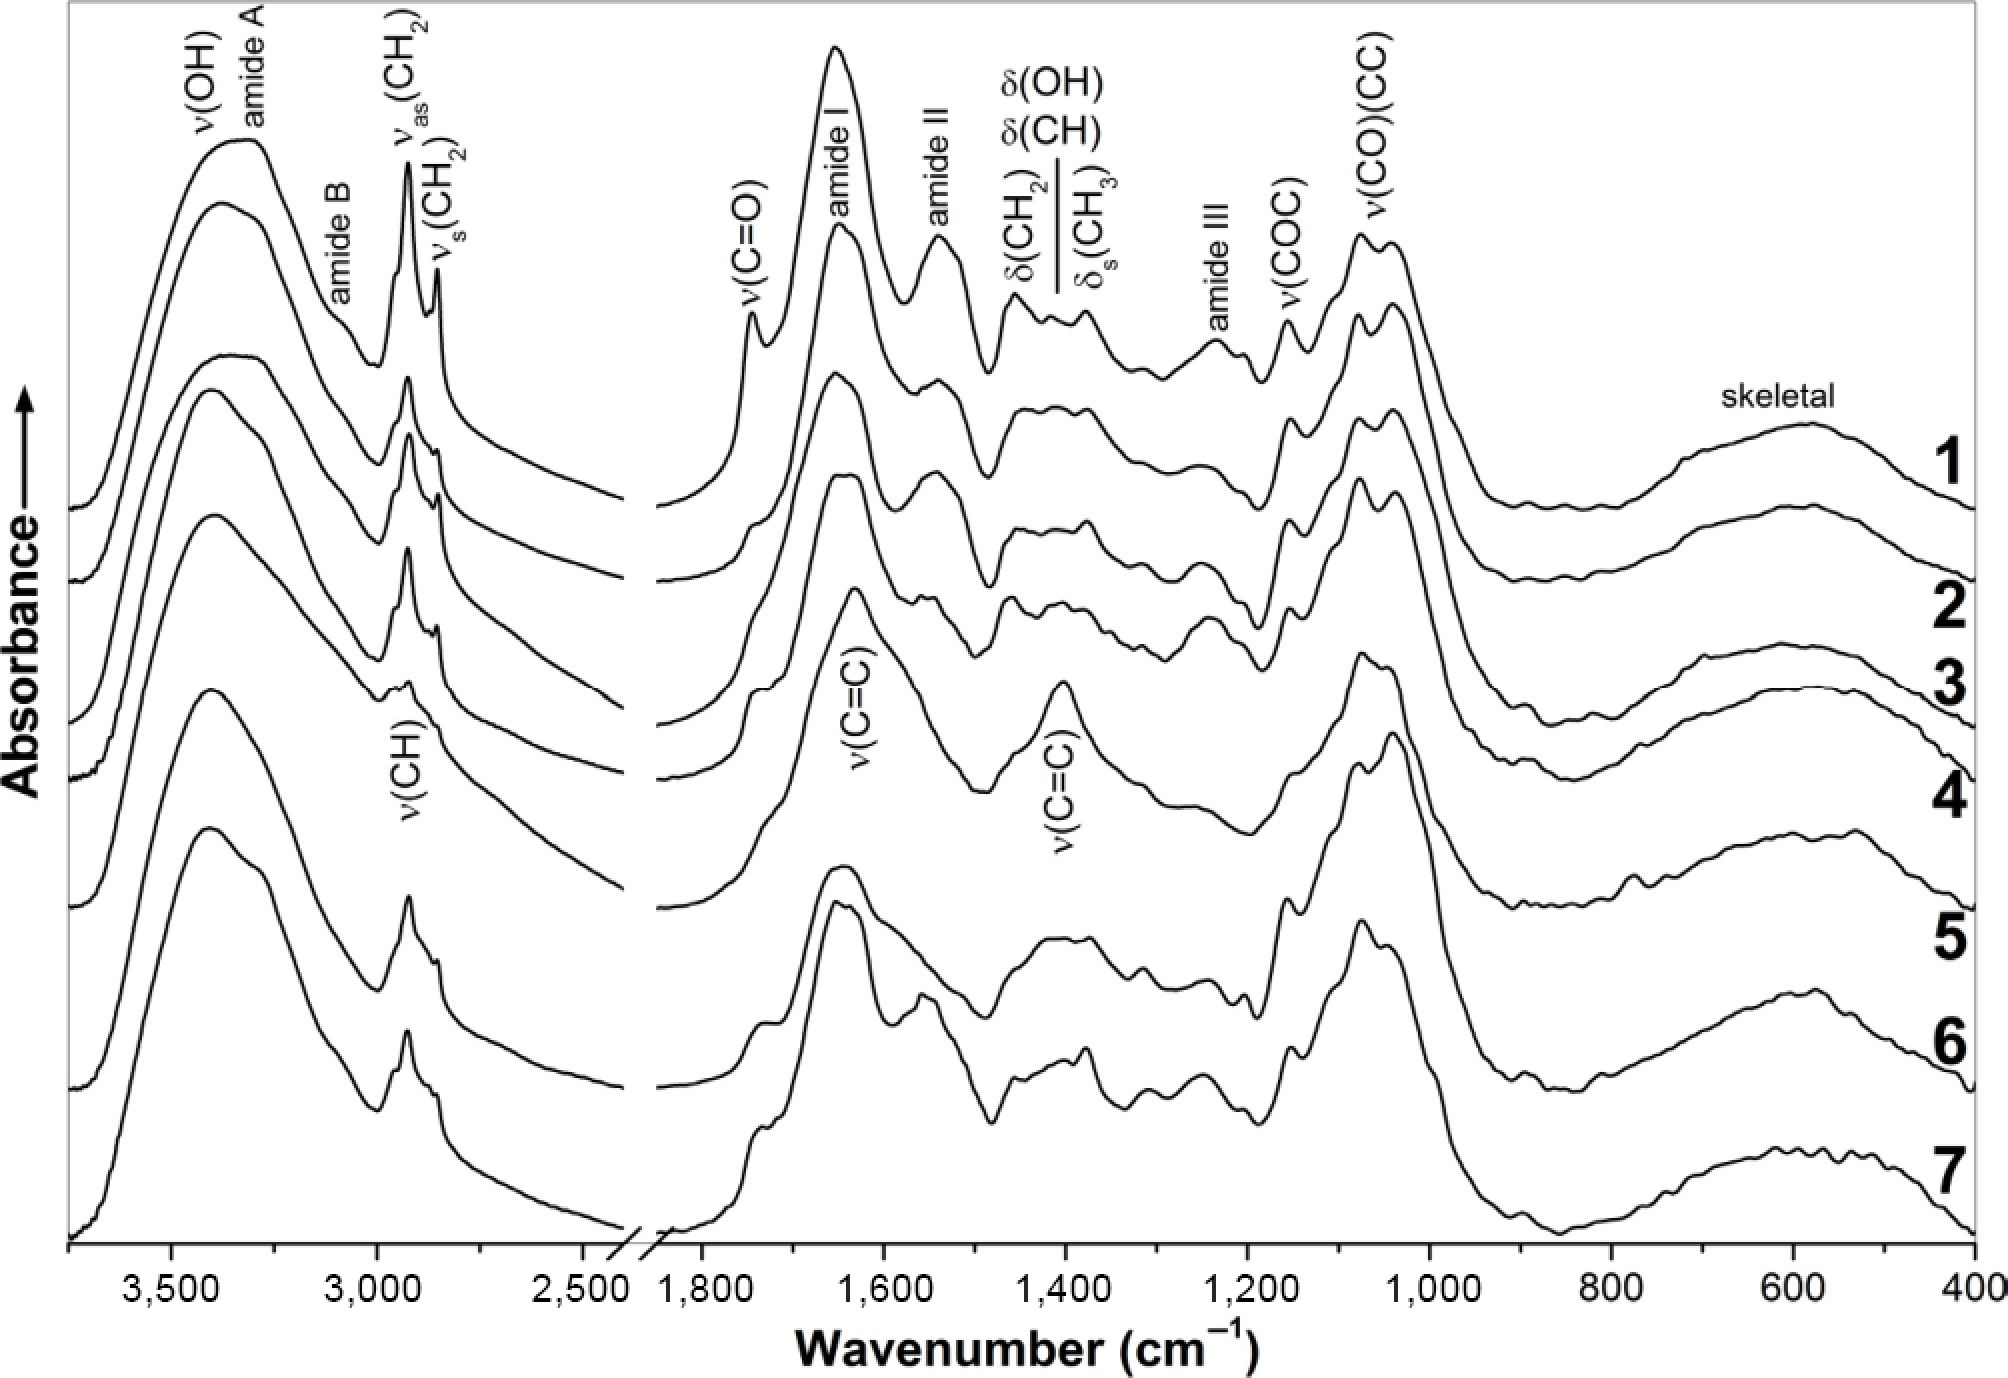
Figure 4.
FTIR spectra of mycelia from fungi no. 1–7 after extractions.
-
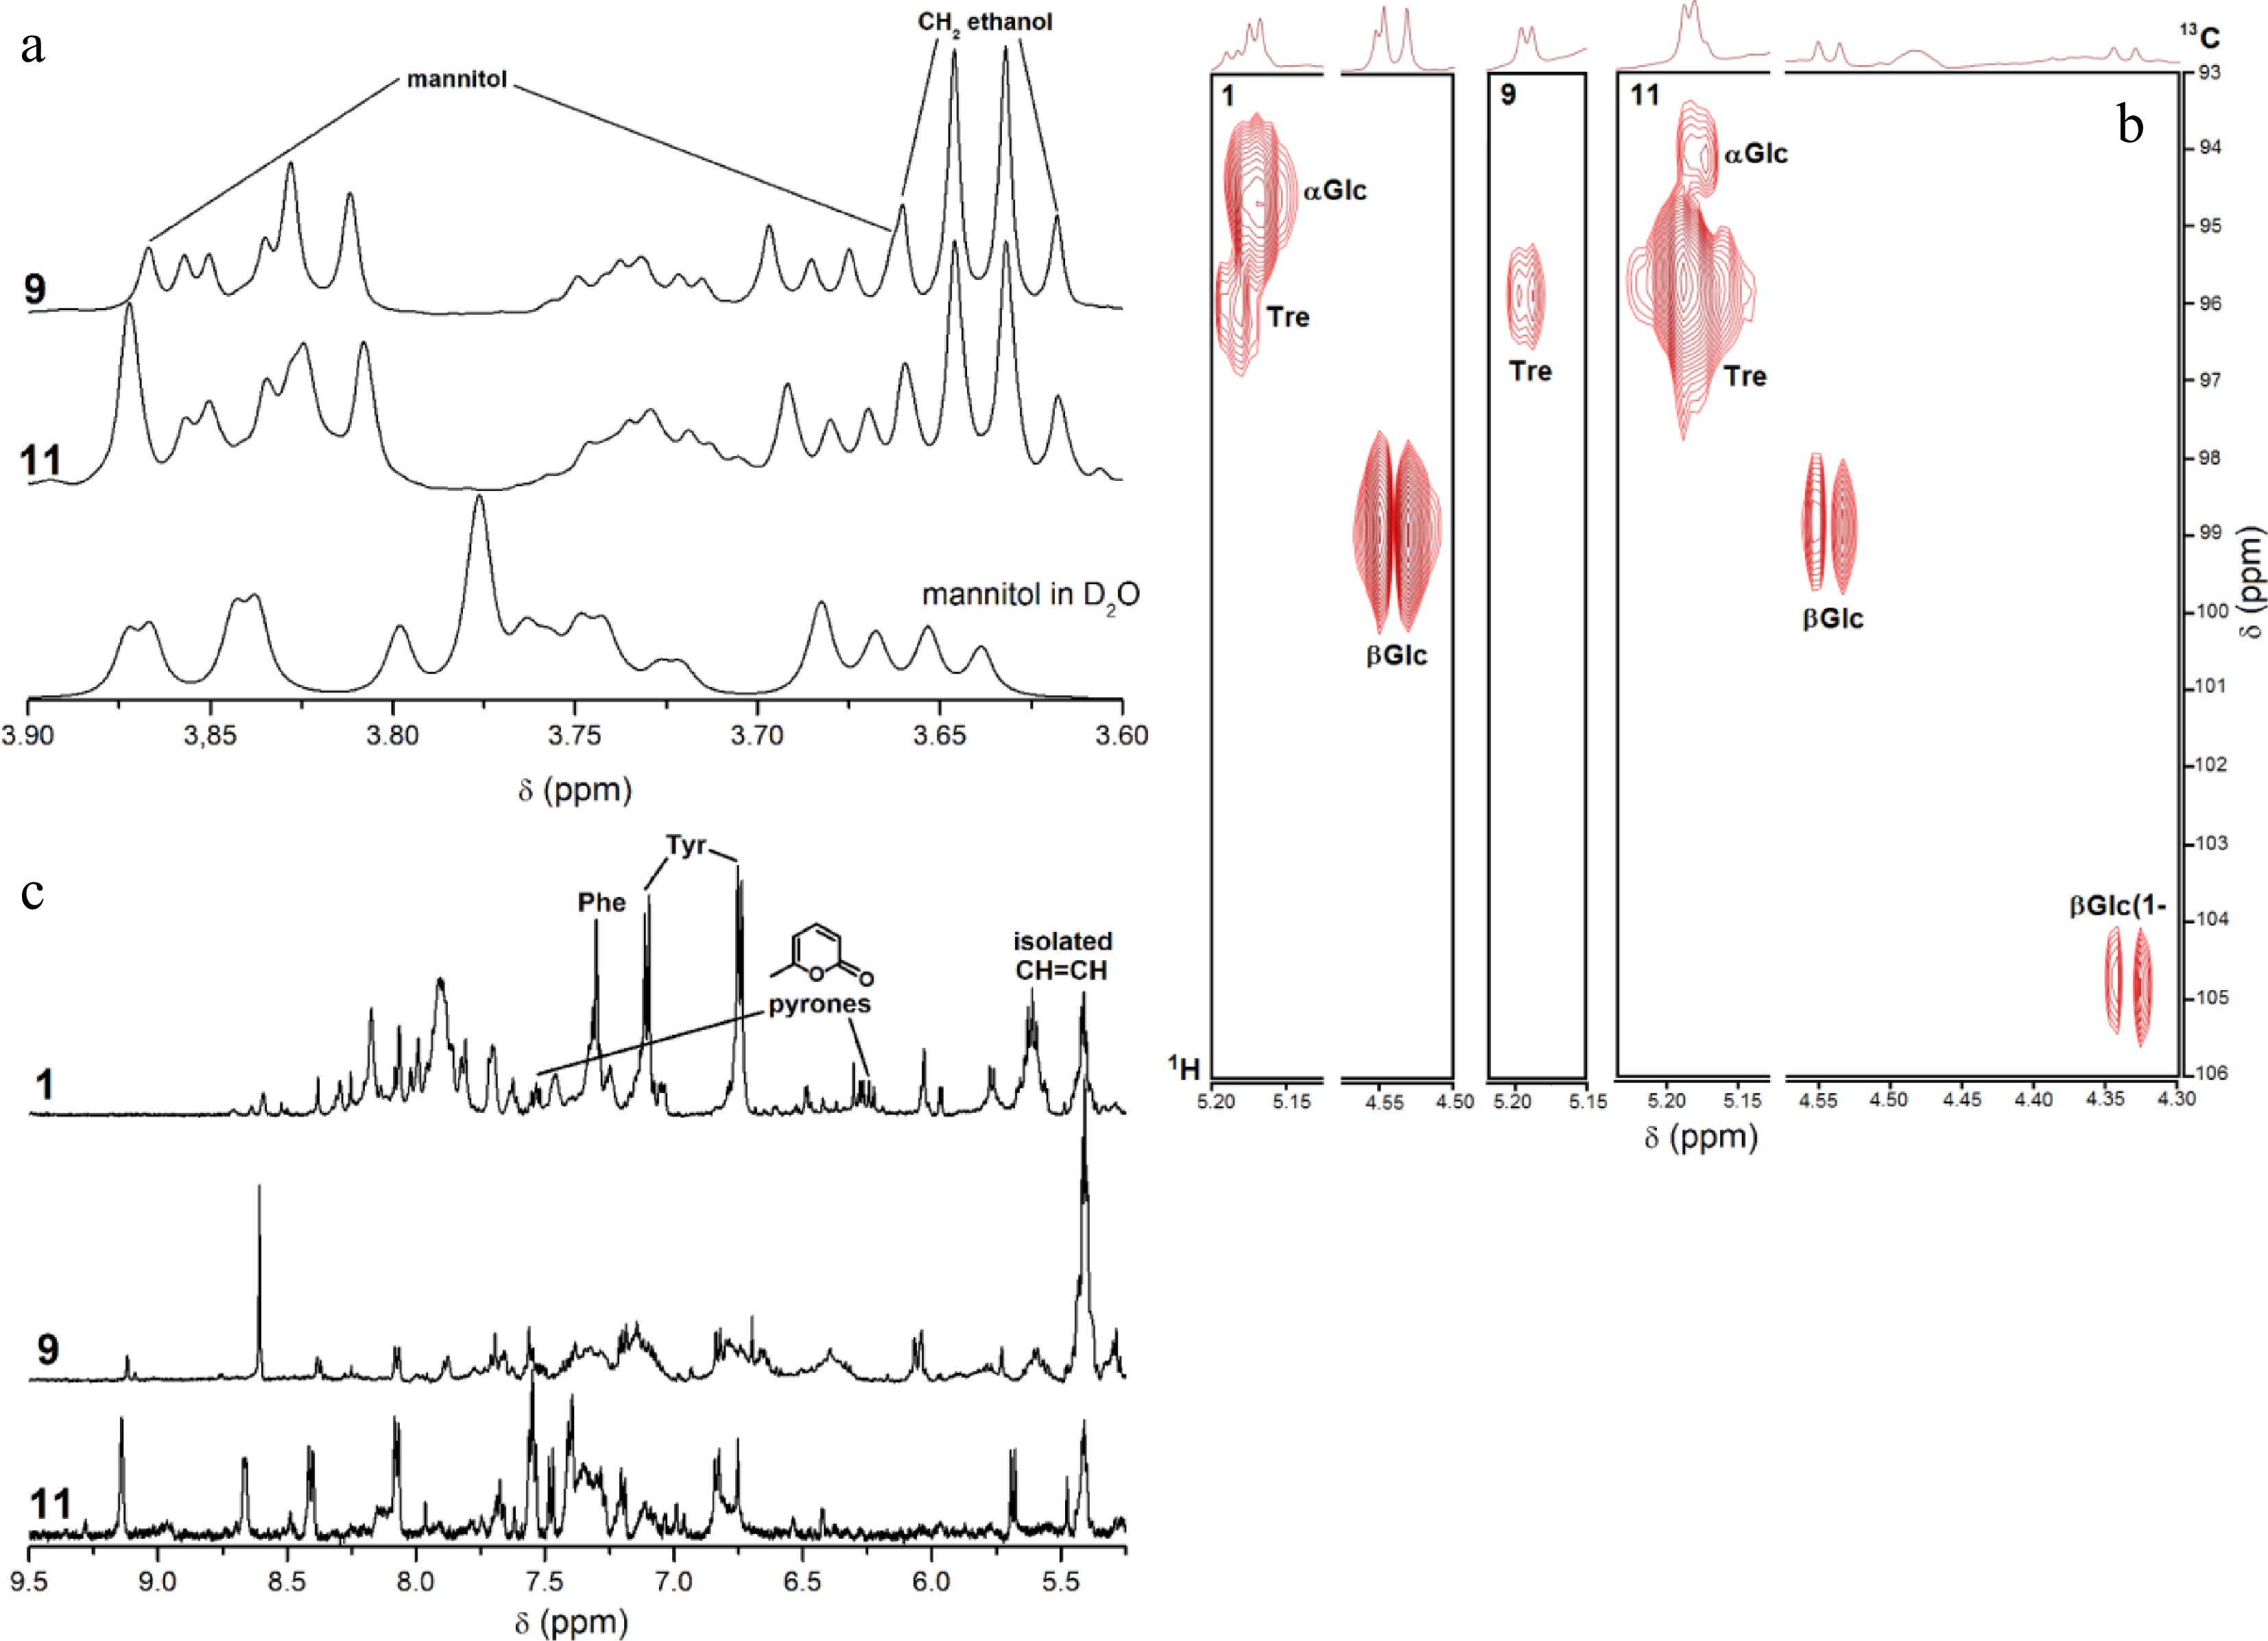
Figure 5.
1H NMR and 1H, 13C HMQC spectra (600 MHz, CD3OD) of fractions F2 from the selected strains: the regions of (a) OCH, OCH2 protons in comparison with pure mannitol measured in D2O, (b) anomeric protons/carbons and aromatic protons. (c) Key signals of NMR spectra in the F2 fractions from Trichoderma sp. DBM4197 (no. 1) were annotated: aromatic protons (δ 7.15–7.35 ppm, Tyr/Phe), pyrone ring protons (δ 6.21 and 6.45 ppm, 6-substituted pyrones), olefinic protons (δ 5.80–6.00 ppm).
-
No. Fungal species Strains Sources 1 Trichoderma sp. DBM4197 UCT Prague, Czech Republic 2 Aspergillus oryzae DBM4336 UCT Prague, Czech Republic 3 Botrytis cinerea DBM4208 UCT Prague, Czech Republic 4 Stachybotrys chartarum DBM4297 UCT Prague, Czech Republic 5 Fusicoccum aesculi MFLU10-0260 MFLU Chiang Mai, Thailand 6 Fusicoccum aesculi MFLU10-0266 MFLU Chiang Mai, Thailand 7 Chaetomium sp. MFLU10-0761 MFLU Chiang Mai, Thailand 8 Ascomycete sp. 1 MFLU10-0282 MFLU Chiang Mai, Thailand 9 Clonostachys rosea MFLU10-0261 MFLU Chiang Mai, Thailand 10 Beltrania rhombica MFLU10-0293 MFLU Chiang Mai, Thailand 11 Stachybotrys parvispora MFLU10-0292 MFLU Chiang Mai, Thailand 12 Hyphomycetes sp. 1 MFLU10-0750 MFLU Chiang Mai, Thailand 13 Hyphomycetes sp. 2 MFLU10-0755 MFLU Chiang Mai, Thailand 14 Cladosporium sp. MFLU10-0280 MFLU Chiang Mai, Thailand Table 1.
Specification of the saprobic fungal strains.
-
No Fraction Ratioa Antimicrobial activityb Gram-positive Gram-negative BC EF ML SA SE EC PA SC 1 F1 0.21 5.8 ± 1.48 − 3.6 ± 1.14 − 1.2 ± 0.45 − − − F2 0.33 5.4 ± 1.14 − 12.6 ± 1.95 − 1.6 ± 0.55 7.6 ± 1.95 5.6 ± 1.52 − F3 0.46 − − + − − − − − 2 F1 0.12 21.0 ± 2.65 2.8 ± 0.84 3.6 ± 0.89 13.4 ± 2.14 1.8 ± 0.84 − − − F2 0.44 11.4 ± 1.95 1.2 ± 0.45 1.2 ± 0.45 11.6 ± 1.67 7.6 ± 1.67 1.4 ± 0.55 1.0 ± 0.00 − F3 0.44 − − − − − − − − 3 F1 0.08 − − 2.2 ± 0.45 − − − − − F2 0.14 9.6 ± 1.67 5.6 ± 0.55 4.8 ± 0.45 5.0 ± 0.71 6.2 ± 1.10 5.4 ± 1.52 5.0 ± 0.00 − F3 0.78 − − − − − − − − 4 F1 0.18 − 3.6 ± 0.89 − 5.4 ± 0.89 − − − − F2 0.80 6.2 ± 1.10 5.4 ± 1.52 2.8 ± 0.45 6.4 ± 0.89 2.0 ± 0.00 6.4 ± 1.34 6.2 ± 0.45 − F3 0.02 10.0 ± 0.00 − − − − − − − 5 F1 0.07 − − 1.0 ± 0.00 − 1.0 ± 0.00 − − − F2 0.73 5.6 ± 0.55 − 5.0 ± 0.00 − − 6.0 ± 0.71 9.0 ± 1.00 − F3 0.21 − − − − − − − − 6 F1 0.11 − − − − − − − − F2 0.75 7.0 ± 0.00 − − − − 5.0 ± 0.00 − − F3 0.14 4.6 ± 0.55 − − 2.0 ± 0.00 − − − − 7 F1 0.09 7.6 ± 1.34 − − − − − − − F2 0.66 5.6 ± 0.55 − − − − − − − F3 0.25 − − − − 9.4 ± 0.89 1.0 ± 0.00 1.8 ± 0.45 − 8 F1 0.34 − − − 6.8 ± 1.10 − − − − F2 0.11 − − − − − − − − F3 0.54 − − − − − − − − 9 F1 0.21 5.0 ± 0.00 − − − 2.0 ± 0.00 − − − F2 0.46 10.8 ± 1.10 5.0 ± 0.00 2.0 ± 0.00 4.6 ± 0.55 9.6 ± 0.55 6.0 ± 1.22 − 4.6 ± 0.55 F3 0.32 2.8 ± 0.45 − − 4.4 ± 0.55 5.0 ± 1.00 − − − 10 F1 0.39 − − − − − − − − F2 0.24 7.0 ± 1.22 − − 5.8 ± 0.45 5.0 ± 0.00 − − − F3 0.37 − − − − − − − − 11 F1 0.24 − 5.0 ± 0.00 1.0 ± 0.00 6.0 ± 0.71 2.0 ± 0.00 − − − F2 0.50 12.2 ± 1.79 3.0 ± 0.00 4.8 ± 0.84 5.0 ± 0.00 6.2 ± 0.45 − 3.0 ± 0.00 − F3 0.26 − − − − − − − − 12 F1 0.24 − − − − − − − − F2 0.57 − − 5.0 ± 0.00 − − − 1.0 ± 0.00 − F3 0.18 − − 2.8 ± 0.45 3.0 ± 0.00 − − − − 13 F1 0.19 − − − − − − − − F2 0.53 5.8 ± 0.45 − 2.0 ± 0.00 5.2 ± 0.45 − − − − F3 0.29 − − − 5.0 ± 0.00 − − − − 14 F1 0.11 − 5.0 ± 0.71 − − − − − − F2 0.41 7.4 ± 0.89 5.0 ± 0.00 2.0 ± 0.00 5.4 ± 0.55 5.0 ± 0.00 − 2.0 ± 0.00 − F3 0.48 − − − − − − − − a Ratio of the mass of this fraction to the total mass of all isolated factions; + = presence of clear zone, − = absence of clear zone. b BC = B. cereus, EF = E. faecalis; ML = M. luteus; SA = S. aureus, SE = S. epidermidis, EC = E. cloacae, PA = P. aeruginosa, SC = S. cerevisiae. Table 2.
Antimicrobial activities of the fractions of crude fungal extracts against selected microorganisms.
Figures
(5)
Tables
(2)