-
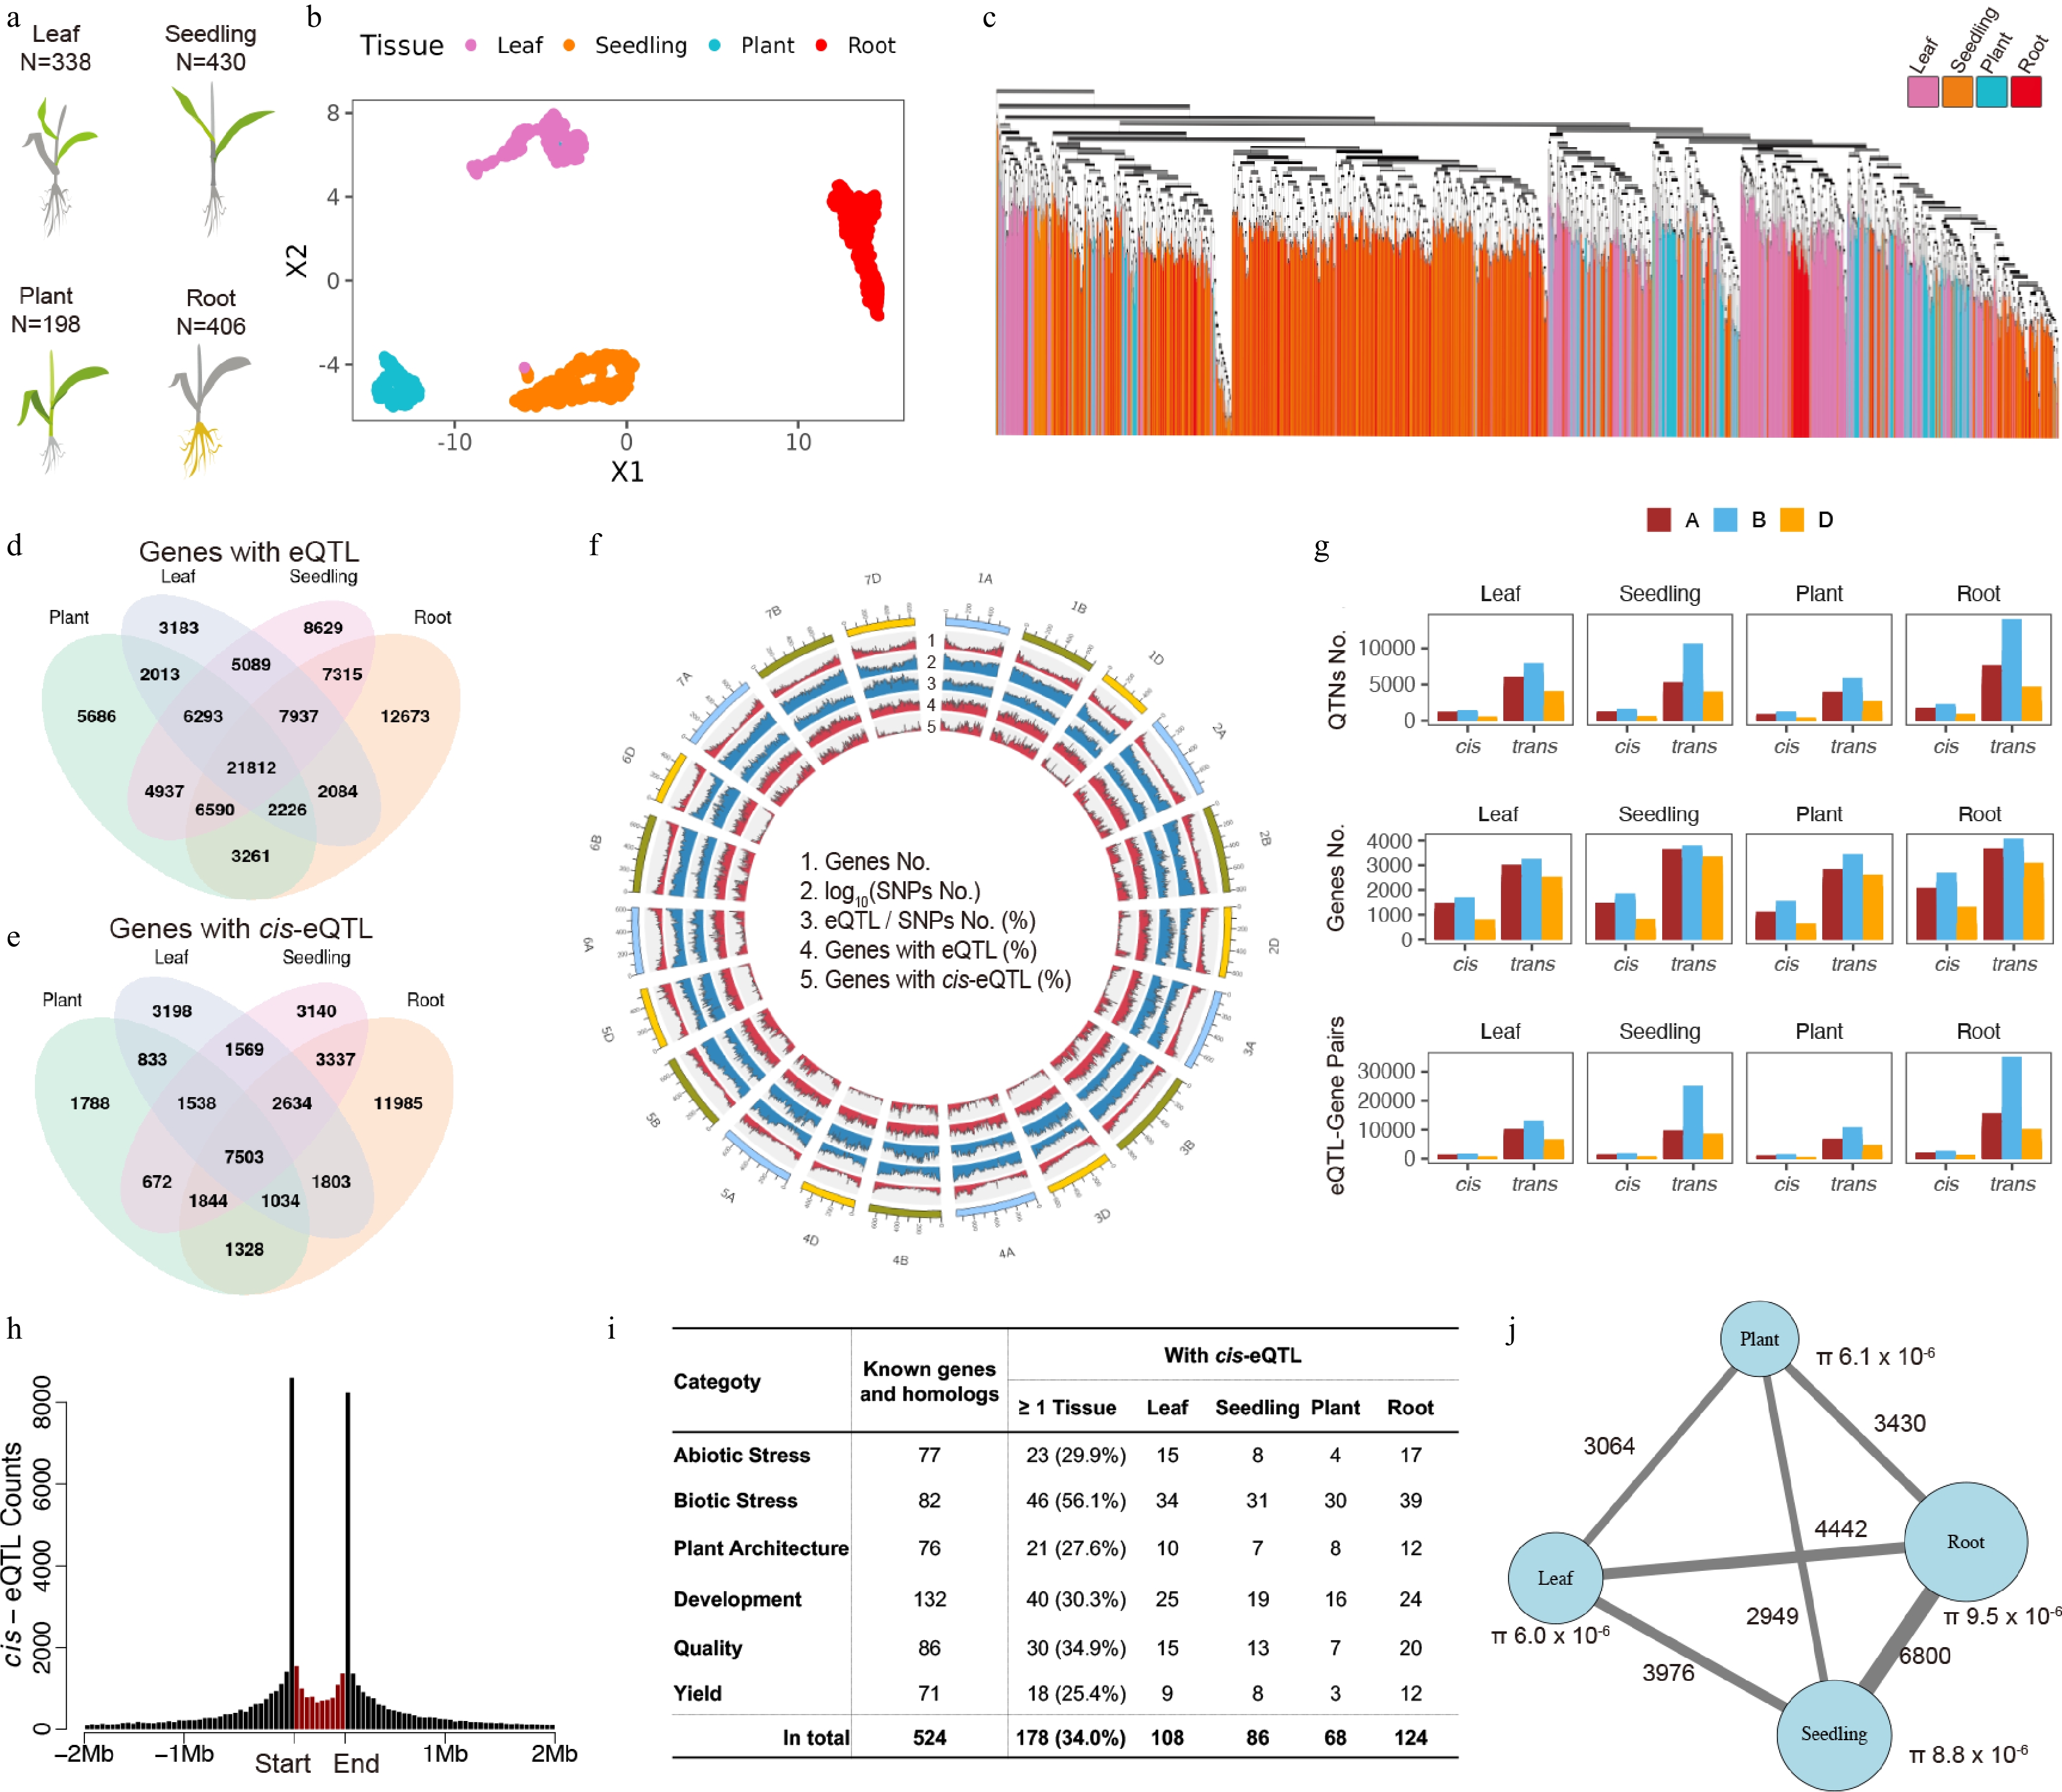
Figure 1.
Atlas of expression quantitative trait loci (eQTL) across diverse tissues and genetic backgrounds in wheat (a) Schematic of the four profiled tissue sources. Sampled tissues are highlighted in color, whereas the other plant parts are shown in grey. (b) Uniform manifold approximation and projection (UMAP) of 1,373 RNA-seq samples from the four panels, colored by tissue source. (c) Unrooted phylogenetic tree of the four diversity panels, colored by tissue. (d) Number of genes with cis- and/or trans-eQTL identified in each panel. (e) Number of unique genes with cis-eQTL in each panel. (f) Union summary of genomic features across all panels (from outer to inner rings): Total number of genes, number of single nucleotide polymorphisms (SNPs) (log10 transformed), ratio of eQTL to SNPs, number of genes with eQTL, and number of genes with cis-eQTL. (g) Distribution of cis-eQTL counts across the A, B, and D sub-genomes of hexaploid wheat (AABBDD). (h) Genomic distribution of cis-eQTL relative to gene positions. Black bins represent 100-kb intervals; the red bin represents a 3-kb genic region of regulated gene itself. (i) Summary of cis-eQTL for functionally characterized genes and their homologs, categorized by trait. (j) Number of shared trans-eQTL-gene associations between panel pairs. The color scale and dot size indicate the count of shared associations.
-
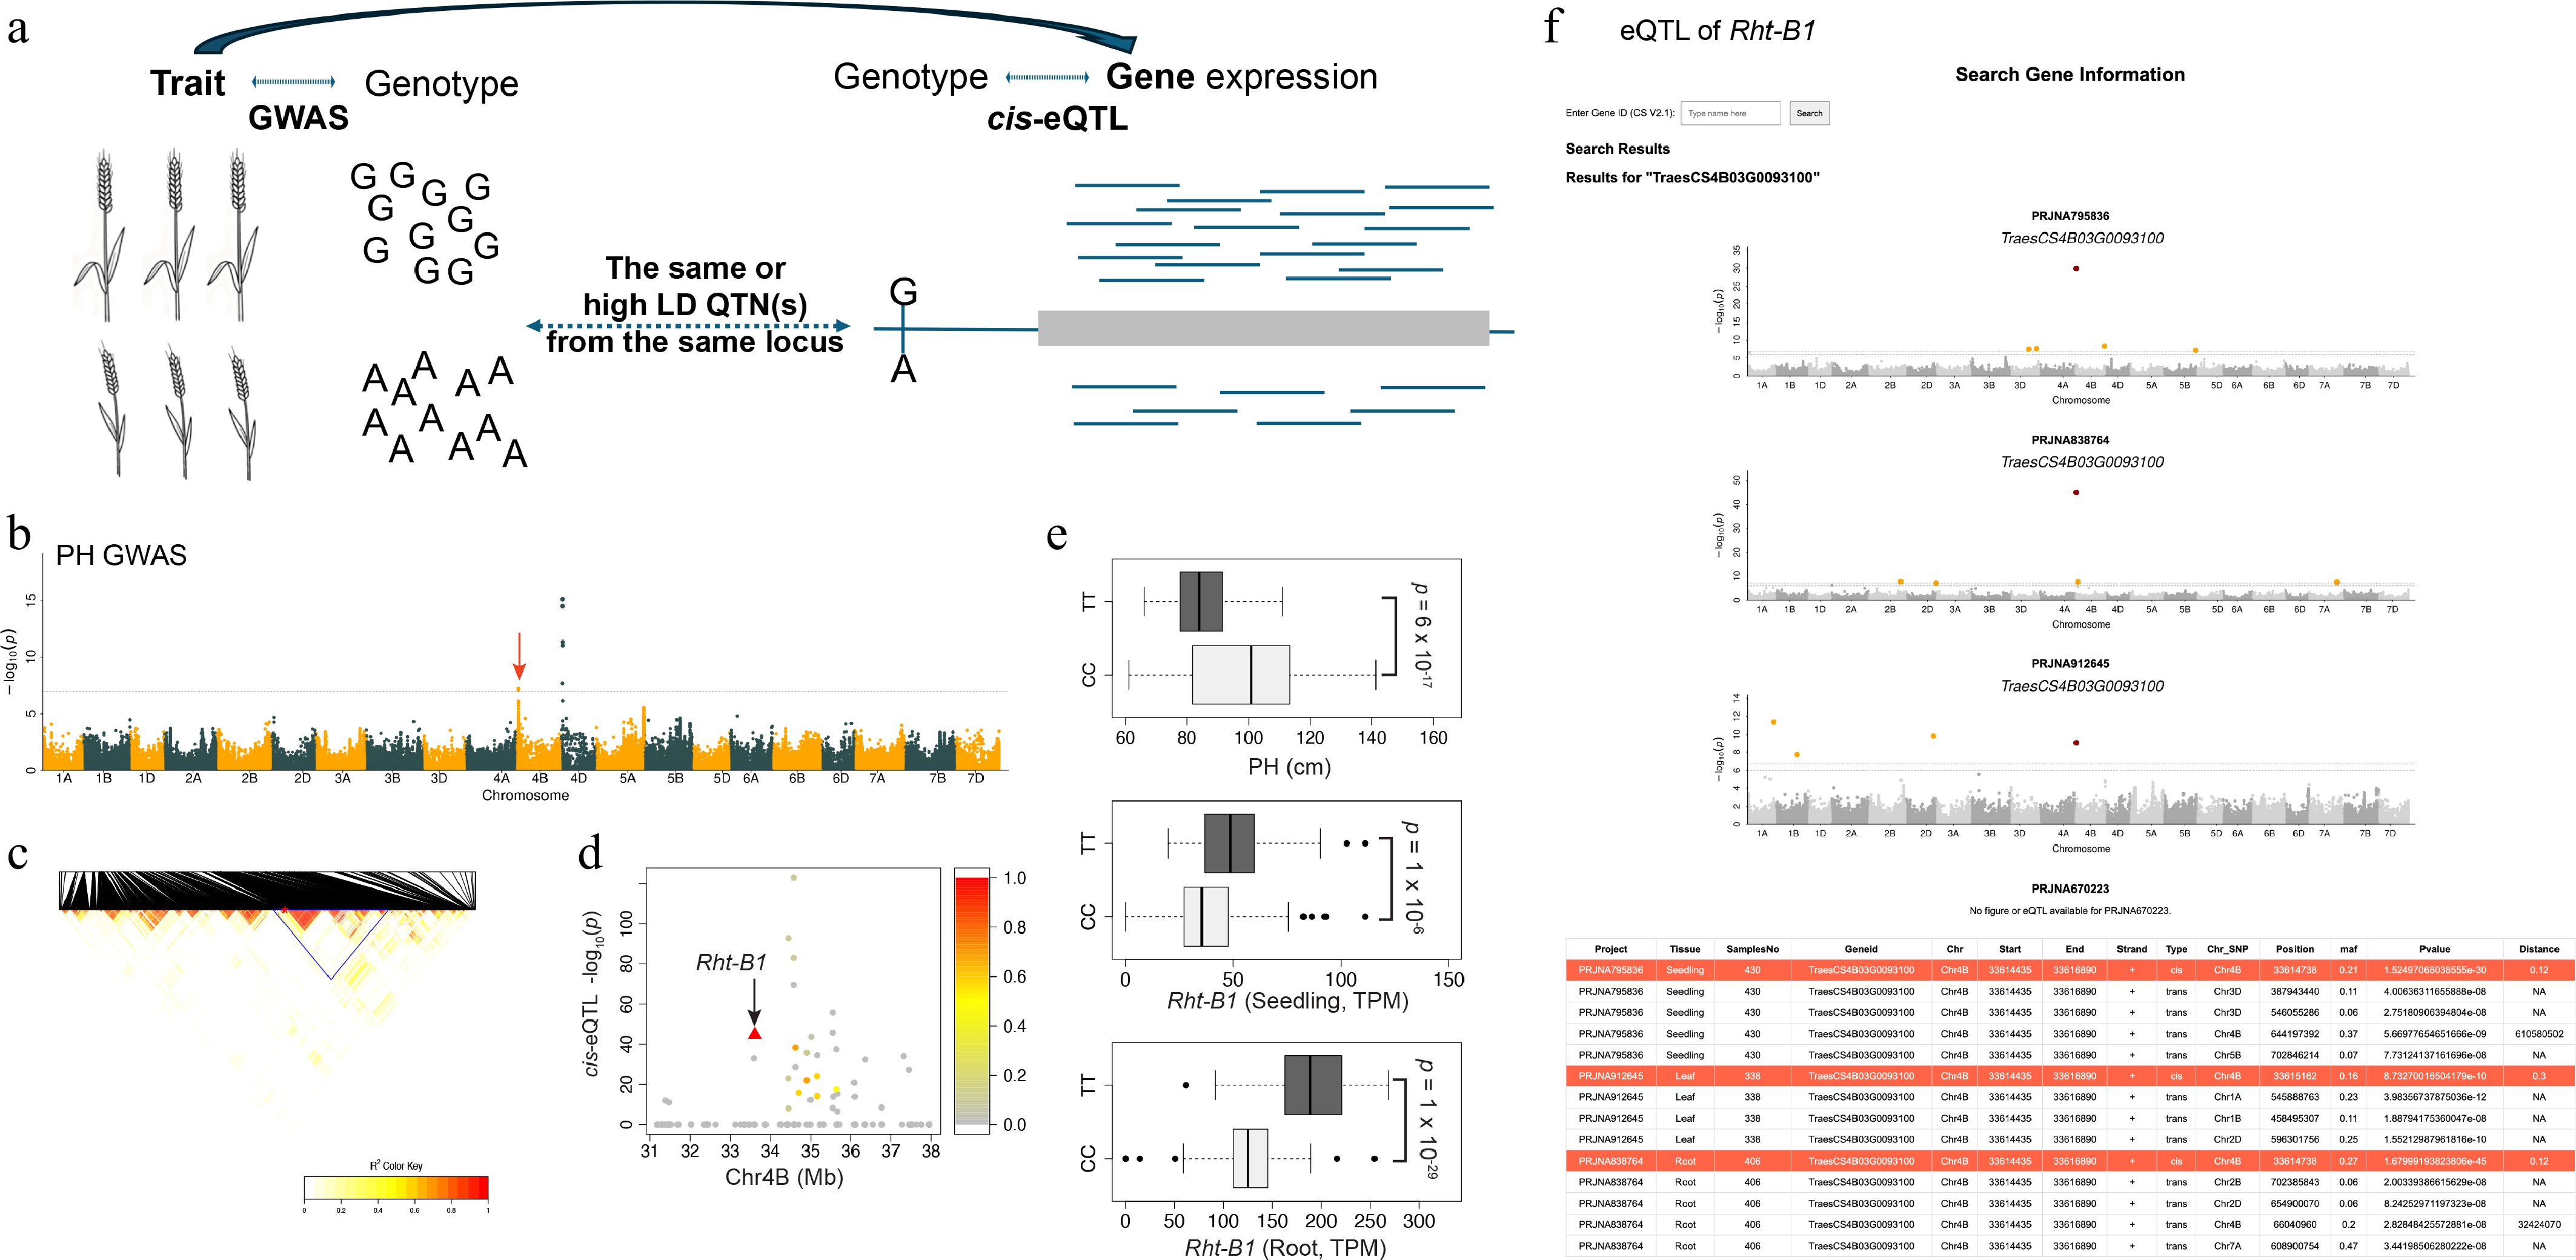
Figure 2.
Re-identification of the known Rht-B1 gene through co-localization of cis-eQTL and plant height GWAS. (a) Schematic illustrating the co-localization strategy, which integrates independent eQTL results and GWAS by identifying shared SNPs or SNPs in high linkage disequilibrium (LD) to bridge candidate genes with traits. (b) Plant height (PH) GWAS. The significantly associated locus containing Rht-B1 is indicated by a red arrow. (c) Linkage disequilibrium heatmap of SNPs within the genomic region surrounding the GWAS peak. The high-LD block is highlighted by a blue triangle. (d) The cis-eQTL signals for all genes annotated within the high-LD region. Points are colored according to the LD (r2) between each cis-eQTL's lead SNP and the lead GWAS SNP from the PH GWAS. (e) Variation in PH (left) and Rht-B1 expression levels in the seedling and root tissues (middle, right) stratified by genotype at the co-localized SNPs. The p-values were derived from a Student's t-test comparing the two genotypes. (f) Representative output from the user–self-hostable web resource, showing the search results for Rht-B1 (TraesCS4B03G0093100), including its eQTL profile across the four panels, as Manhattan plots and a summary table.
Figures
(2)
Tables
(0)