


-
Dear Editor,
The heritable component of gene expression in plants is dynamically shaped by the complex interplay of tissue type, developmental stage, environment, and genetic background. Mapping expression quantitative trait loci (eQTL), which are genomic loci associated with variation in expression, provides a powerful framework to decipher this regulation. Specifically, cis-eQTL (local to the gene) enable the identification of trait-associated genes that bridge genetic variation to phenotypic variation, whereas trans-eQTL (distant from the gene) reveal the architecture of system-wide gene regulatory networks. To construct a comprehensive map of this regulatory landscape in bread wheat (Triticum aestivum L., genome AABBDD), we integrated RNA-seq data of 1,373 samples from four independent panels, each capturing a distinct tissue and developmental stage at the seedling phase (Fig. 1a, b): The second or third seedling leaf[1], leaves at the three-leaf stage[2], ground tissue of 2-week-old plants[3], and roots at 14 days after germination[4]. These panels are named the leaf, seedling, plant, and root panels.
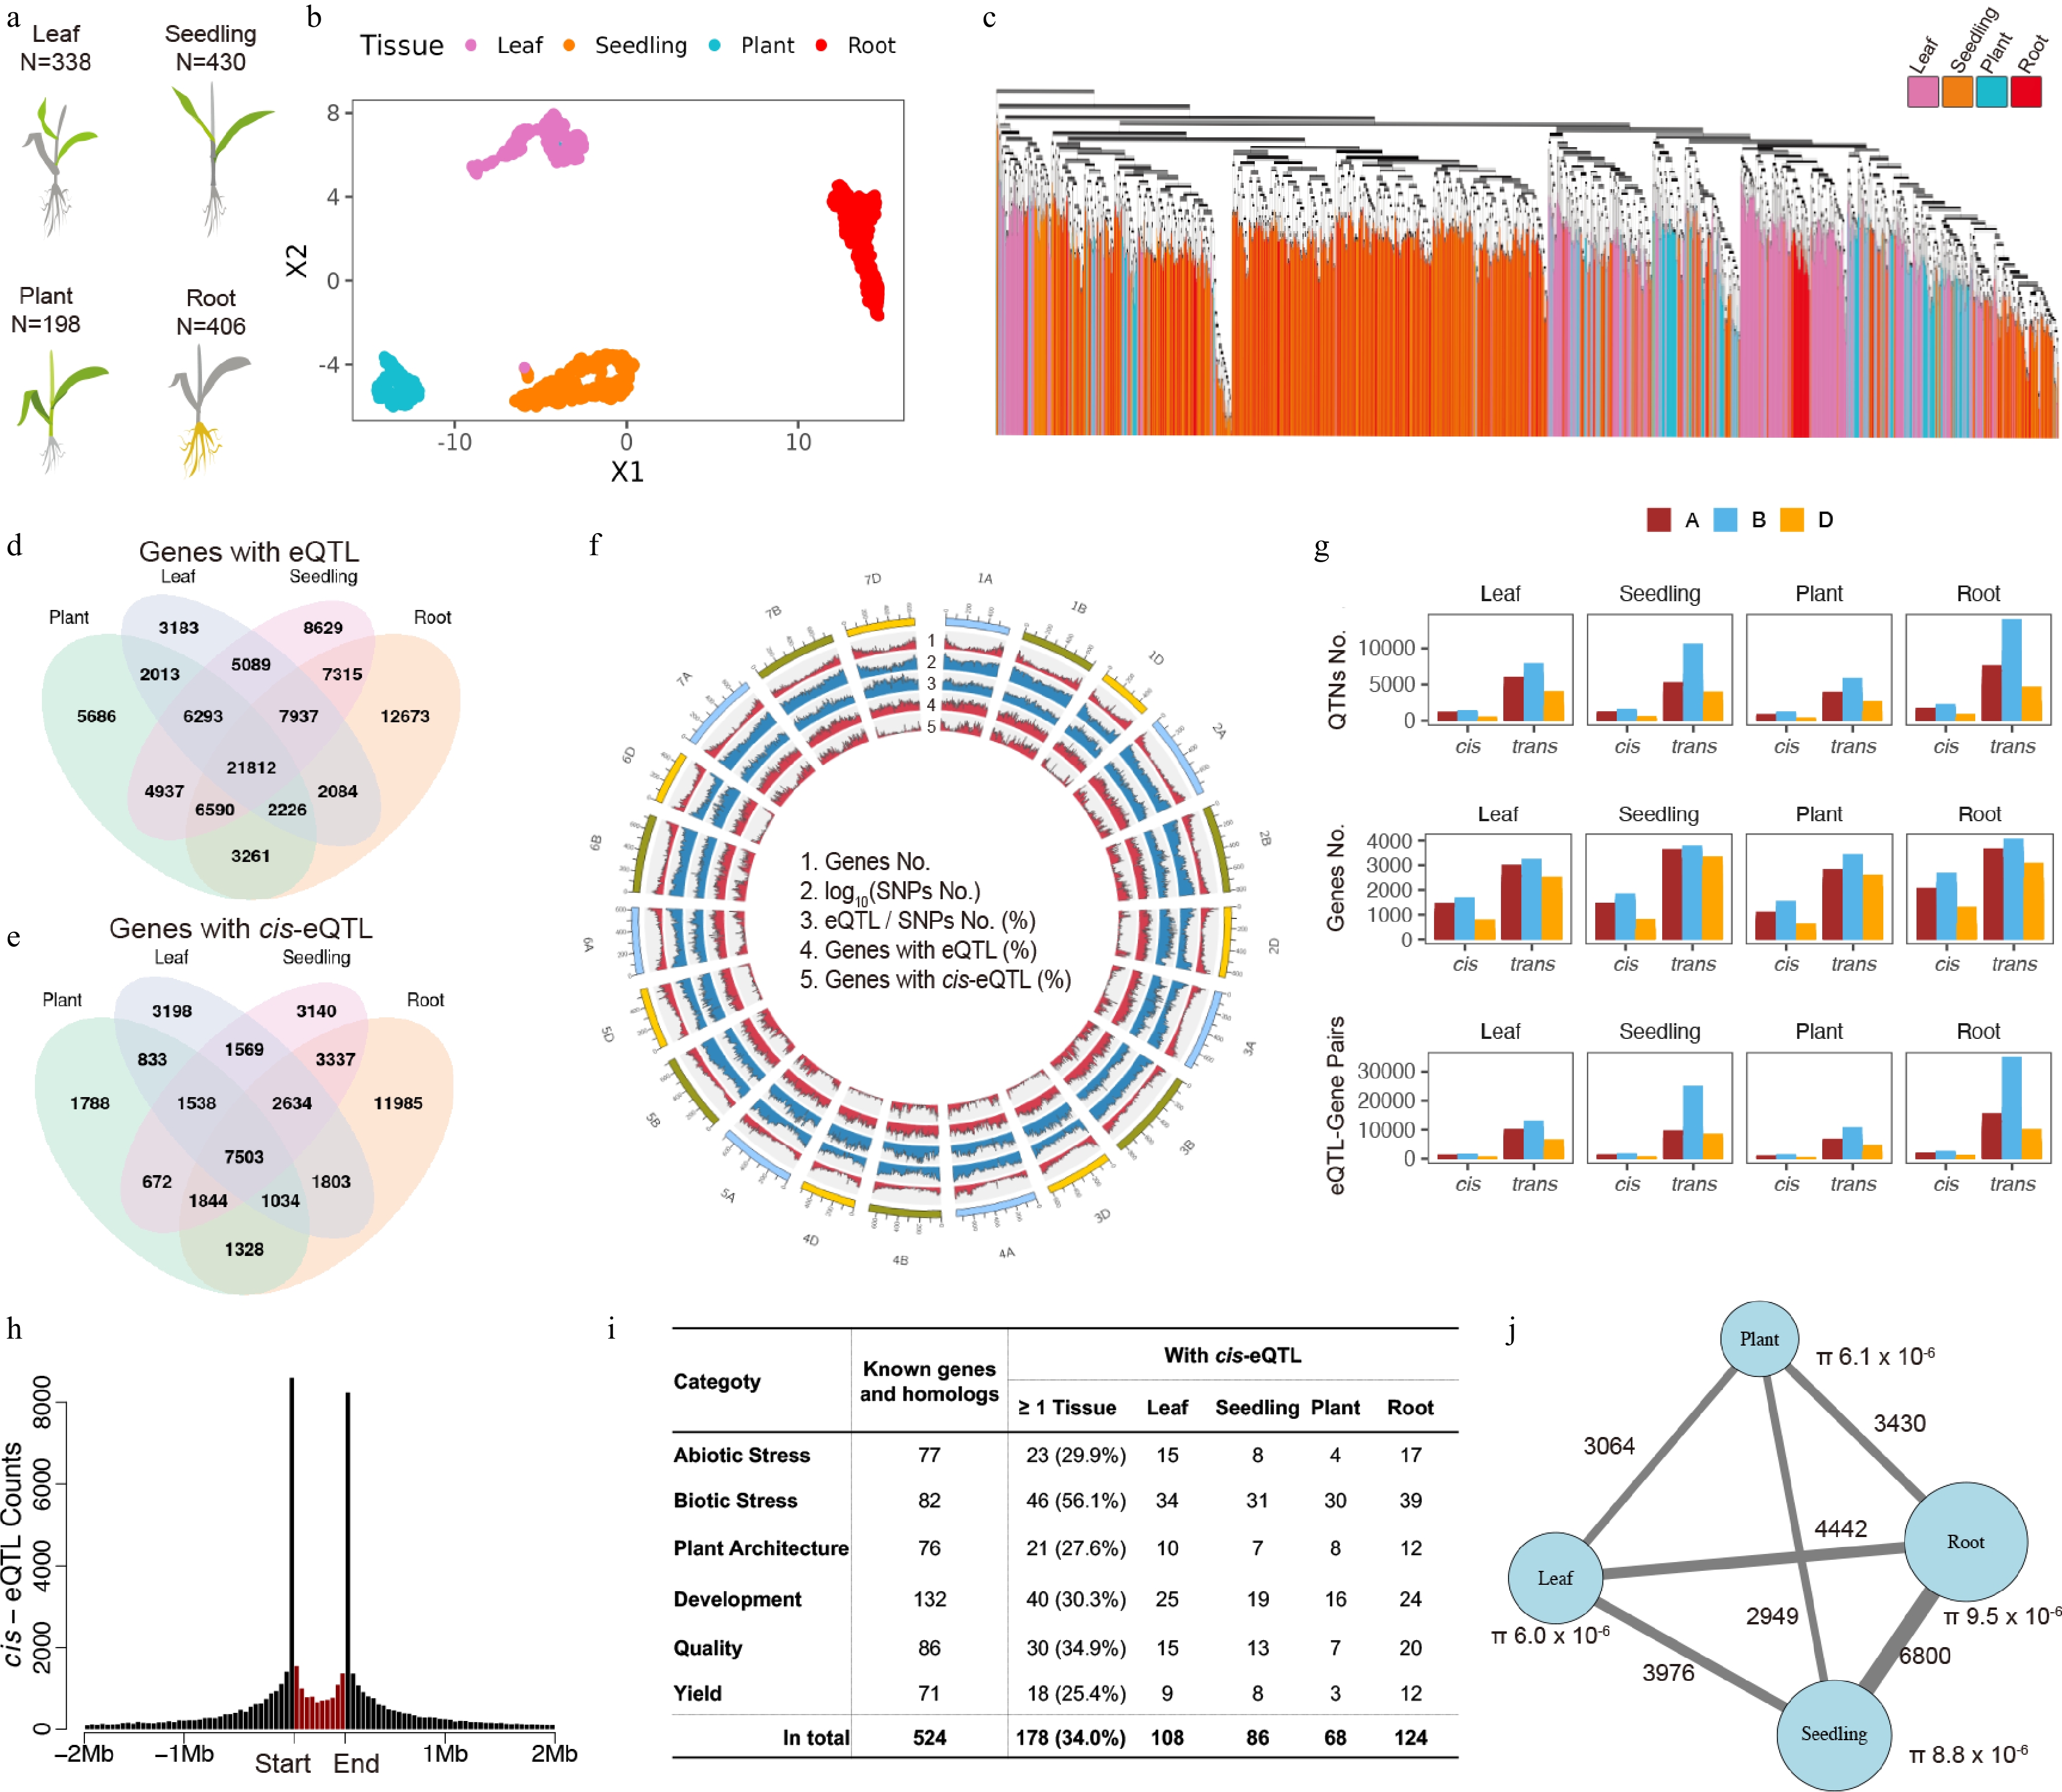
Figure 1.
Atlas of expression quantitative trait loci (eQTL) across diverse tissues and genetic backgrounds in wheat (a) Schematic of the four profiled tissue sources. Sampled tissues are highlighted in color, whereas the other plant parts are shown in grey. (b) Uniform manifold approximation and projection (UMAP) of 1,373 RNA-seq samples from the four panels, colored by tissue source. (c) Unrooted phylogenetic tree of the four diversity panels, colored by tissue. (d) Number of genes with cis- and/or trans-eQTL identified in each panel. (e) Number of unique genes with cis-eQTL in each panel. (f) Union summary of genomic features across all panels (from outer to inner rings): Total number of genes, number of single nucleotide polymorphisms (SNPs) (log10 transformed), ratio of eQTL to SNPs, number of genes with eQTL, and number of genes with cis-eQTL. (g) Distribution of cis-eQTL counts across the A, B, and D sub-genomes of hexaploid wheat (AABBDD). (h) Genomic distribution of cis-eQTL relative to gene positions. Black bins represent 100-kb intervals; the red bin represents a 3-kb genic region of regulated gene itself. (i) Summary of cis-eQTL for functionally characterized genes and their homologs, categorized by trait. (j) Number of shared trans-eQTL-gene associations between panel pairs. The color scale and dot size indicate the count of shared associations.
Single nucleotide polymorphisms (SNPs) were called separately for each panel against the Chinese Spring bread wheat reference genome RefSeq v2.1[5], yielding 260,329–431,441 SNPs per panel (Supplementary Table S1). Analysis of their genetic diversity, including the population structure (Fig. 1c), nucleotide diversity (Supplementary Fig. S1), and population differentiation (Supplementary Fig. S2), revealed a gradient of diversity from (highest to lowest) the root, seedling, and leaf to plant panels. Furthermore, these analyses indicated a closer genetic relationship between the root and seedling panels, and a separate, distinct relationship between the leaf and plant panels. This genetic clustering contrasts with the sample sources: The seedling and leaf panels both represent leaf tissues, whereas the plant and root panels are derived from the same developmental stages. Collectively, these results demonstrate that despite substantial differences in the sample sources (Supplementary Table S1), including tissue, developmental stage, and environment, as well as in genetic background and panel size, the four panels nevertheless exhibited discernible pairwise relationships.
The eQTL were identified by genome-wide association studies (GWAS) on each expressed gene across the four panels using the FarmCPU model. This method designates a single representative quantitative trait nucleotide (QTN) for each associated locus, rather than reporting all significantly associated SNPs. In total, we detected 778,242 eQTL associated with 99,728 genes. Among these genes, 31,039 were low-confidence (LC) genes. Notably, the number of eQTL detected in each panel was positively correlated with both panel size and the observed levels of genetic diversity (Supplementary Fig. S1, Supplementary Table S1), following the same descending order: Root (271,749), seedling (201,431), leaf (179,657), and plant (125,405). The influence of diversity on eQTL counts was stronger in panels with larger sample sizes. Furthermore, consistent with its distinct tissue origin and highest genetic diversity, the root panel also contained the highest number of unique genes associated with eQTL (Fig. 1d, e). As expected, genes and SNPs showed a distinct chromosomal distribution bias, concentrated near the chromosome ends and depleted around the centromeres (Fig. 1f). This bias was absent in the normalized distributions of both the eQTL and the genes associated with them. In contrast, the distribution of cis-eQTL (defined as QTNs within 10 Mb of their regulated gene) recapitulated the bias of the underlying genomic elements. At the subgenome level, the B subgenome exhibited the highest polymorphism (Supplementary Table S2) and contributed the most cis- and trans- eQTL both collectively and in individual tissues (Fig. 1g). Conversely, the D subgenome showed the lowest polymorphism and the fewest eQTL (Fig. 1g and Supplementary Fig. S3). Despite this pronounced disparity in eQTL numbers across subgenomes, the number of genes regulated by these eQTL did not exhibit a corresponding imbalance. This indicates that although polymorphism is a key driver of eQTL variation, the gene regulatory network, involving all genome-wide genes, functions as an interconnected system-wide landscape. We note that environmental variation between panels, while present, could not be quantified to evaluate their effect on eQTL because of limited metadata.
Among the 311,179 QTNs identified across all four panels, 2,032 were high-effect SNPs (e.g., stop-gained or splice variants) that substantially alter protein function. These high-effect SNPs were detected as the QTNs in 700 cis-eQTL and 4,960 trans-eQTL associations, collectively regulating 5,341 unique genes. For cis-regulation, these SNPs directly influence the expression of their host genes, whereas for trans-regulation, they may mediate regulatory relationships between their host genes and distantly located regulated target genes. For cis-eQTL, gene expression variation can arise from protein-altering mutations (e.g., high-impact or nonsynonymous SNPs) or from sequence variations in regulatory regions. Consistent with this model, 78.4% of the 65,413 cis-QTNs are located within 2 Mb of their regulated gene, with clear enrichment in the proximal 5-kb flanking regions (20.8%) and within the gene bodies (14.3%) (Fig. 1h).
To investigate the regulatory basis of functionally characterized genes, we analyzed cis-eQTL for a compiled set of 524 known genes and their homologs associated with key agronomic traits[6]. These genes were categorized into abiotic stress, biotic stress, plant architecture, development, quality, and yield (Fig. 1i). The proportion of these genes possessing cis-eQTL was similar to the background rate observed among all expressed genes. Interestingly, we found that genes induced by environmental factors, specifically those in the abiotic and biotic stress categories, did not show a significantly lower proportion of cis-eQTL than the other categories. In fact, genes associated with biotic stress exhibited a significantly higher proportion of cis-eQTL than all genes (Fisher's exact test, p = 1 × 10⁻⁴). Our genome-wide findings are consistent with a previous study[7] that effectively leveraged transcriptome data from seedlings of an untreated diversity panel to identify four functionally characterized genes conferring resistance to soybean cyst nematode.
Among the 44,206 unique genes with cis-eQTL, 54.5% were identified in at least two different panels, indicating a considerable degree of conservation across diverse tissue sources and genetic backgrounds. In contrast, shared trans-eQTL were far less common. Only 12.5% (12,362 of 98,973) of the genes with trans-eQTL were associated with the same trans-eQTL across multiple panels. This lack of conservation was even more pronounced at the level of individual regulatory relationships: Only 5.1% of all trans-eQTL–gene associations were replicated in two or more panels. For this small set of conserved trans-associations, their abundance within each panel remained correlated with the panel's genetic diversity (Fig. 1j). Furthermore, the number of shared associations between any two panels correlated more strongly with their genetic differentiation than with the similarity of their tissue sources.
A classical strategy for prioritizing candidate genes within a trait-associated locus involves integrating cis-eQTL data with GWAS hits, termed co-localization. The underlying premise is that cis-eQTL co-localizing with a trait-associated GWAS locus provides a direct mechanistic link, making the cis-regulated gene a strong candidate for phenotypic variation. Given that expression data from nontarget tissues has successfully enabled trait-related genetic dissection in species like Arabidopsis[8], maize[8], and soybean[7], we applied this co-localization strategy to integrate our seedling-stage eQTL datasets with a genetic dissection of plant height as a model trait (Fig. 2a). We conducted a GWAS for plant height using the root panel[9], for which both the genotypes and phenotypes were available, using a compressed mixed linear model (Fig. 2b) and a FarmCPU model (Supplementary Fig. S4). Both analyses identified two significant loci corresponding to the known dwarfing genes Rht-B1 and Rht-D1[10].
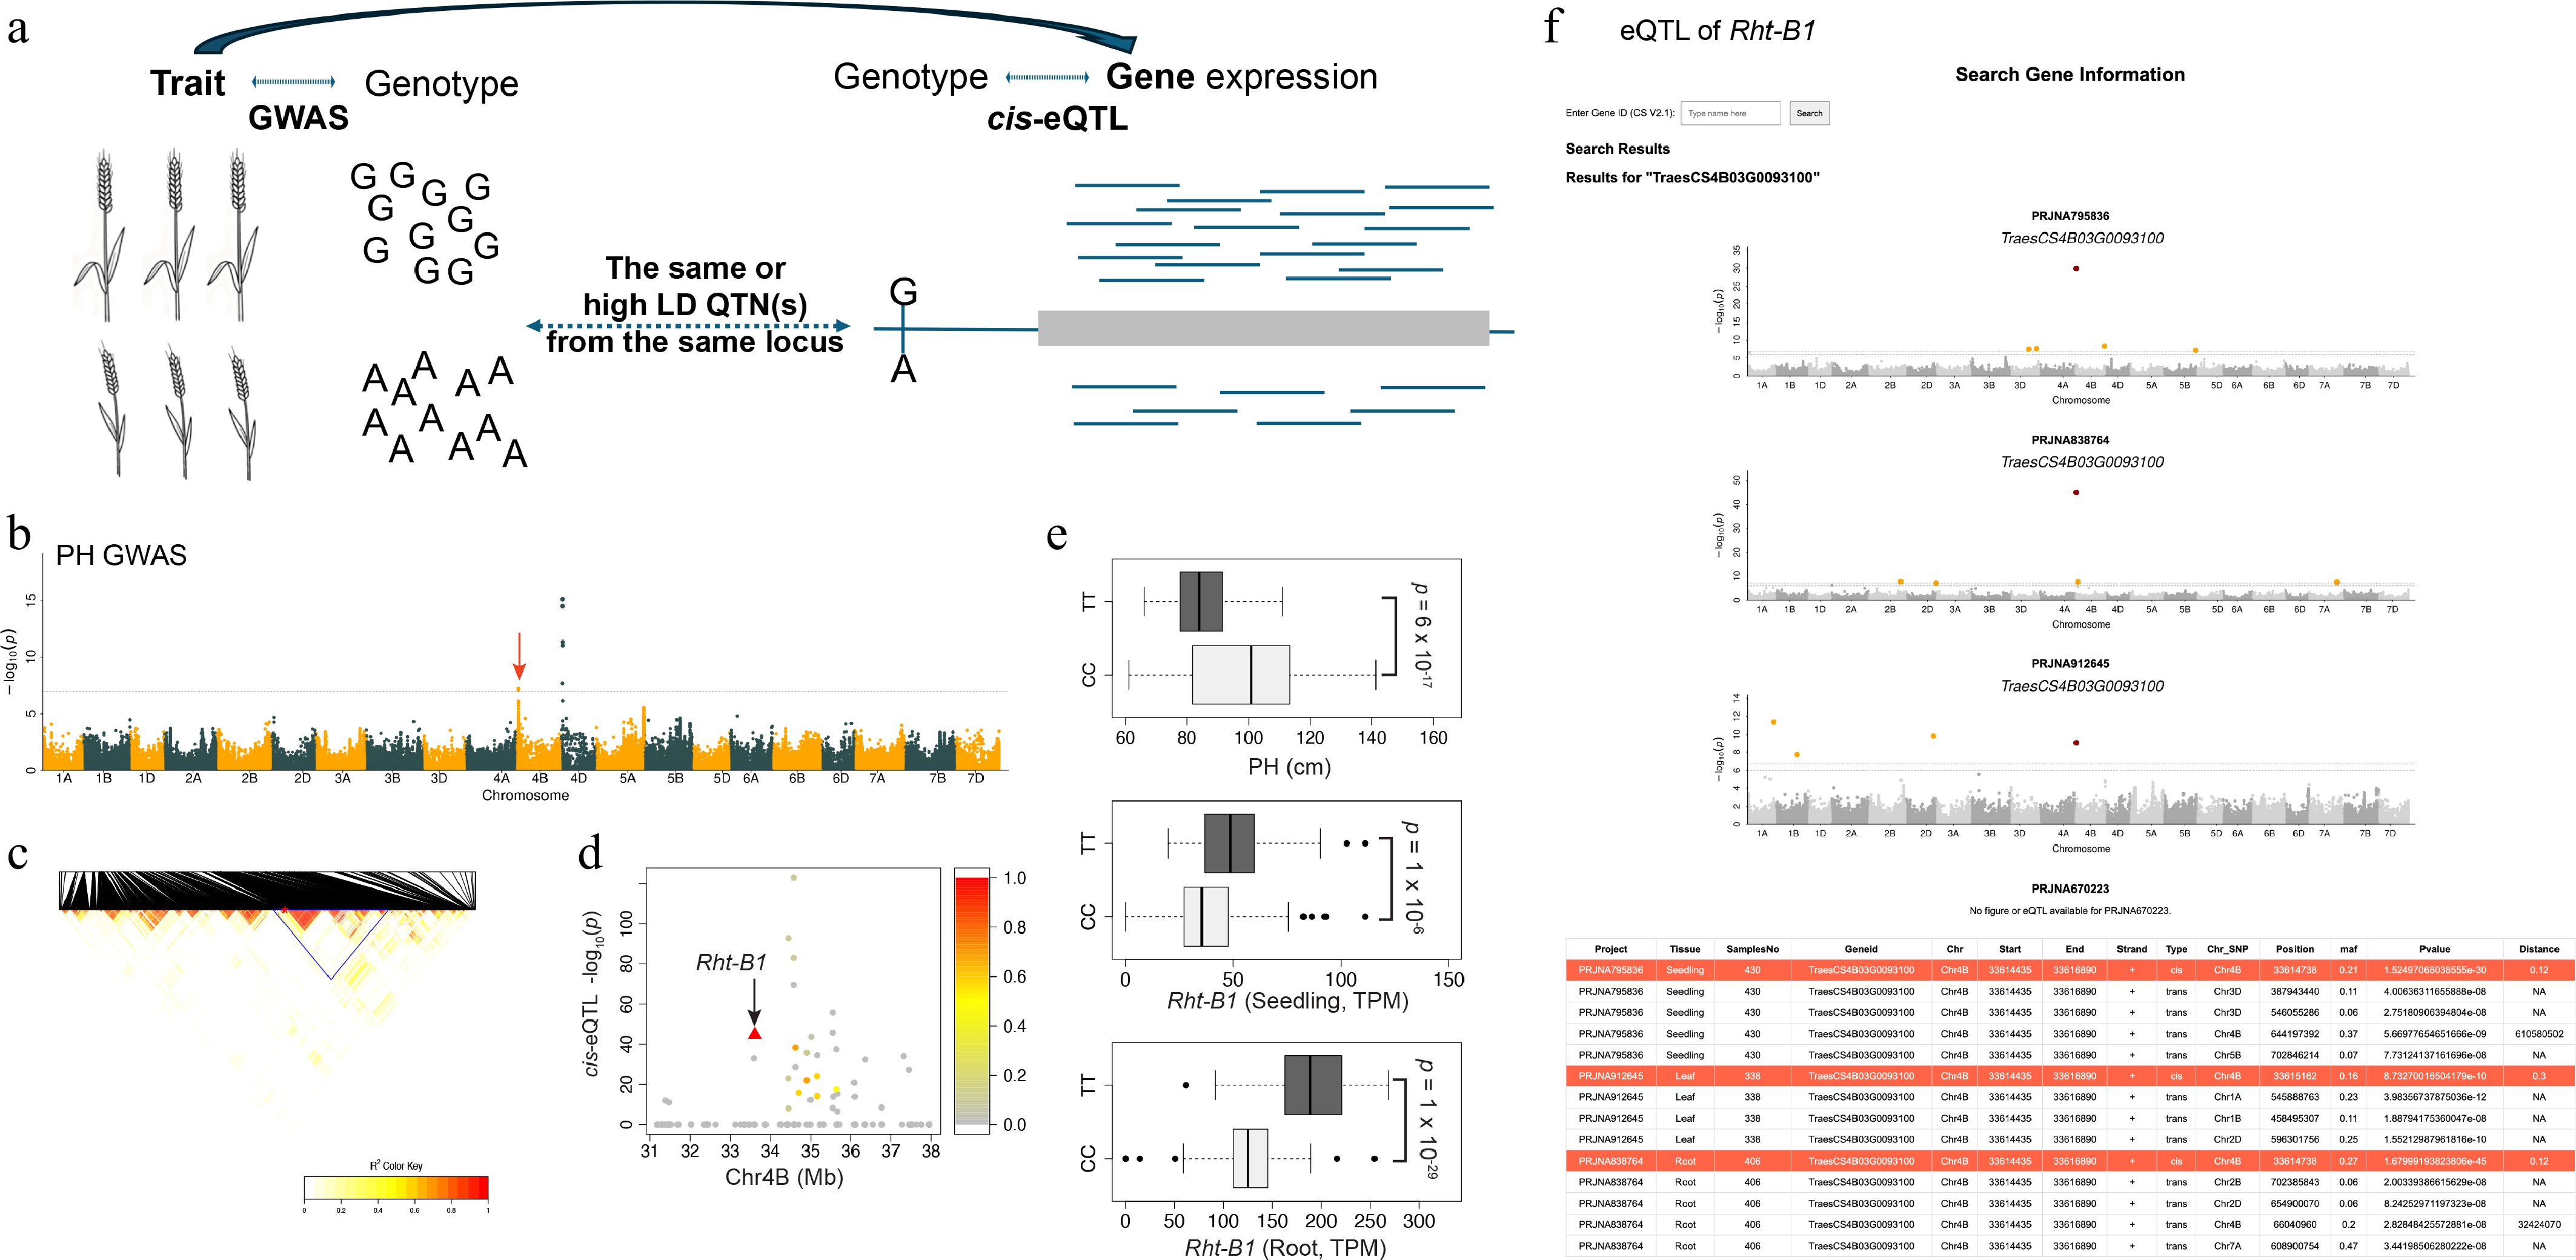
Figure 2.
Re-identification of the known Rht-B1 gene through co-localization of cis-eQTL and plant height GWAS. (a) Schematic illustrating the co-localization strategy, which integrates independent eQTL results and GWAS by identifying shared SNPs or SNPs in high linkage disequilibrium (LD) to bridge candidate genes with traits. (b) Plant height (PH) GWAS. The significantly associated locus containing Rht-B1 is indicated by a red arrow. (c) Linkage disequilibrium heatmap of SNPs within the genomic region surrounding the GWAS peak. The high-LD block is highlighted by a blue triangle. (d) The cis-eQTL signals for all genes annotated within the high-LD region. Points are colored according to the LD (r2) between each cis-eQTL's lead SNP and the lead GWAS SNP from the PH GWAS. (e) Variation in PH (left) and Rht-B1 expression levels in the seedling and root tissues (middle, right) stratified by genotype at the co-localized SNPs. The p-values were derived from a Student's t-test comparing the two genotypes. (f) Representative output from the user–self-hostable web resource, showing the search results for Rht-B1 (TraesCS4B03G0093100), including its eQTL profile across the four panels, as Manhattan plots and a summary table.
For the Rht-B1 locus, the association region spanned approximately 6.8 Mb and contained 67 annotated high-confidence (HC) and 76 LC genes (Fig. 2c). Among these genes, 40 were found to harbor cis-eQTL in at least one of the four panels (Fig. 2d). We then applied a stringent co-localization criterion, requiring that the significantly associated SNPs from the plant height GWAS were either identical to the cis-eQTL's QTN or in high linkage disequilibrium (LD r2 > 0.7) with it. This rigorous filtering identified a single cis-eQTL QTN (Chr4B-33614738, C/T), a functional stop-gained variant in Rht-B1, which was shared across two panels and is also associated with plant height (Fig. 2e). This identified the known Rht-B1 gene as the only candidate, demonstrating the power to prioritize causal genes from a large set of positional candidates. The candidate gene was identified by both the root panel (the same panel used for the plant height GWAS) and the independent seedling panel. This cross-panel validation indicates that our seedling-stage eQTL atlas is a robust, generalizable resource that could benefit independent GWAS studies for diverse traits, including those not directly linked to seedling tissues. This broad utility is further evidenced by our identification of cis-eQTL for known genes regulating abiotic stress, biotic stress, plant architecture, development, quality, and yield. This co-localization strategy is particularly valuable in wheat, where slow linkage disequilibrium decay often results in extensive candidate intervals. However, the expression of Rht-D1 was too low to be defined as expressed in our transcriptomic data, highlighting the potential for false negatives when causal genes are expressed at low levels or in specific cell types not captured by our sampling.
To enhance the accessibility and usability of our seedling eQTL atlas, we have integrated the eQTL data directly into WheatOmics (
http://wheatomics.sdau.edu.cn/eqtl ). This integration enables users to query any gene and instantly retrieve its associated eQTL, which are displayed through interactive multi-panel Manhattan plots and accompanying summary tables. As an example, querying Rht-B1 (gene ID TraesCS4B03G0093100) returns its strong cis-eQTL and simultaneously uncovers the associated trans-eQTL genome-wide (Fig. 2f). For detailed Materials and Methods, see Supplementary File 1.
HTML
This work was supported by the Key Research and Development Program of Zhejiang (2024SSYS0099). We thank WheatOmics for curating and providing the set of known wheat genes and homologs.
-
The authors confirm their contributions to the paper as follows: research design: Liu Z, Li D, Wu Q; project supervision: Liu Z, Wu Q; data analyses: Li D, Dong L, Liu J; web resource maintain: Ma S, Chen T, Ni F; draft manuscript preparation: Li D, Li H, Wu Q. All authors participated in project discussions, reviewed the results, and approved the final version of the manuscript.
-
The raw RNA-seq data were downloaded from the NCBI Sequence Read Archive under accessions PRJNA912645[1], PRJNA795836[2], PRJNA670223[3], and PRJNA838764[4]. The eQTL summary table is available on Figshare (10.6084/m9.figshare.30773096). Data, code, and instructions for deploying a local, searchable web resource are provided on GitHub (https://github.com/DelinLi/Wheat_eQTL_Atlas).
-
The authors declare that they have no conflict of interest.
-
# Authors contributed equally: Delin Li, Shengwei Ma
- Supplementary Table S1 Panels summary information.
- Supplementary Table S2 The cis-eQTL of known genes and homologs.
- Supplementary Fig. S1 Overlap of high-quality SNPs across the four diversity panels.
- Supplementary Fig. S2 Genetic diversity and differentiation among the four diversity panels.
- Supplementary Fig. S3 Chromosomal distribution of eQTL-gene associations.
- Supplementary Fig. S4 Plant height GWAS using the FarmCPU model.
- Supplementary File 1 Materials and phenotypes.
- Copyright: © 2026 by the author(s). Published by Maximum Academic Press, Fayetteville, GA. This article is an open access article distributed under Creative Commons Attribution License (CC BY 4.0), visit https://creativecommons.org/licenses/by/4.0/.
Li D, Ma S, Liu J, Chen T, Dong L, et al. 2026. A seedling-stage expression quantitative trait locus atlas across tissues and genetic backgrounds in wheat. Genomics Communications 3: e003 doi: 10.48130/gcomm-0026-0002


|