-
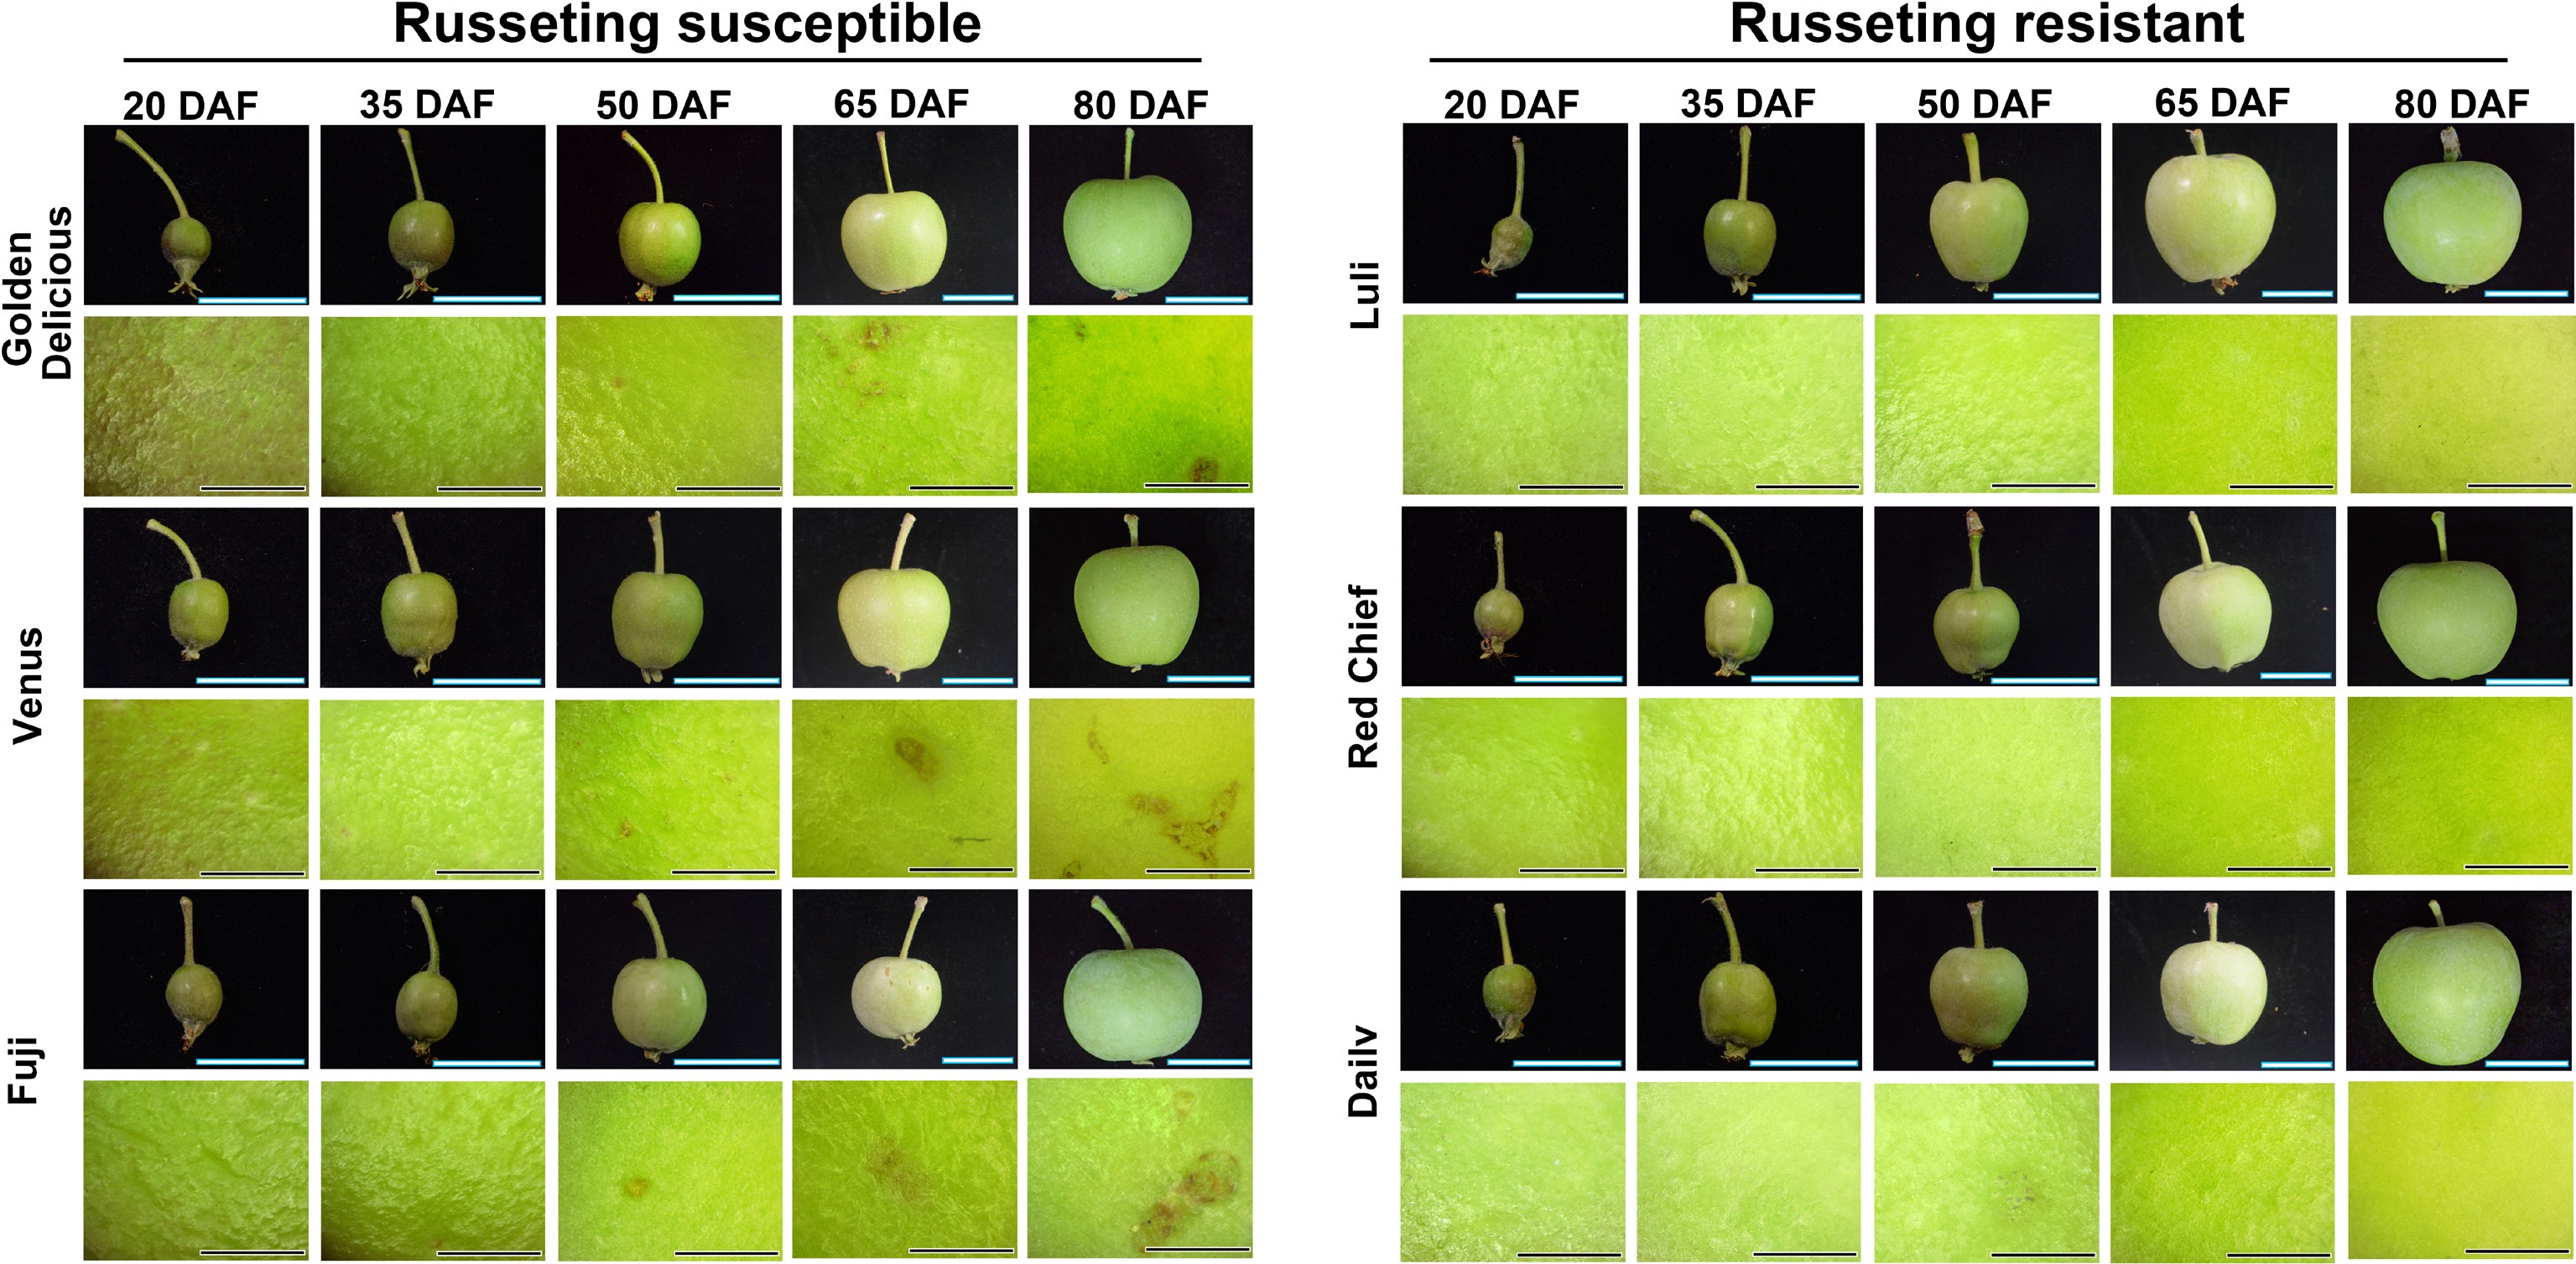
Figure 1.
Dynamic changes of fruit russeting in different apple cultivars observed by stereomicroscope. Fruit development was documented at 20, 35, 50, 65, and 80 d after flowering (DAF). Scale bars represent 1 cm. Observation of fruit russeting on the equatorial region under a stereomicroscope at 4x magnification. Scale bars represent 1 mm.
-
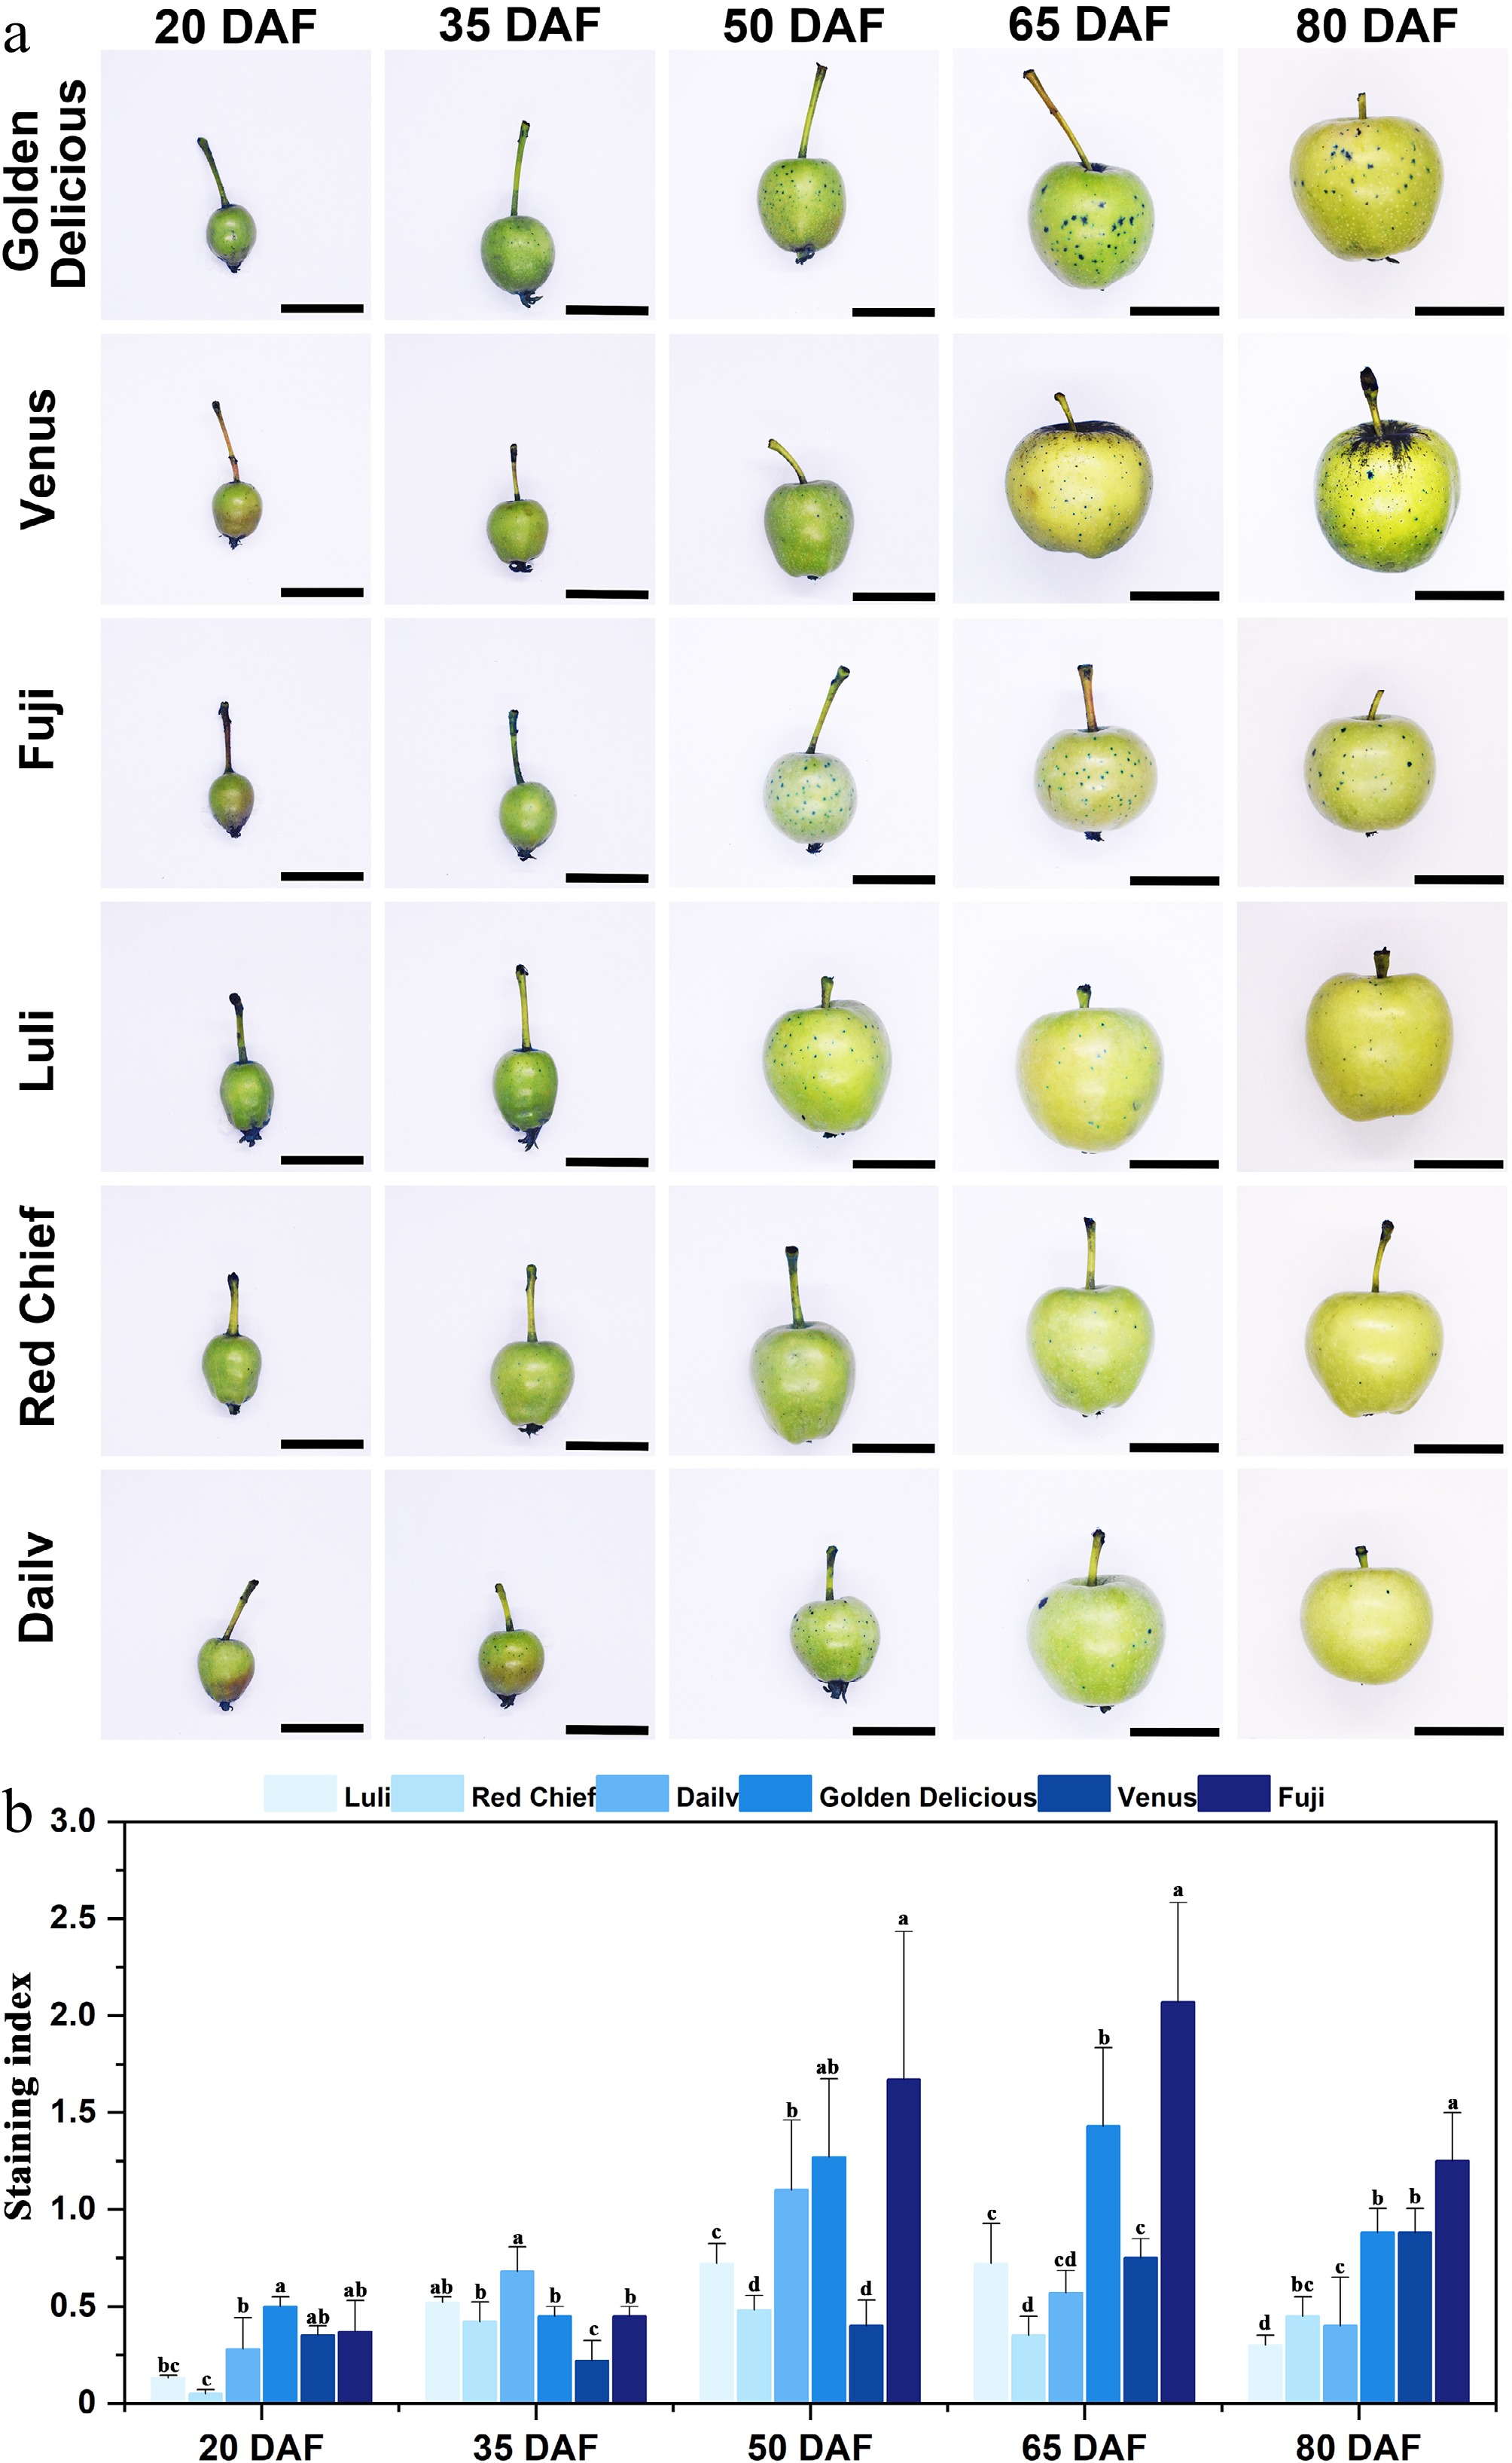
Figure 2.
Observation and analysis of aniline blue staining on fruits of different apple cultivars. (a) Aniline blue staining of apple fruits across cultivars and developmental stages. Scale bars represent 1 cm. (b) Staining index. Error bars represent the means ± SD (n = 3) taken from three independent biological replicates. Different letters represent significant differences (one-way ANOVA, Tukey-Kramer test, p < 0.05). DAF = days after flowering.
-
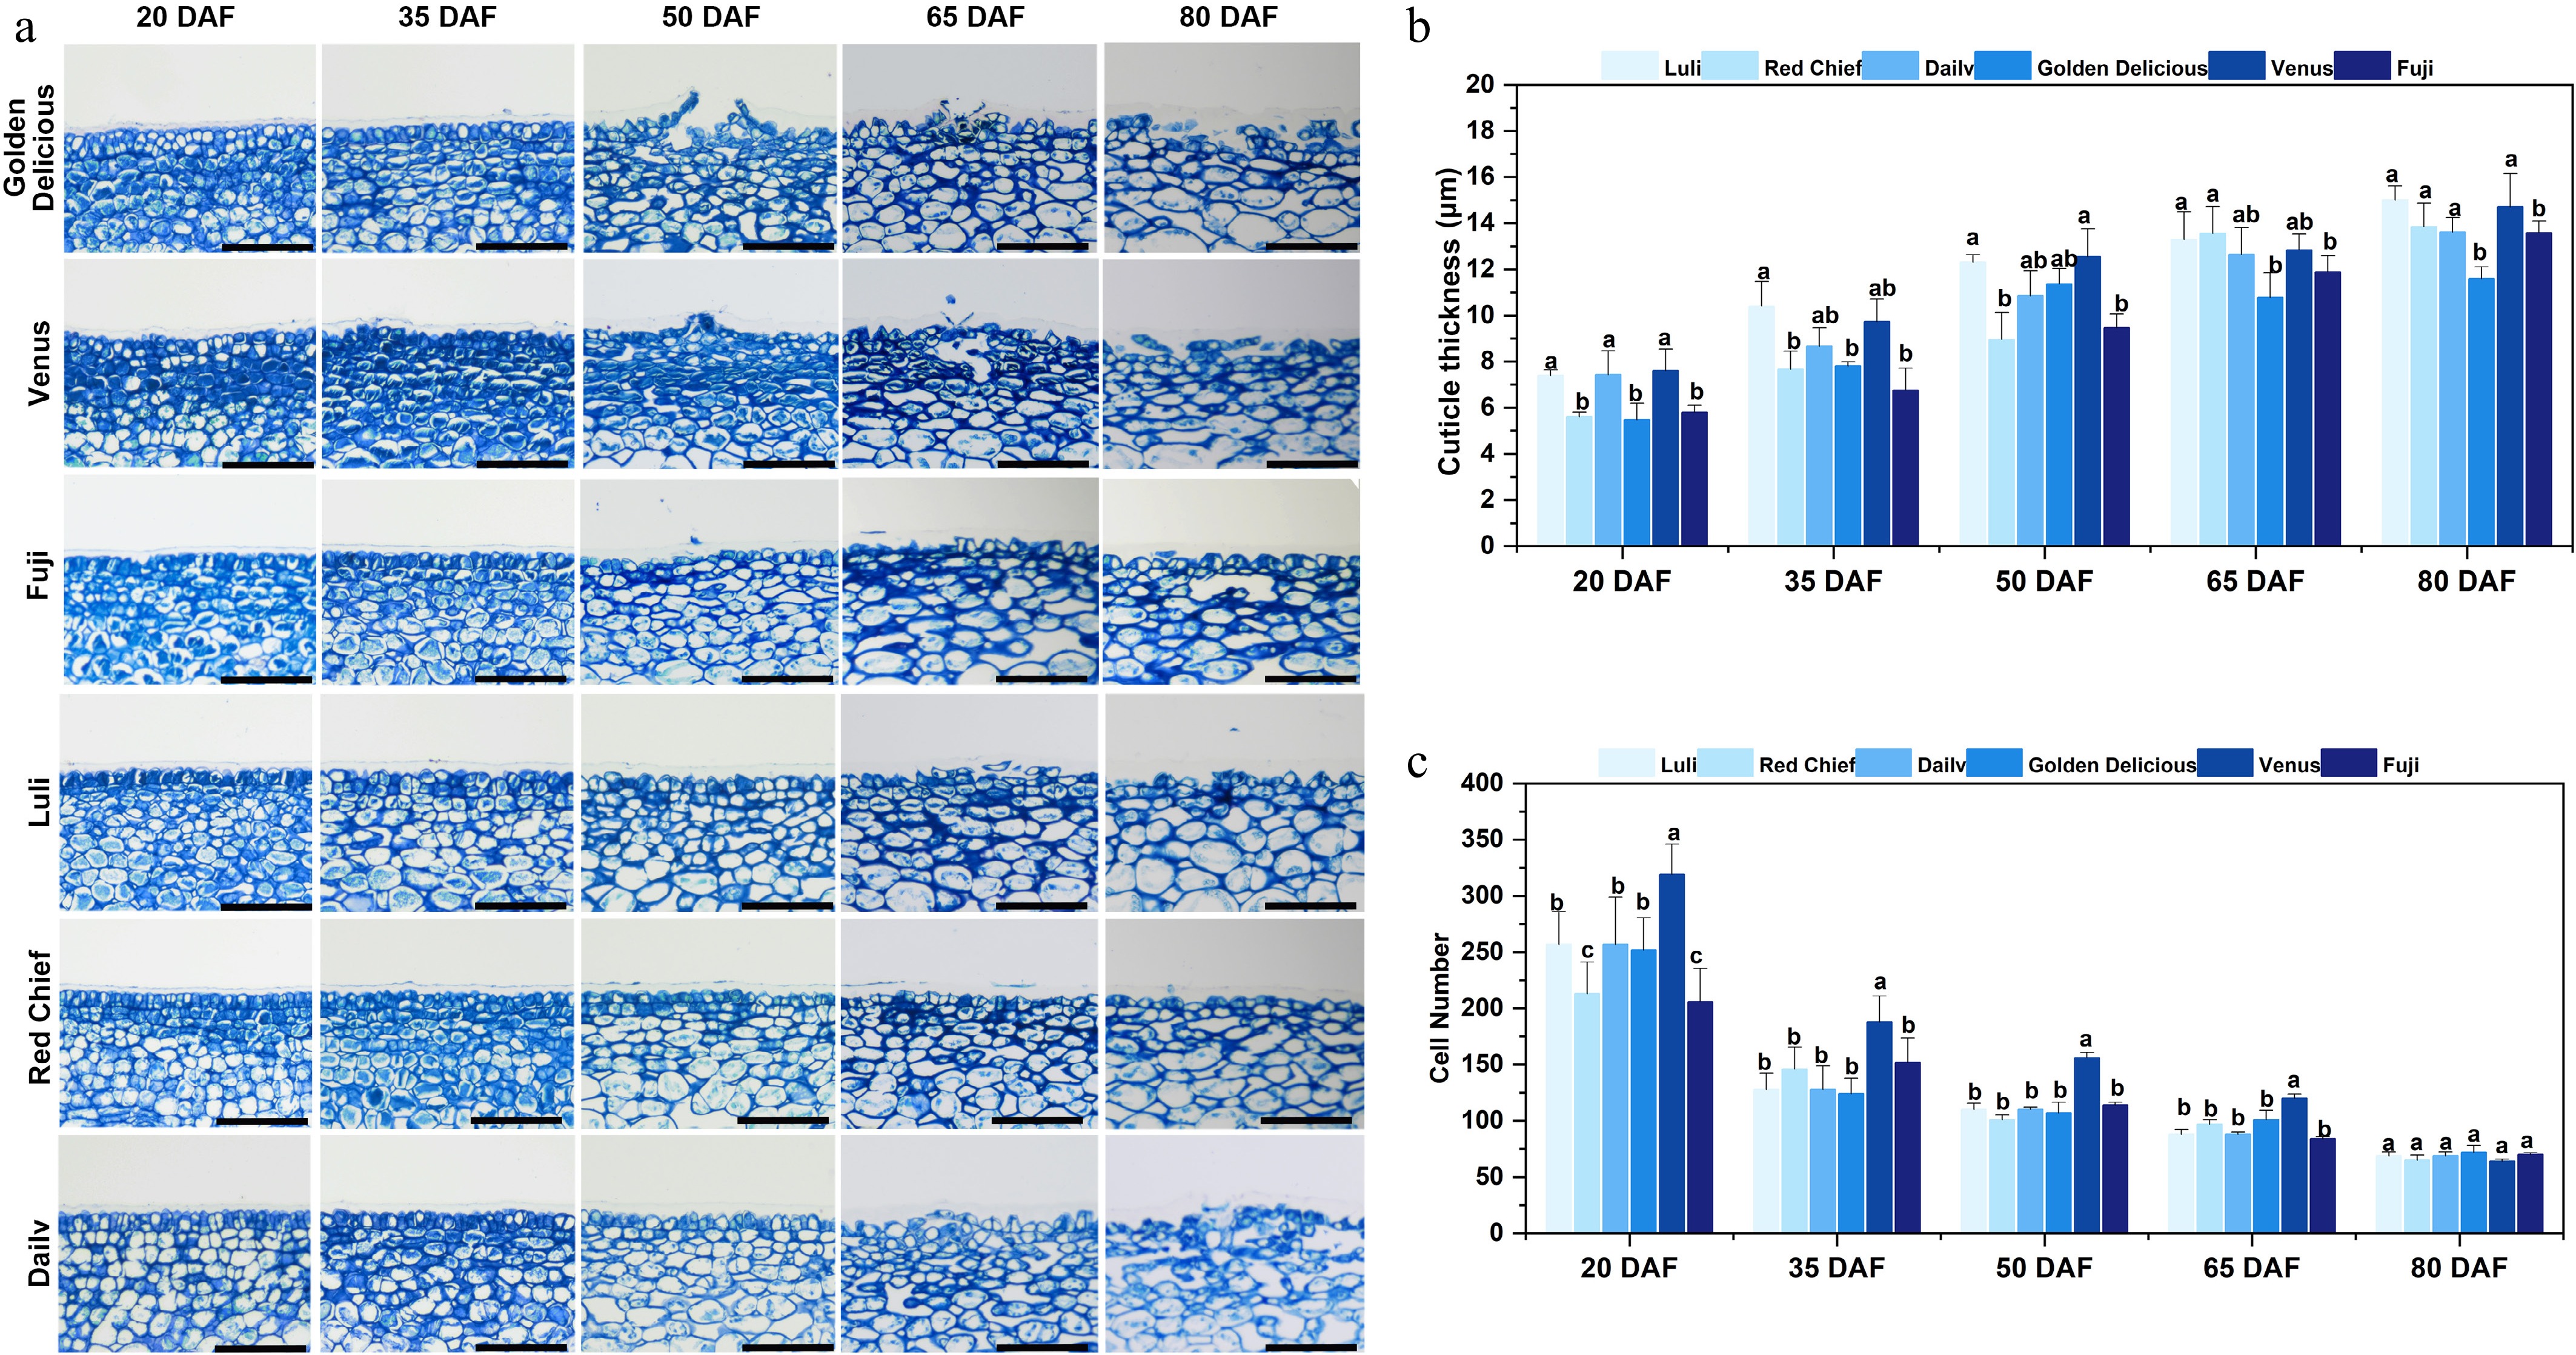
Figure 3.
Microscope observation and cuticle analysis of fruit epidermis of different apple cultivars. (a) Optical microscope image of a vertical section of the equatorial fruit epidermis stained with aniline blue. Scale bars represent 100 µm. (b) Cuticle thickness. (c) Cell number. Error bars represent the means ± SD (n = 3) taken from three independent biological replicates. Different letters represent significant differences (one-way ANOVA, Tukey-Kramer test, p < 0.05). DAF = days after flowering.
-
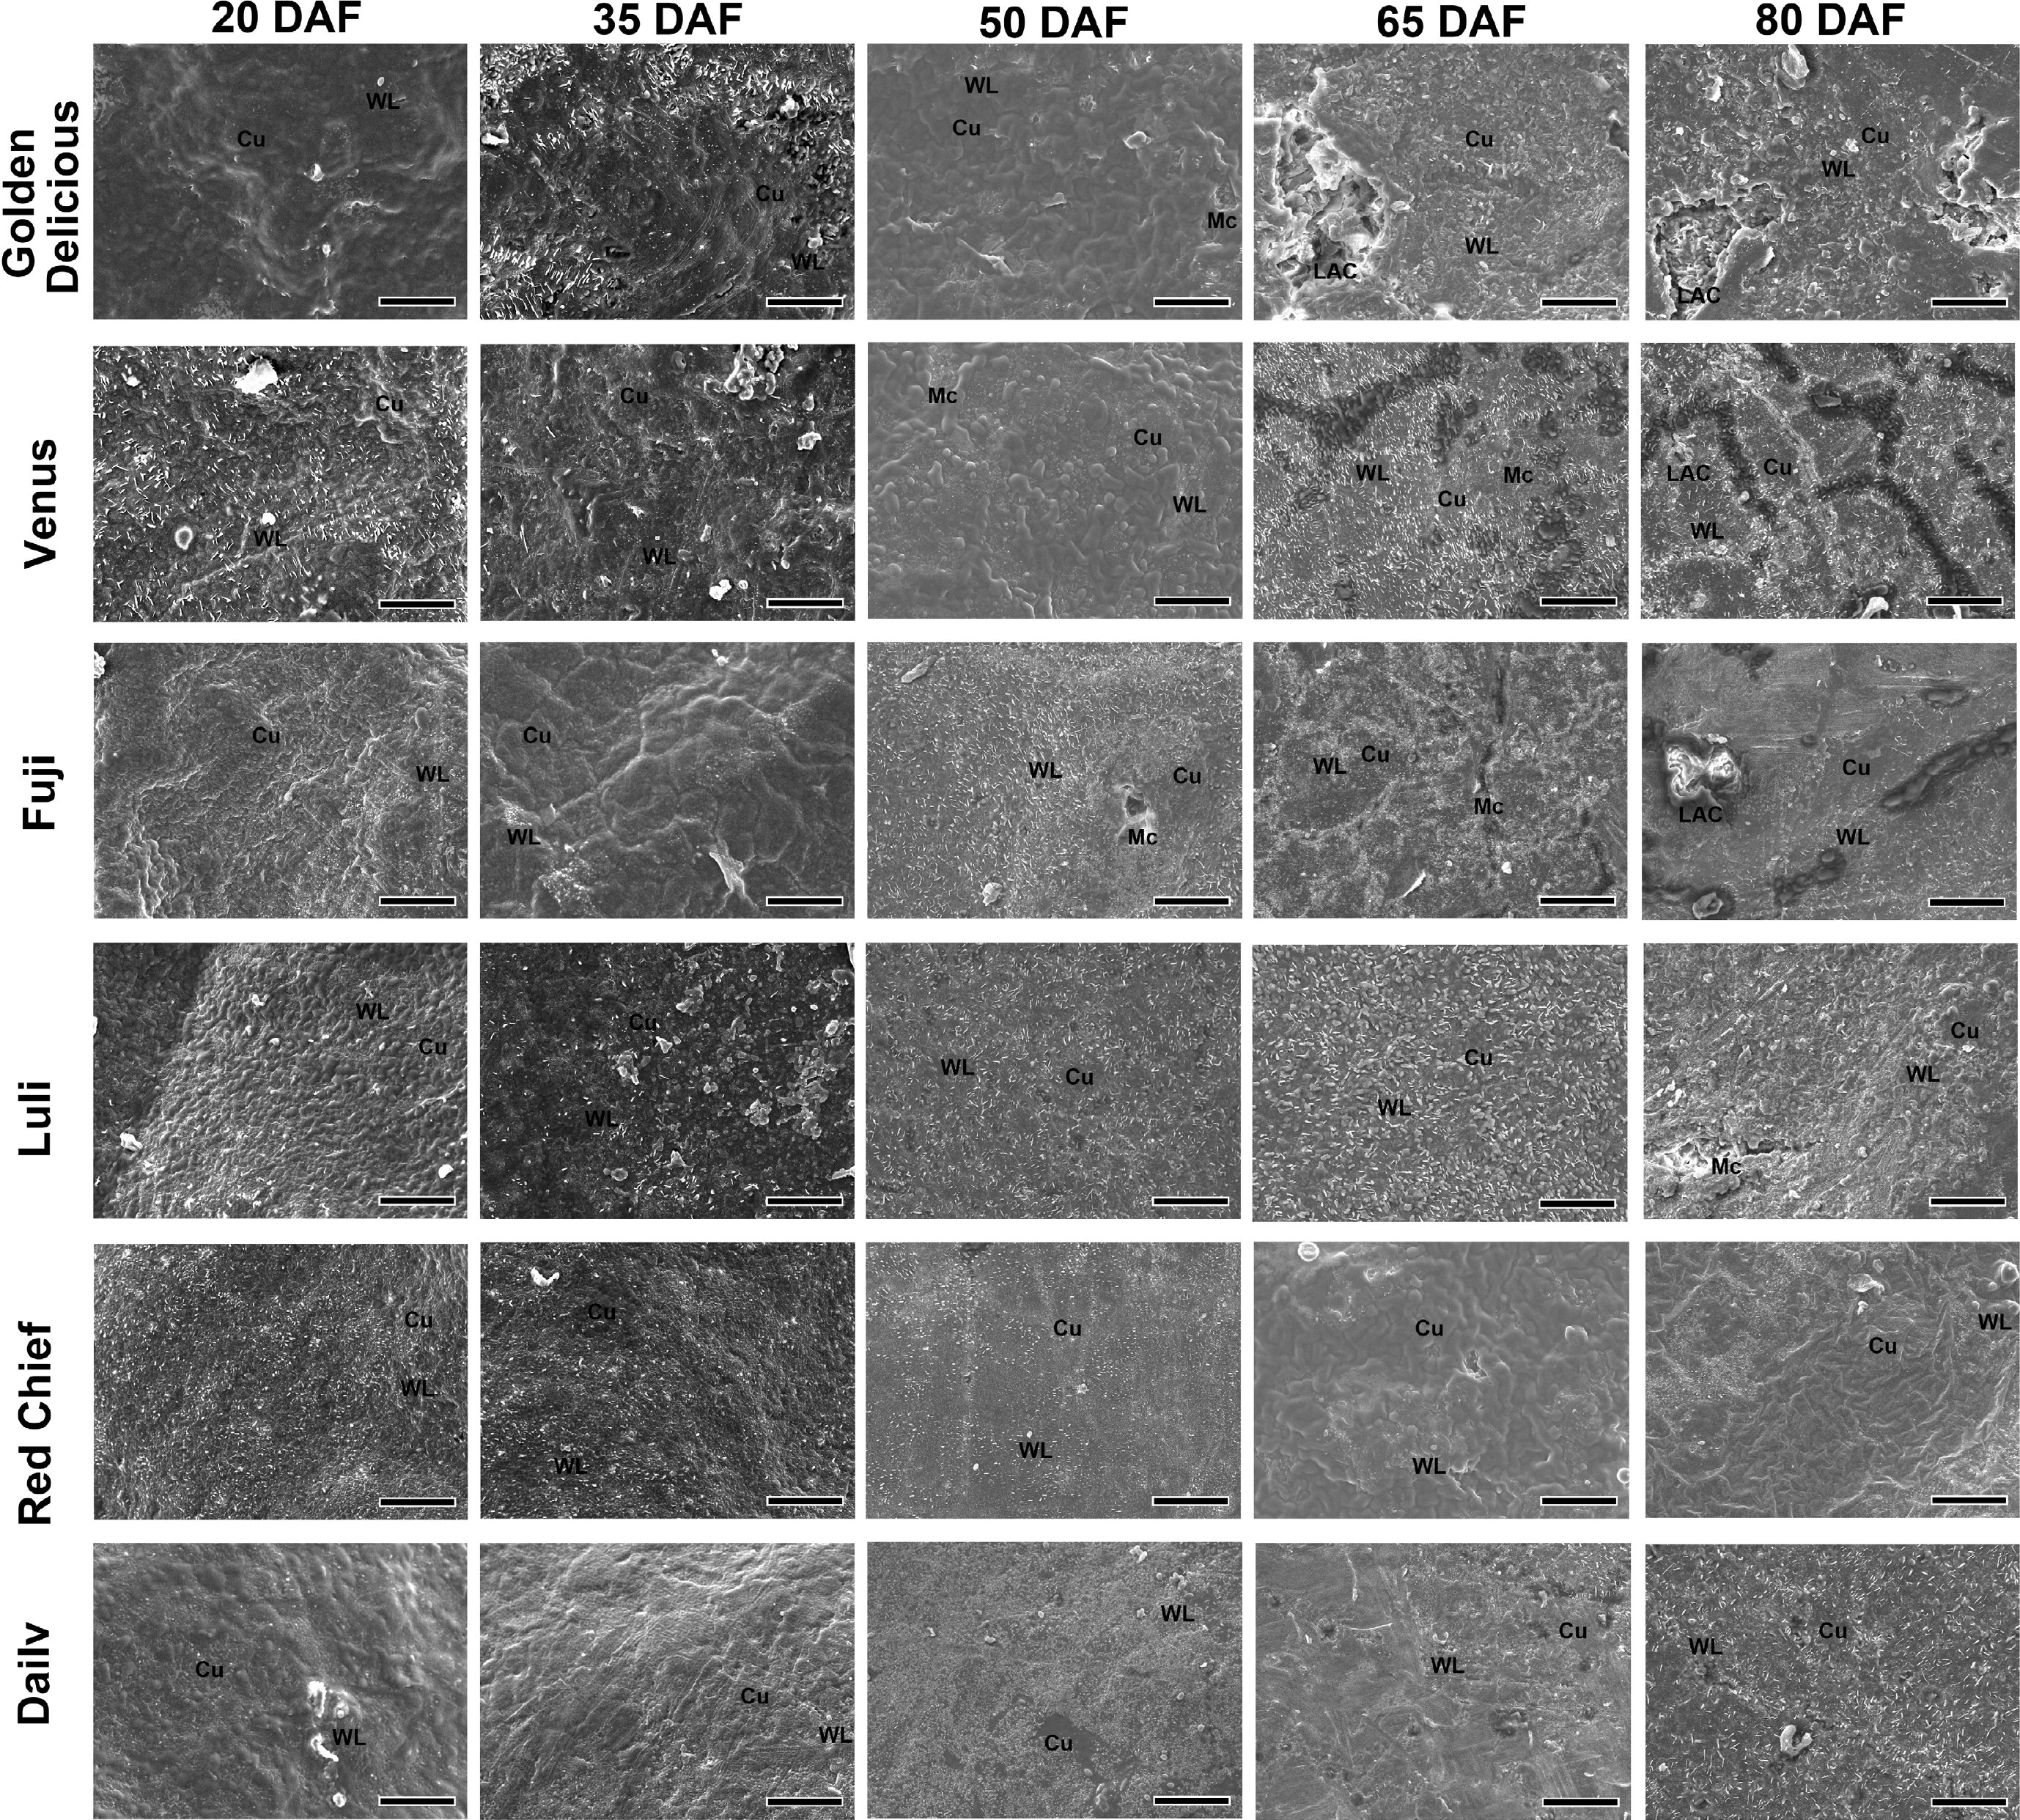
Figure 4.
Scanning electron microscope observation and analysis of fruit epidermis of different apple cultivars. Representative scanning electron microscopy images are shown. For each of the three biological replicates (independent fruits) per cultivar, multiple regions were examined, and the presented images best illustrate the typical morphological features observed. WL: Wax Layer. Cu: Cuticle. Mc: Microcrack. LAC: Large Area Crack. Scale bars represent 50 µm. DAF = days after flowering.
-
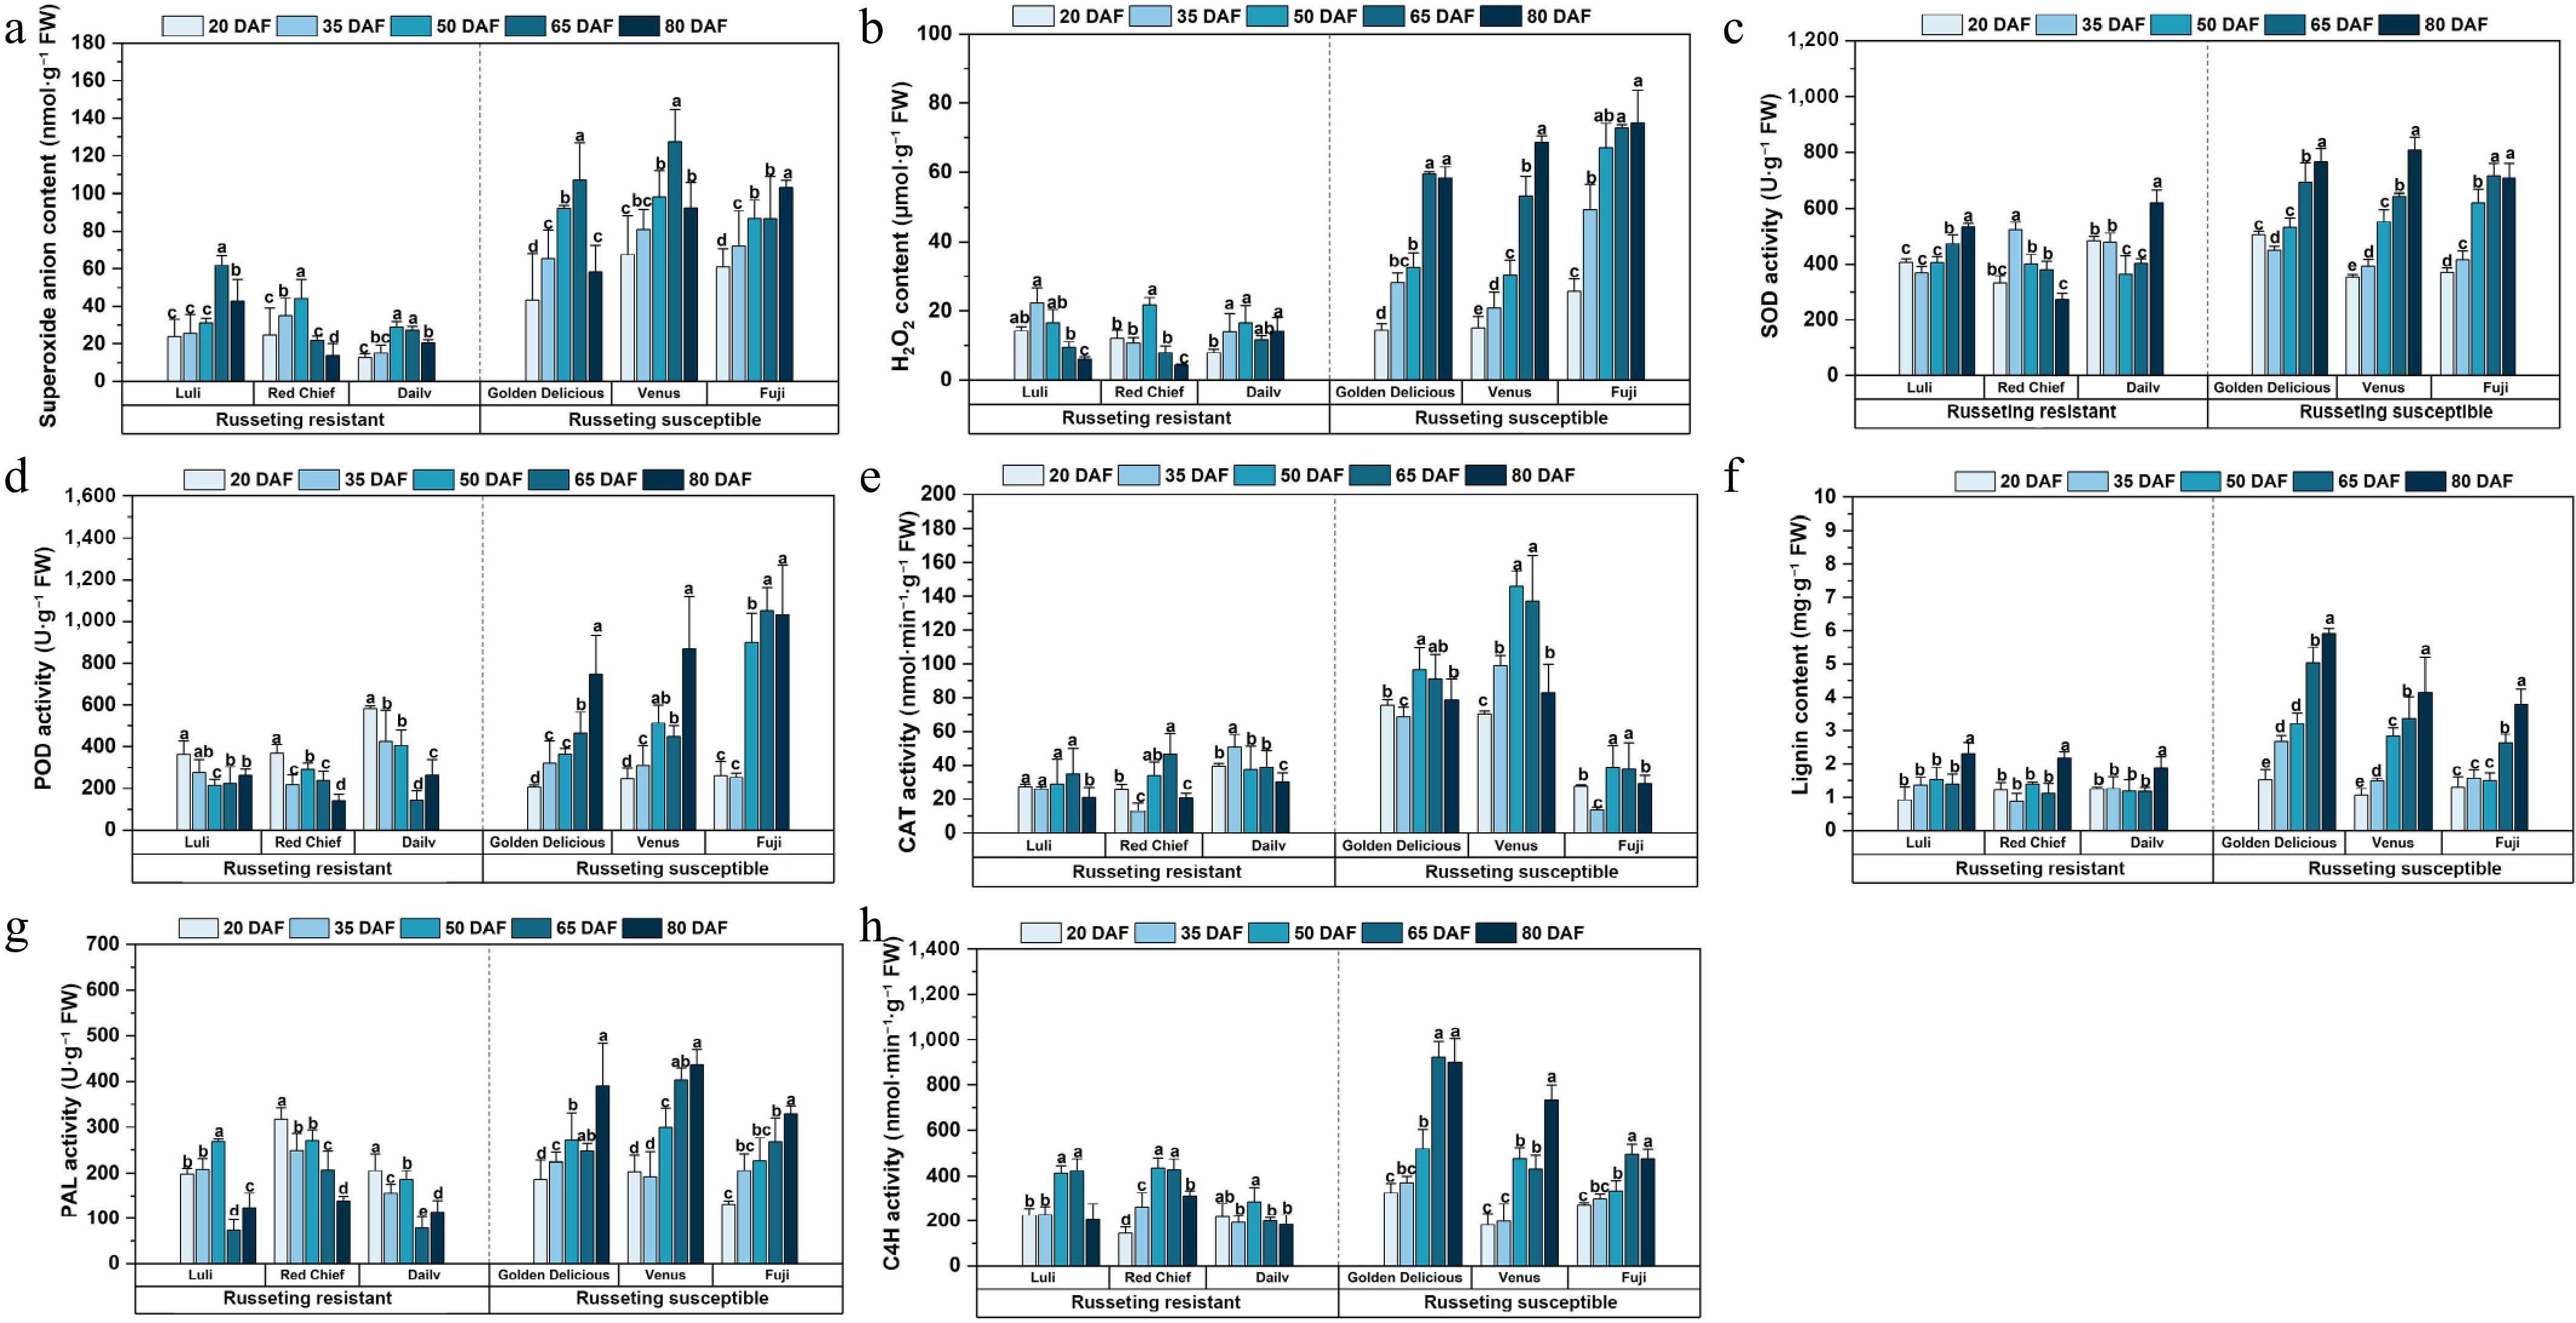
Figure 5.
Active oxygen metabolism and epidermal lignin/enzyme activities altered in apple cultivars during russeting. (a) Superoxide anion content. (b) H2O2 content. (c) SOD activity. (d) POD activity. (e) CAT activity. (f) Lignin content. (g) PAL activity. (h) C4H activity. Error bars represent the means ± SD (n = 3) taken from three independent biological replicates. Different letters represent significant differences (one-way ANOVA, Tukey-Kramer test, p < 0.05). DAF = days after flowering.
-
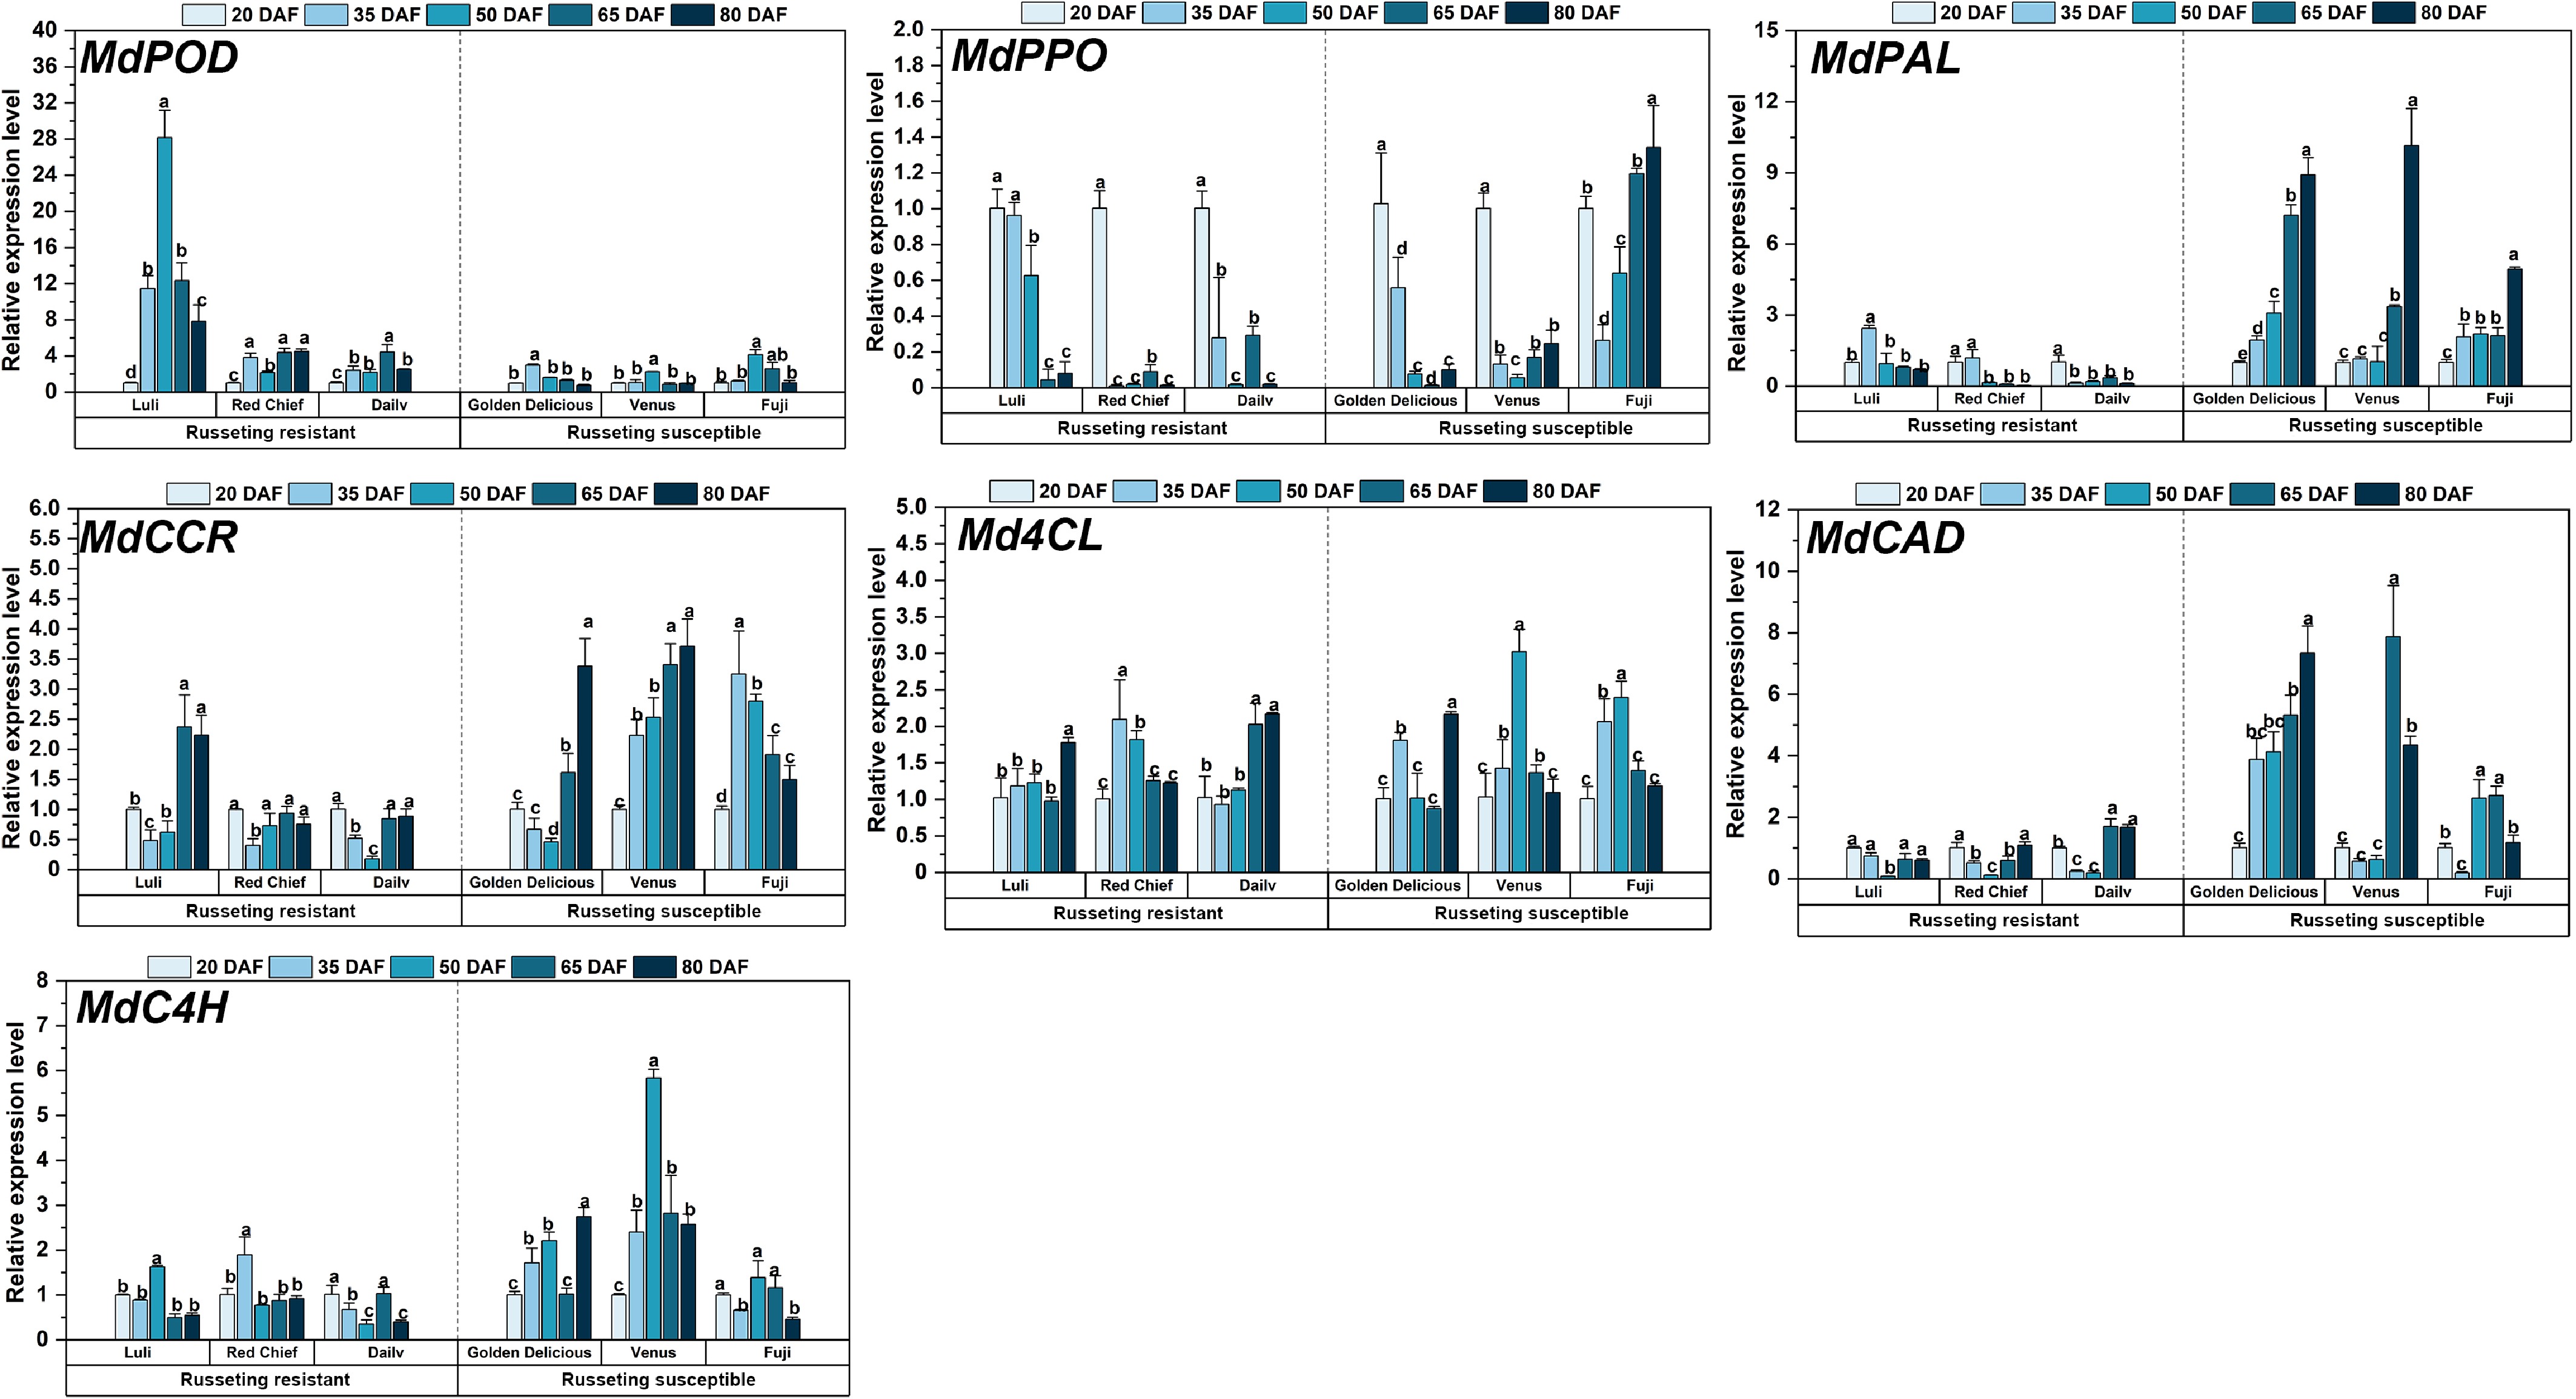
Figure 6.
Expression analysis of fruit russeting related genes during the growth and development of different apple cultivars. Error bars represent the means ± SD (n = 3) taken from three independent biological replicates. Different letters represent significant differences (one-way ANOVA, Tukey-Kramer test, p < 0.05). DAF = days after flowering.
-
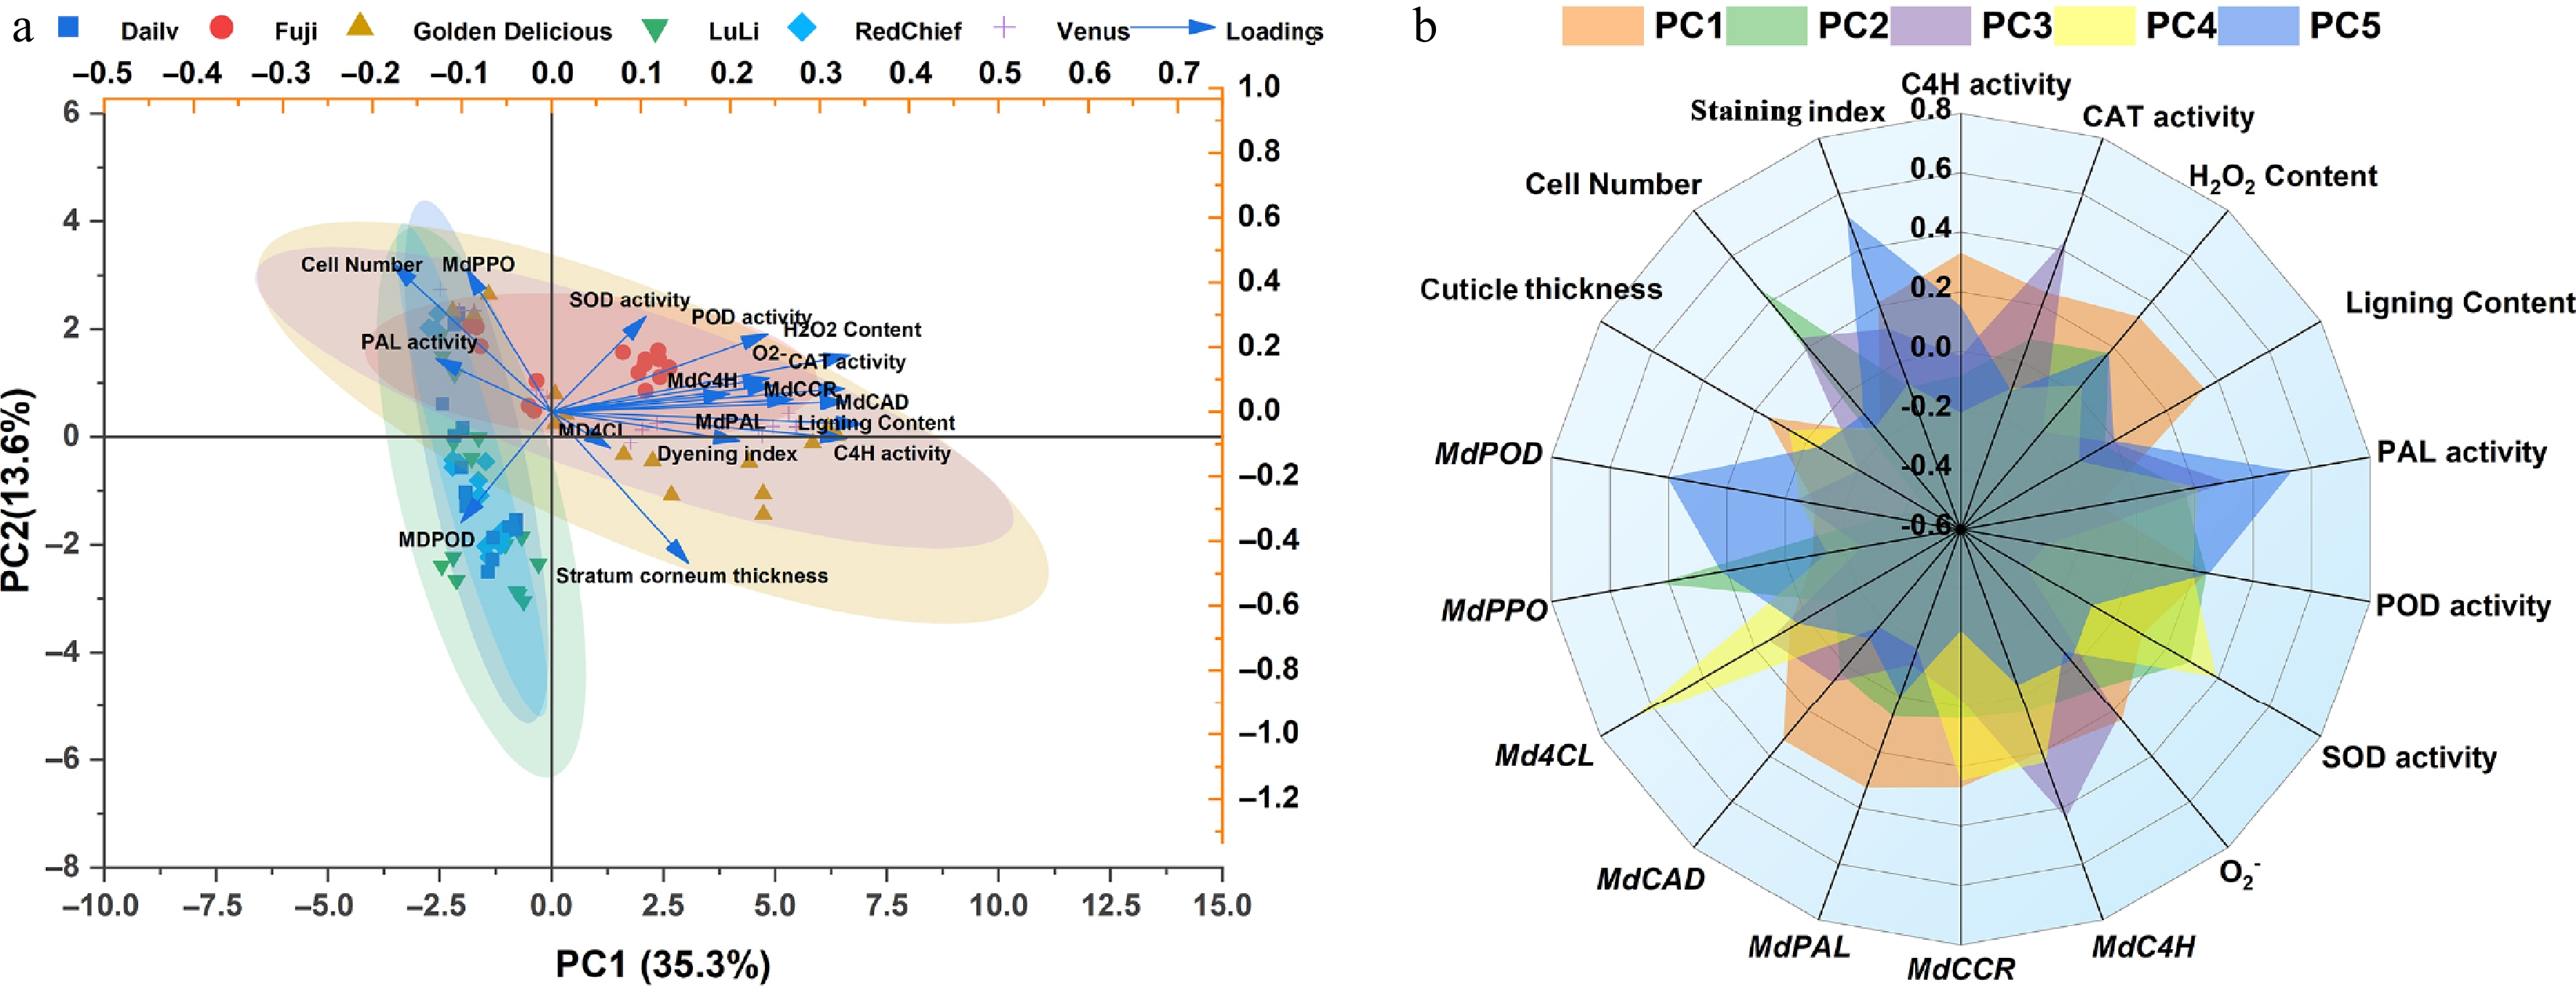
Figure 7.
Principal component analysis between russeting-resistant and russeting-susceptible apple cultivars. (a) Principal component analysis (PCA). (b) Radar plot showing the scaled activities of TAPFs.
-
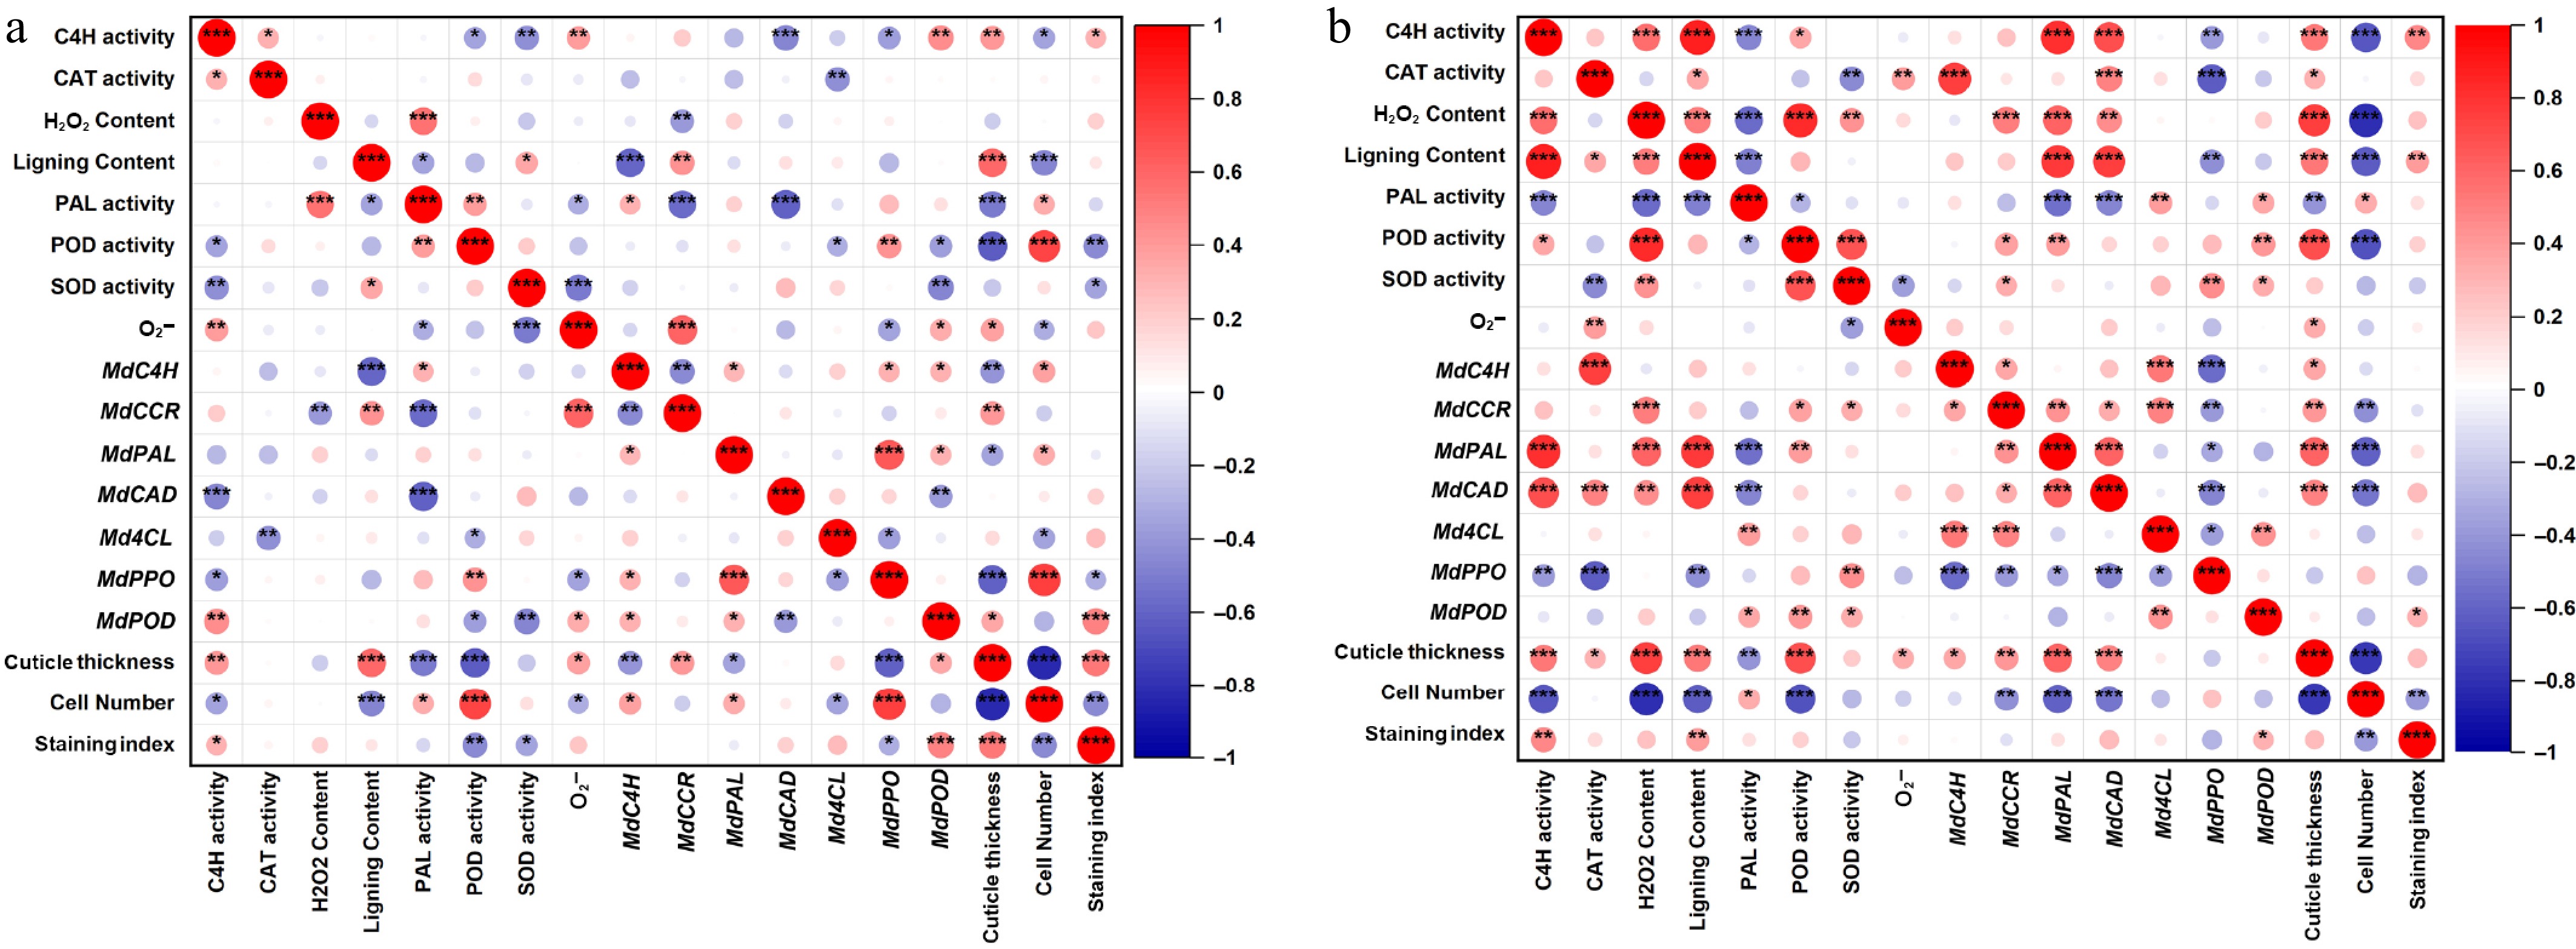
Figure 8.
Correlation analysis between russeting-resistant and russeting-susceptible apple cultivars. (a) Correlation analysis of russeting-resistant apple cultivars. (b) Correlation analysis of russeting-susceptible apple cultivars.
Figures
(8)
Tables
(0)