-
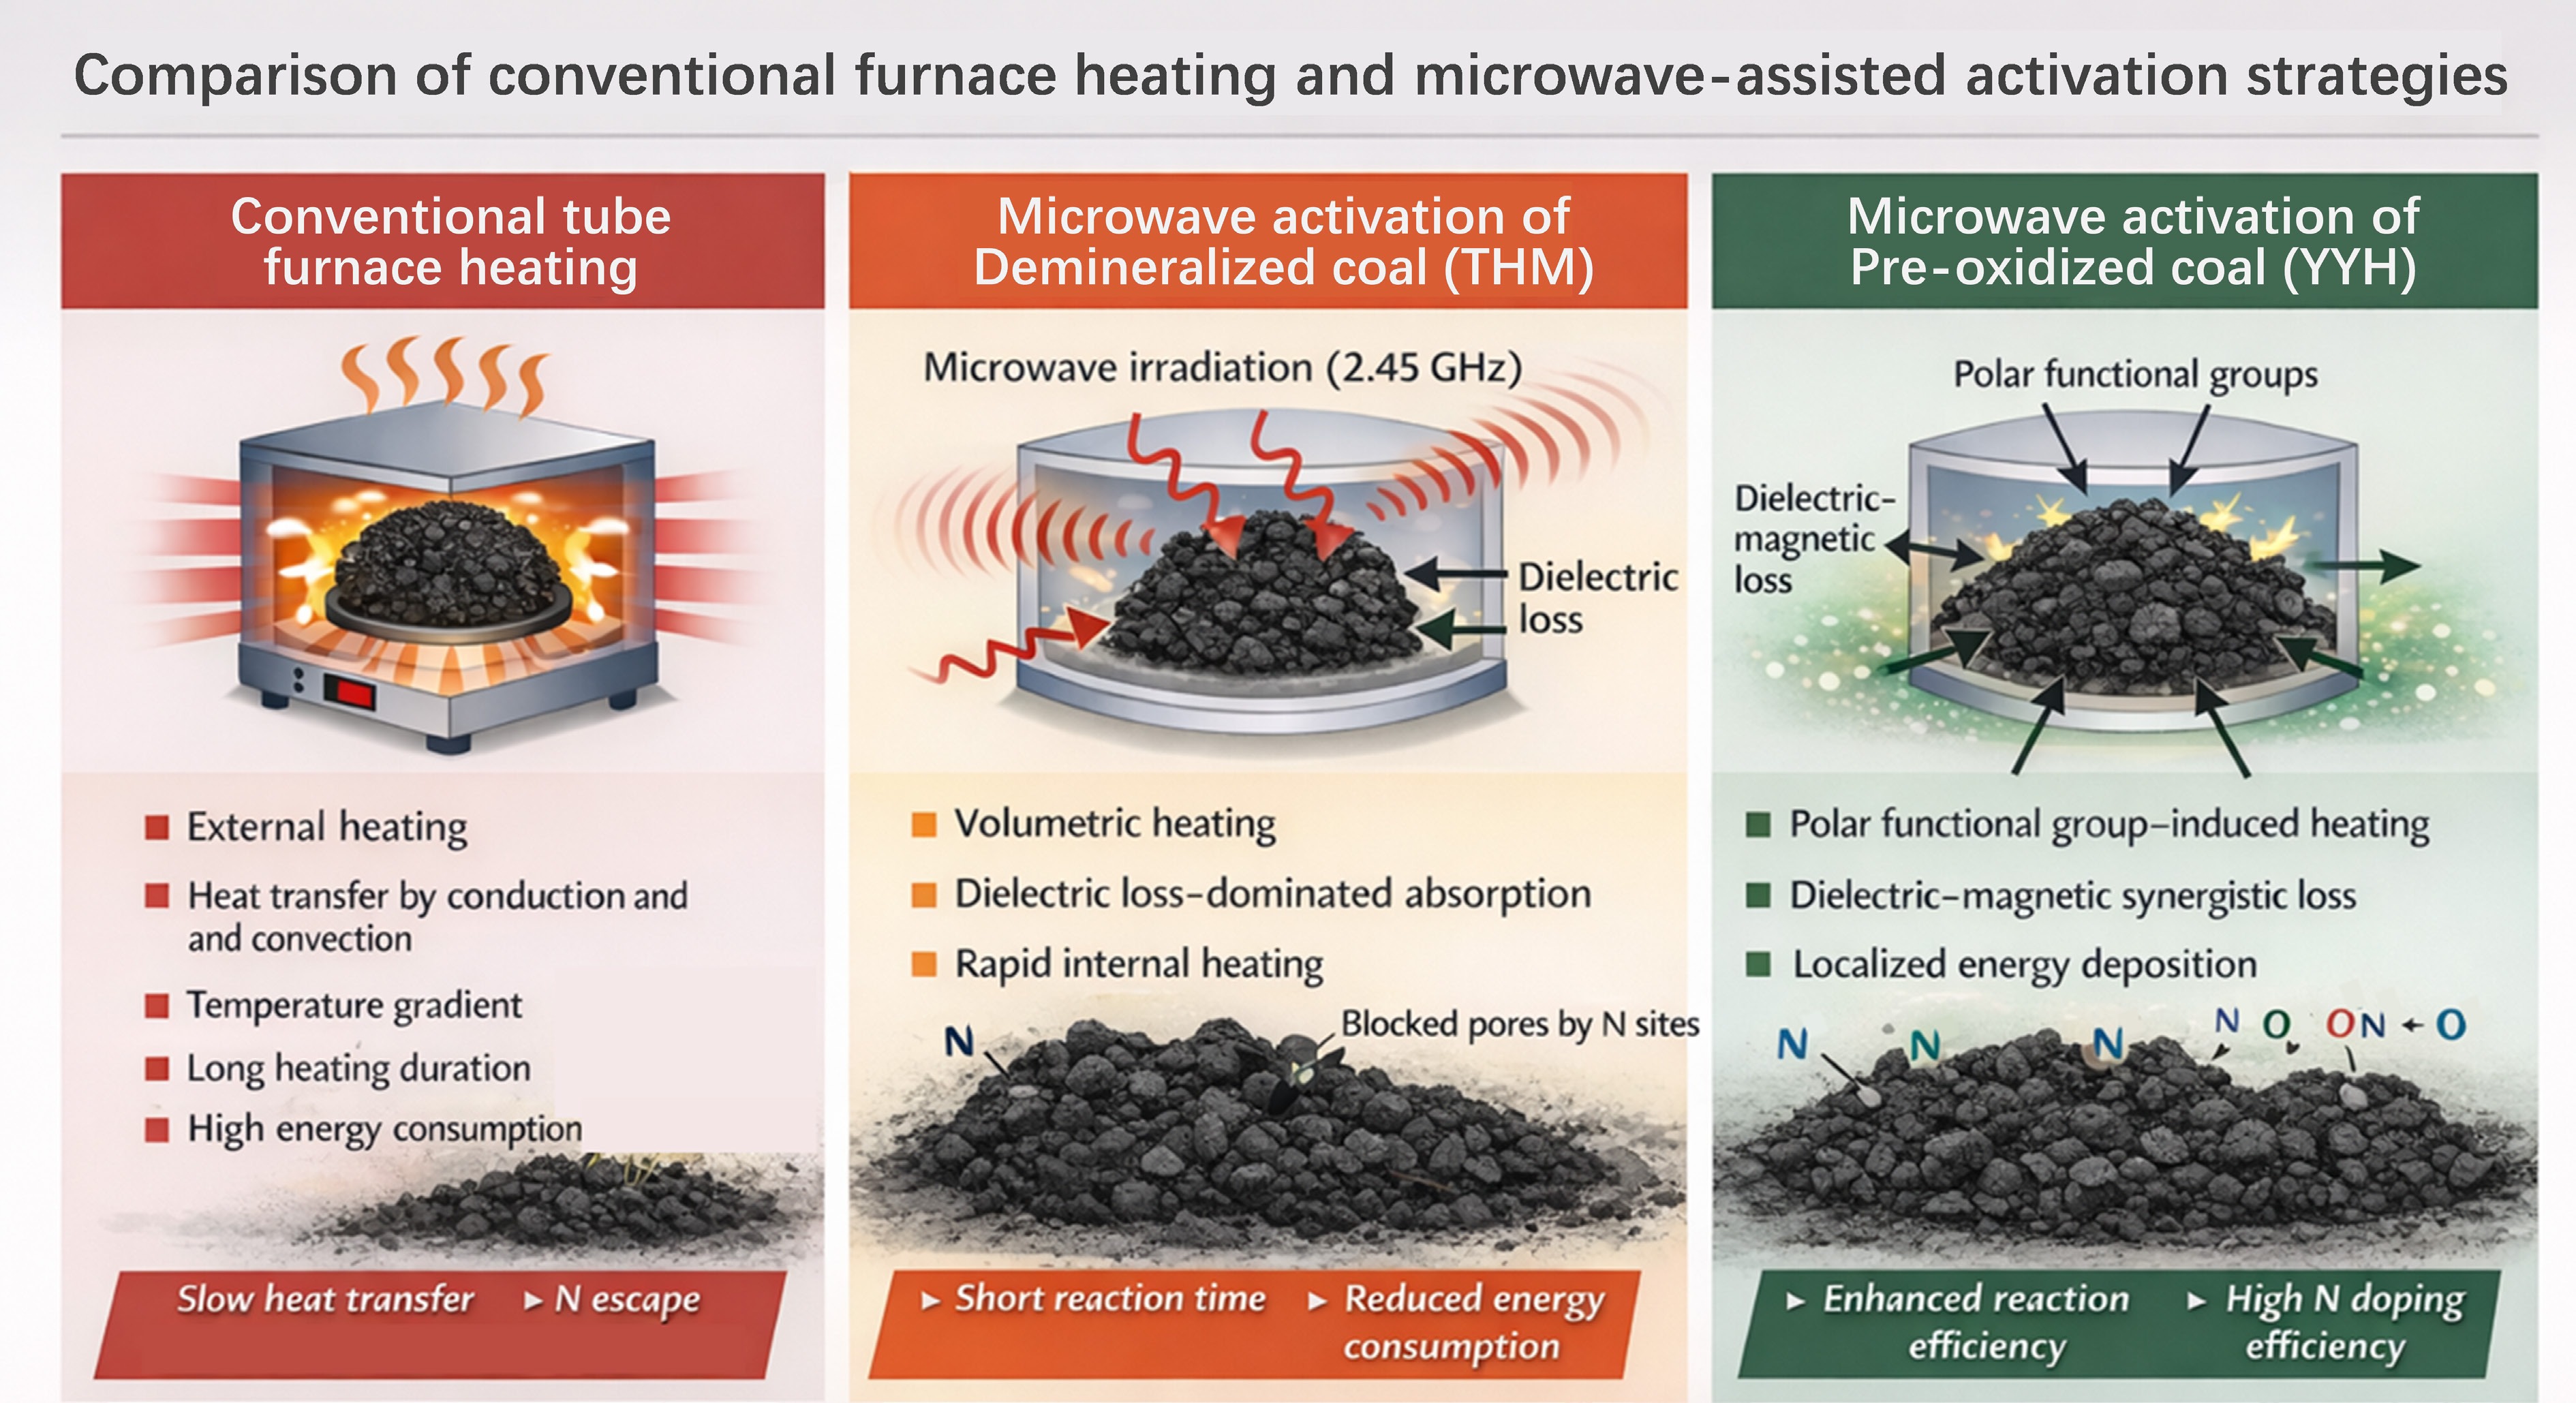
Figure 1.
Comparison of conventional furnace heating and microwave-assisted activation strategies.
-
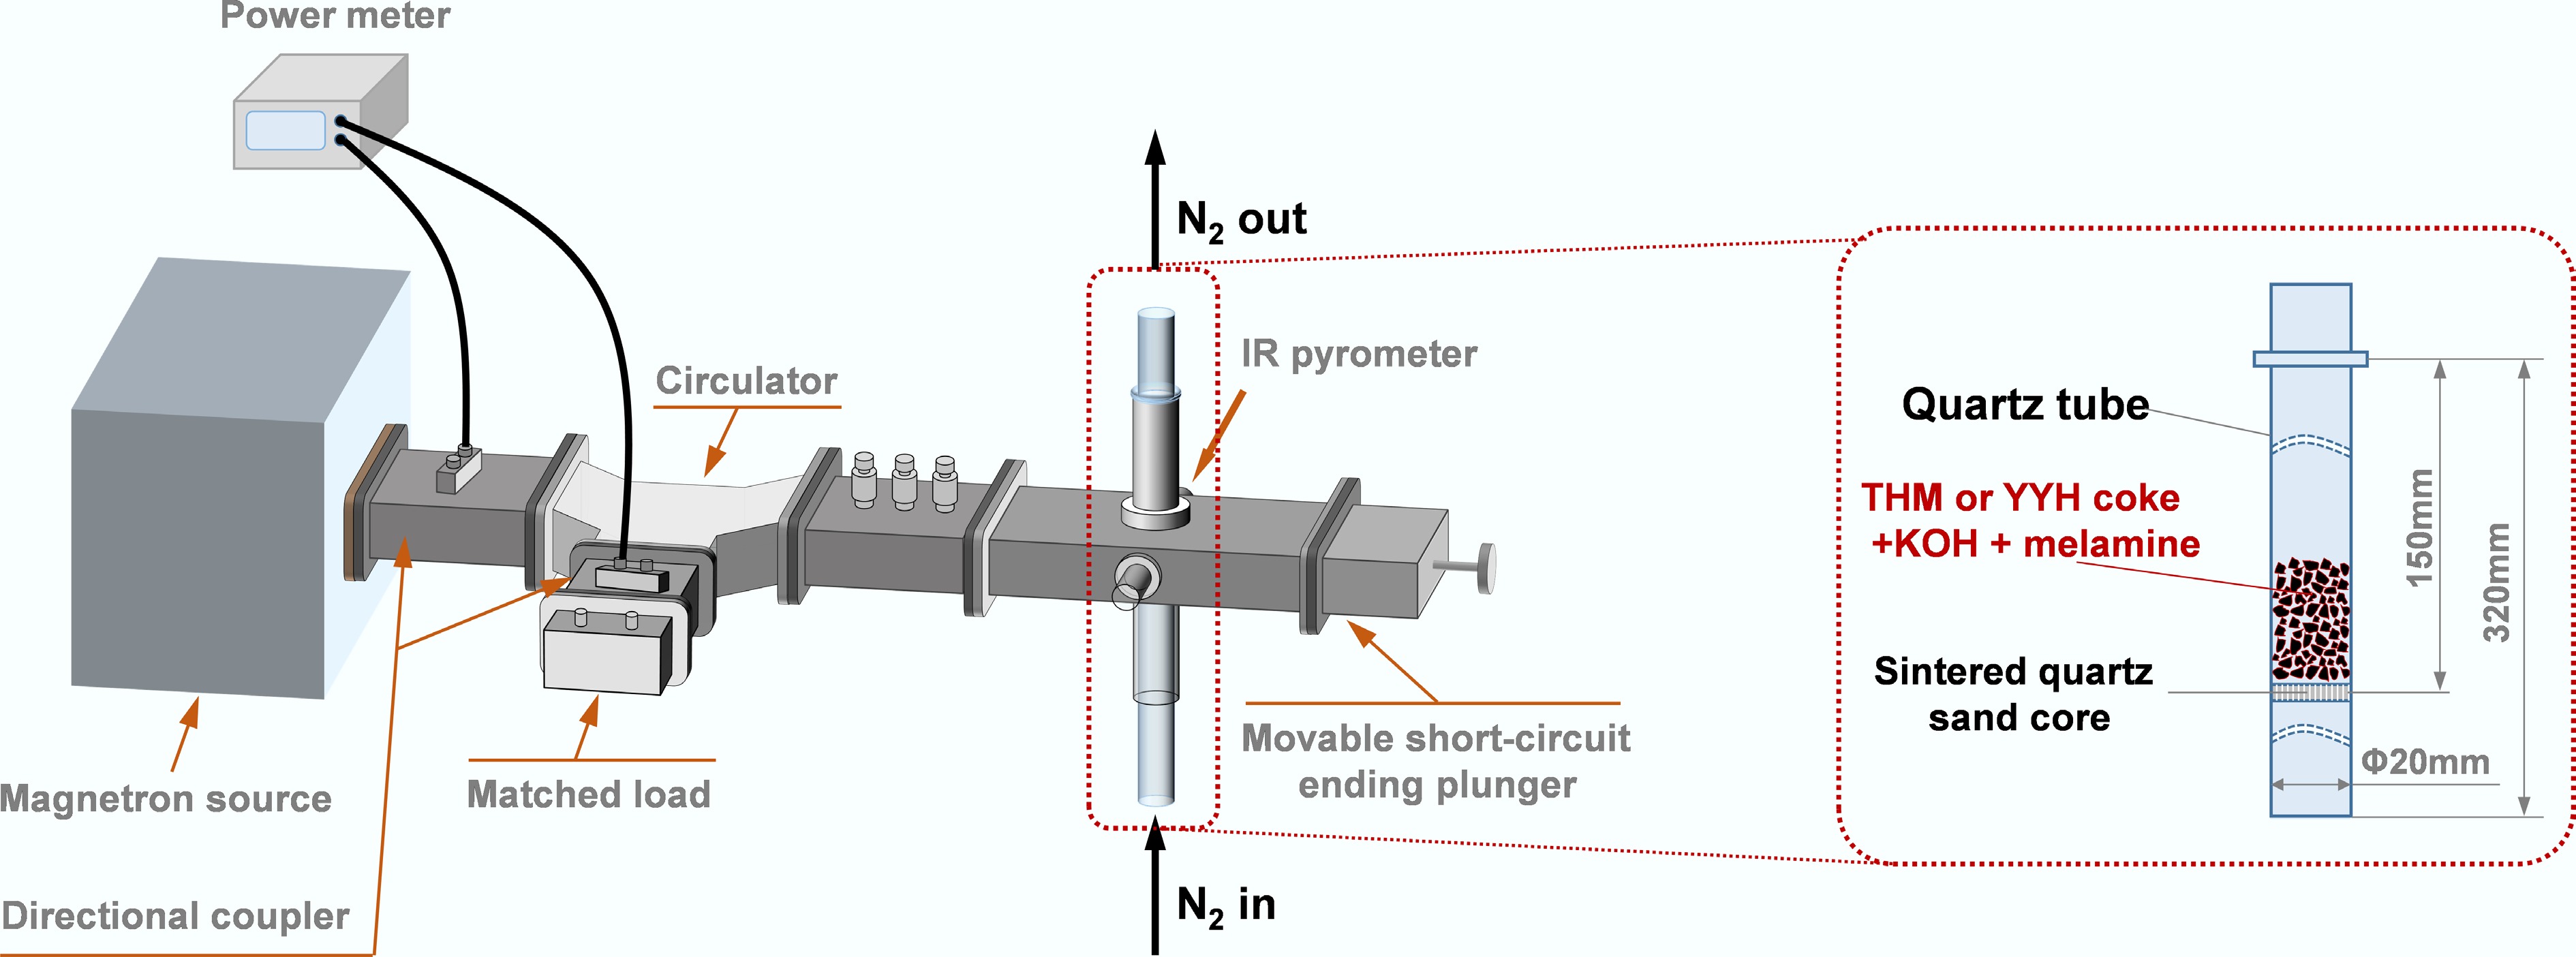
Figure 2.
Microwave heating system.
-
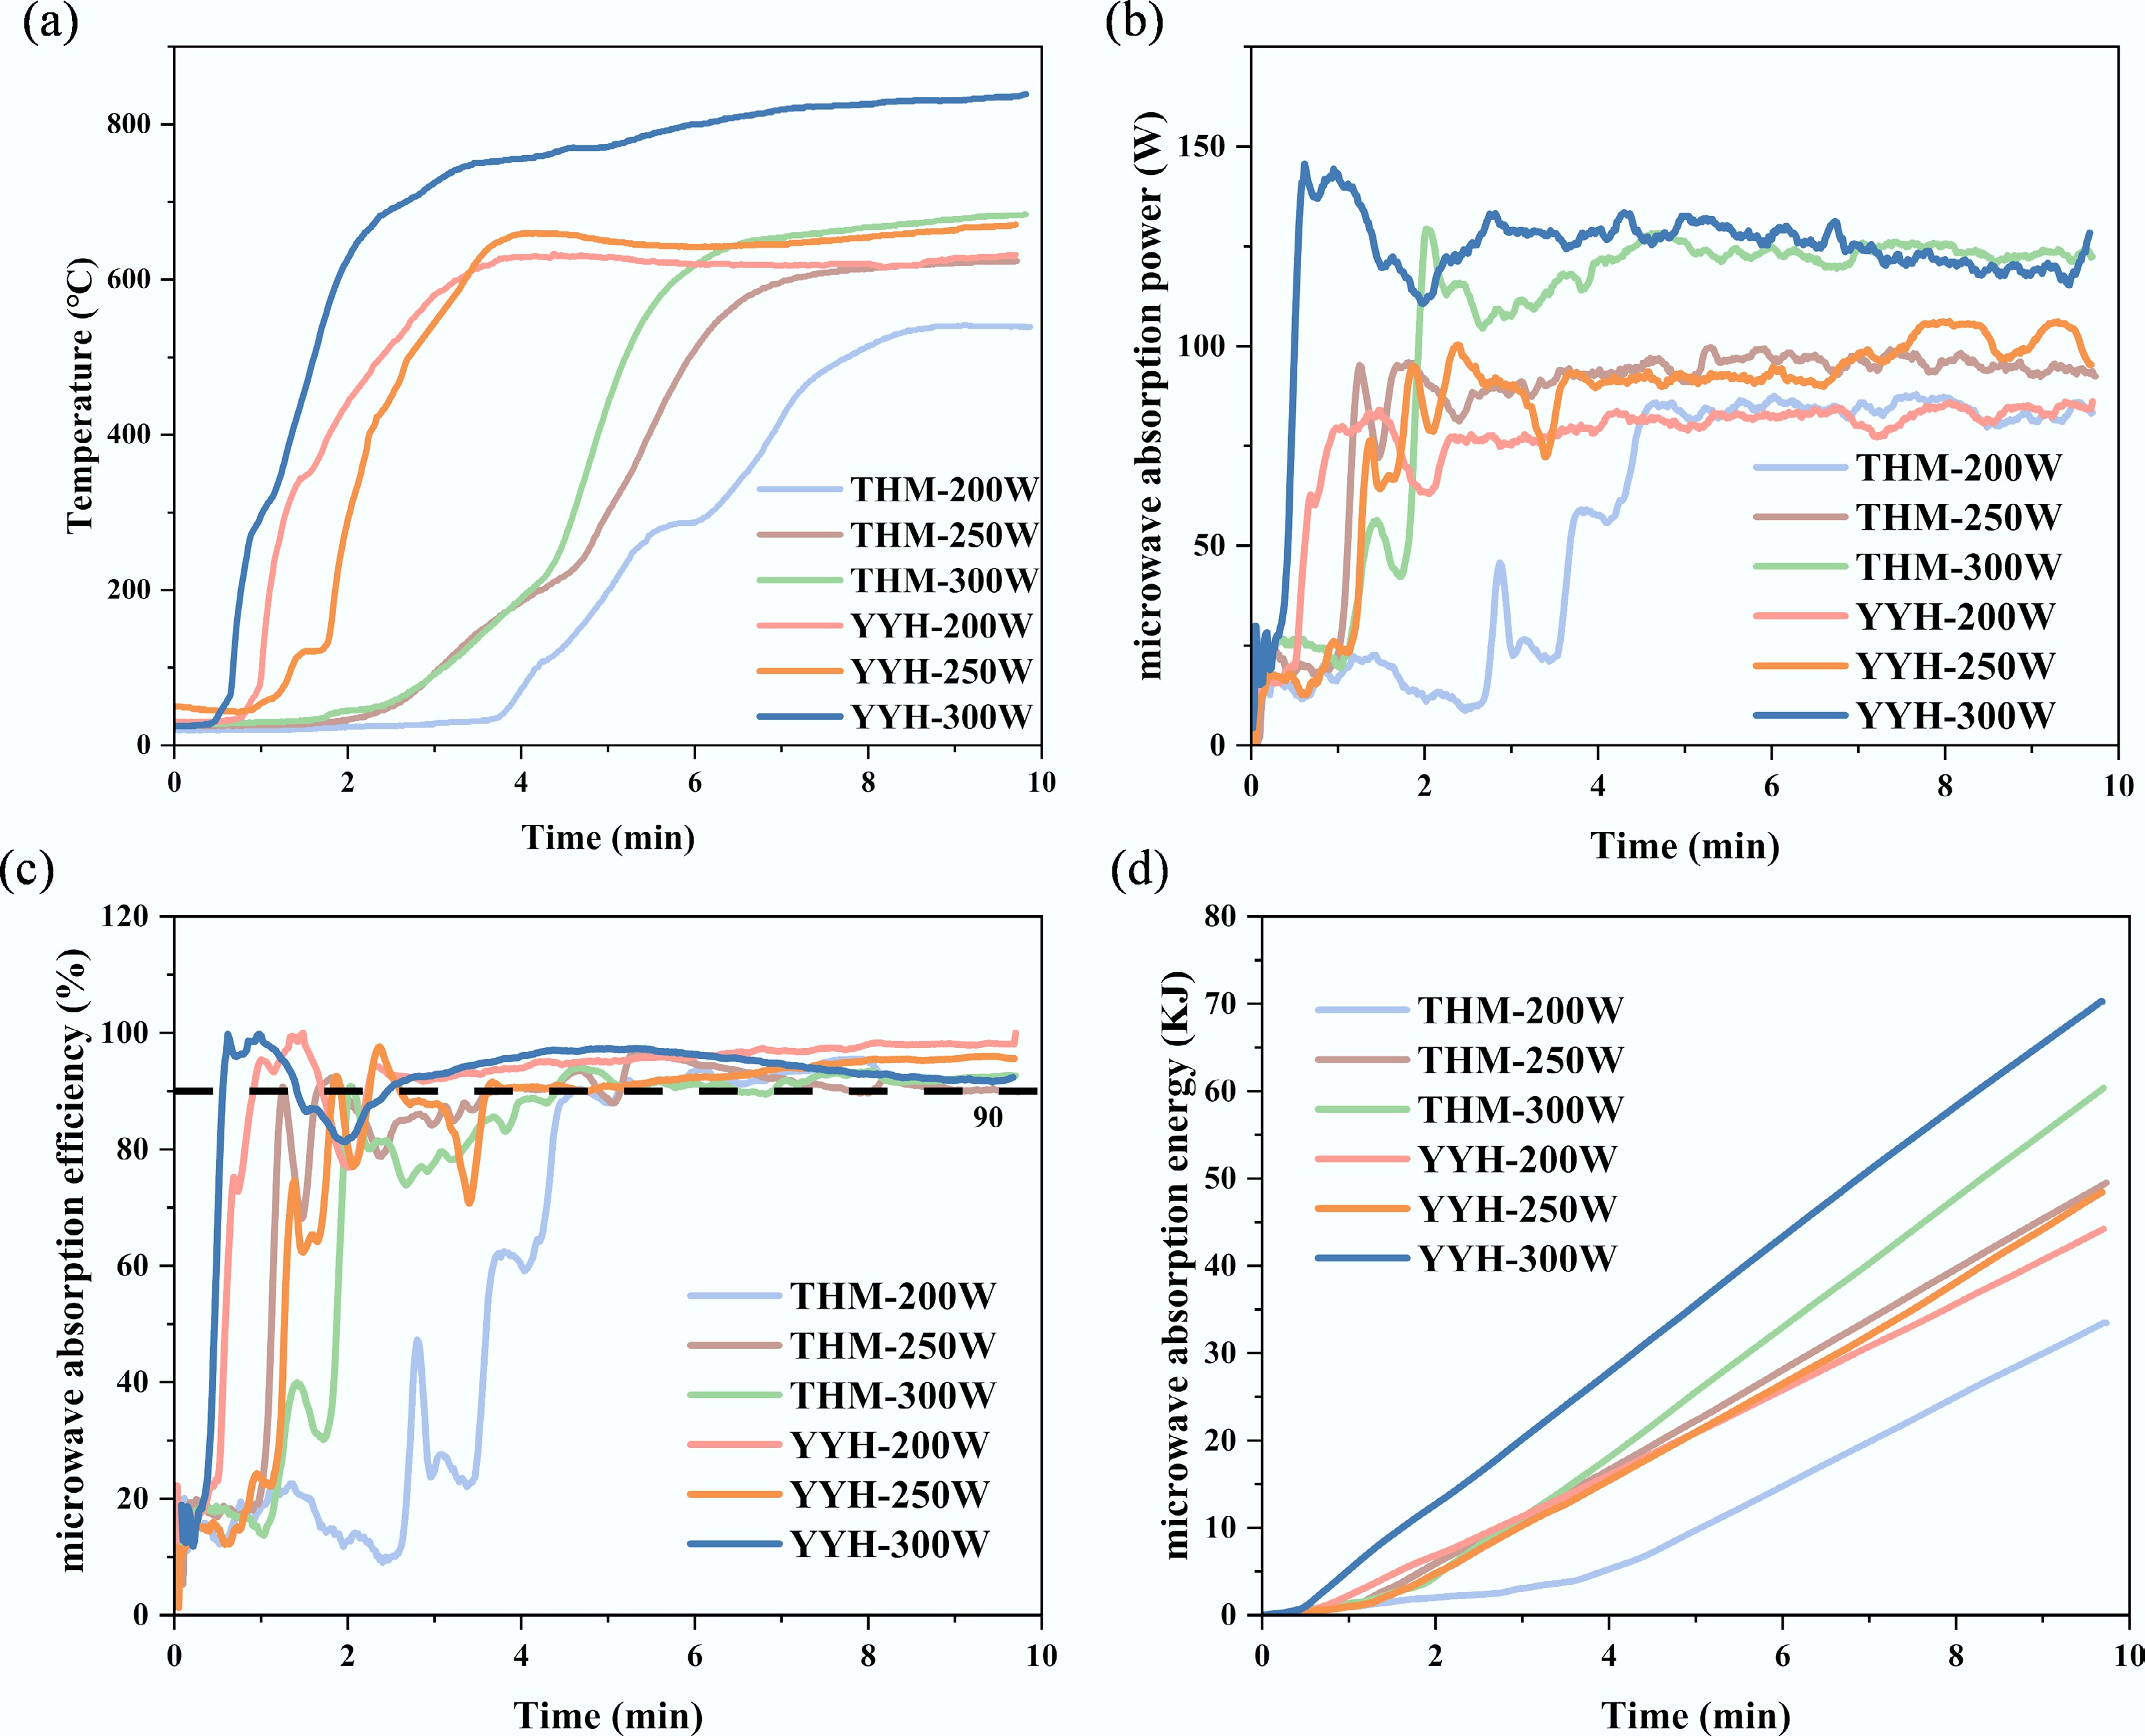
Figure 3.
Microwave heating system and heating characteristics: (a) temperature, (b) microwave absorption power, (c) microwave absorption efficiency, and (d) microwave absorption energy of different samples.
-
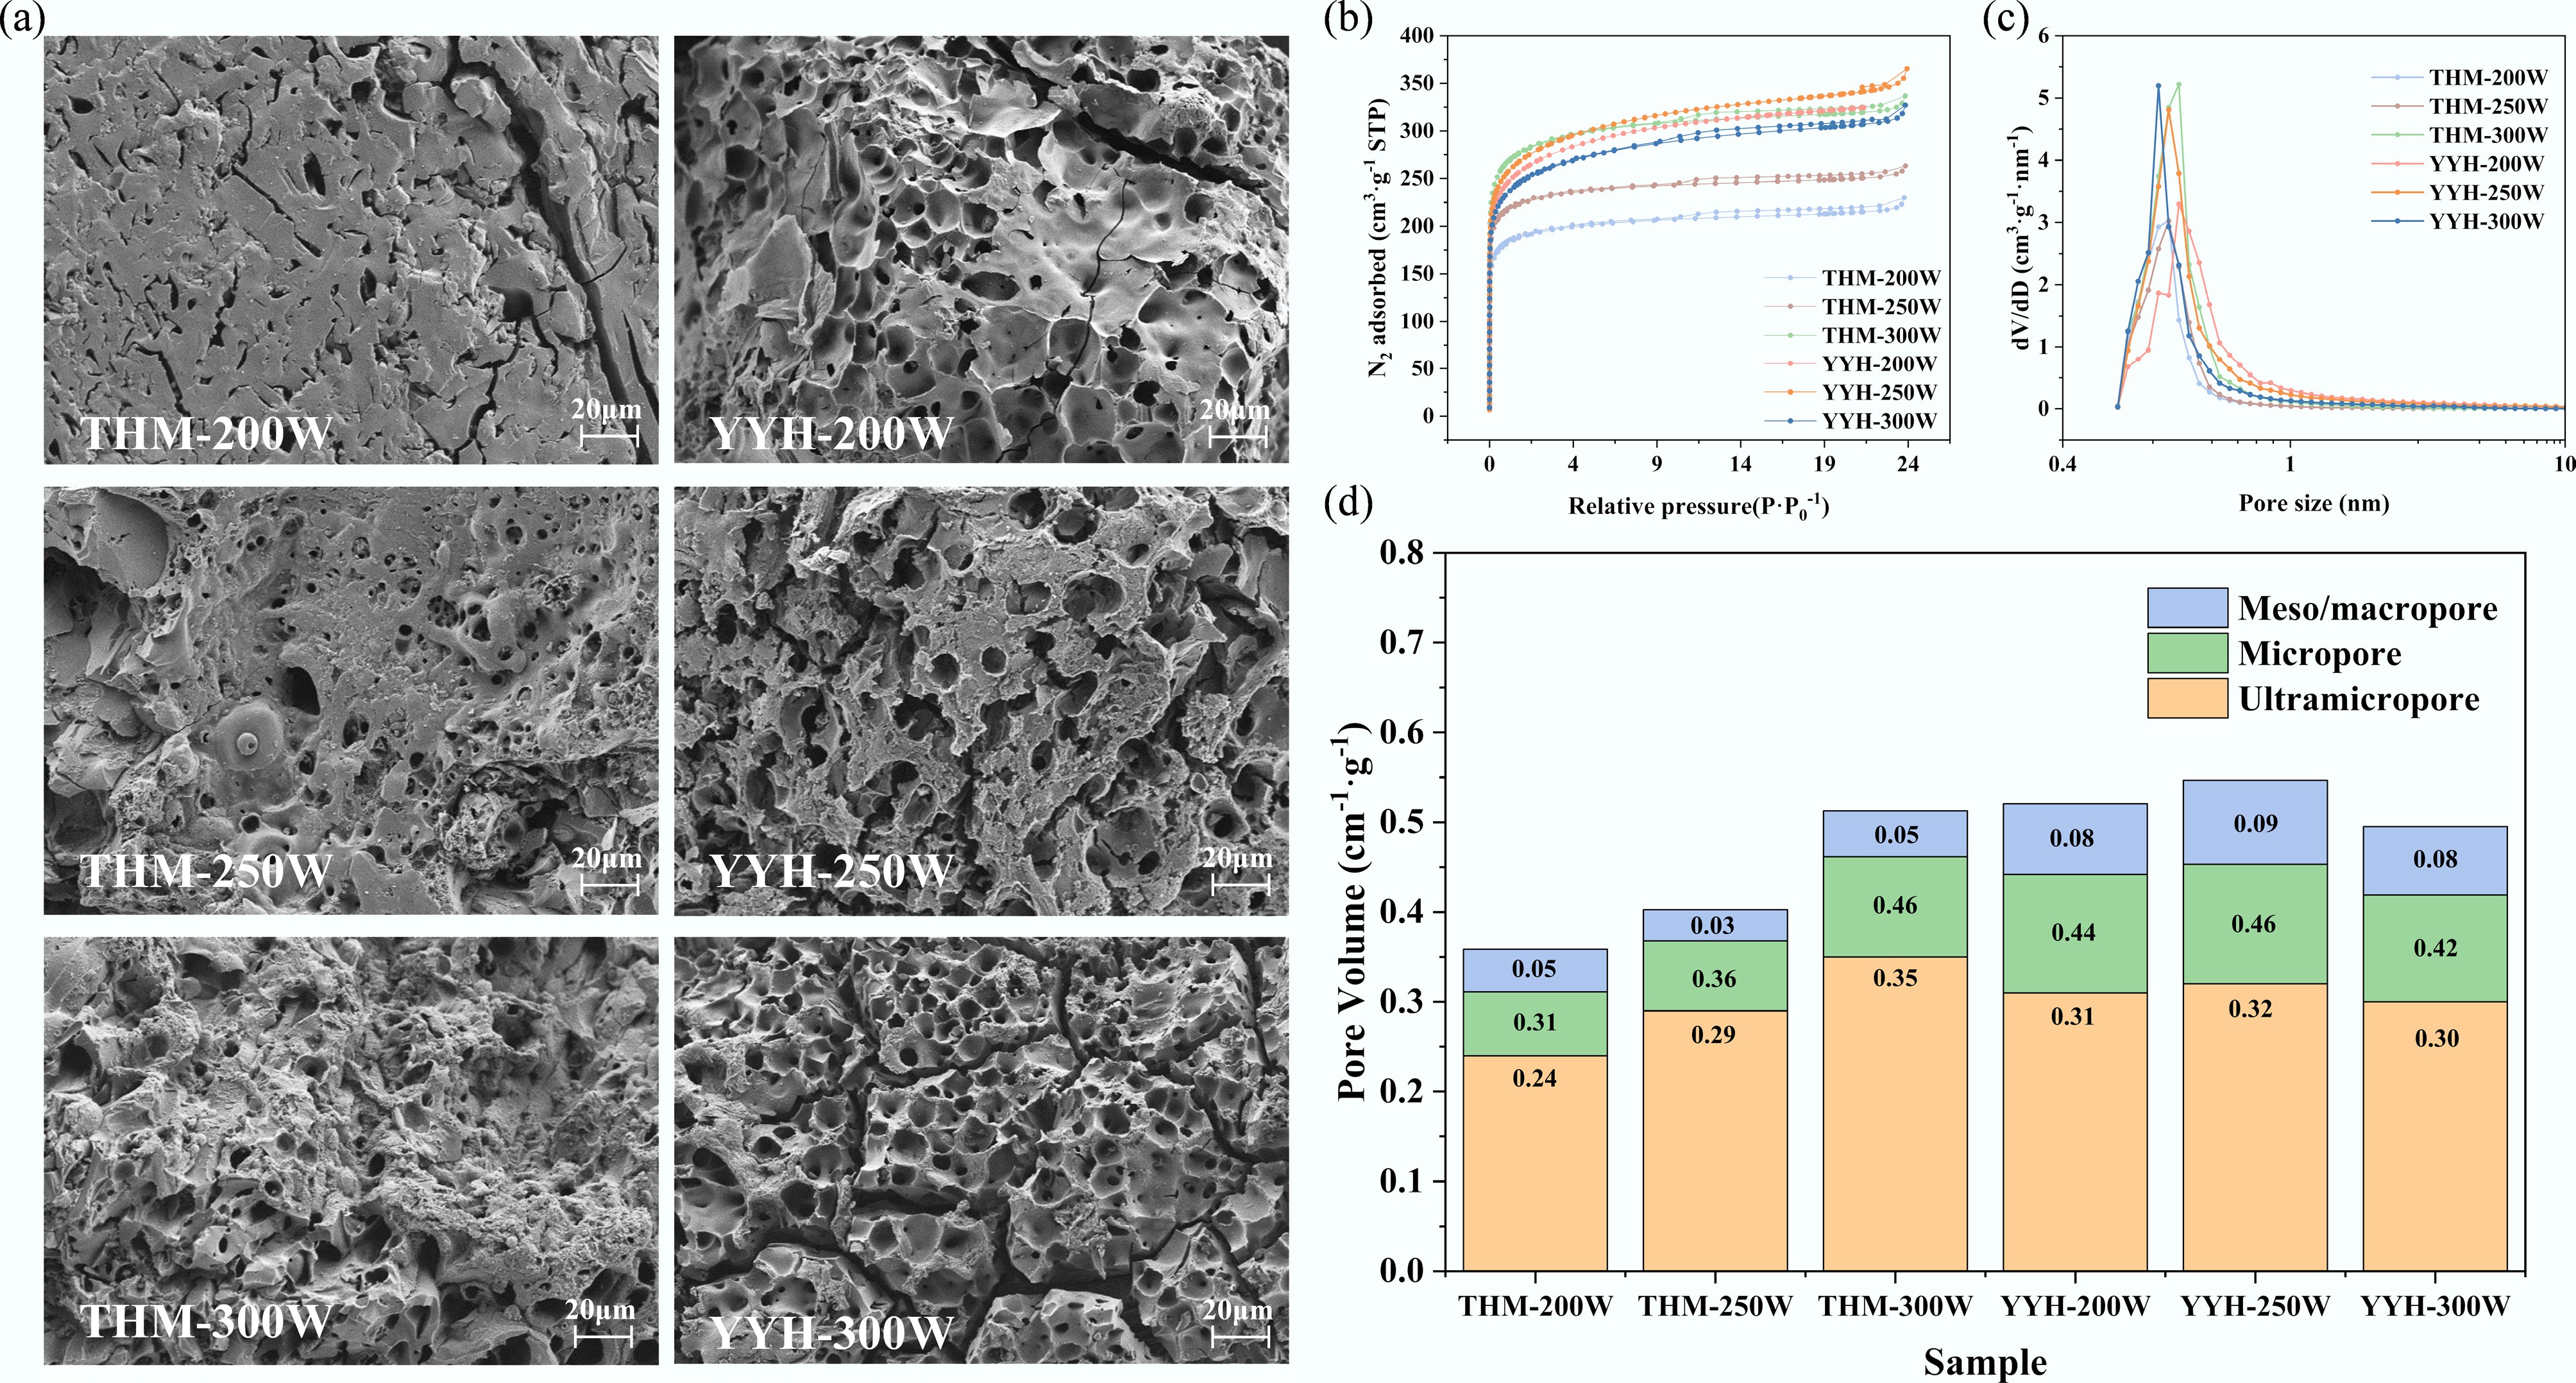
Figure 4.
The morphology and pore structure of samples: (a) SEM images, (b) N2 adsorption–desorption isotherms, (c) NLDFT pore size distributions of samples, and (d) the micropore volume, meso/macropore volume, and ultramicro volume of samples.
-
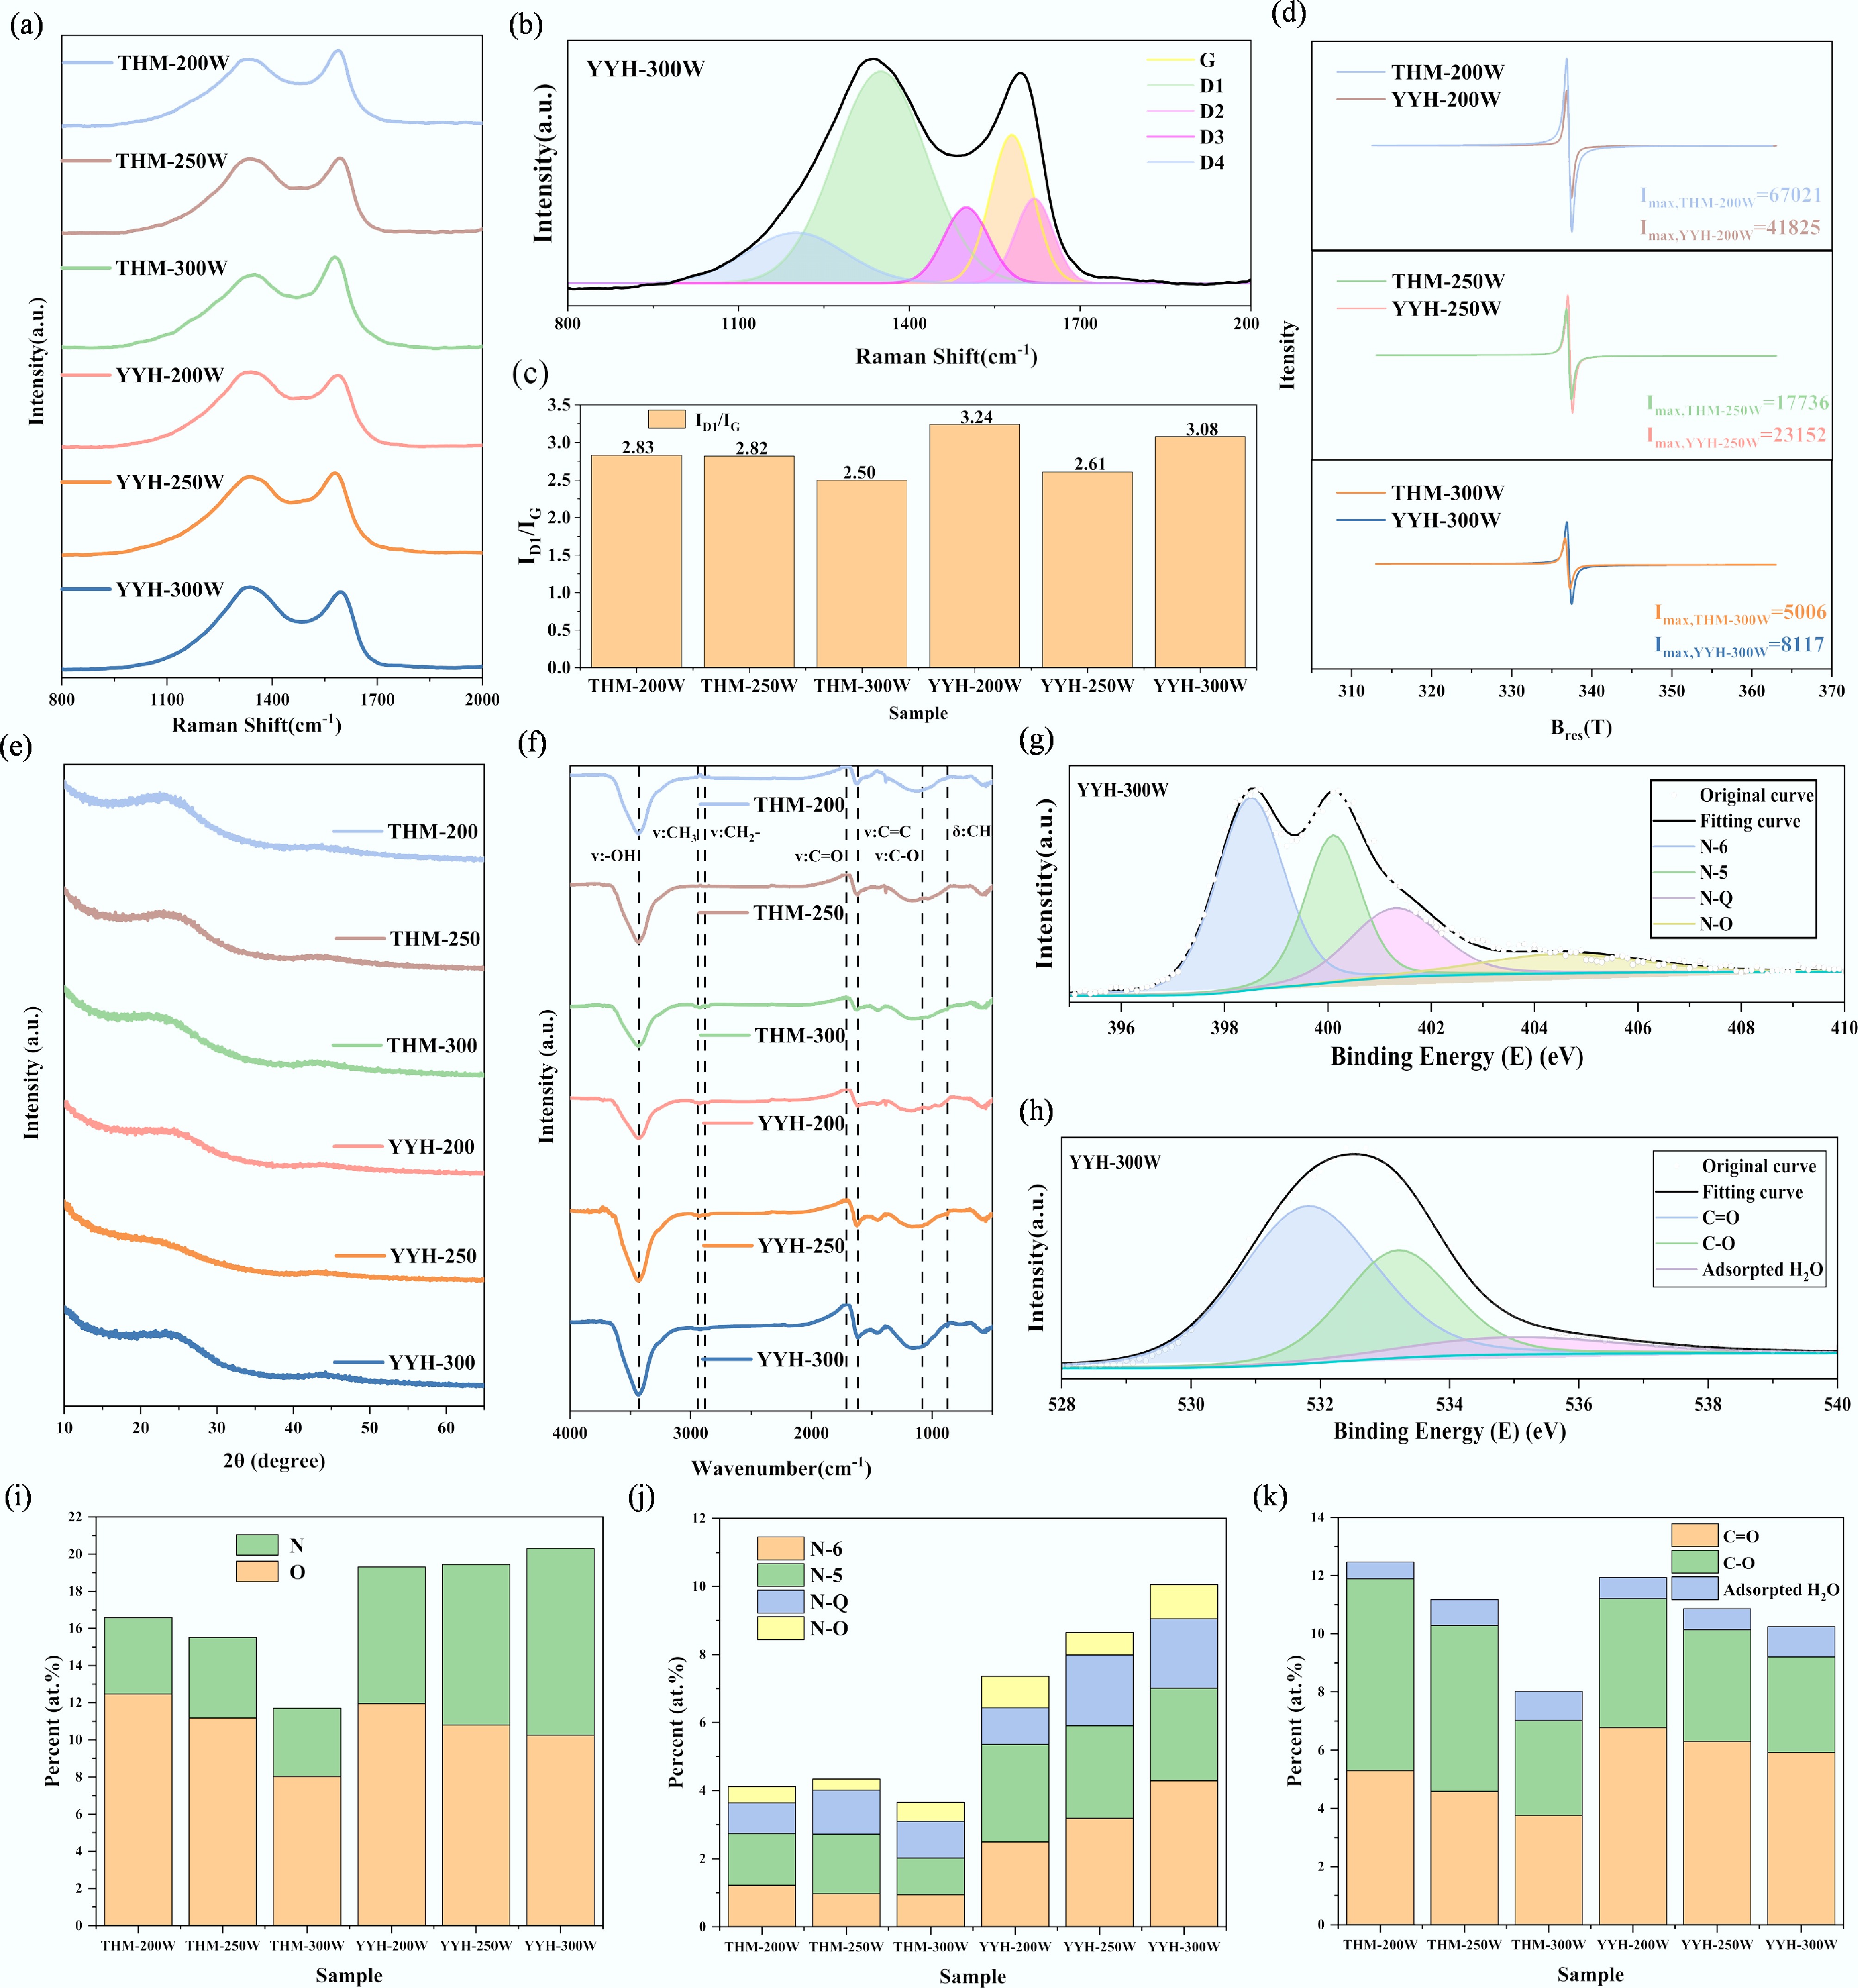
Figure 5.
Physicochemical structure characterizations: (a) Raman spectrum, (b) Raman spectrum fitted into five bands of CH-0, (c) ID1/IG, (d) EPR spectroscopy, (e) XRD spectrum, (f) FTIR spectrum, (g) deconvoluted N1s spectrum of YYH-300W, (h) deconvoluted O1s spectrum of YYH-300W, (i) nitrogen and oxygen content of samples, (j) nitrogen functional groups distributions, and (k) oxygen functional groups distributions.
-
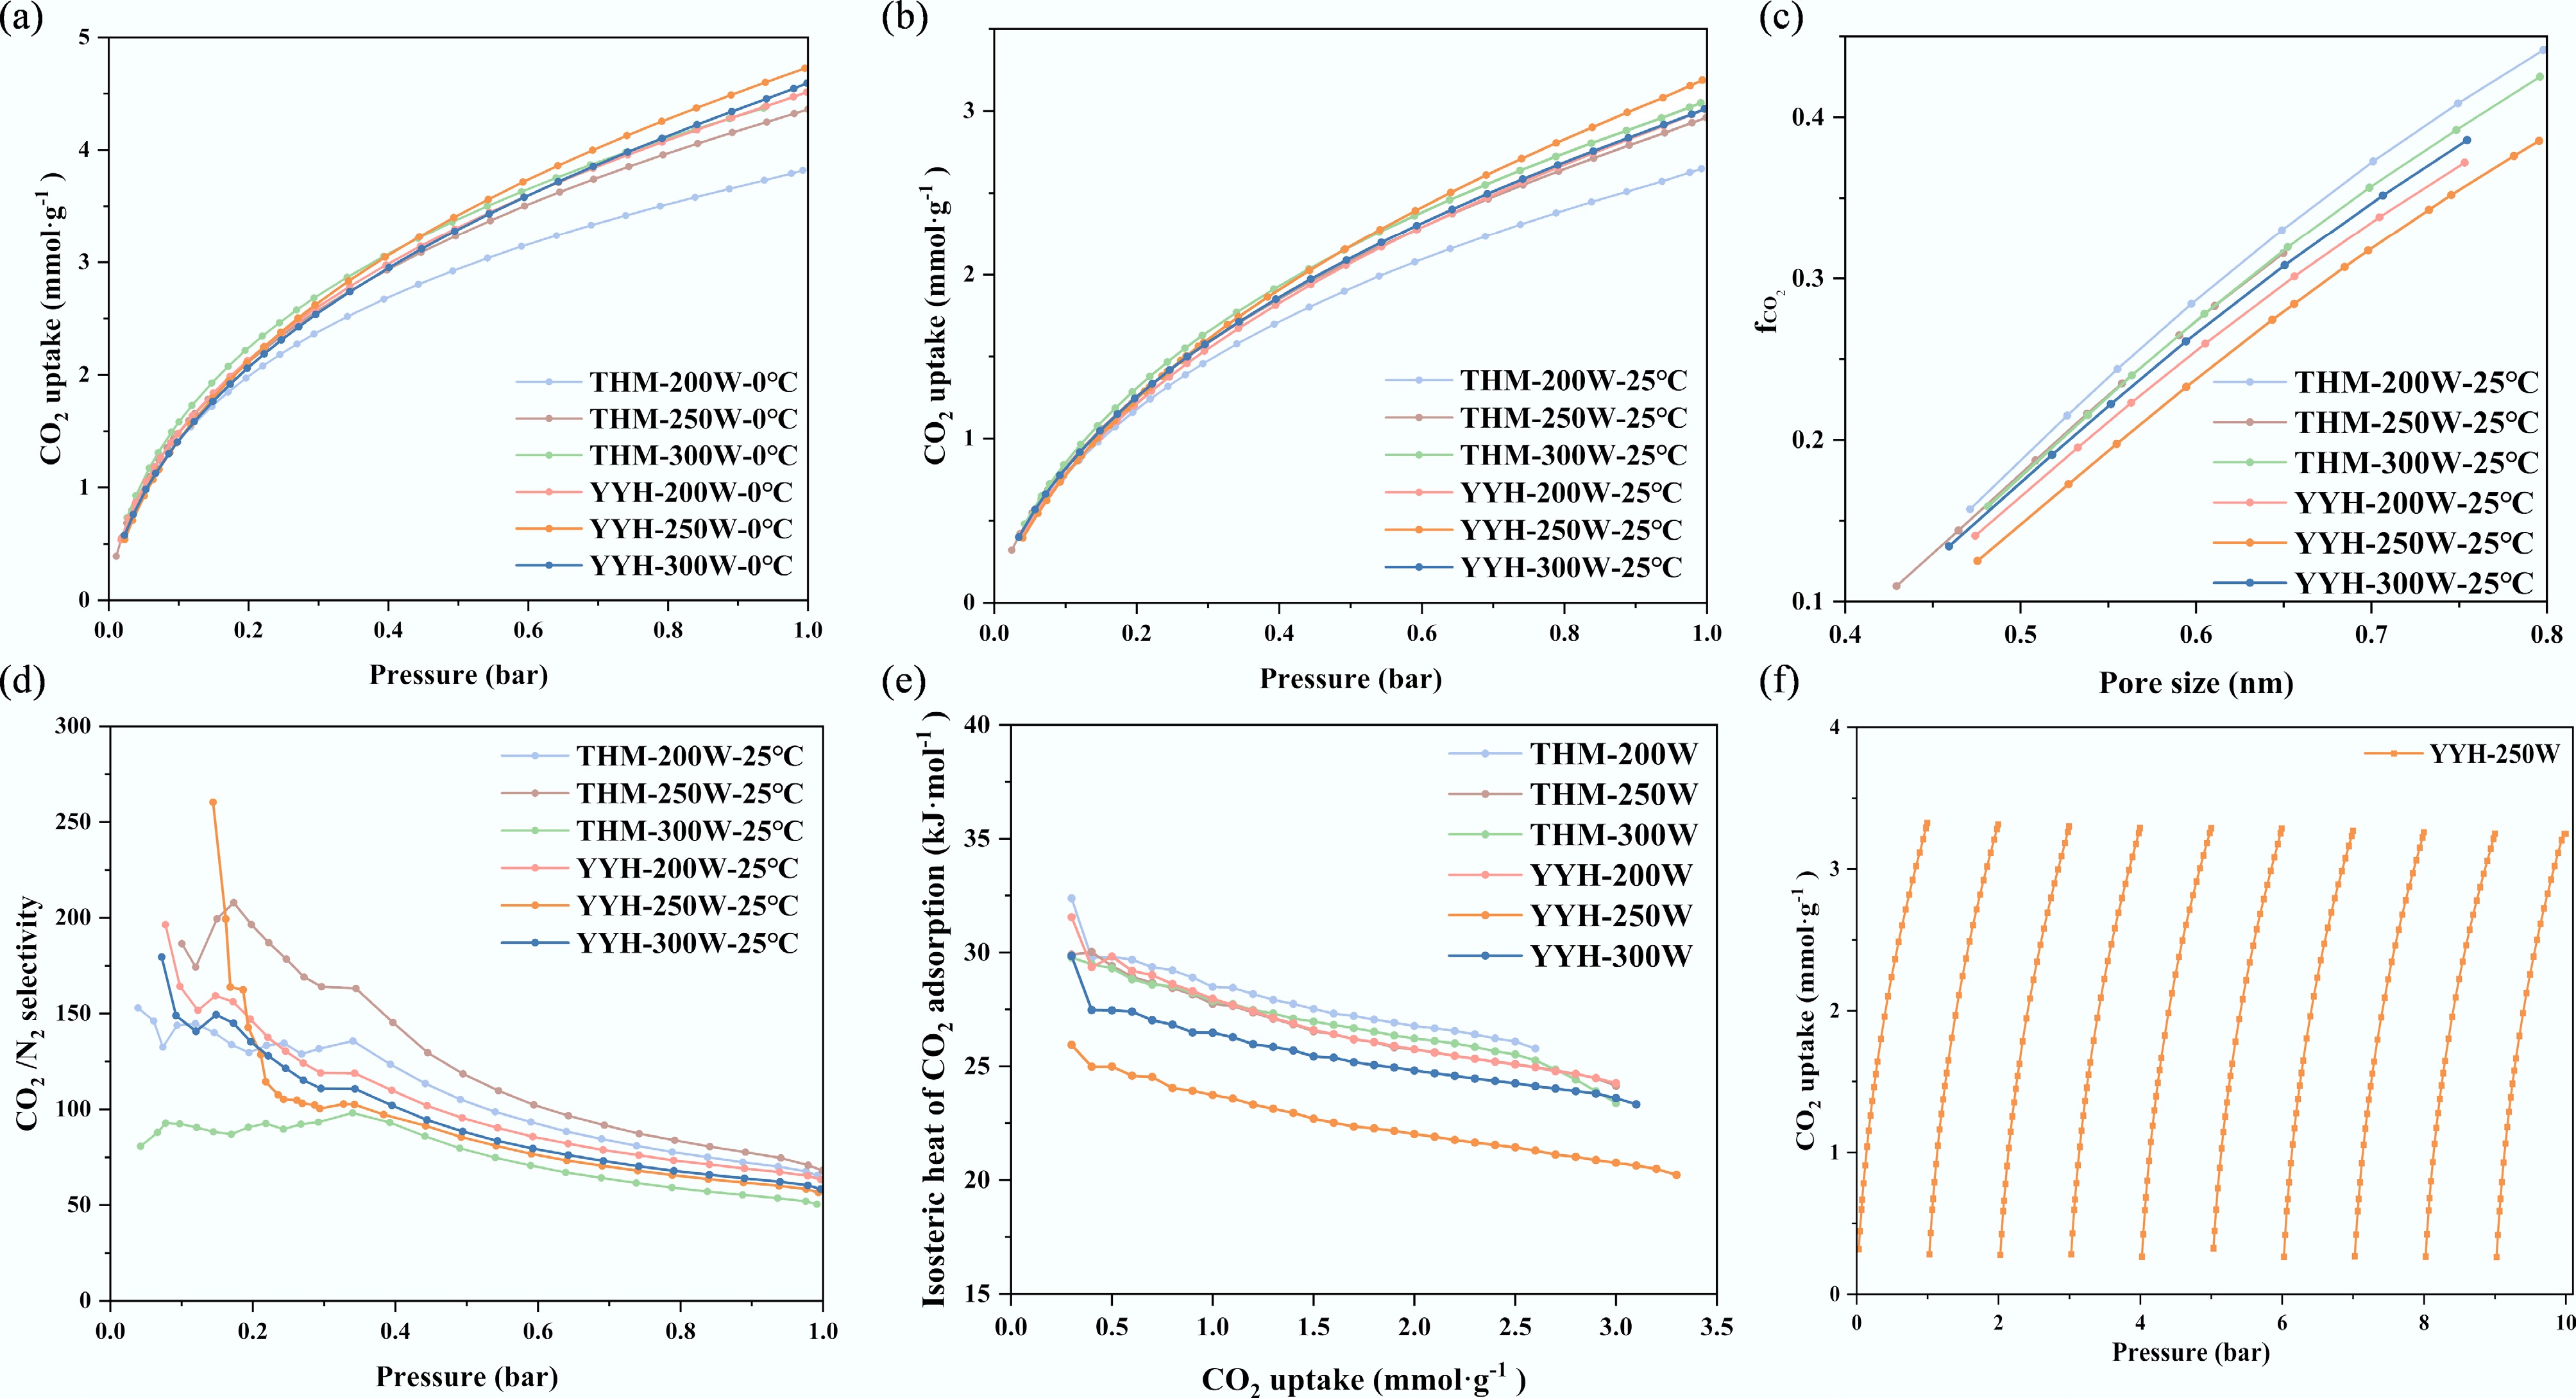
Figure 6.
The adsorption characteristics of CO2. CO2 adsorption isotherms at (a) 0 °C, and (b) 25 °C, (c) the fraction of micropore filling by CO2 (
$f_{\rm CO_2} $ -
Sample SBET
(m2·g−1)Vmicro
(cm3·g−1)Vtotal
(cm3·g−1)Vmicro/Vtotal
(%)Vultramicro
(cm3·g−1)Vultramicro/
Vtotal (%)H–K average pore
size (nm)THM-200 767 0.31 0.36 86.62 0.24 66.61 0.70 THM-250 910 0.36 0.40 91.27 0.29 71.74 0.67 THM-300 1131 0.46 0.51 89.94 0.35 68.01 0.70 YYH-200 1057 0.44 0.52 84.76 0.31 59.27 0.70 YYH-250 1103 0.46 0.55 82.99 0.32 58.73 0.70 YYH-300 1008 0.42 0.49 84.47 0.30 60.31 0.69 Table 1.
Parameters of pore structure for ACs
-
Sample ID1/IG La (nm) Lc (nm) d002 (nm) Ipeak,EPR THM-200 2.83 4.43 0.94 0.38 67,021 THM-250 2.82 3.40 1.00 0.35 17,736 THM-300 2.50 3.49 0.95 0.38 5,006 YYH-200 3.24 4.15 1.03 0.37 41,825 YYH-250 2.61 3.06 0.92 0.39 23,152 YYH-300 3.08 3.51 0.97 0.38 8,117 Table 2.
Physicochemical structural parameters of ACs
-
Sample C1s (at.%) O1s (at.%) N1s (at.%) C=O (at.%) C–O (at.%) N-6 (at.%) N-5 (at.%) N-Q (at.%) N-O (at.%) THM-200 83.41 12.47 4.12 5.3 6.59 1.22 1.52 0.9 0.48 THM-250 84.47 11.18 4.34 4.58 5.71 0.97 1.75 1.29 0.33 THM-300 88.3 8.03 3.67 3.76 3.26 0.94 1.08 1.08 0.56 YYH-200 80.69 11.95 7.36 6.78 4.43 2.49 2.87 1.07 0.93 YYH-250 80.55 10.8 8.65 6.3 3.84 3.19 2.72 2.08 0.66 YYH-300 80.81 10.25 10.06 5.92 3.29 4.29 2.72 2.04 1.01 Table 3.
Nitrogen and oxygen functional group contents of ACs
-
Sample CO2/0 °C CO2/25 °C N2/25 °C ${\boldsymbol f}_{\bf{ CO}_{\bf 2}} $ CO2/N2 selectivity (1 bar) THM-200 3.82 2.65 0.23 0.37 65 THM-250 4.36 2.96 0.25 0.36 68 THM-300 4.37 3.05 0.34 0.36 50 YYH-200 4.51 3.01 0.27 0.34 63 YYH-250 4.72 3.33 0.32 0.32 57 YYH-300 4.59 3.01 0.29 0.35 58 Table 4.
CO2 adsorption characteristics of ACs
Figures
(6)
Tables
(4)