-
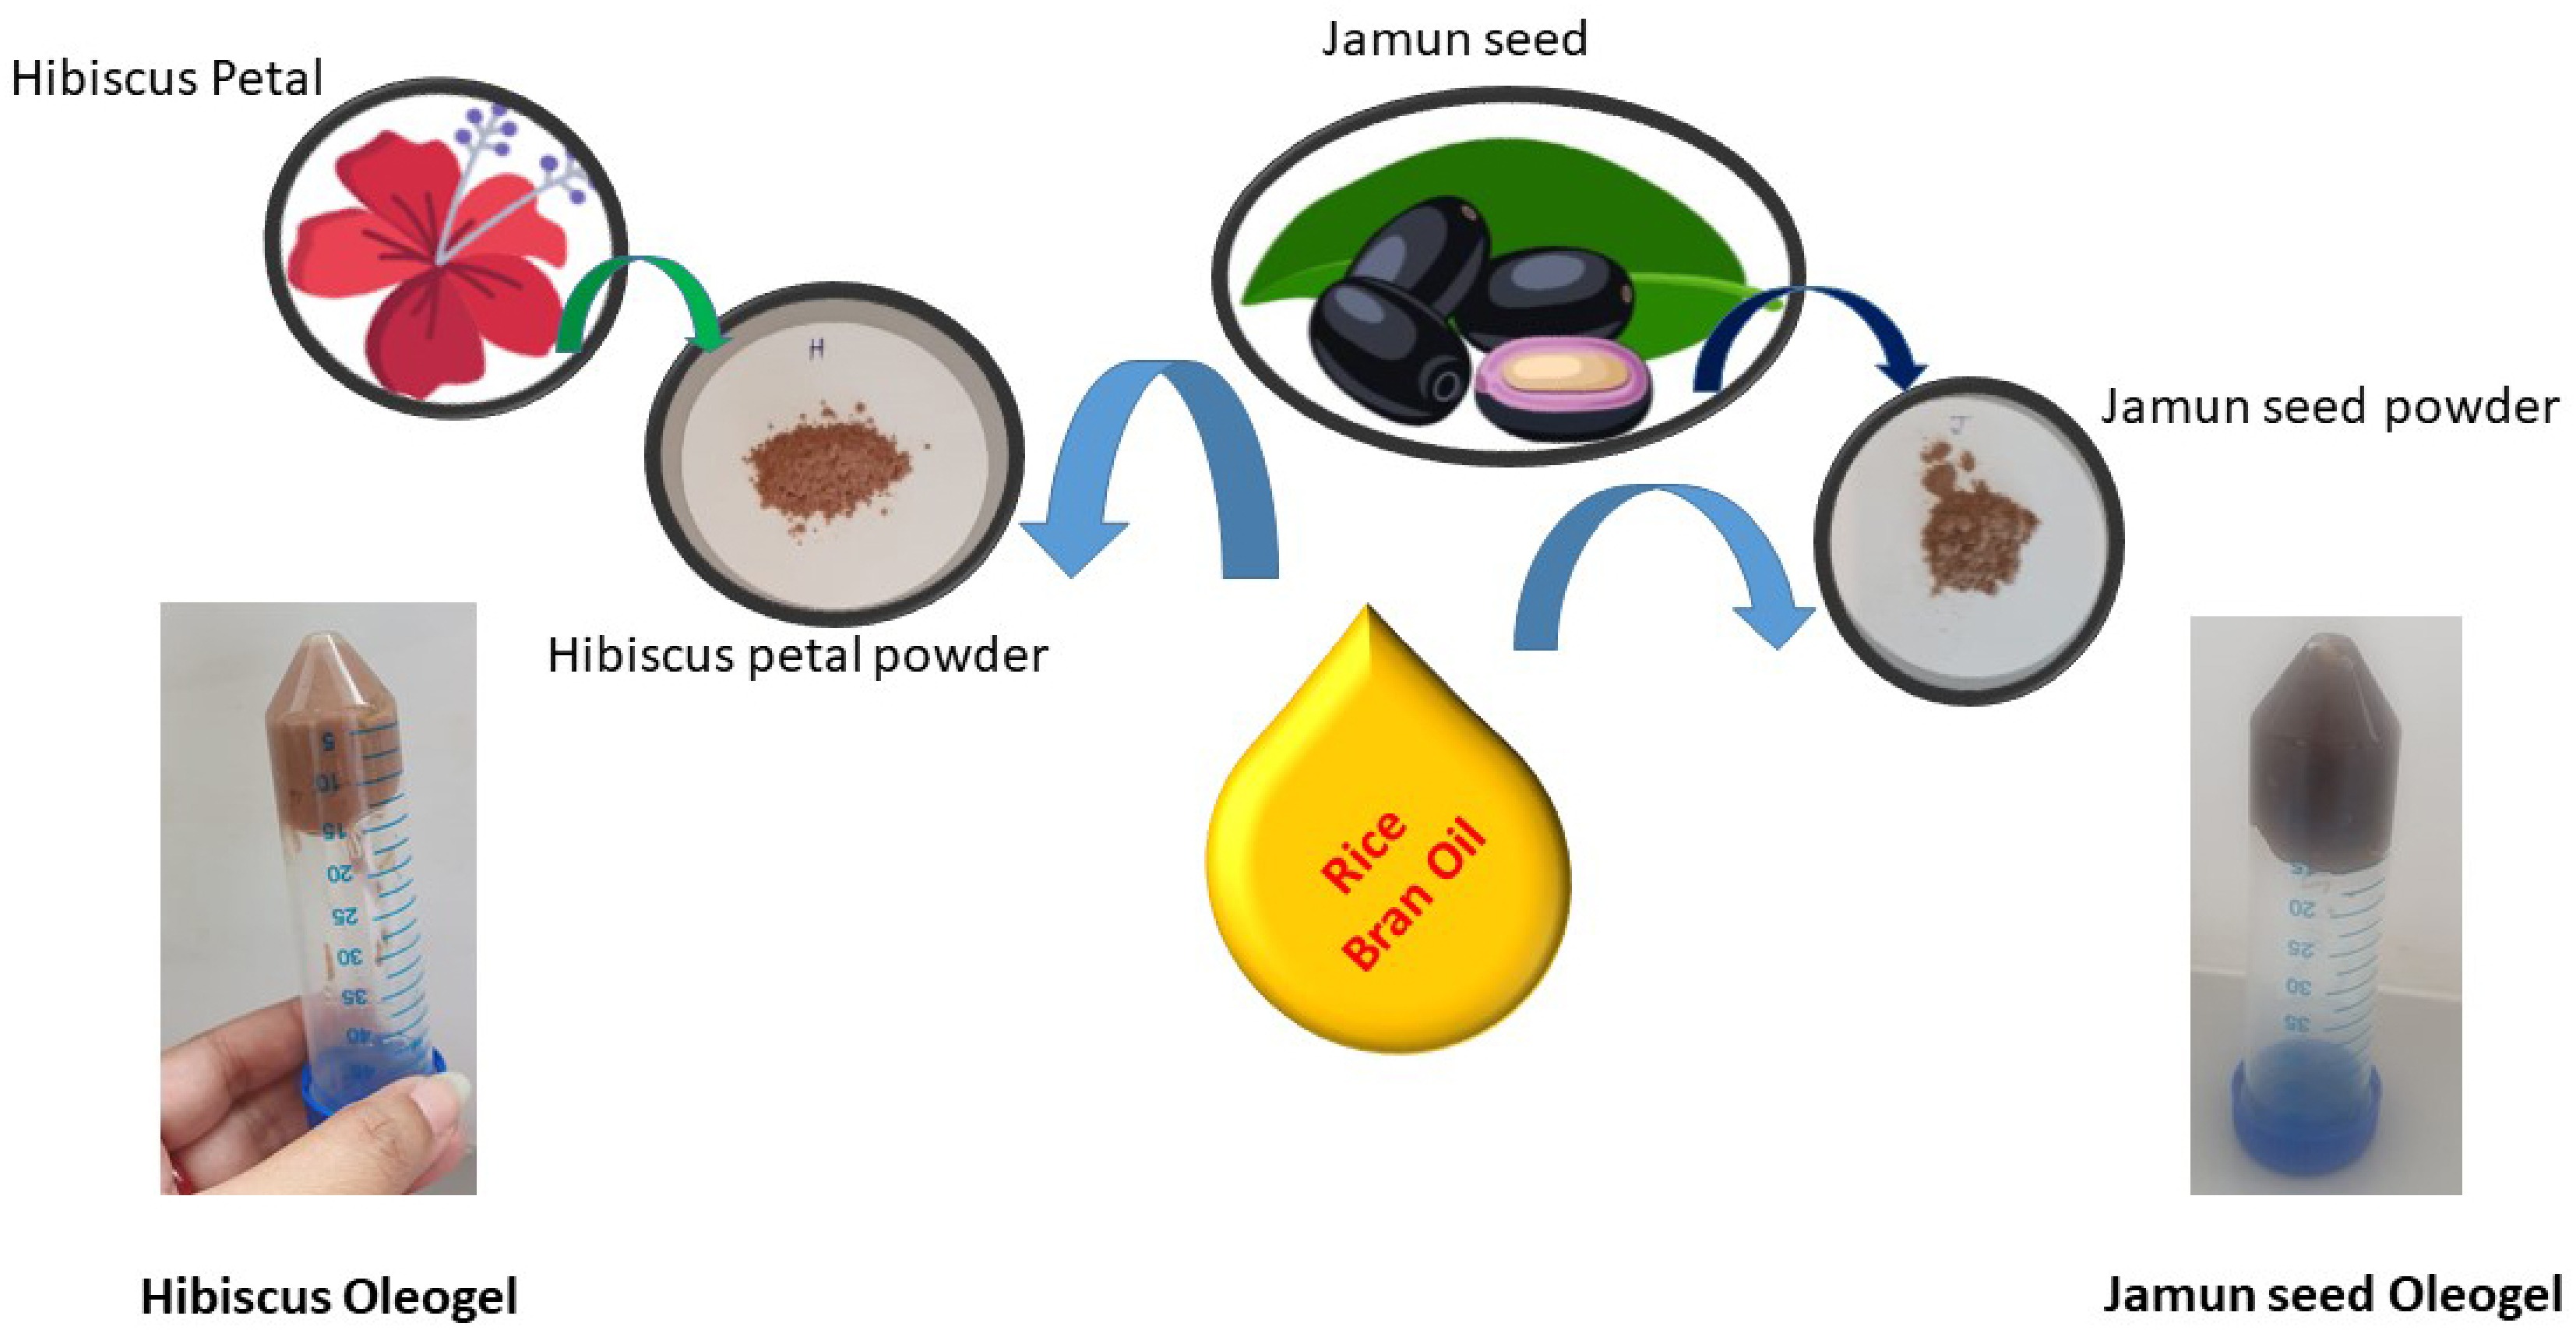
Figure 1.
Schematic diagram of the processing steps of HBg and JBg.
-
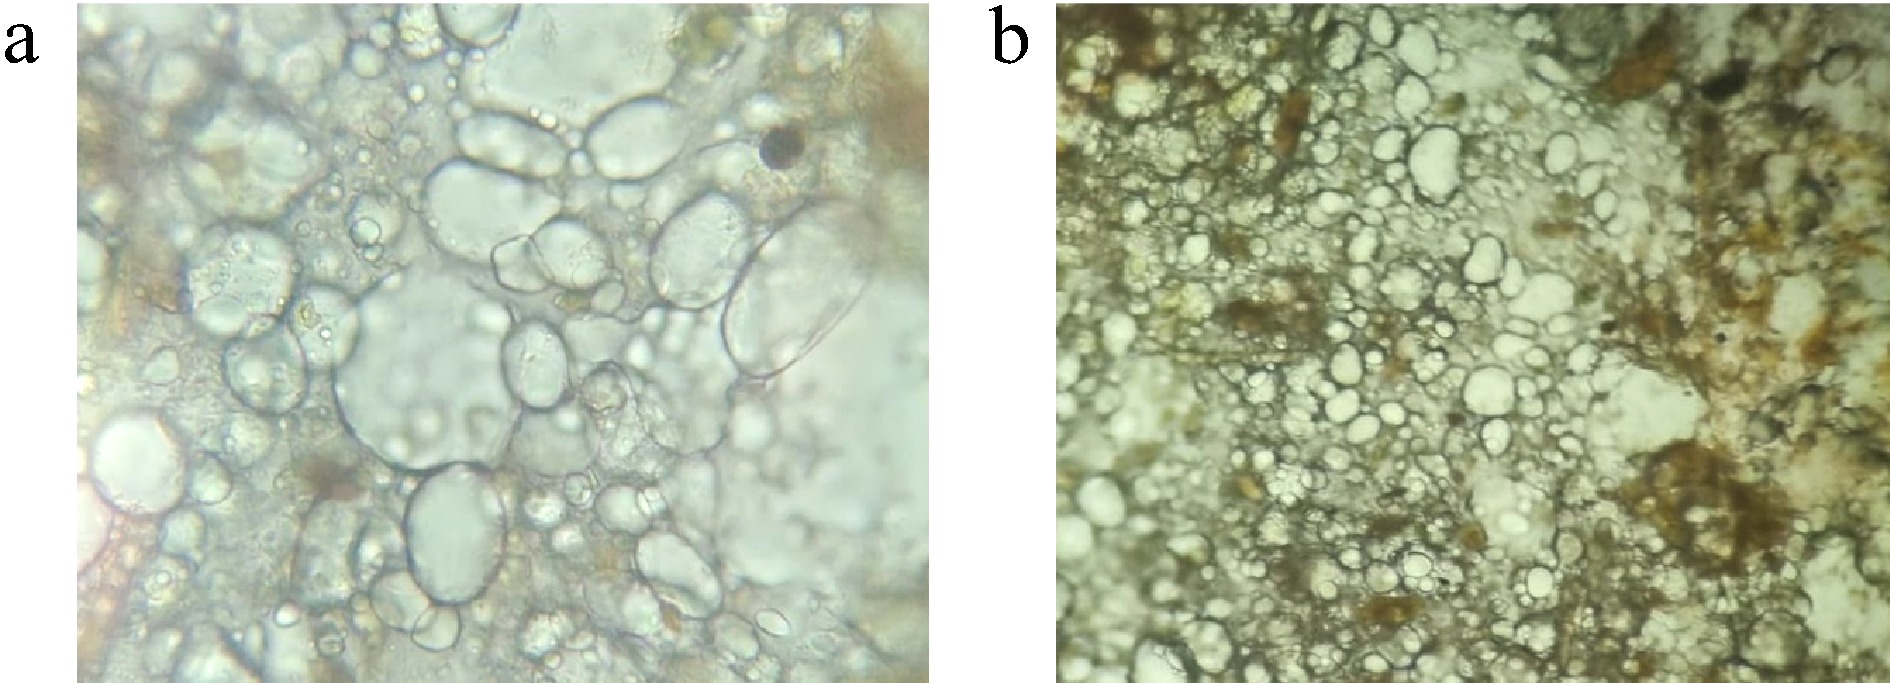
Figure 2.
(a) Optical microscopic picture of the morphological characteristics of HBg. (b) Optical microscopic picture of the morphological characteristics of JBg.
-
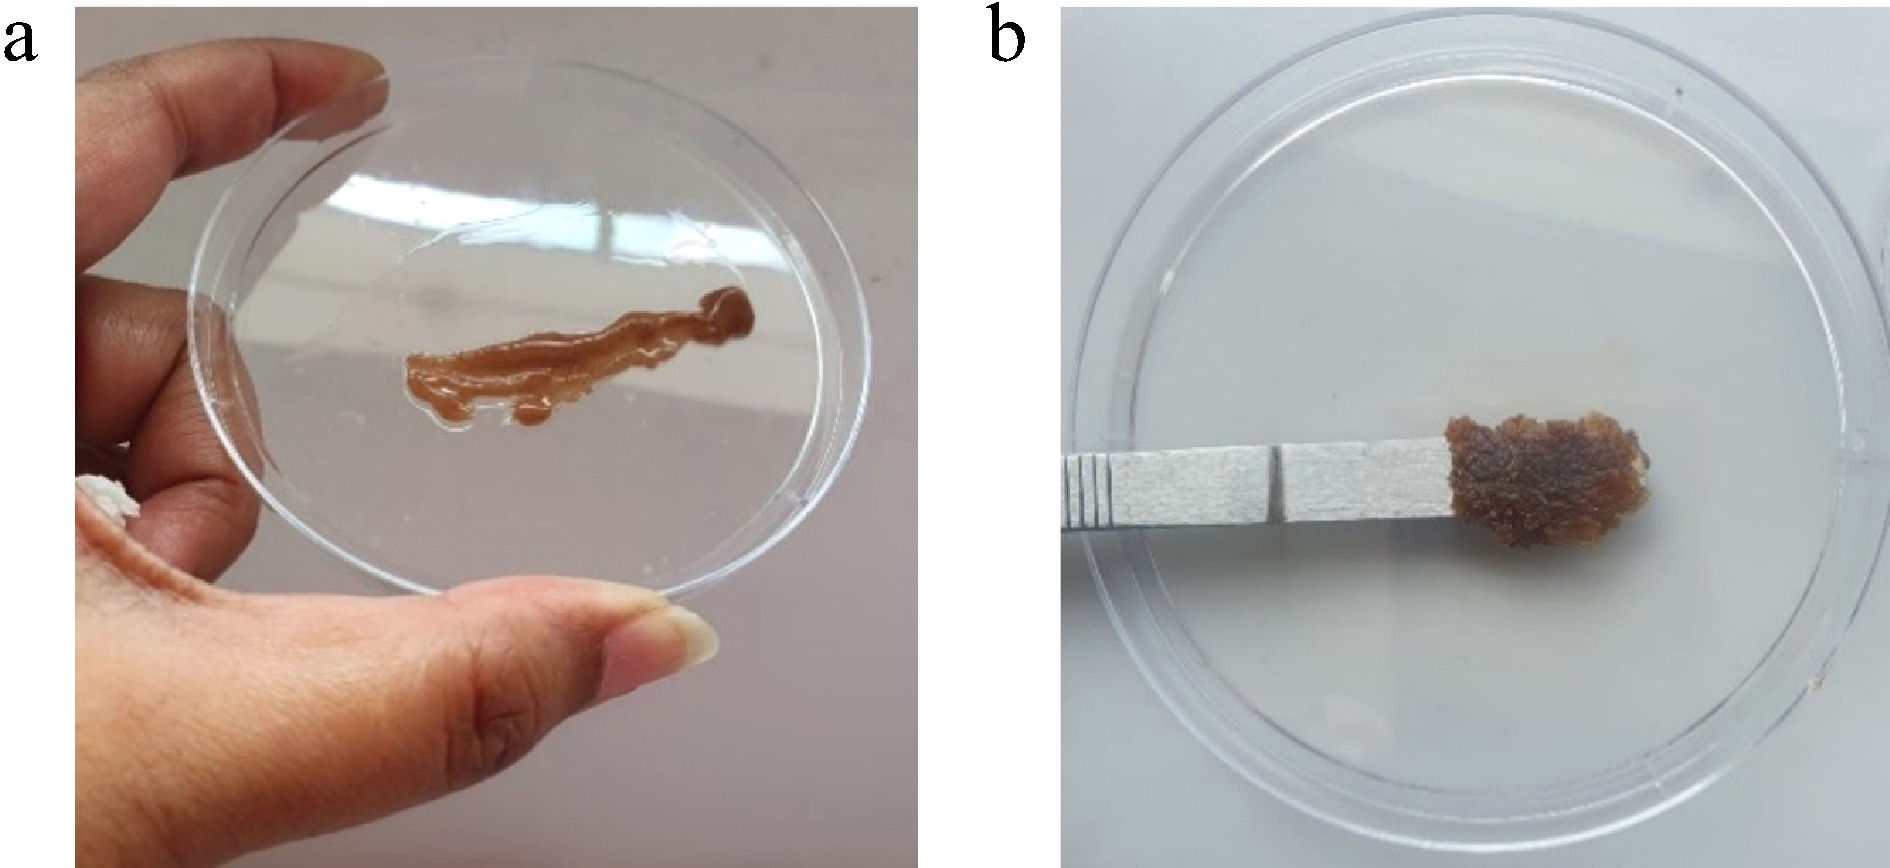
Figure 3.
(a) HBg's spreadability is smooth and homogeneous. (b) JBg's spreadability showed coarse granules and it was difficult to spread.
-
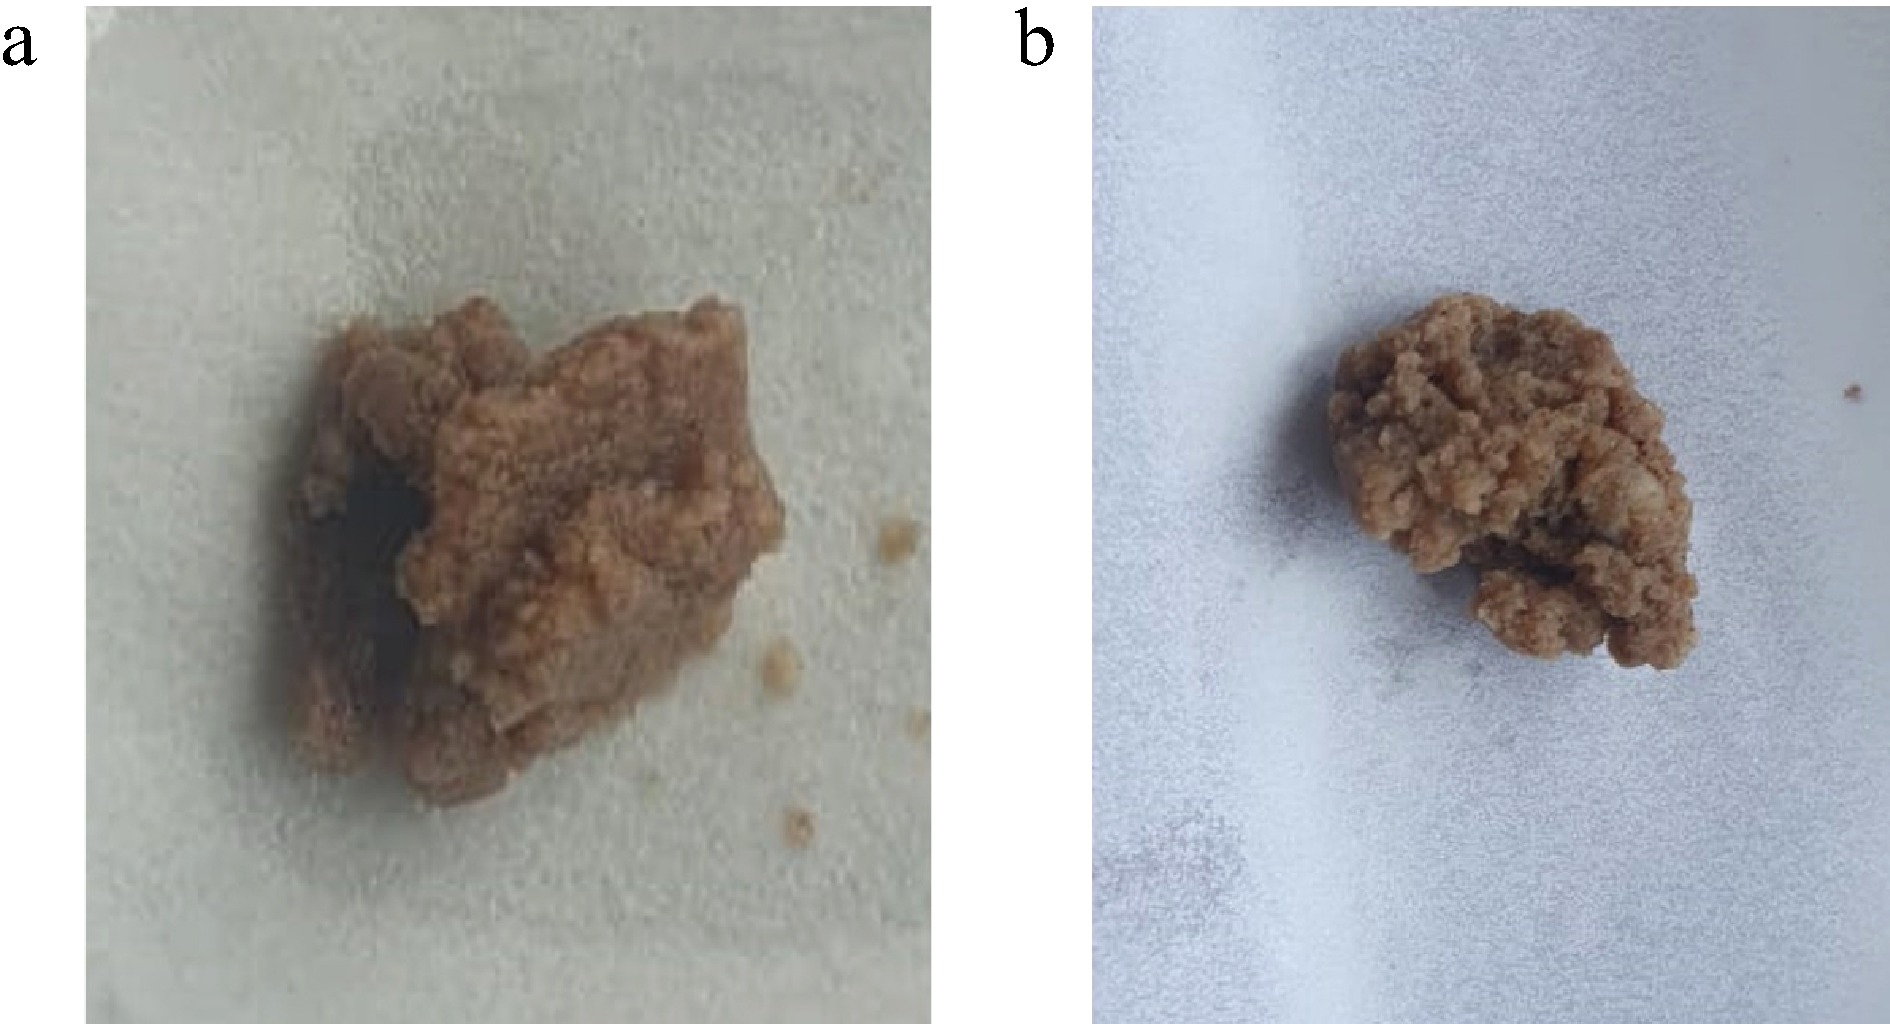
Figure 4.
(a) HBg after swelling. (b) JBg after swelling.
-
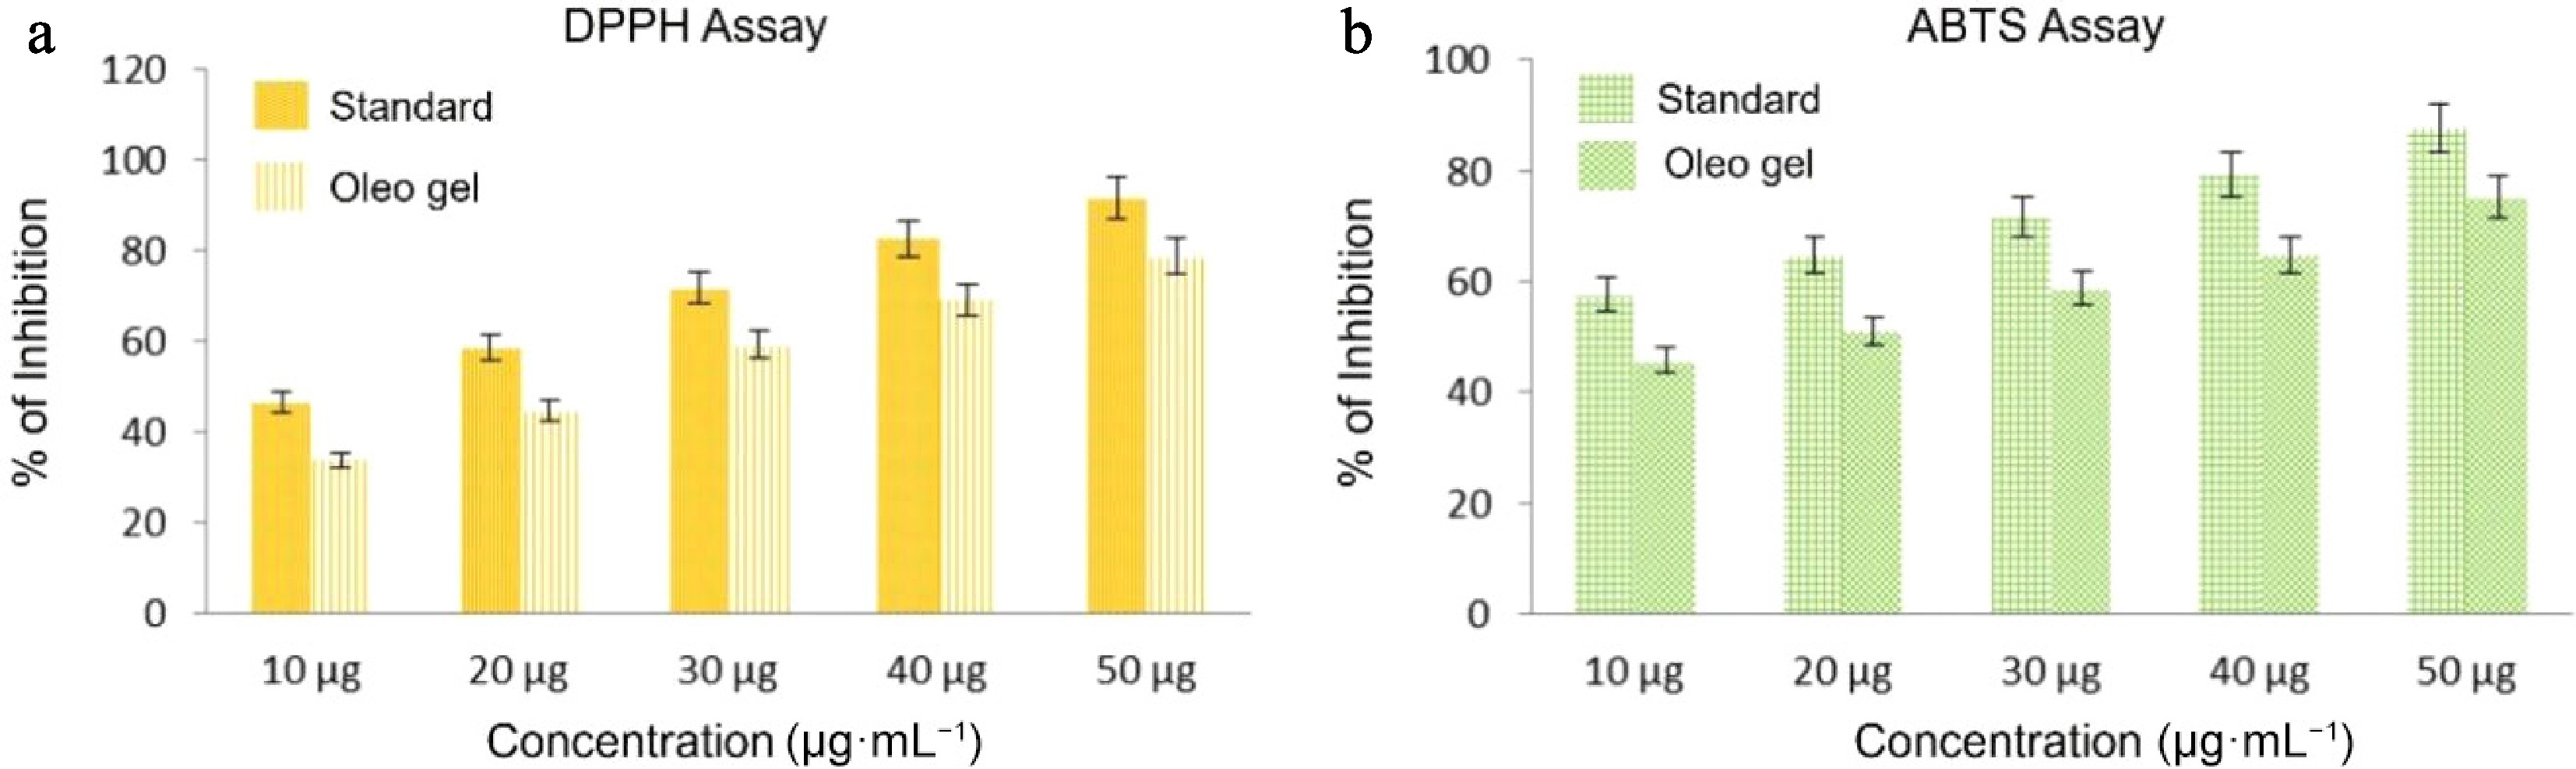
Figure 5.
(a) Inhibition induced by HBg in the DPPH assay and (b) the ABTS assay (in %).
-
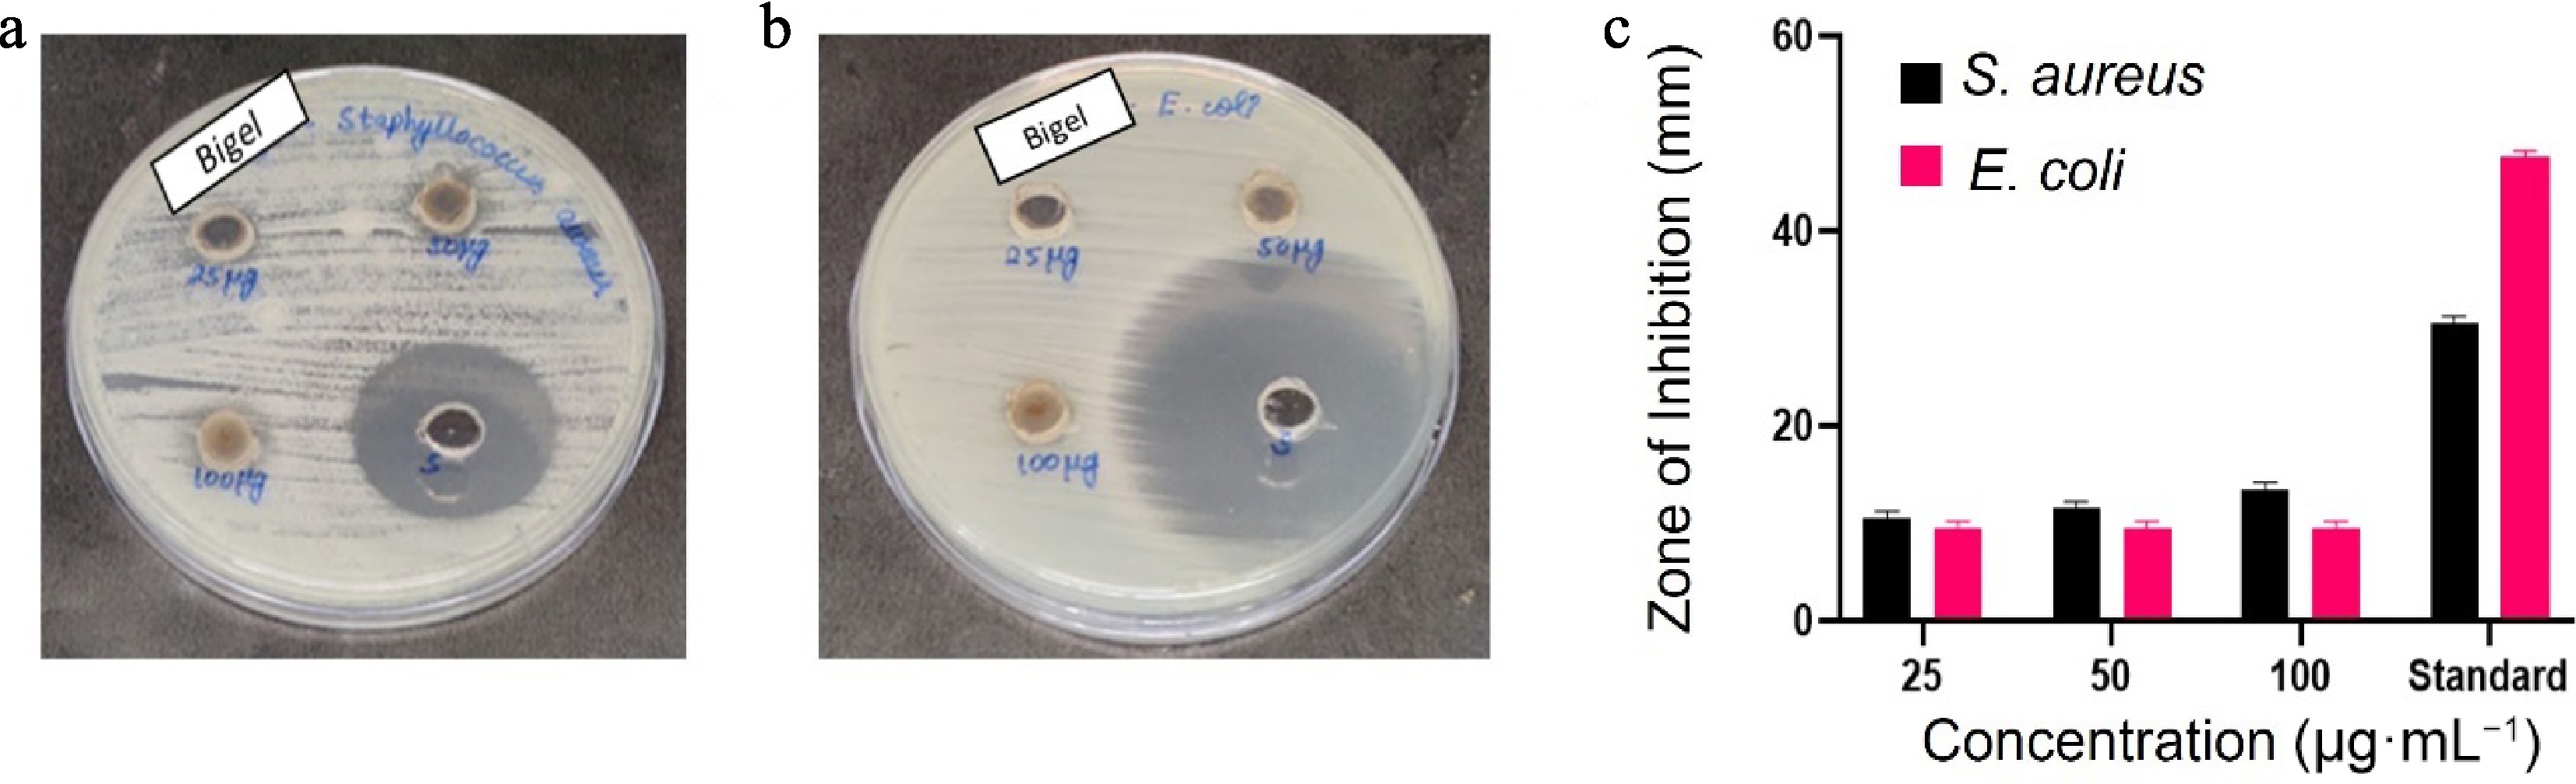
Figure 6.
(a) Zone of inhibition in S. aureus. (b) Zone of inhibition in E. coli. (c) Bar graph showing different zones of inhibition at different concentration of HBg.
-
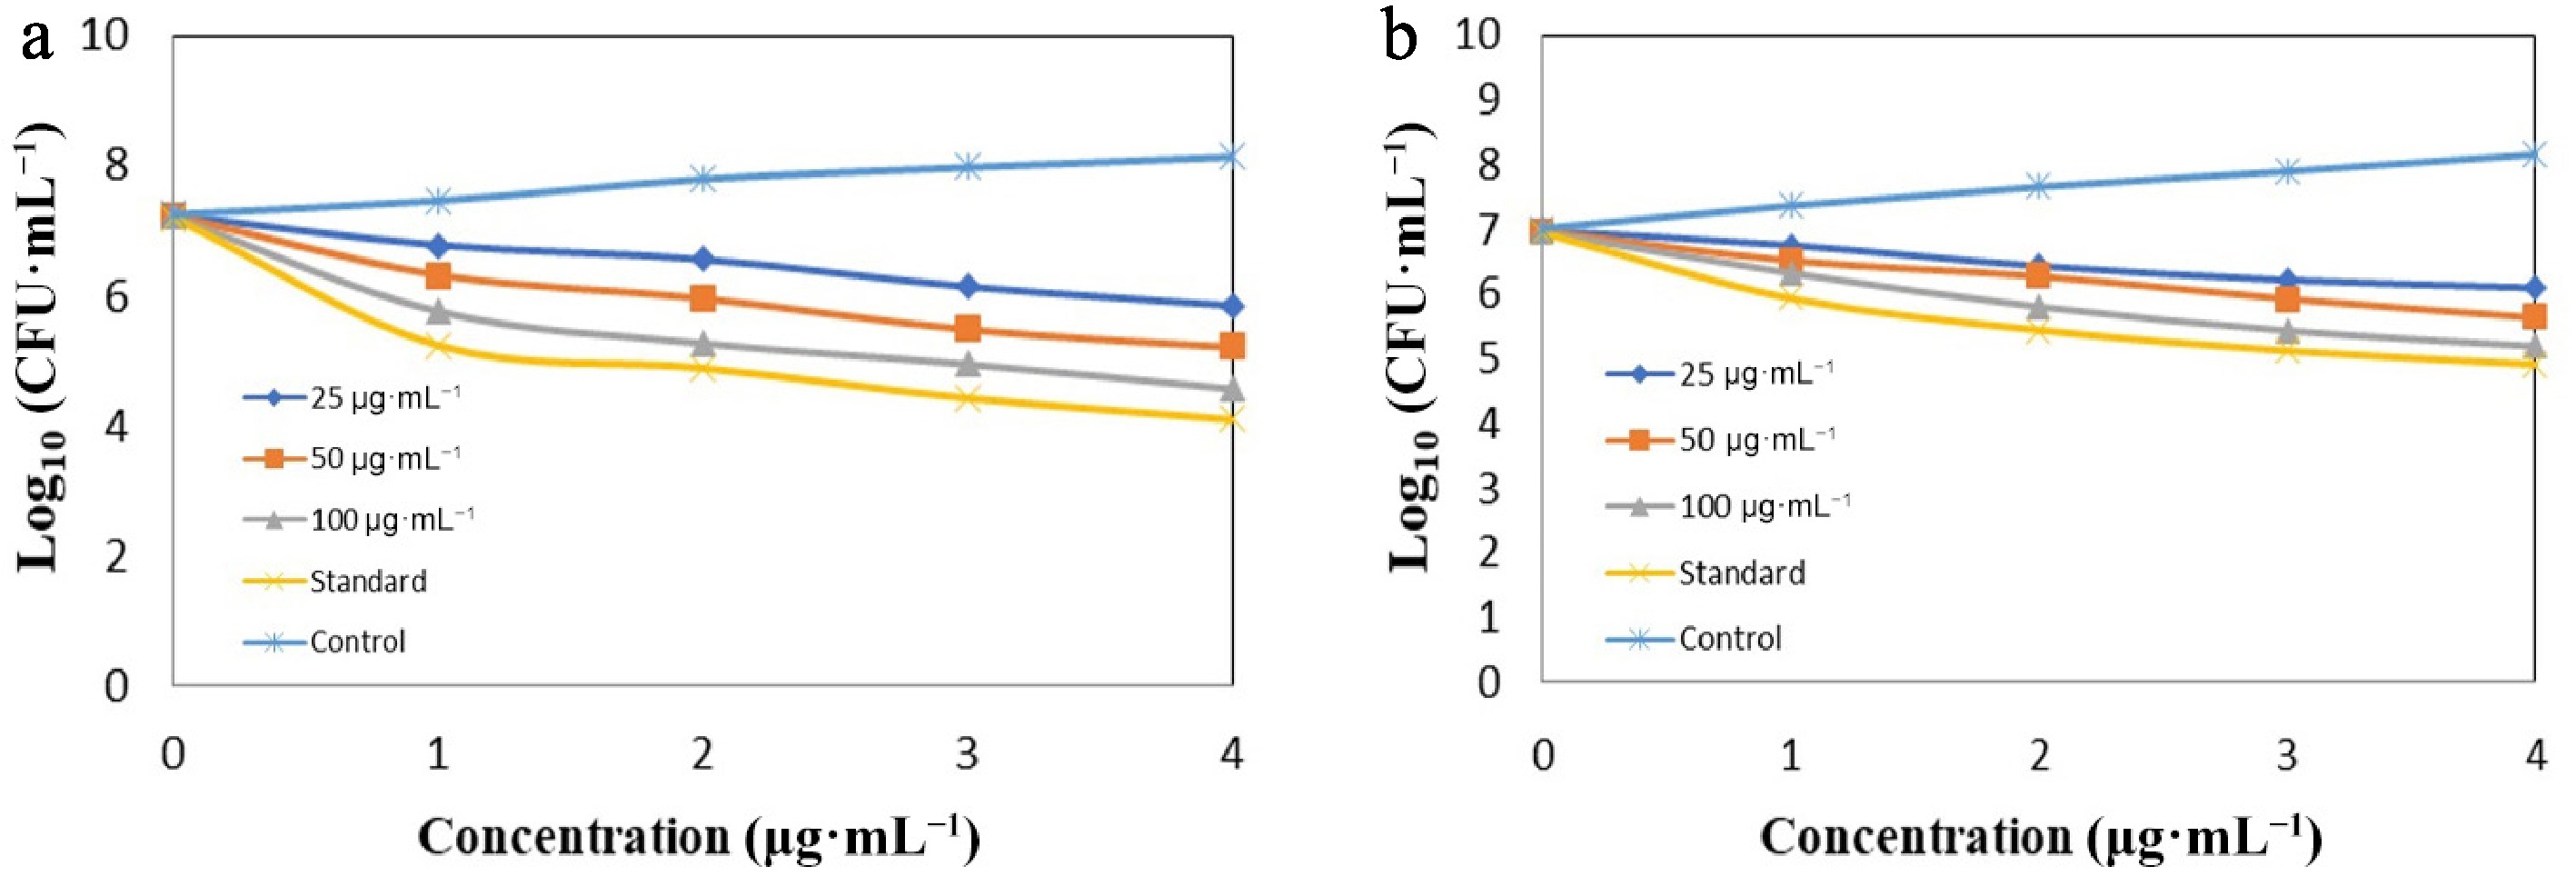
Figure 7.
(a) Time-to-kill assay for S. aureus in the test sample of HBg. (b) Time-to-kill assay for E. coli in the test sample of HBg.
-
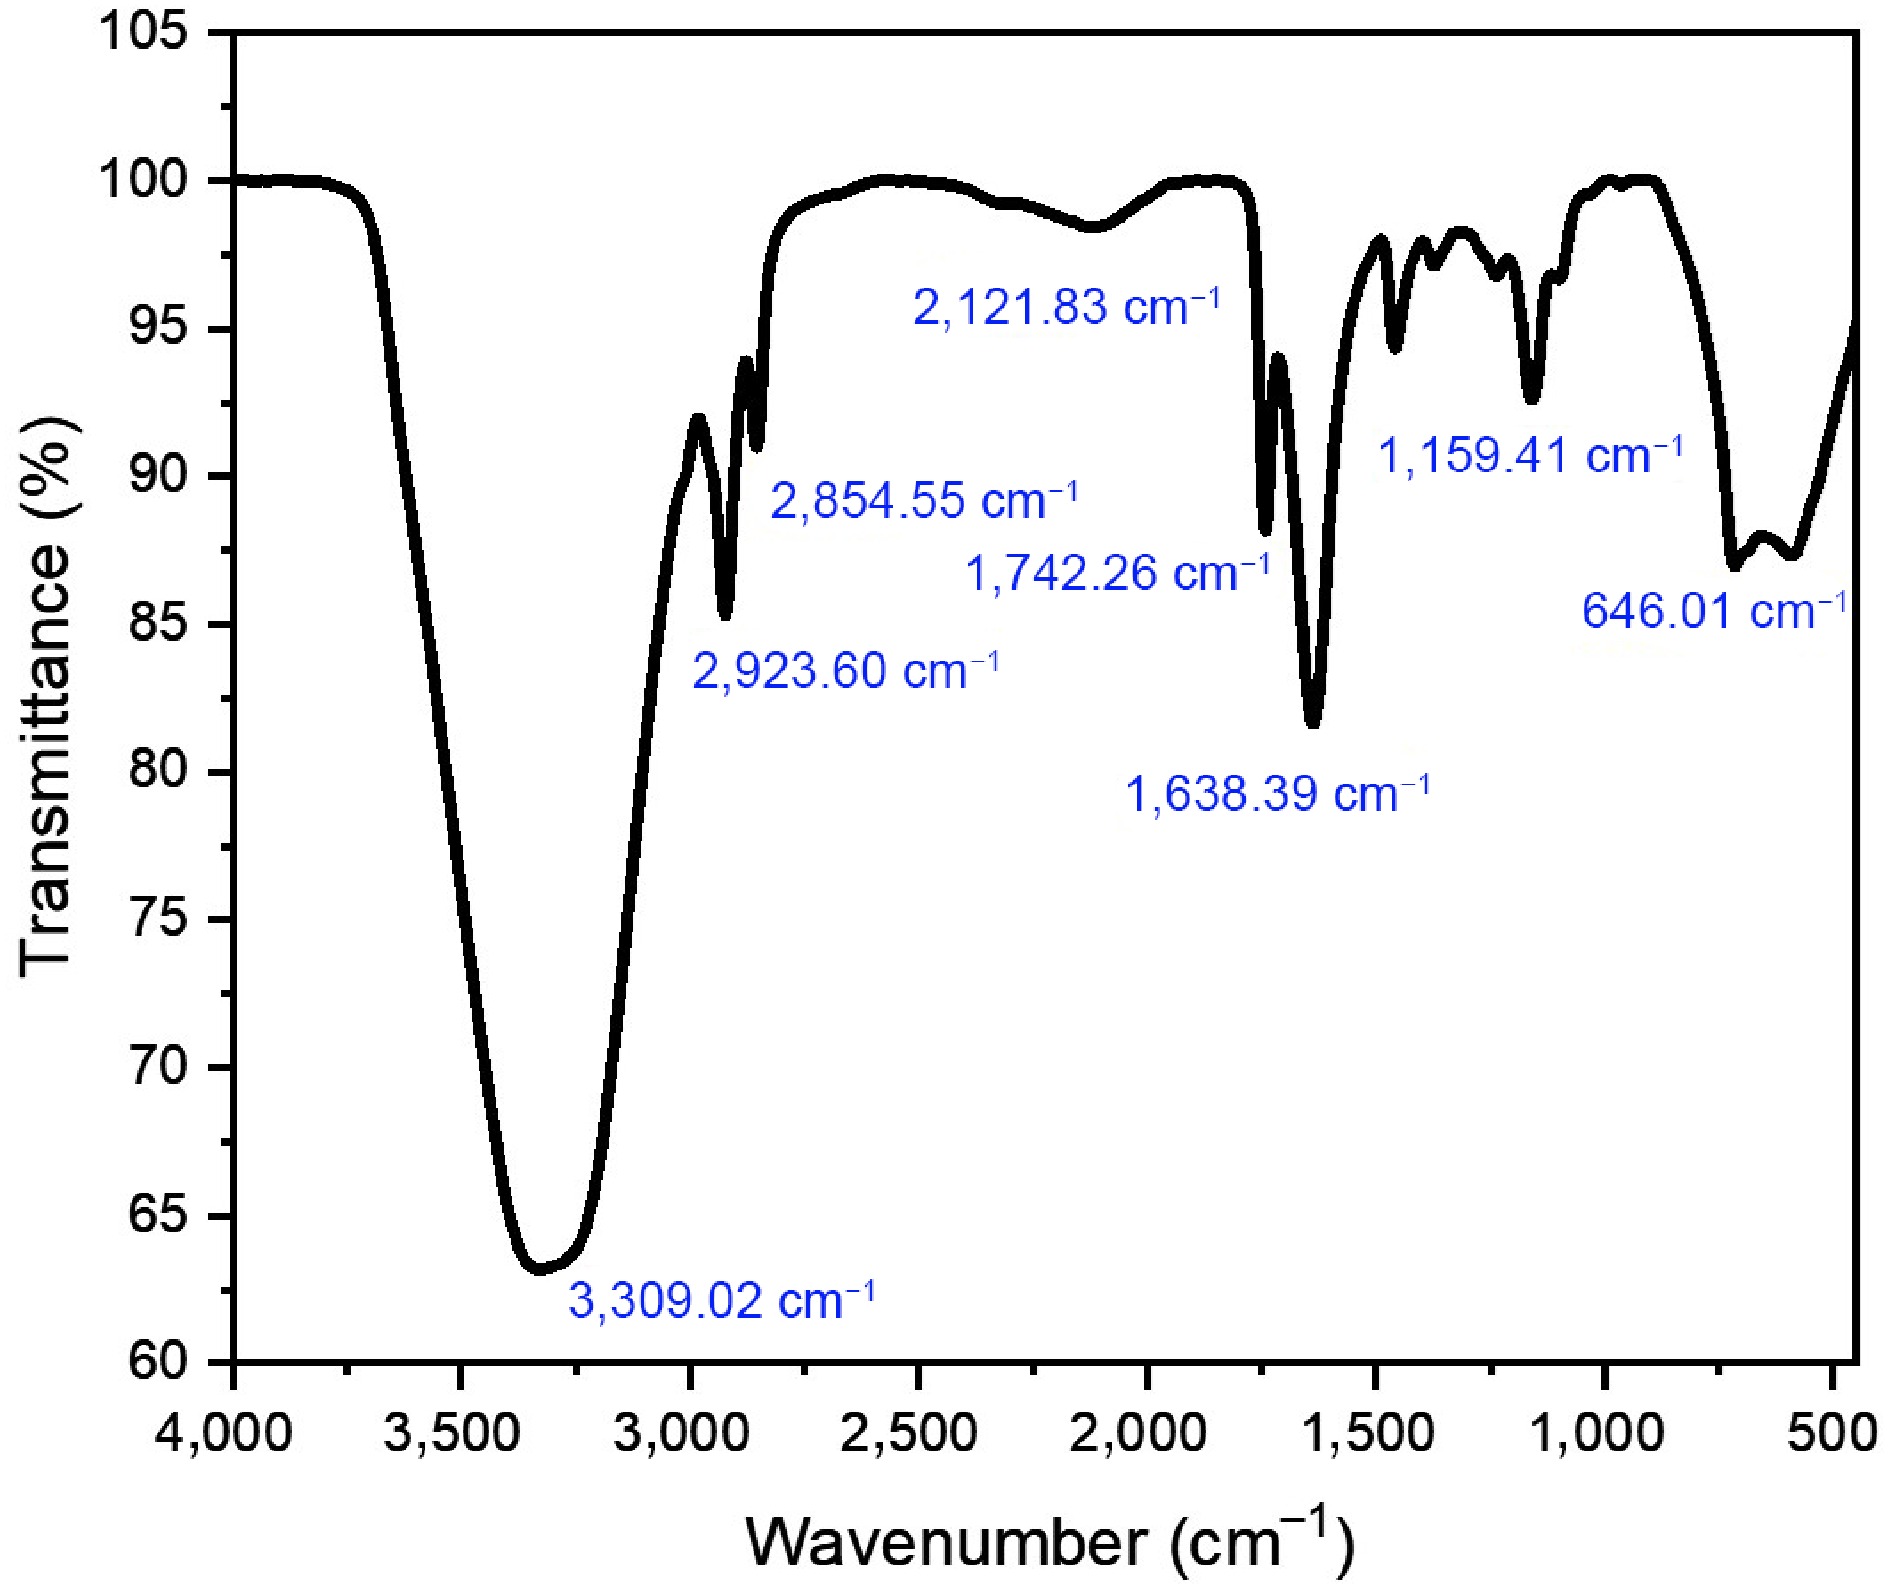
Figure 8.
FTIR spectra analysis of HBg.
-
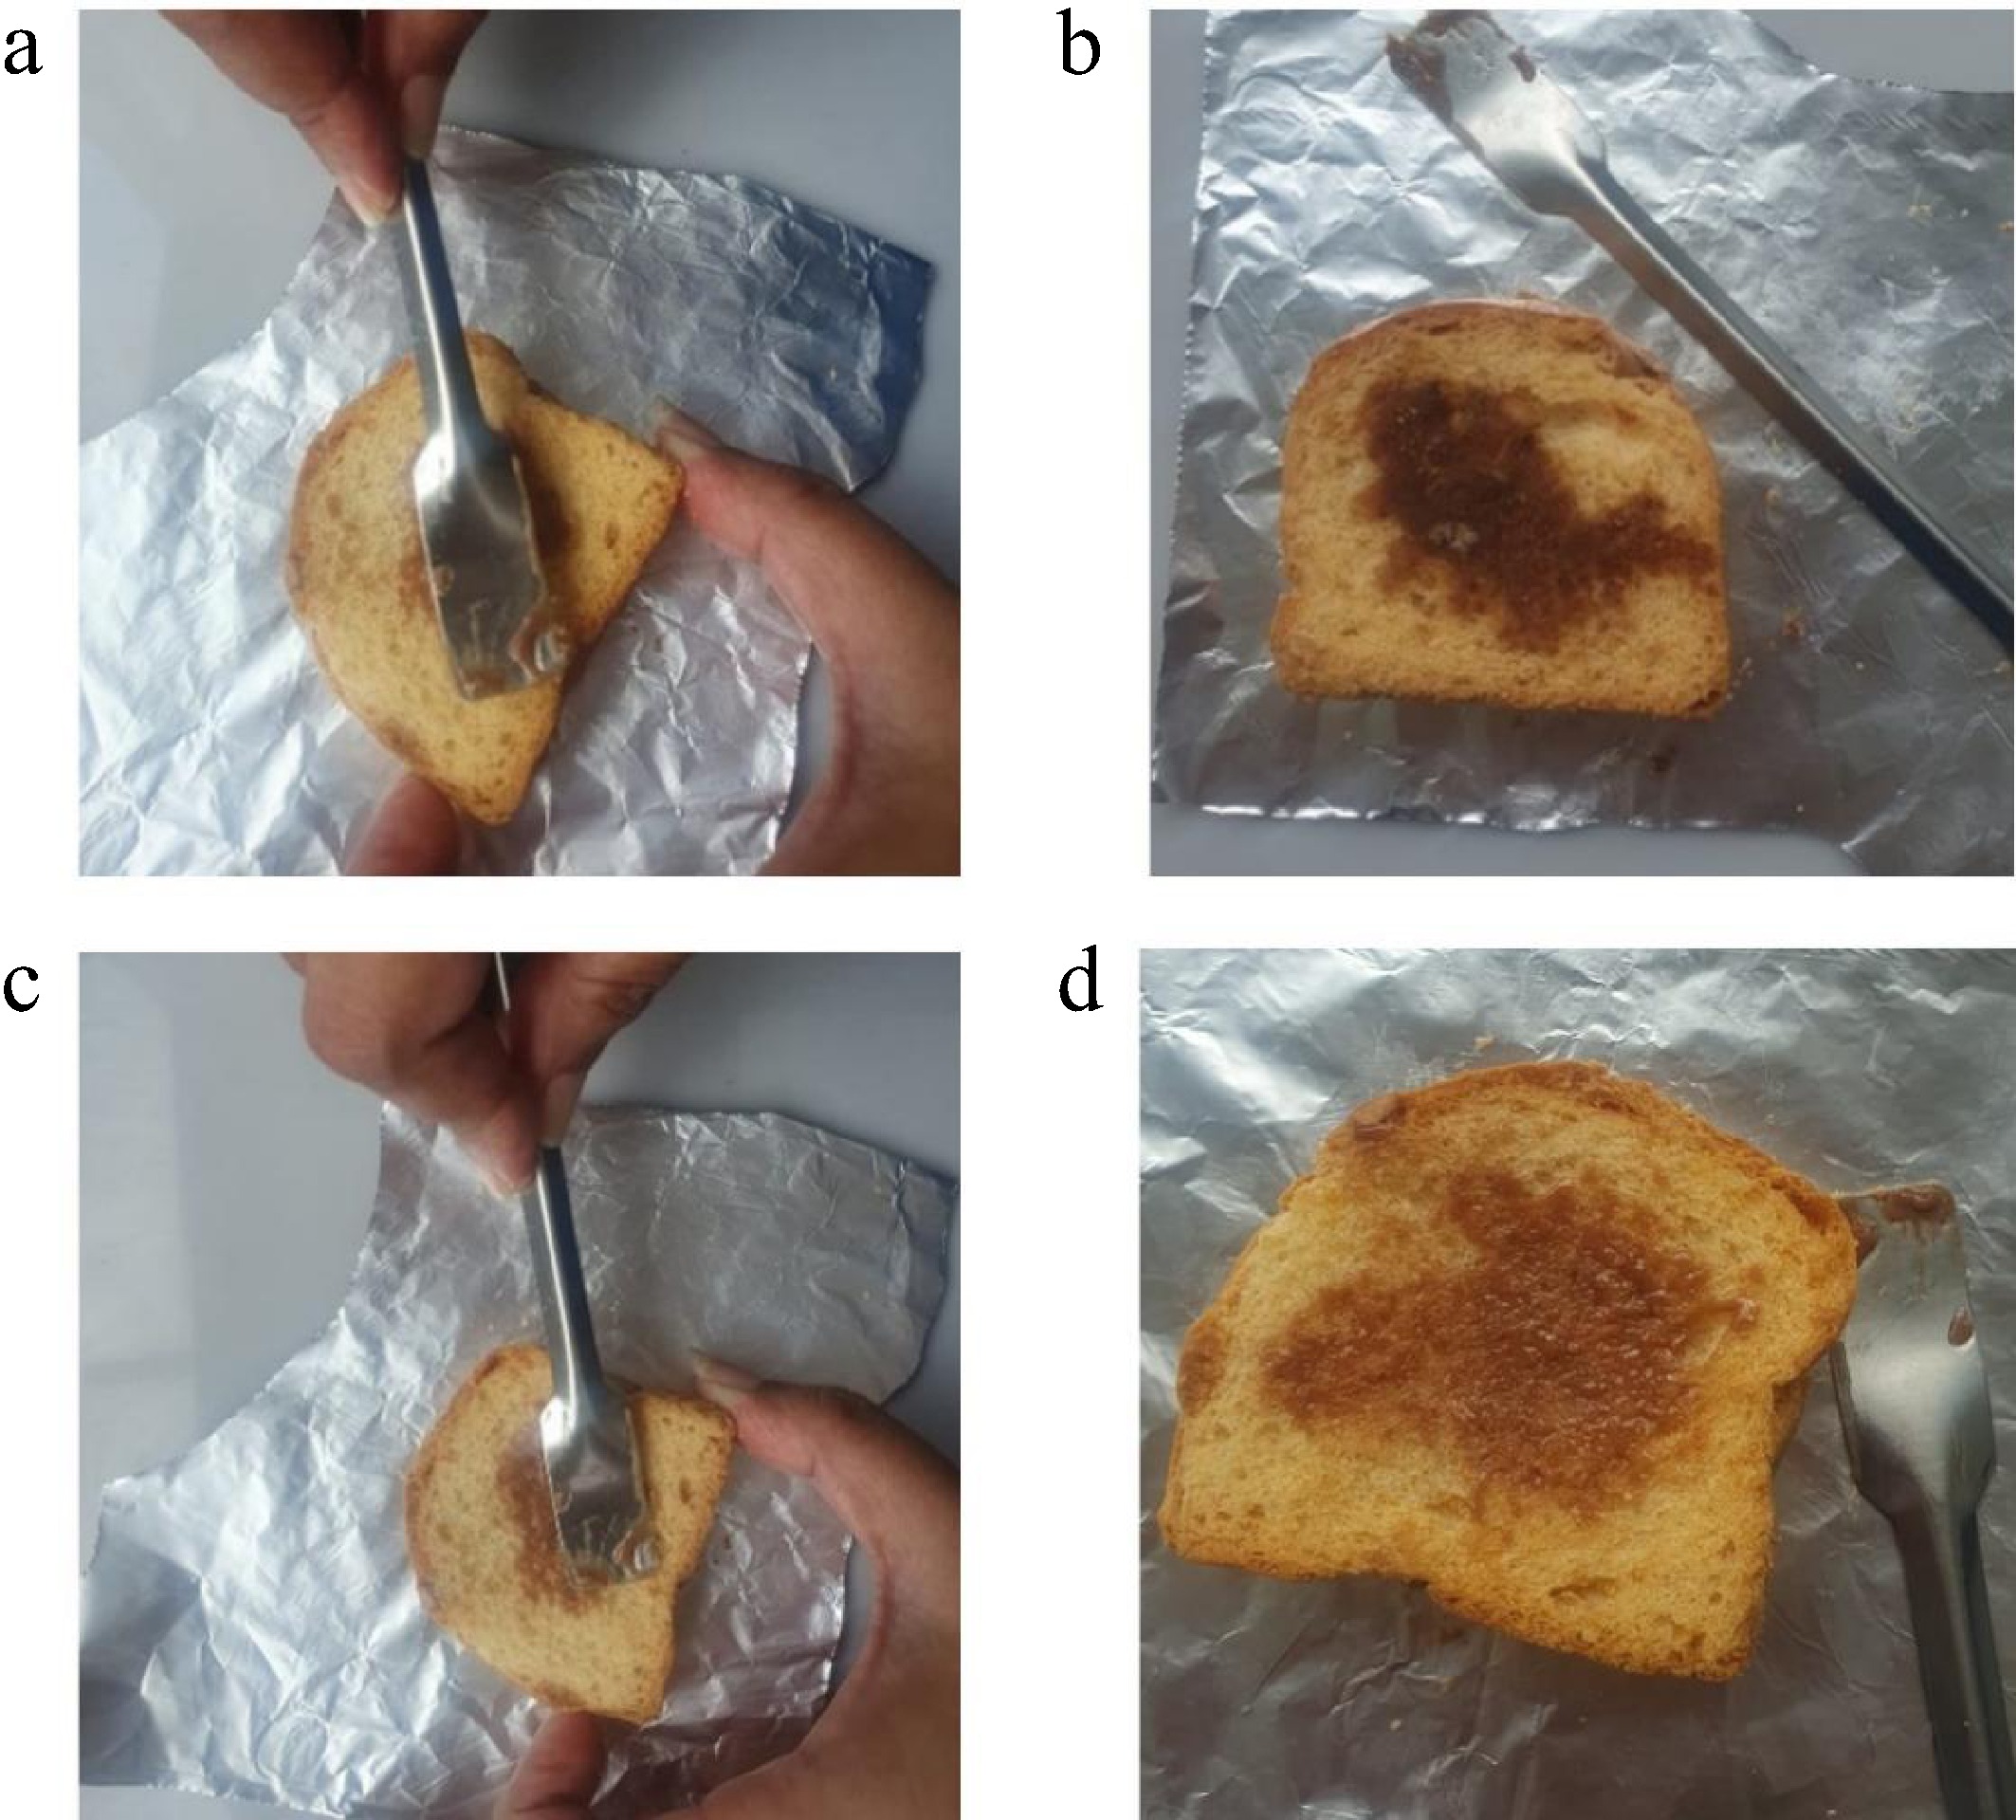
Figure 9.
(a) Application of JBg to a toast slice. ( b) The look of the toast after spreading JBg. (c) Application of HBg to a toast slice. (d) The look of the toast after spreading HBg.
-
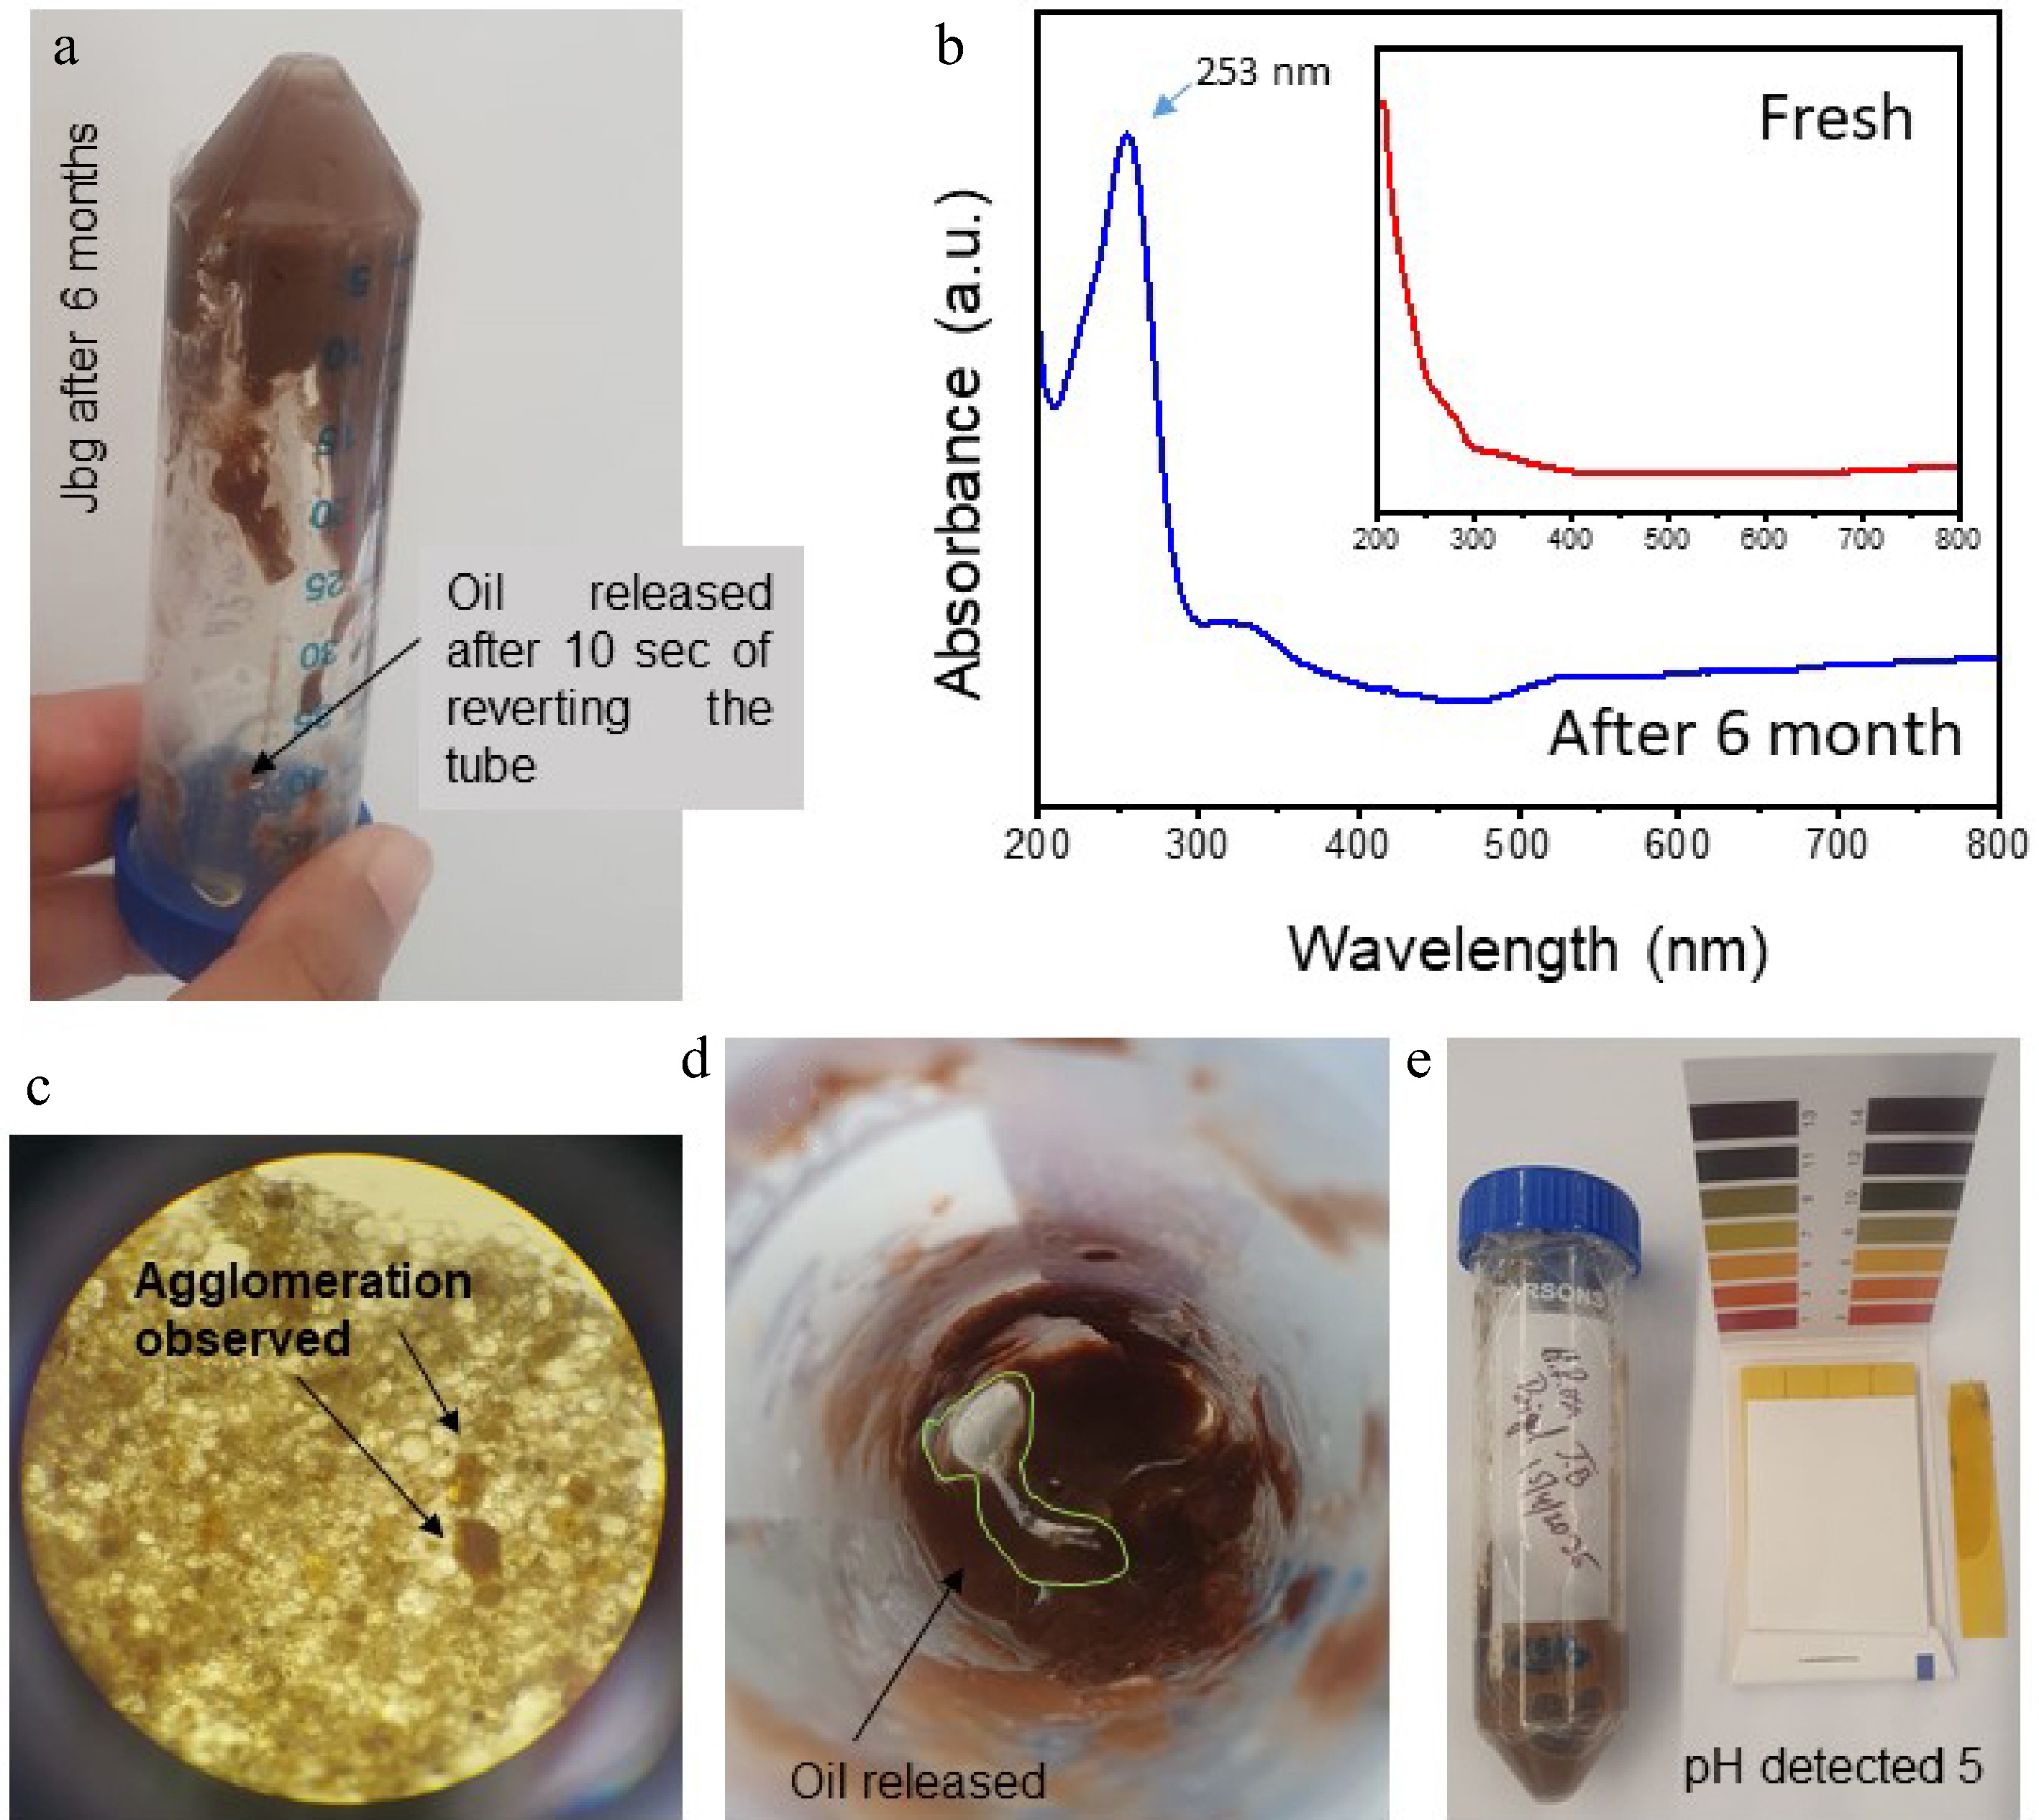
Figure 10.
(a). The 6-month-old JBg, when inverted, released oil after 10 s. (b) UV–visible spectra showed an absorption peak at 260 nm for conjugated dienes as secondary oxidation products are observed in the sample stored for 6 months, whereas no distinct oxidation was observed in the fresh sample. (c) The microstructural observation reported flocculence or agglomeration caused by lengthy storage. (d). Visual oil release is observed on the surface of the JBg. (e) The pH was observed to be 5 as per the color chart.
-
Bigel type Distance moved (cm) Time (s) Applied weight (g) Spreadability (g·cm·s−1) Hibiscus petal bigel 11.2 15 500 (500 × 11.2) / 15 = 373.33 Jamun seed bigel 9.6 15 500 (500 × 9.6) / 15 = 320.00 Table 1.
The spreadability of both bigels.
-
Bigel type Initial weight
(W0)Weight after swelling (Wt) Swelling ratio (%) HBg 1.00g 2.85 (2.85 − 1.00) / 1.00 × 100 = 185% JBg 1.00g 2.30 (2.30 − 1.00) / 1.00 × 100 = 130% Table 2.
The swelling ratio of the bigels.
-
Concentration (µg·mL−1) Standard (%) Bigel (%) 10 46.72 33.88 20 58.65 44.9 30 71.85 59.29 40 82.64 69.21 50 91.81 78.83 Table 3.
DPPH assay.
-
Concentration (µg·mL−1) Standard (%) Bigel (%) 10 57.65 45.71 20 64.81 51.06 30 71.65 58.82 40 79.33 64.69 50 87.61 75.16 Table 4.
ABTS assay.
-
HBg 25 (µg·mL−1) 50 (µg·mL−1) 100 (µg·mL−1) Standard (µg·mL−1) S.aureus 10 11 13 30 E.coli 9 9 9 47 Table 5.
Zones of inhibition for S. aureus and E. coli for various concentrations of HBg and the standard.
Figures
(10)
Tables
(5)