-
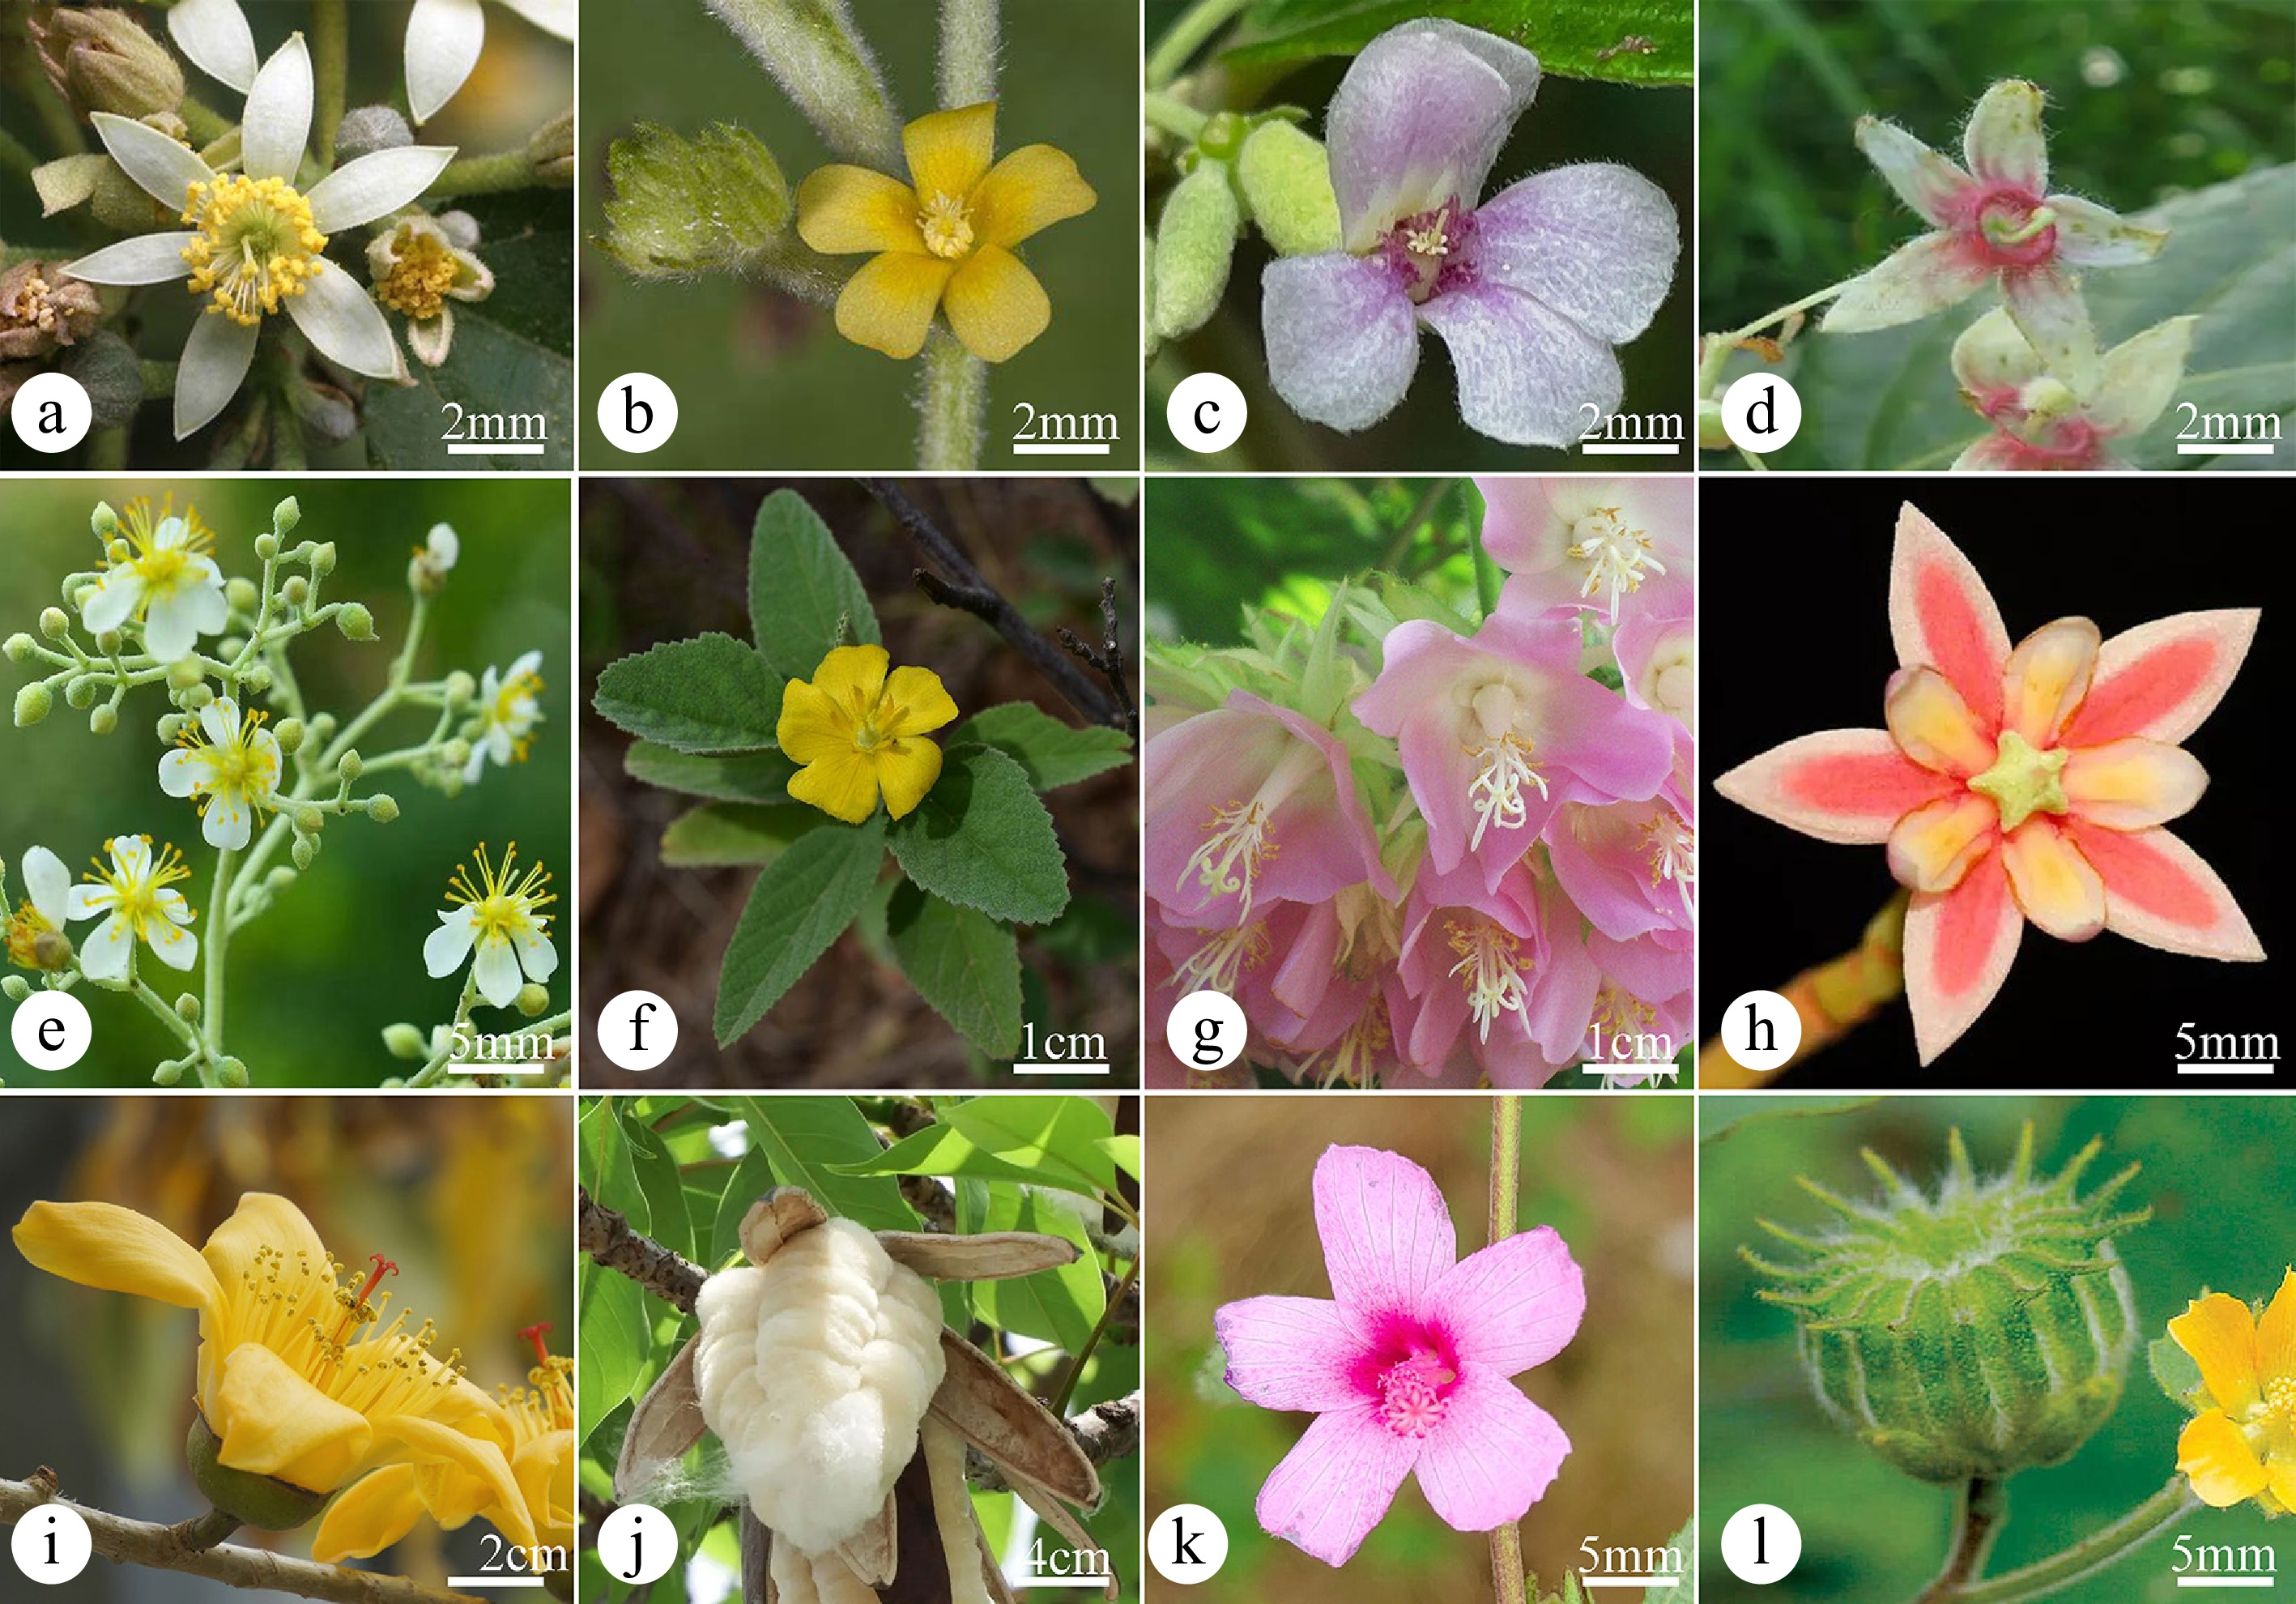
Figure 1.
Diversity of flowers and fruits of the Malvaceae Juss. (a) Grewia biloba var. parviflora (Bunge) Hand. -Mazz. Contributed by Maple, (b) Waltheria indica L., (c) Helicteres angustifolia L., (d) Sterculia brevissima H.H. Hsue ex Y. Tang, M.G. Gilbert & Dorrcontributed by Malvaceae, (e) Diplodiscus trichospermus (Merr.) Y.Tang, M.G. Gilbert & Dorr, (f) Melhania hamiltoniana Wall., contributed by janstudio, (g) Dombeya acutangula Cav., (h) Craigia yunnanensis W.W.Sm. & W.E.Evans, (i) and (j) Bombax ceiba L., (k) Urena lobata L., (l) Abutilon indicum (L.) Sweet.
-
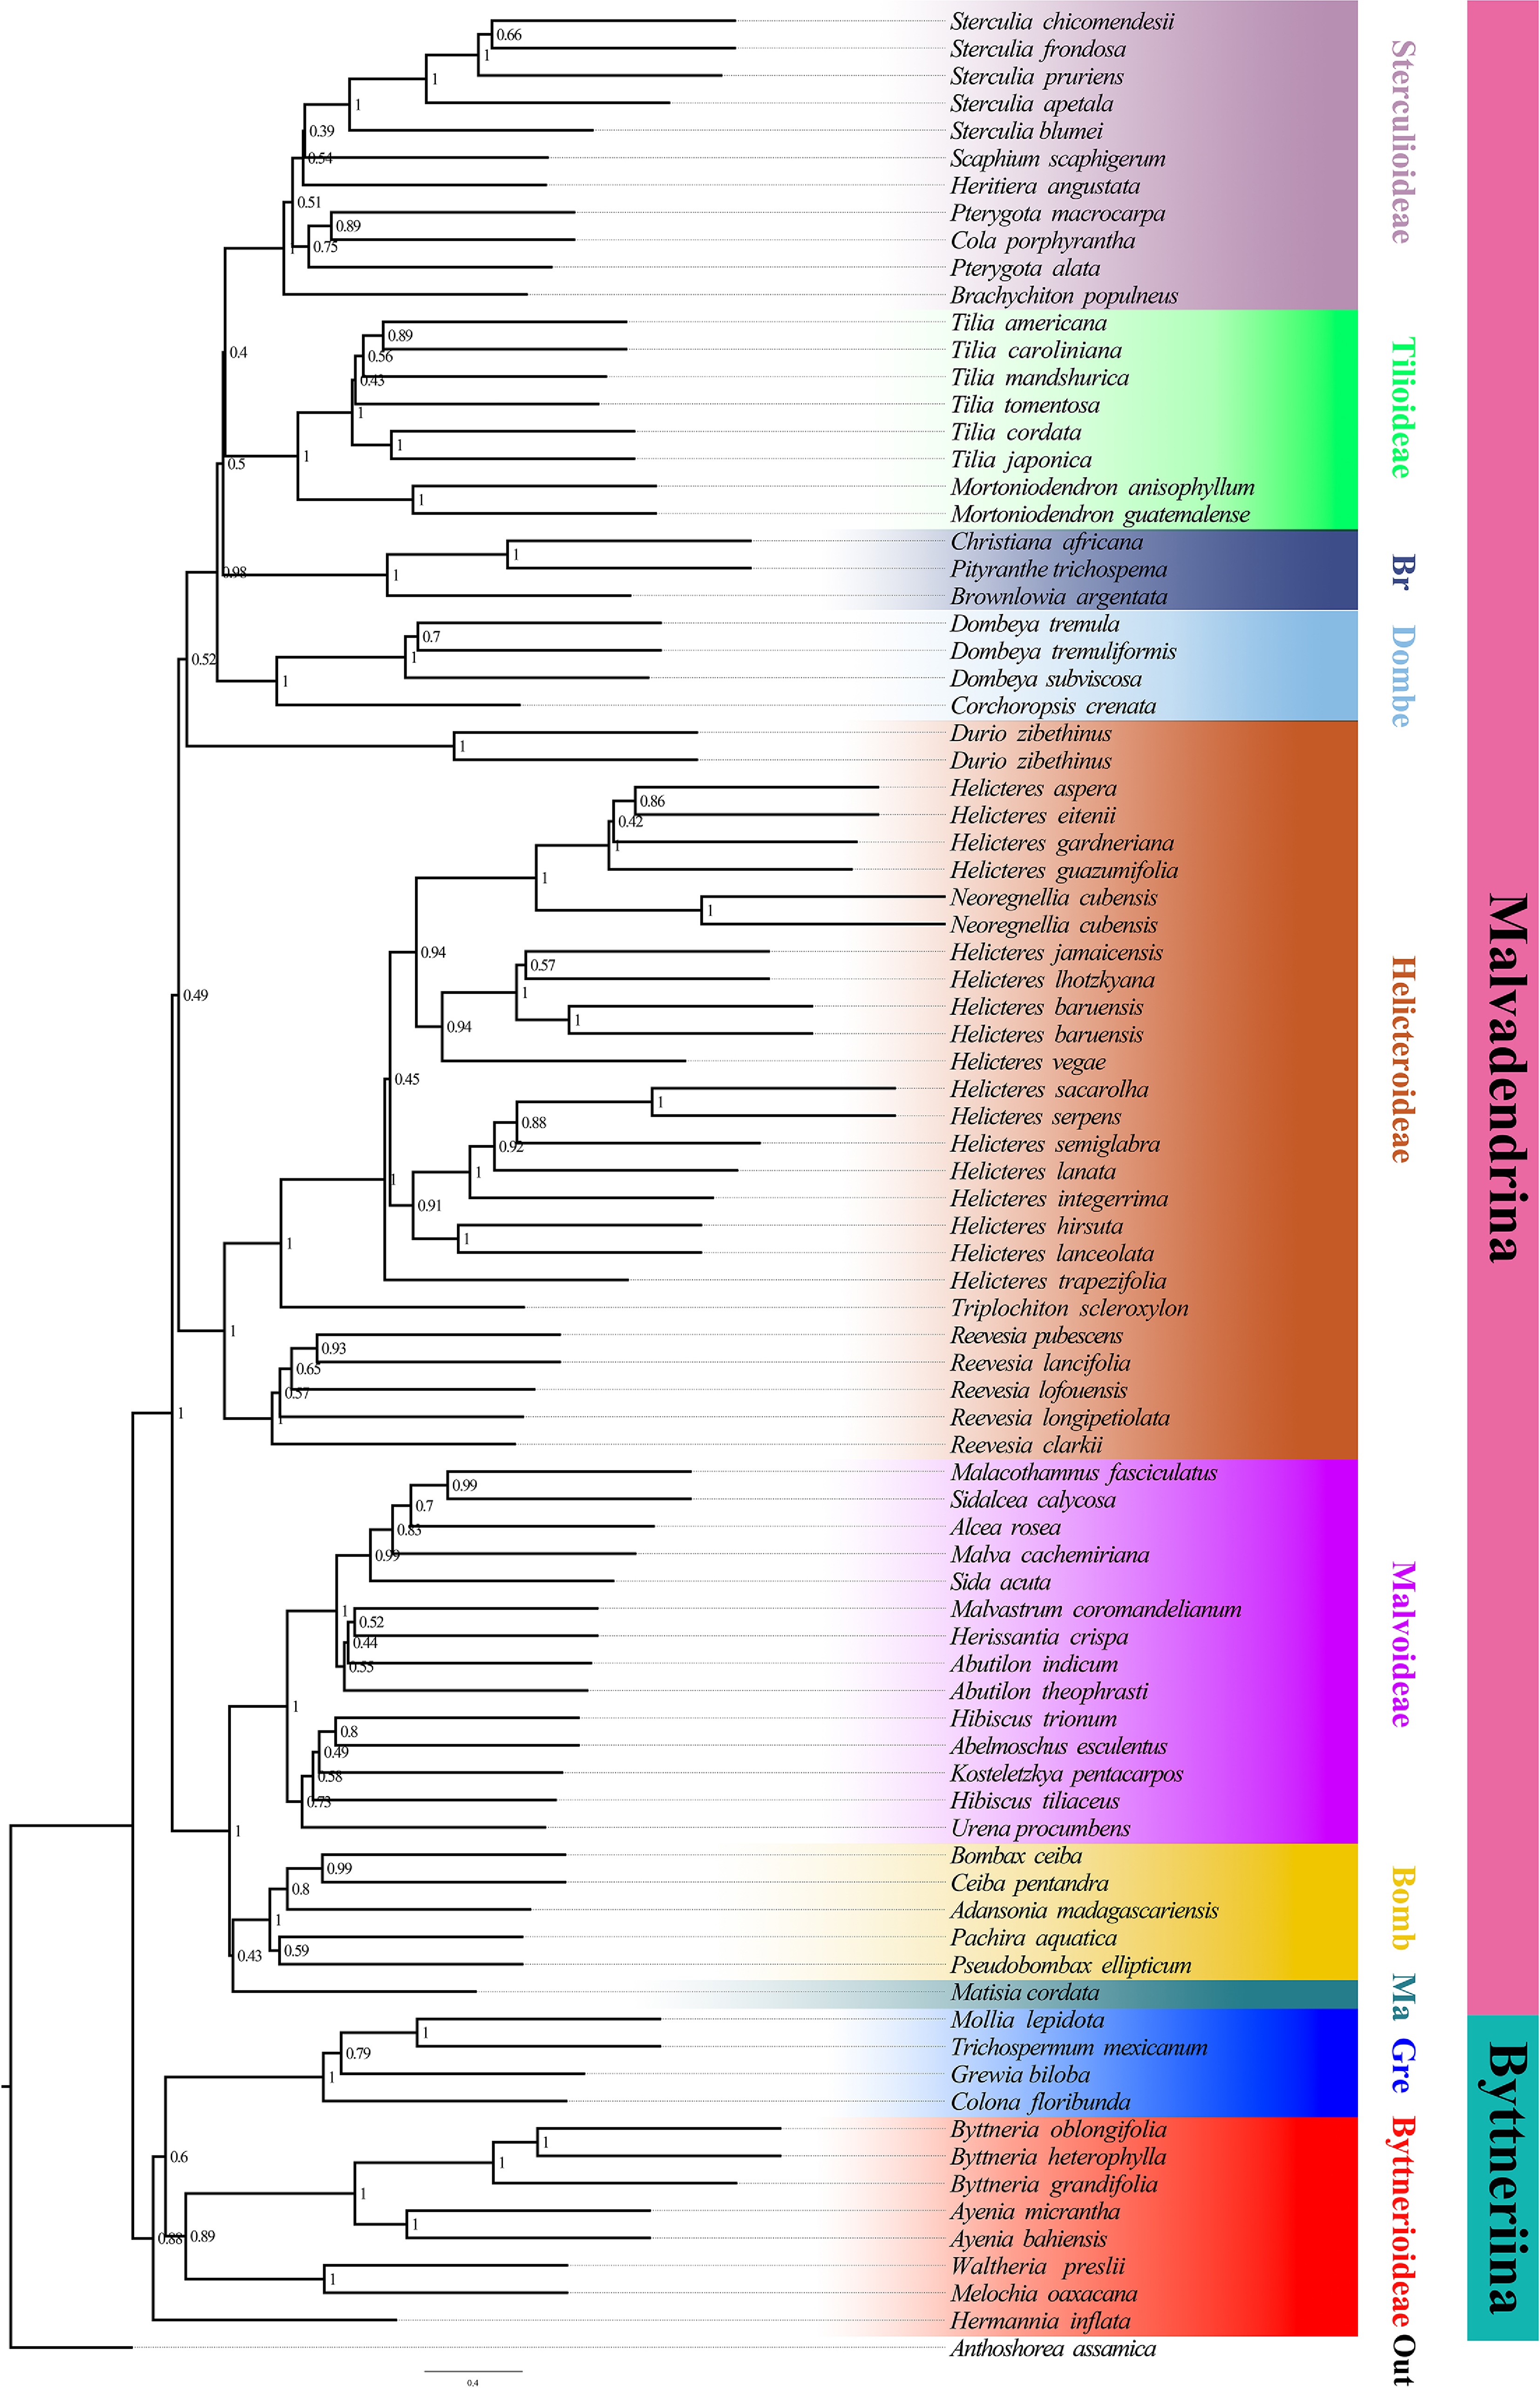
Figure 2.
Species tree inferred from the nuclear dataset using ASTRAL-III. Branch support is given by local posterior probabilities (PP). Major clades corresponding to currently recognized subfamilies are indicated by branch colours as visual references of relationships.
-
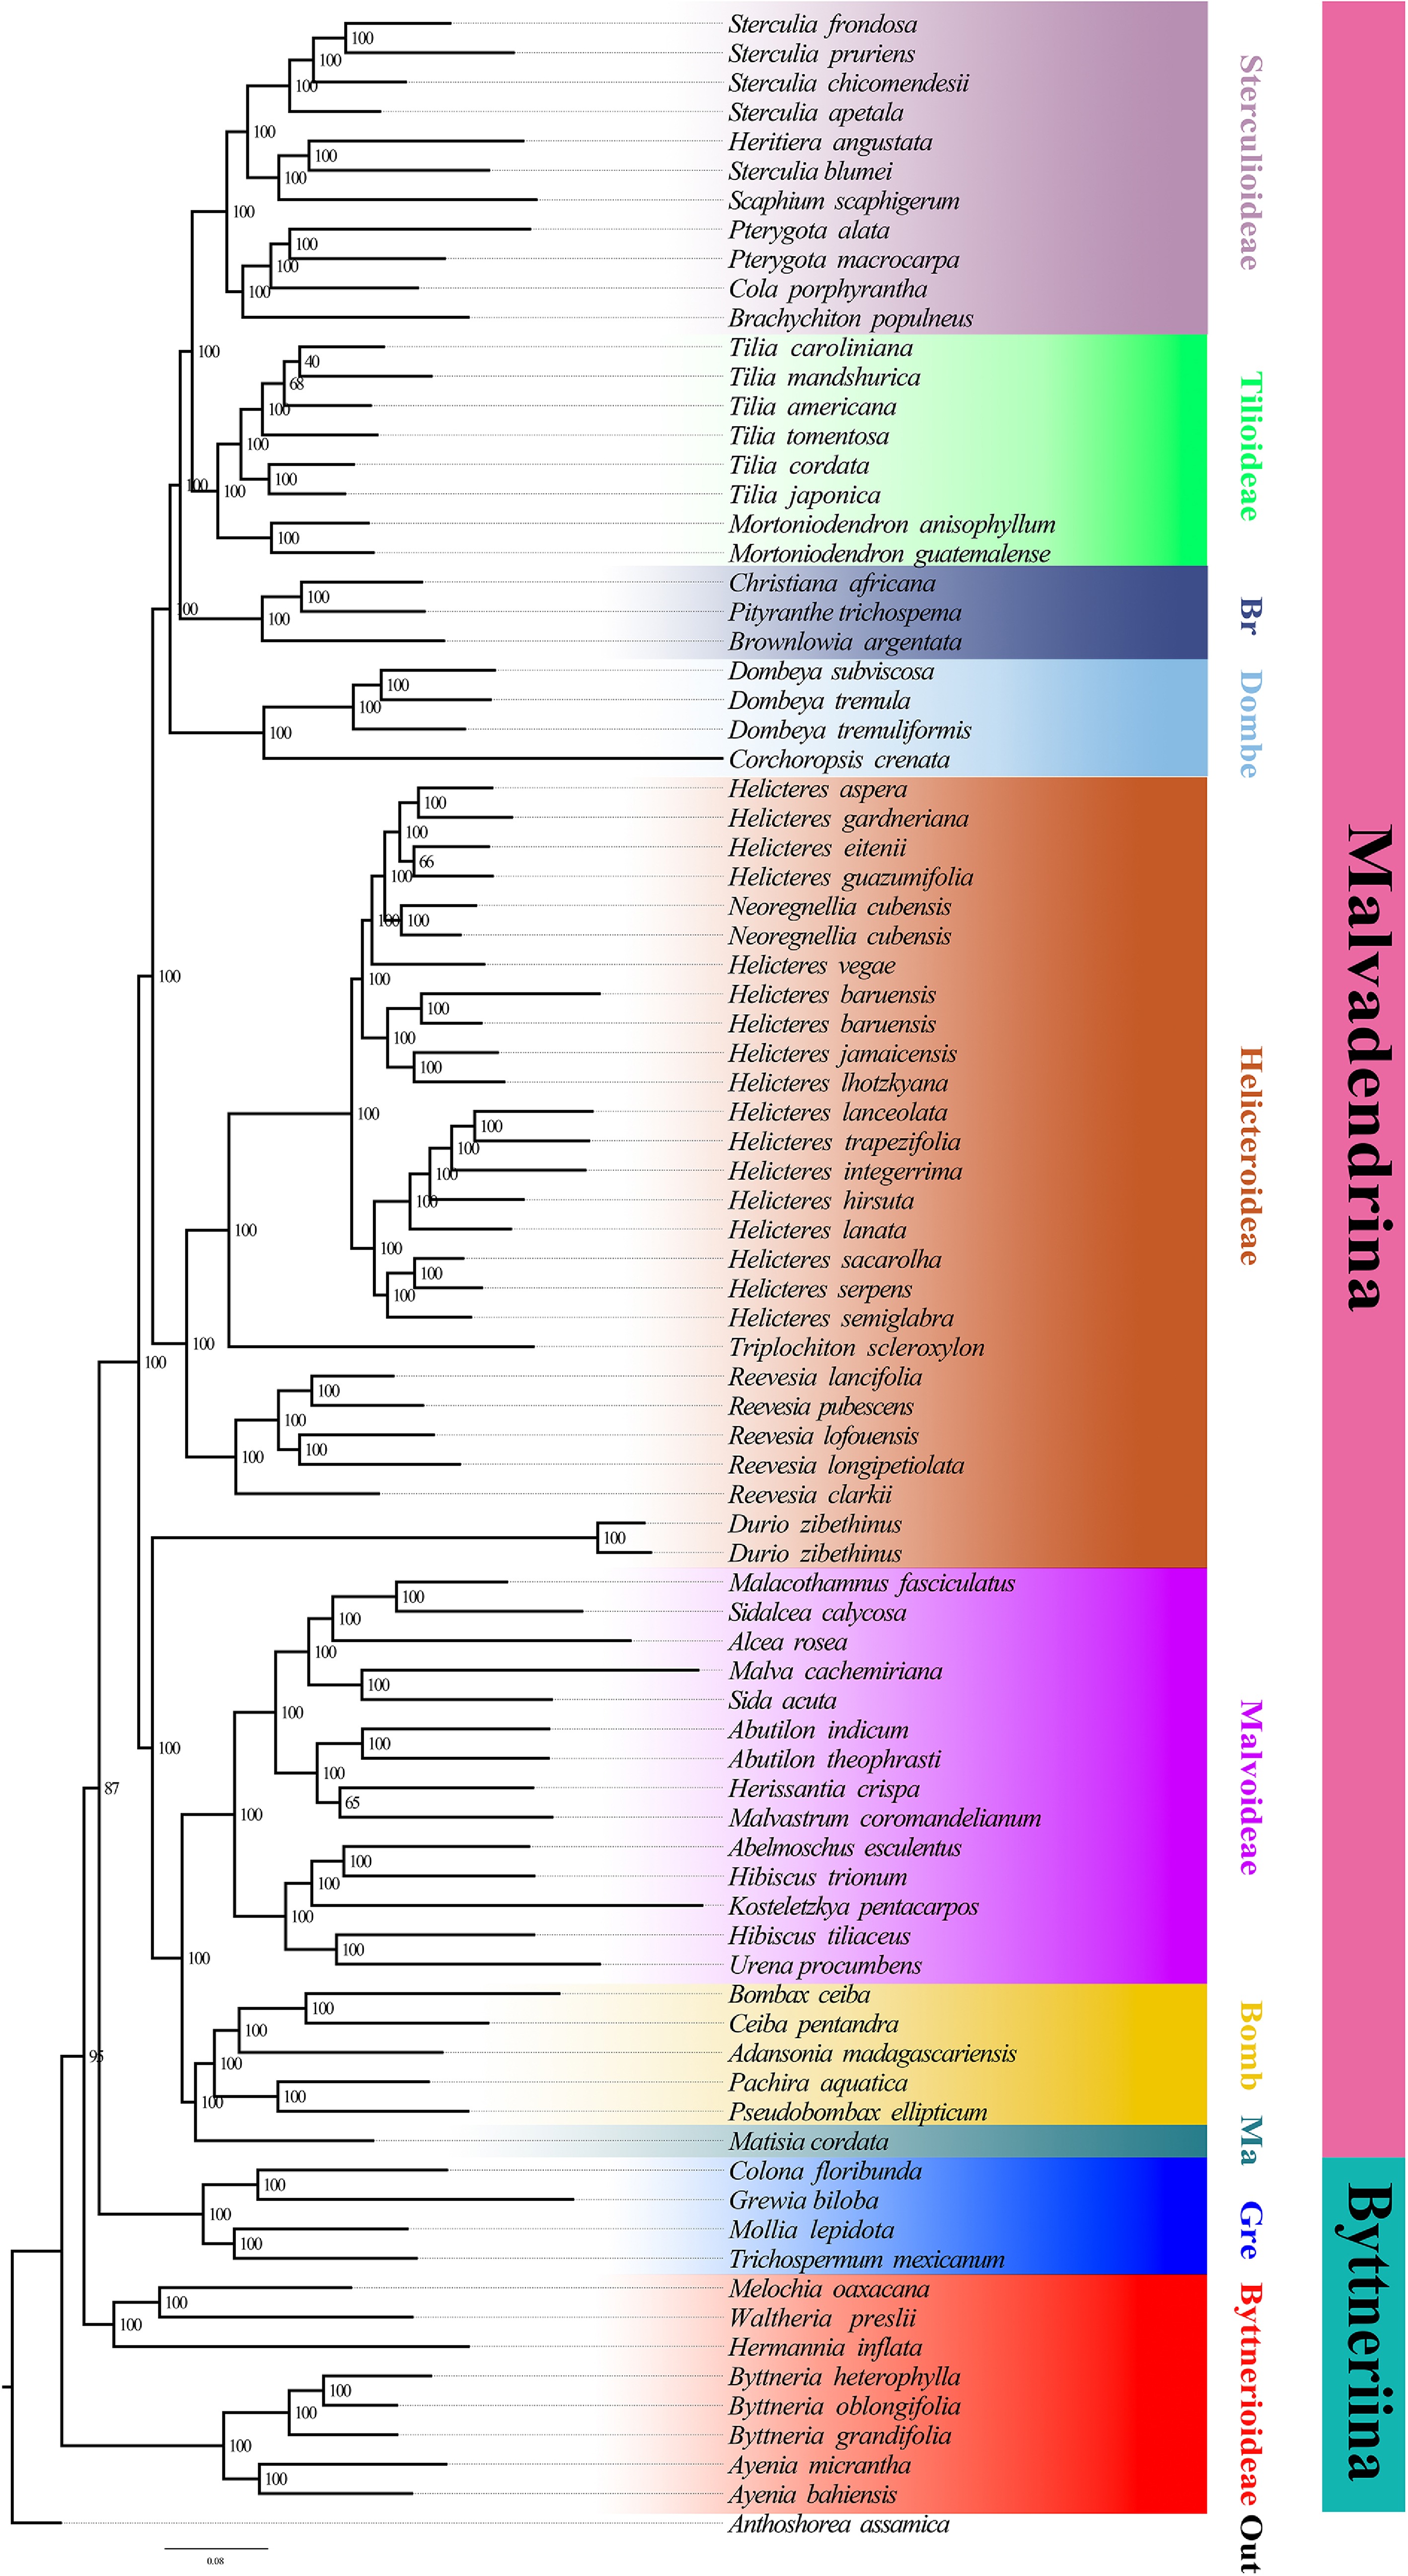
Figure 3.
Maximum-likelihood tree inferred from the concatenated nuclear dataset. Branch support is given by ultrafast bootstrap values (BS). Major clades or evolutionary lineages within the currently recognized subfamilies are indicated by branch colours as visual references of relationships.
-
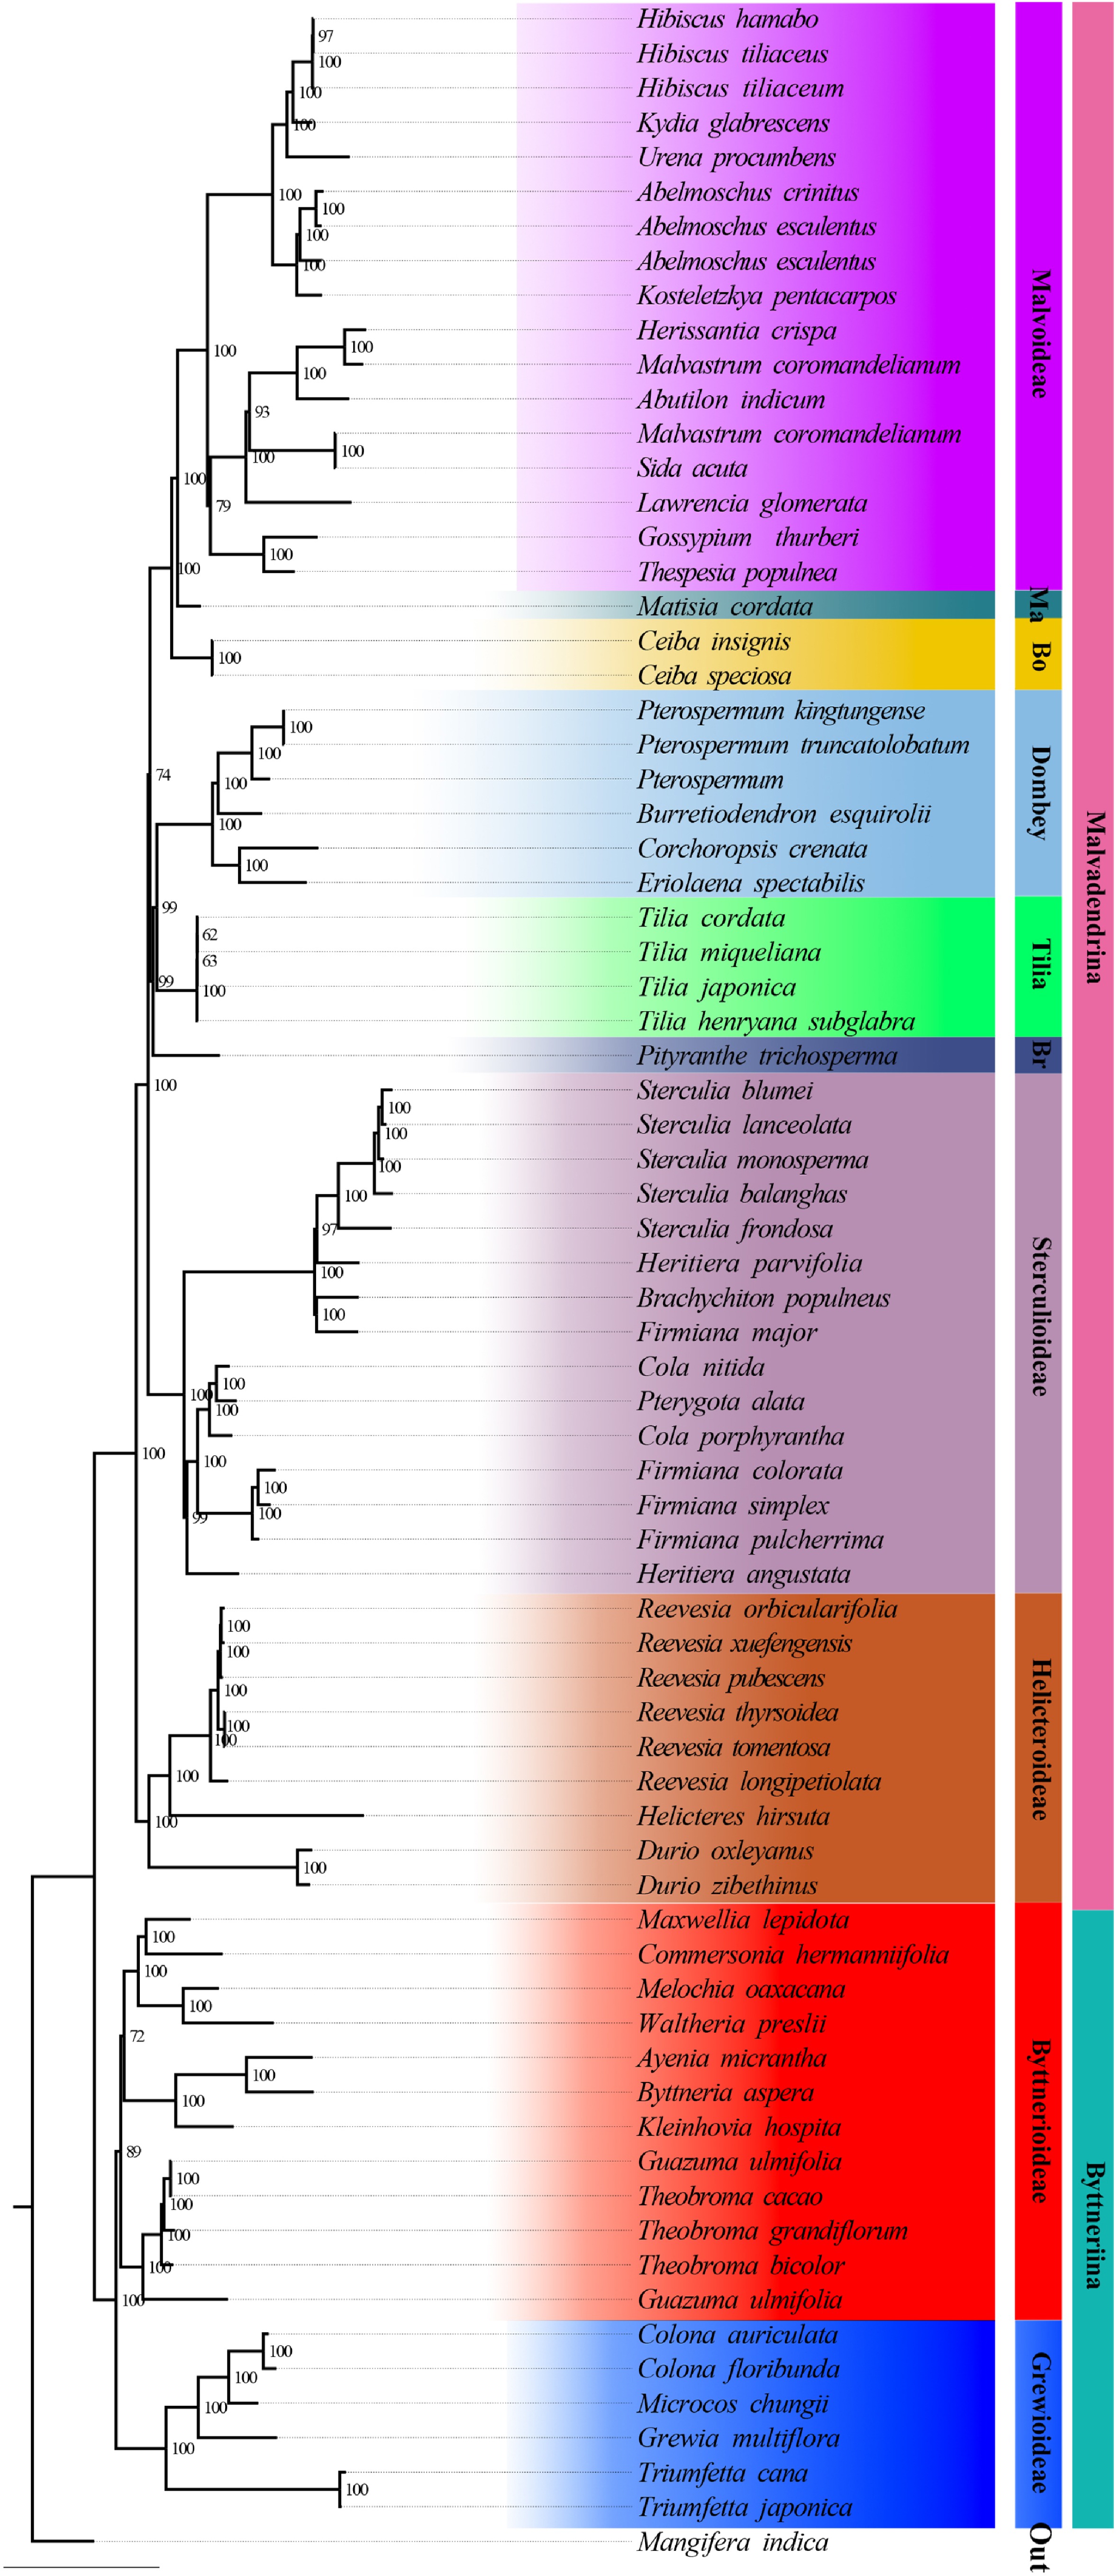
Figure 4.
Maximum-likelihood tree based on plastid data. Support values are displayed above the branches. Currently recognized major taxa or major clades are indicated by branch colours as visual references of relationships.
-
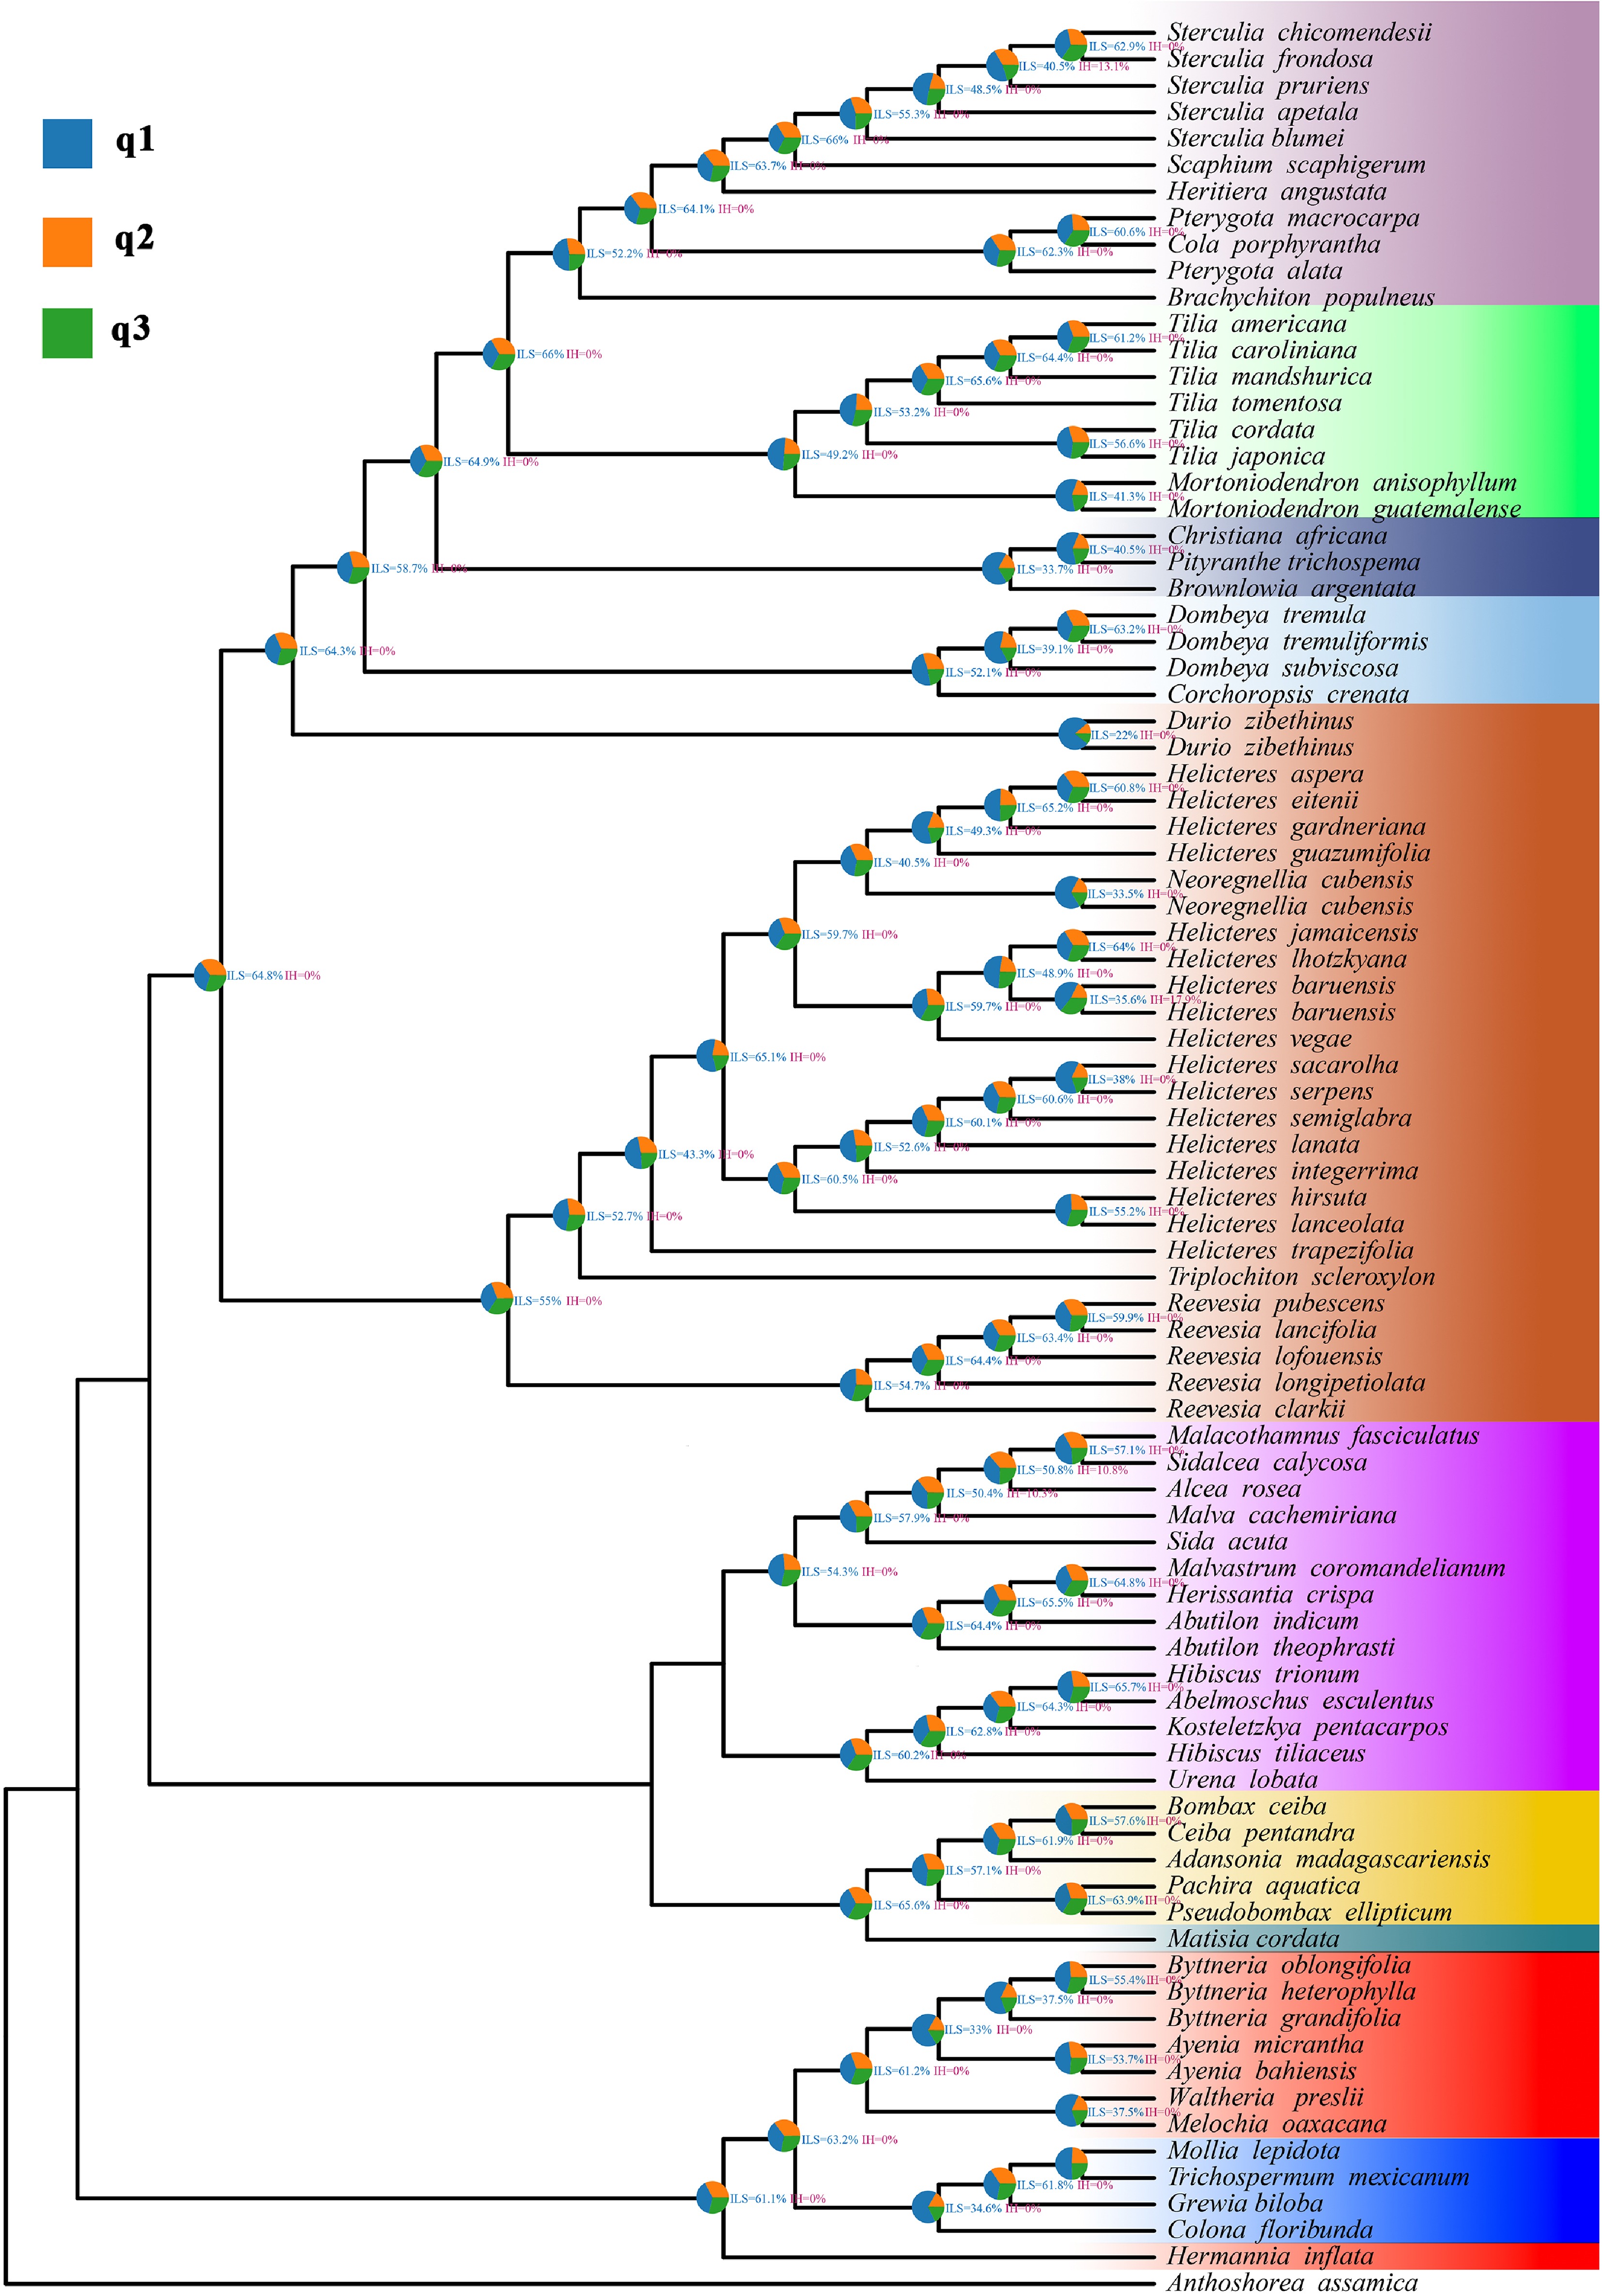
Figure 5.
Phytop analysis of quartet patterns on the ASTRAL species tree of Malvaceae s.l. Each internal node is annotated with a pie chart showing the relative frequencies of the three alternative quartet topologies (q1, q2, q3) around that branch, with blue indicating the topology concordant with the ASTRAL species tree and orange and green indicating the two discordant topologies. Numerical labels next to nodes give the ILS and IH indices inferred by Phytop.
-
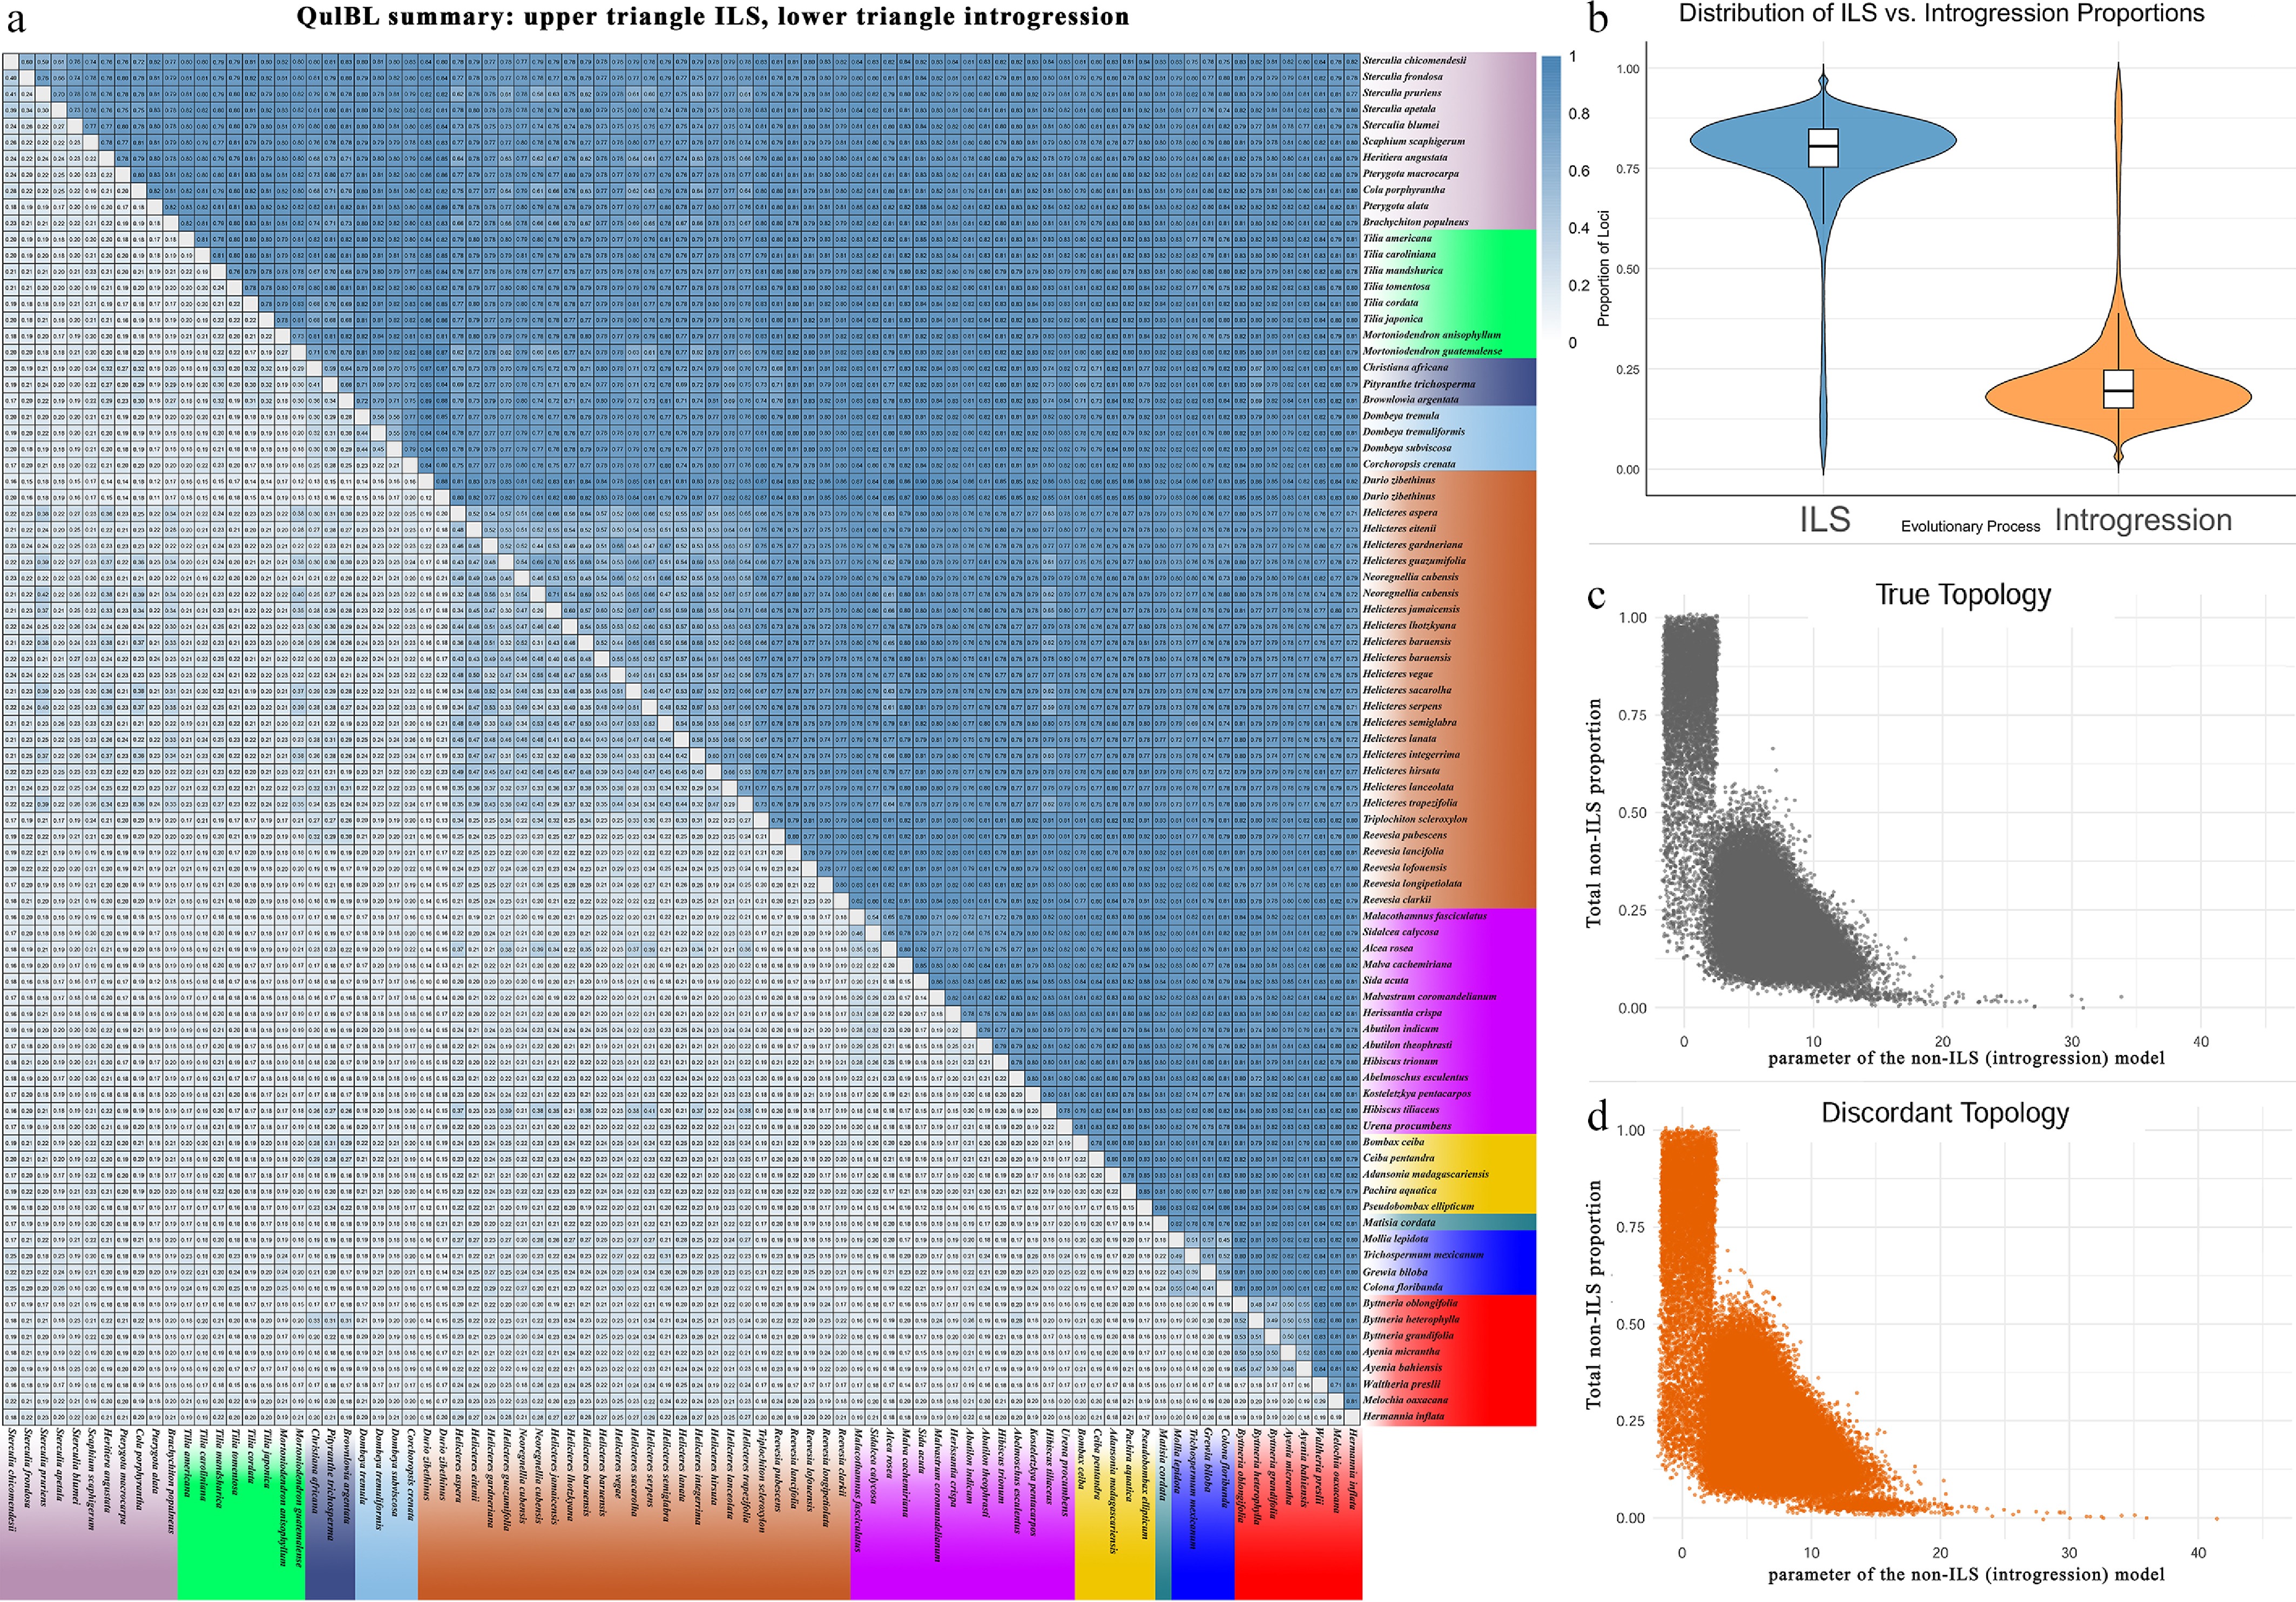
Figure 6.
Tests for introgression. (a) Heatmap summarizing QuIBL results for pairwise species comparisons. For each species pair, the upper triangle shows the mean proportion of loci attributed to ILS, and the lower triangle shows the mean proportion attributed to introgression (mixprop2). Colours indicate proportions from zero to one, and empty cells mark pairs for which no informative triplets were available. (b) Distribution of the proportion of loci that exhibit a history of ILS or introgression across all discordant topologies, respectively. (c) Relationship between internal branch length (in coalescent units) and the proportion of non-ILS loci for triplets matching the true topology. (d) Same as (c), but for triplets with discordant topologies.
-
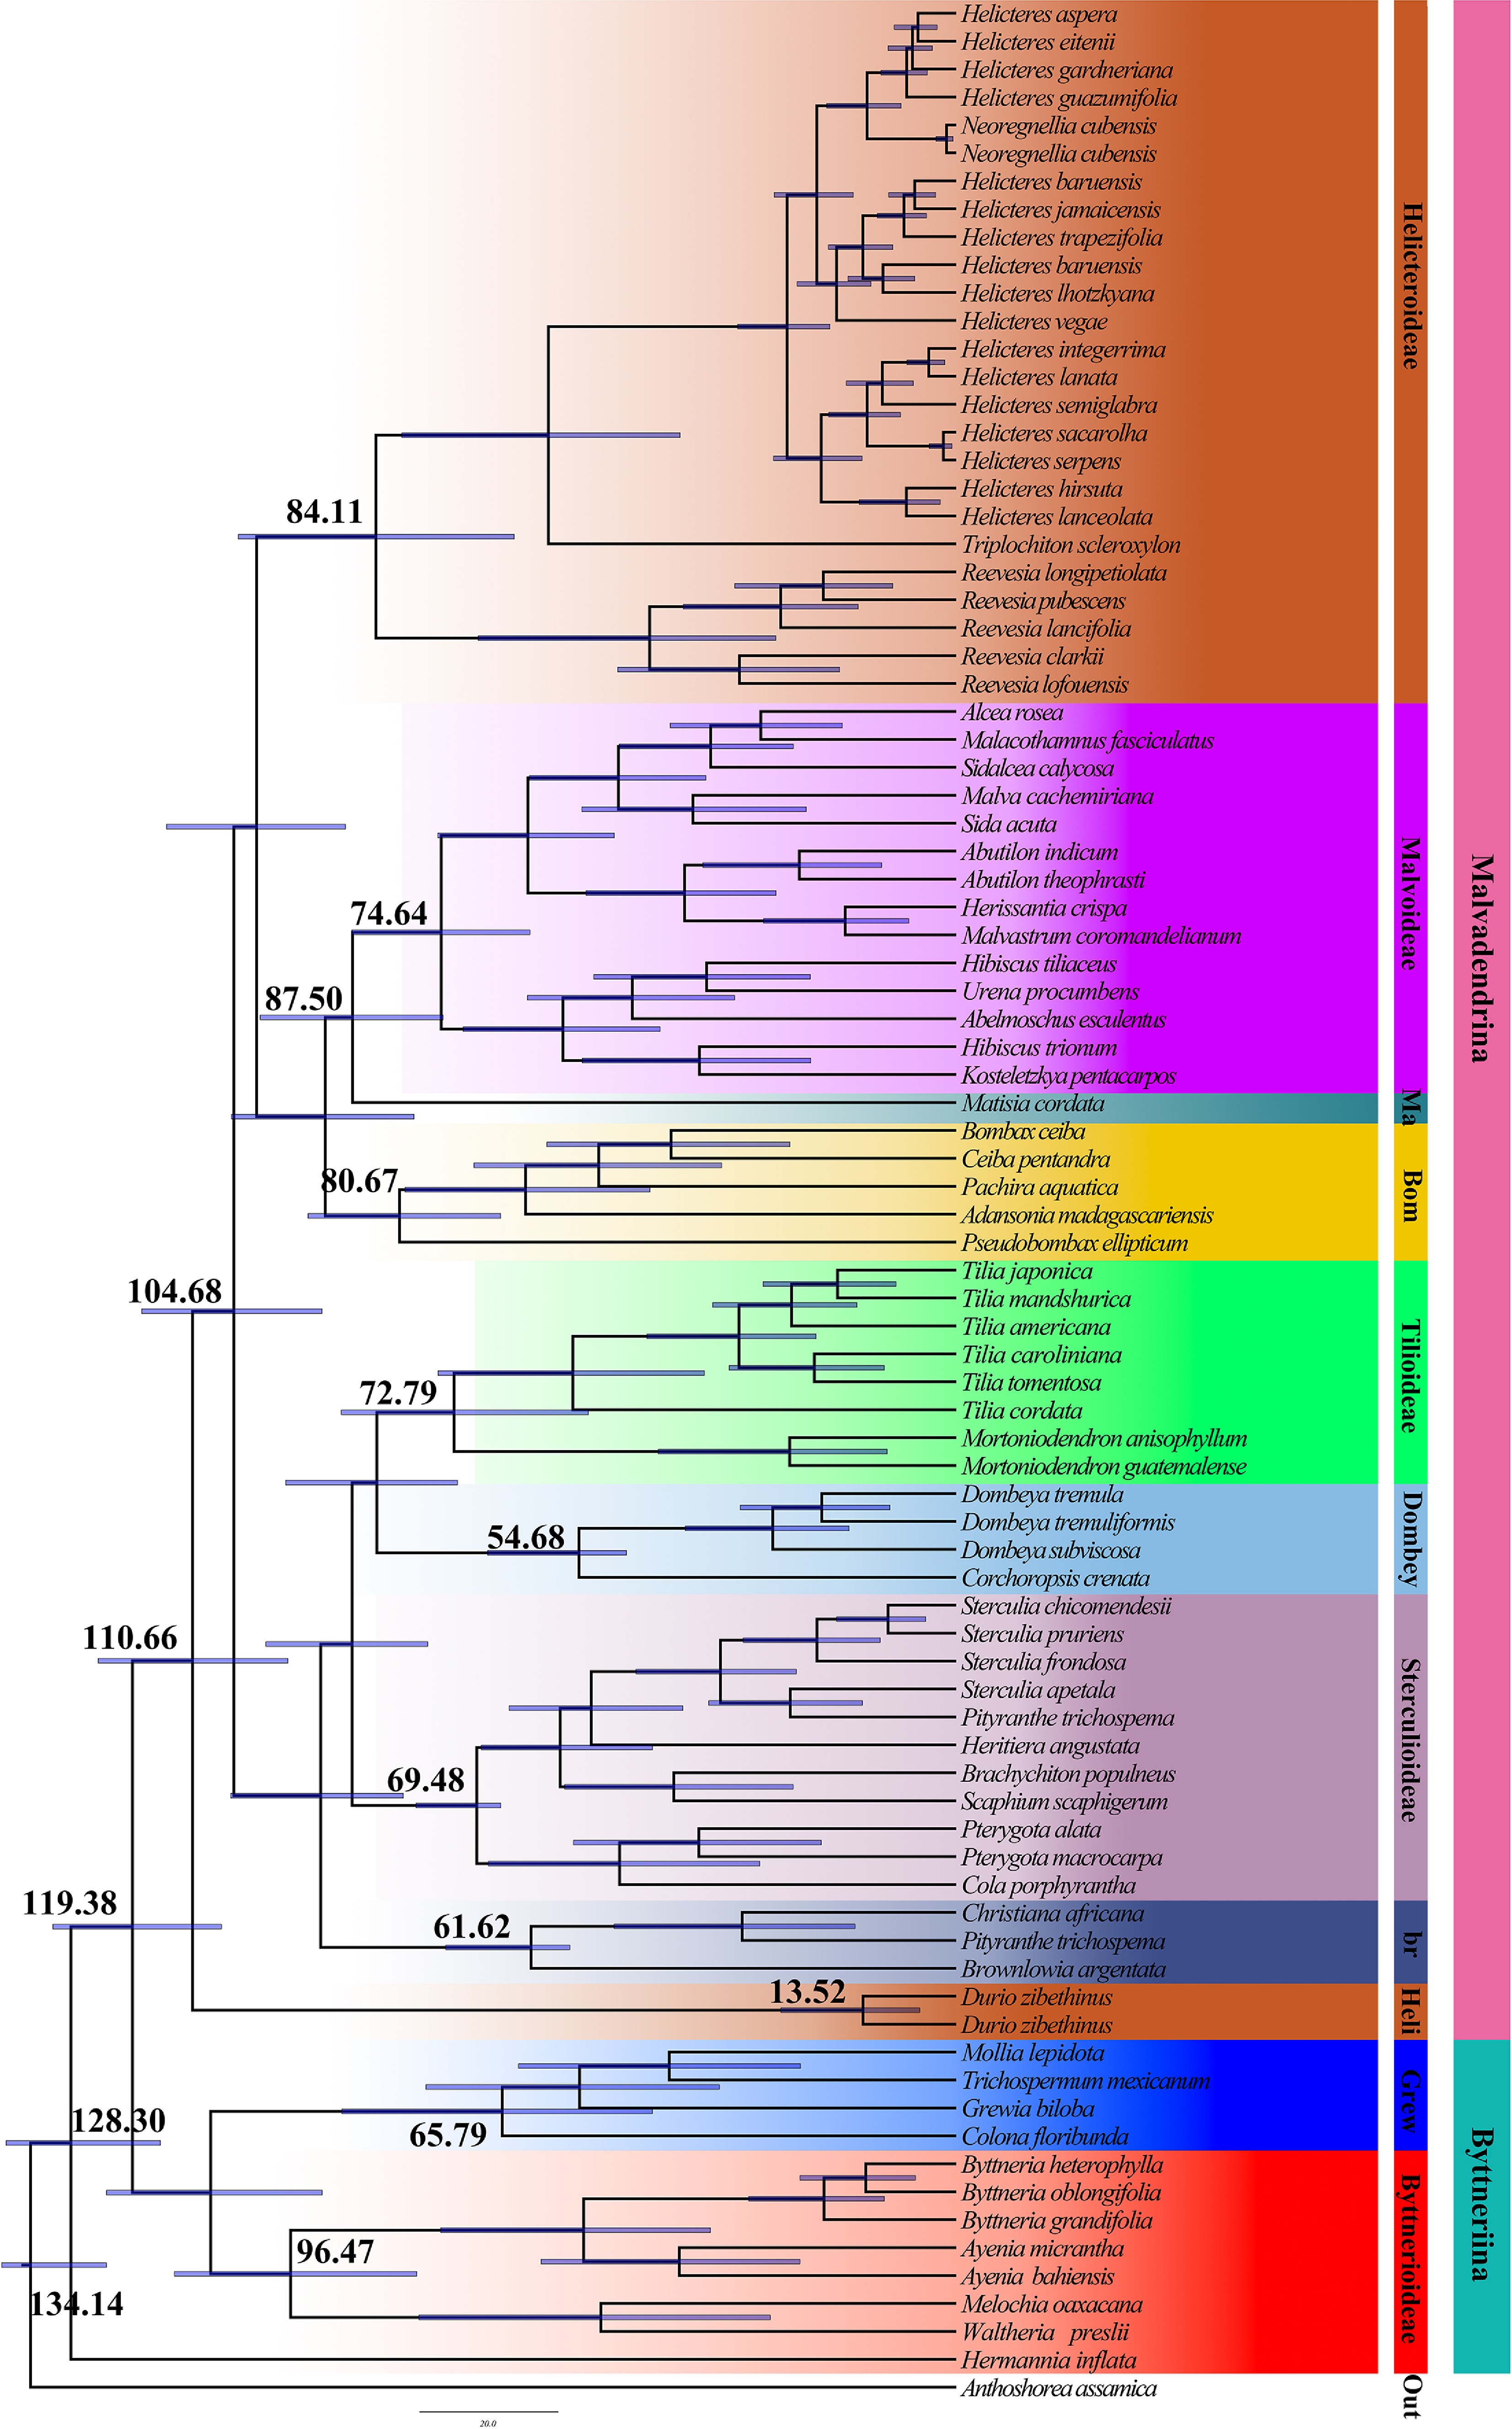
Figure 7.
Divergence time analysis based on nuclear data using BEAST. Each major branch provides mean divergence times and 95% highest posterior density (HPD) intervals. A complete visualization of the 95% HPD intervals across all nodes is provided in Supplementary Fig. S1.
-
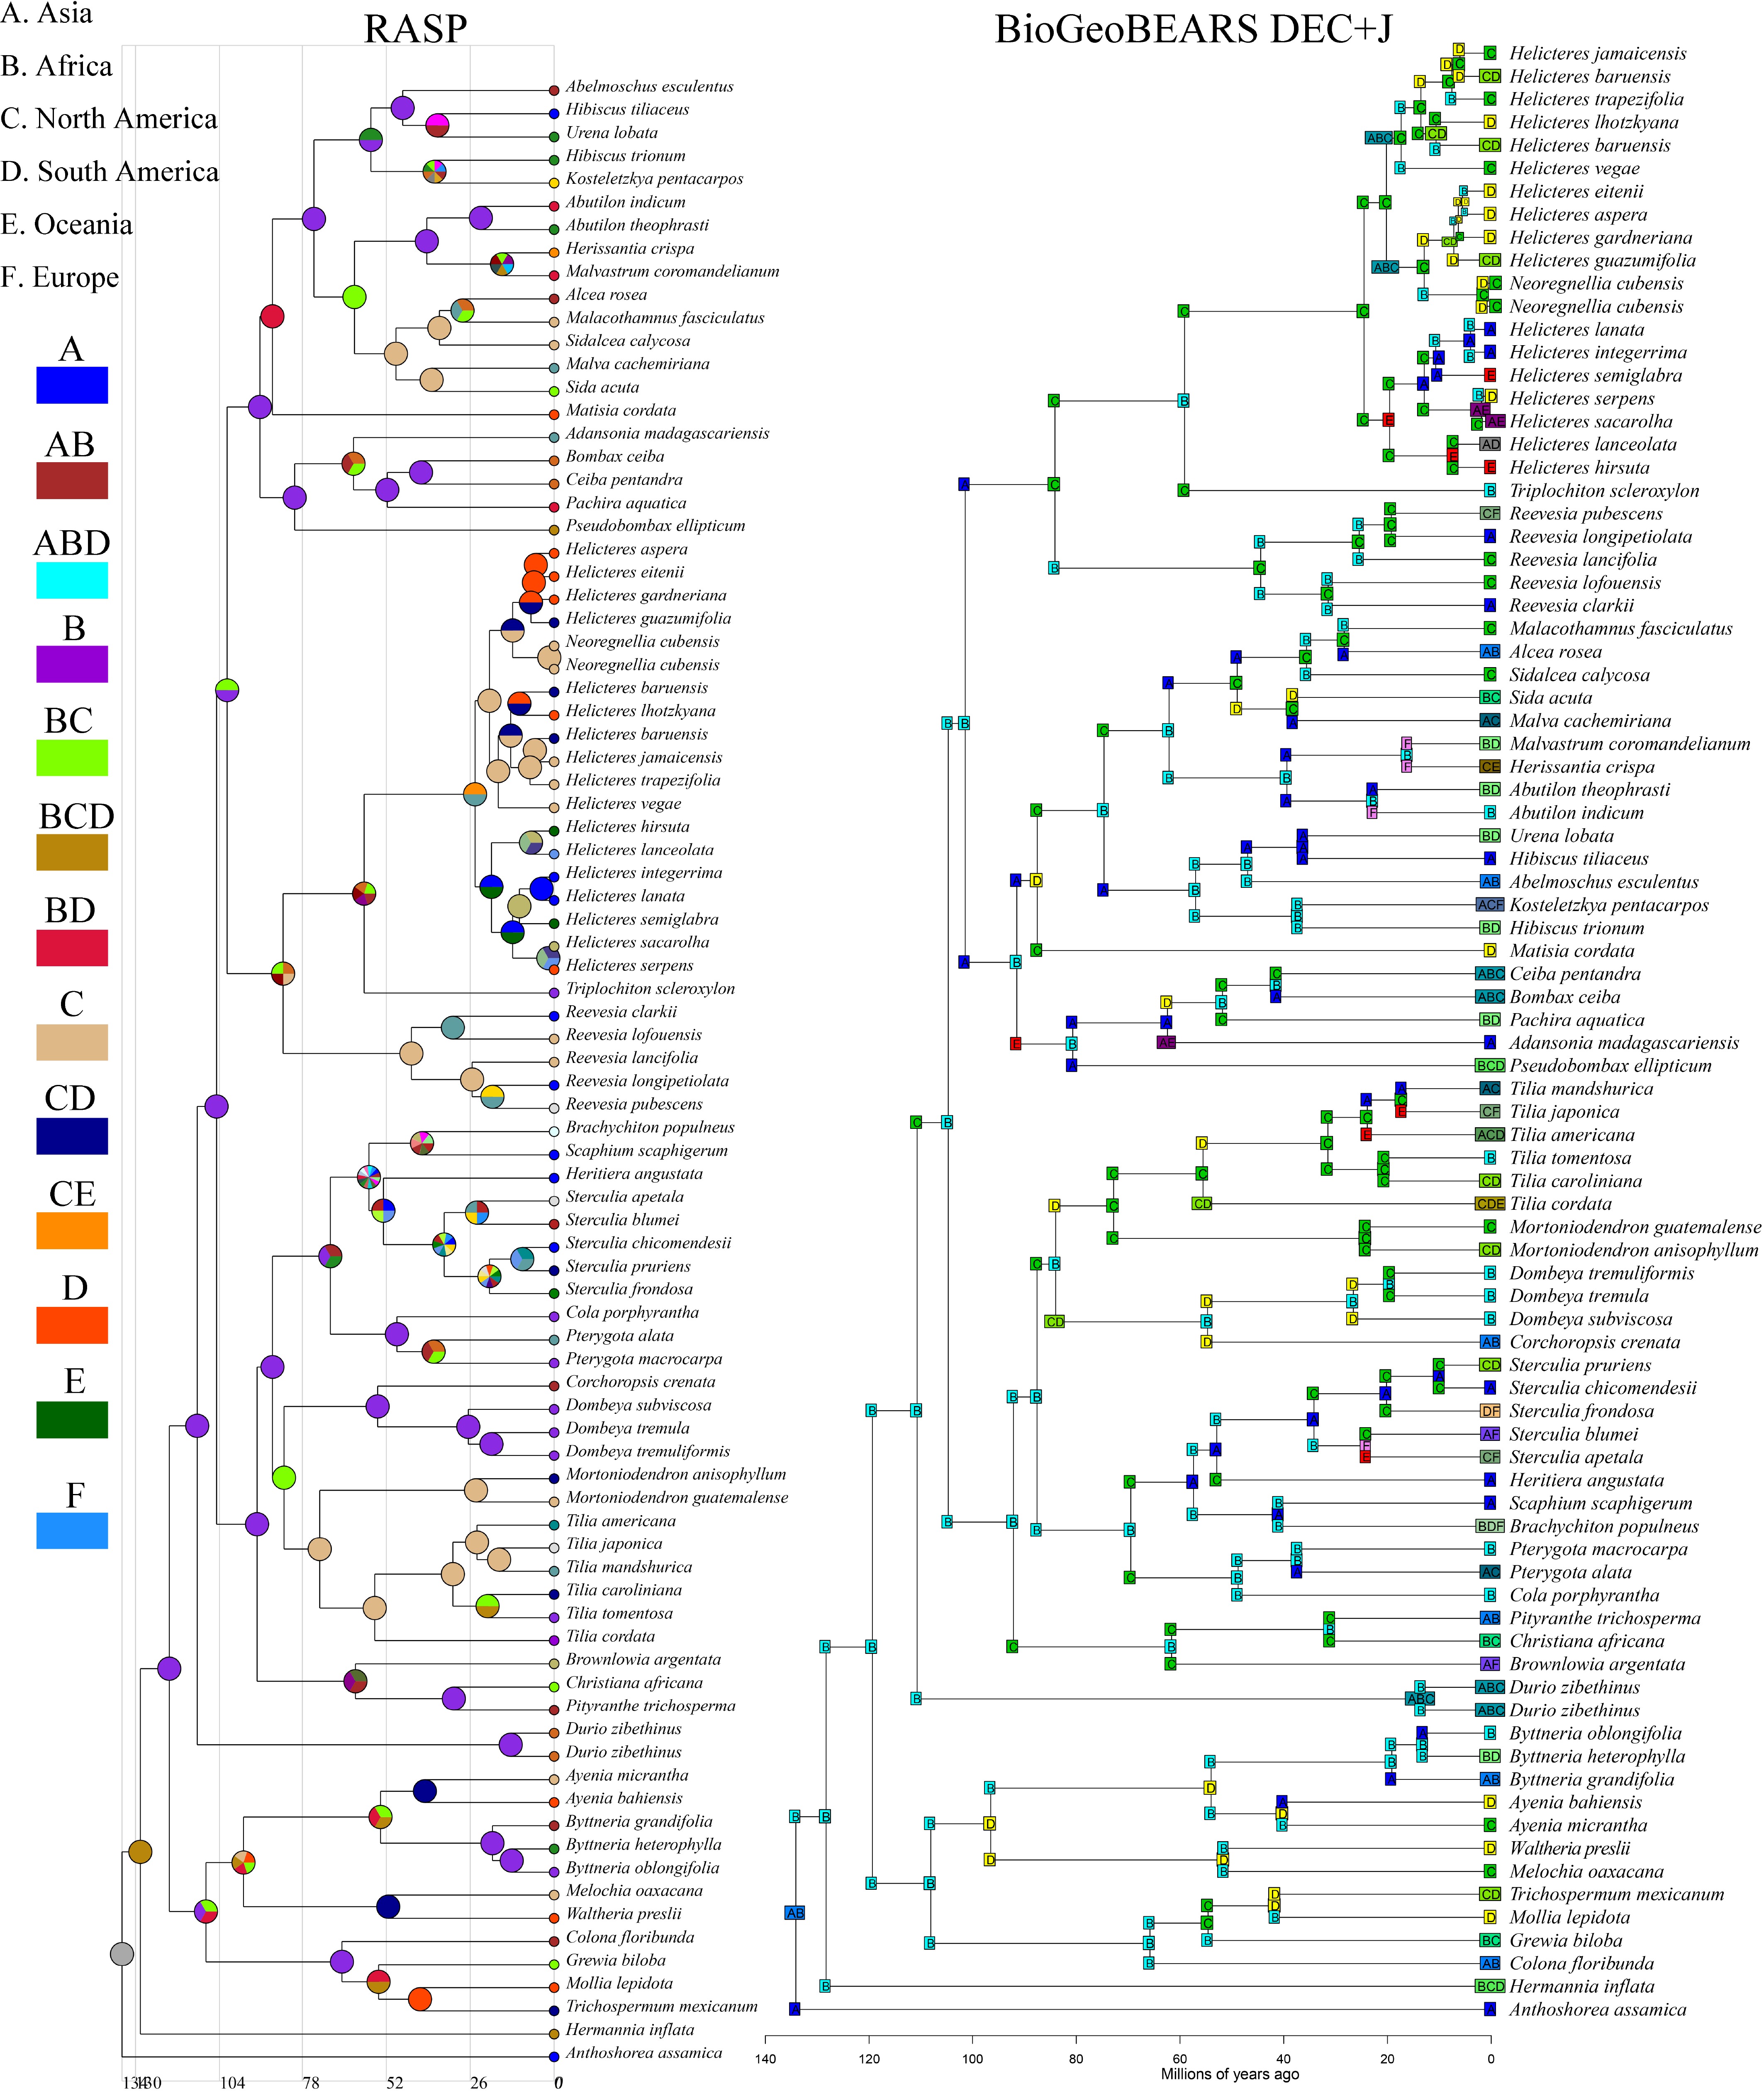
Figure 8.
The figure on the left is an estimate of the ancestral range of Malvaceae s.l. taxa in the RASP using the S-DIVA model. The figure on the right uses the BioGeoBEARS script to select the optimal output model based on six models to estimate the ancestral range of the Malvaceae s.l. groups, which are geographically distributed as (A) Asia, (B) Africa, (C) North America, (D) South America, (E) Oceania, and (F) Europe.
Figures
(8)
Tables
(0)