-
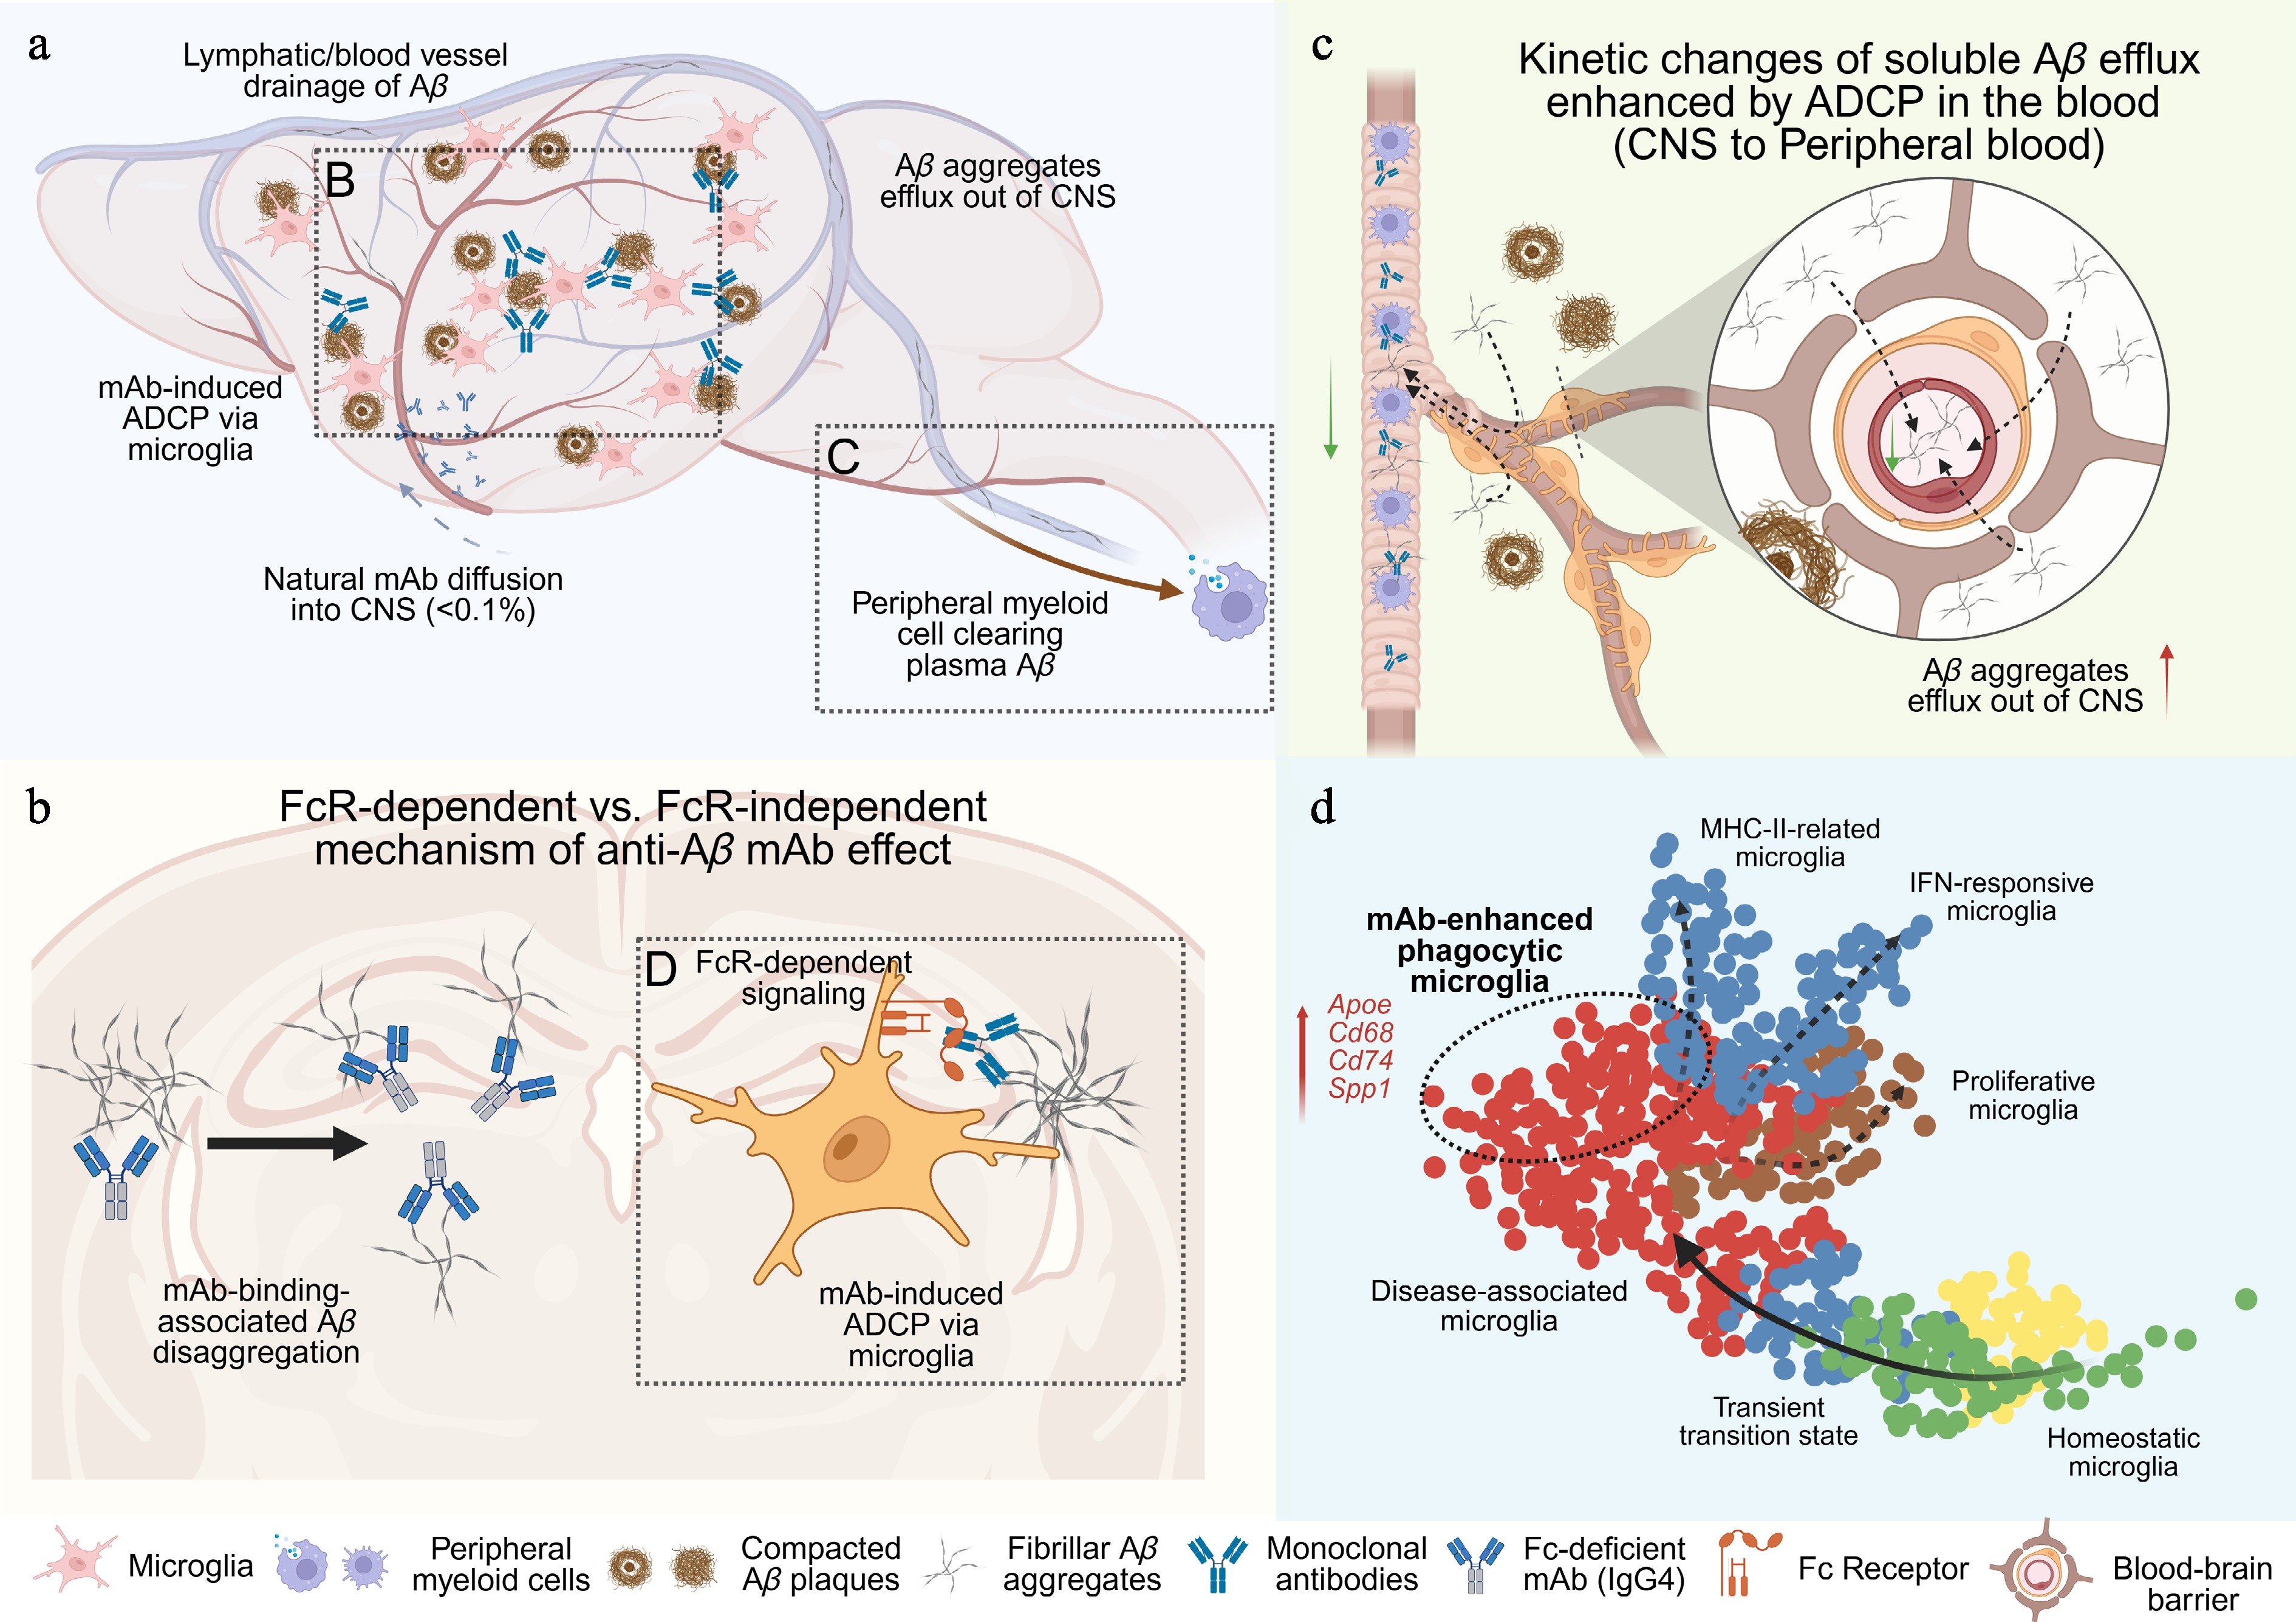
Figure 1.
The conceptual schemes of biological processes involved in the anti-Aβ monoclonal antibody treatments. This figure was created by
biorender.com . (a) Scheme of how anti-Aβ monoclonal antibody therapy interplays with pathological processes regarding the distribution and species of Aβ aggregates. Five crucial pathways for improving Aβ removal were highlighted with text. The blue dash arrow indicates the mAb diffusion into the CNS system. The brown solid arrow shows the efflux of Aβ aggregates from CNS to the peripheral system. Two dashed boxes highlight the antibody-involved biological processes presented in (b) and (c). (b) Scheme of two independent mechanisms to reduce Aβ aggregation in the parenchyma. The dashed box shows the microglial ADCP induced by anti-Aβ antibody, which is associated with the transcriptomic changes discussed in (d). (c) Scheme of how peripheral anti-Aβ mAb induced ADCP alters the passive efflux of Aβ aggregates from CNS to the peripheral blood circulation through the blood-brain-barrier. The green arrows indicate the decreased concentration gradient of Aβ aggregates in the blood stream. (d) The conceptual UMAP of lecanemab-induced microglial responses. Solid arrows indicate the transcriptomic trajectory in response to pathology of neurodegenerative diseases defined by previous literature. Dashed arrows show presumable trajectory among different terminal microglial signatures. The dashed oval highlights the theoretical population of phagocytic microglia. Representative genes upregulated in the lecanemab-induced microglial signature are highlighted in red.
Figures
(1)
Tables
(0)