-
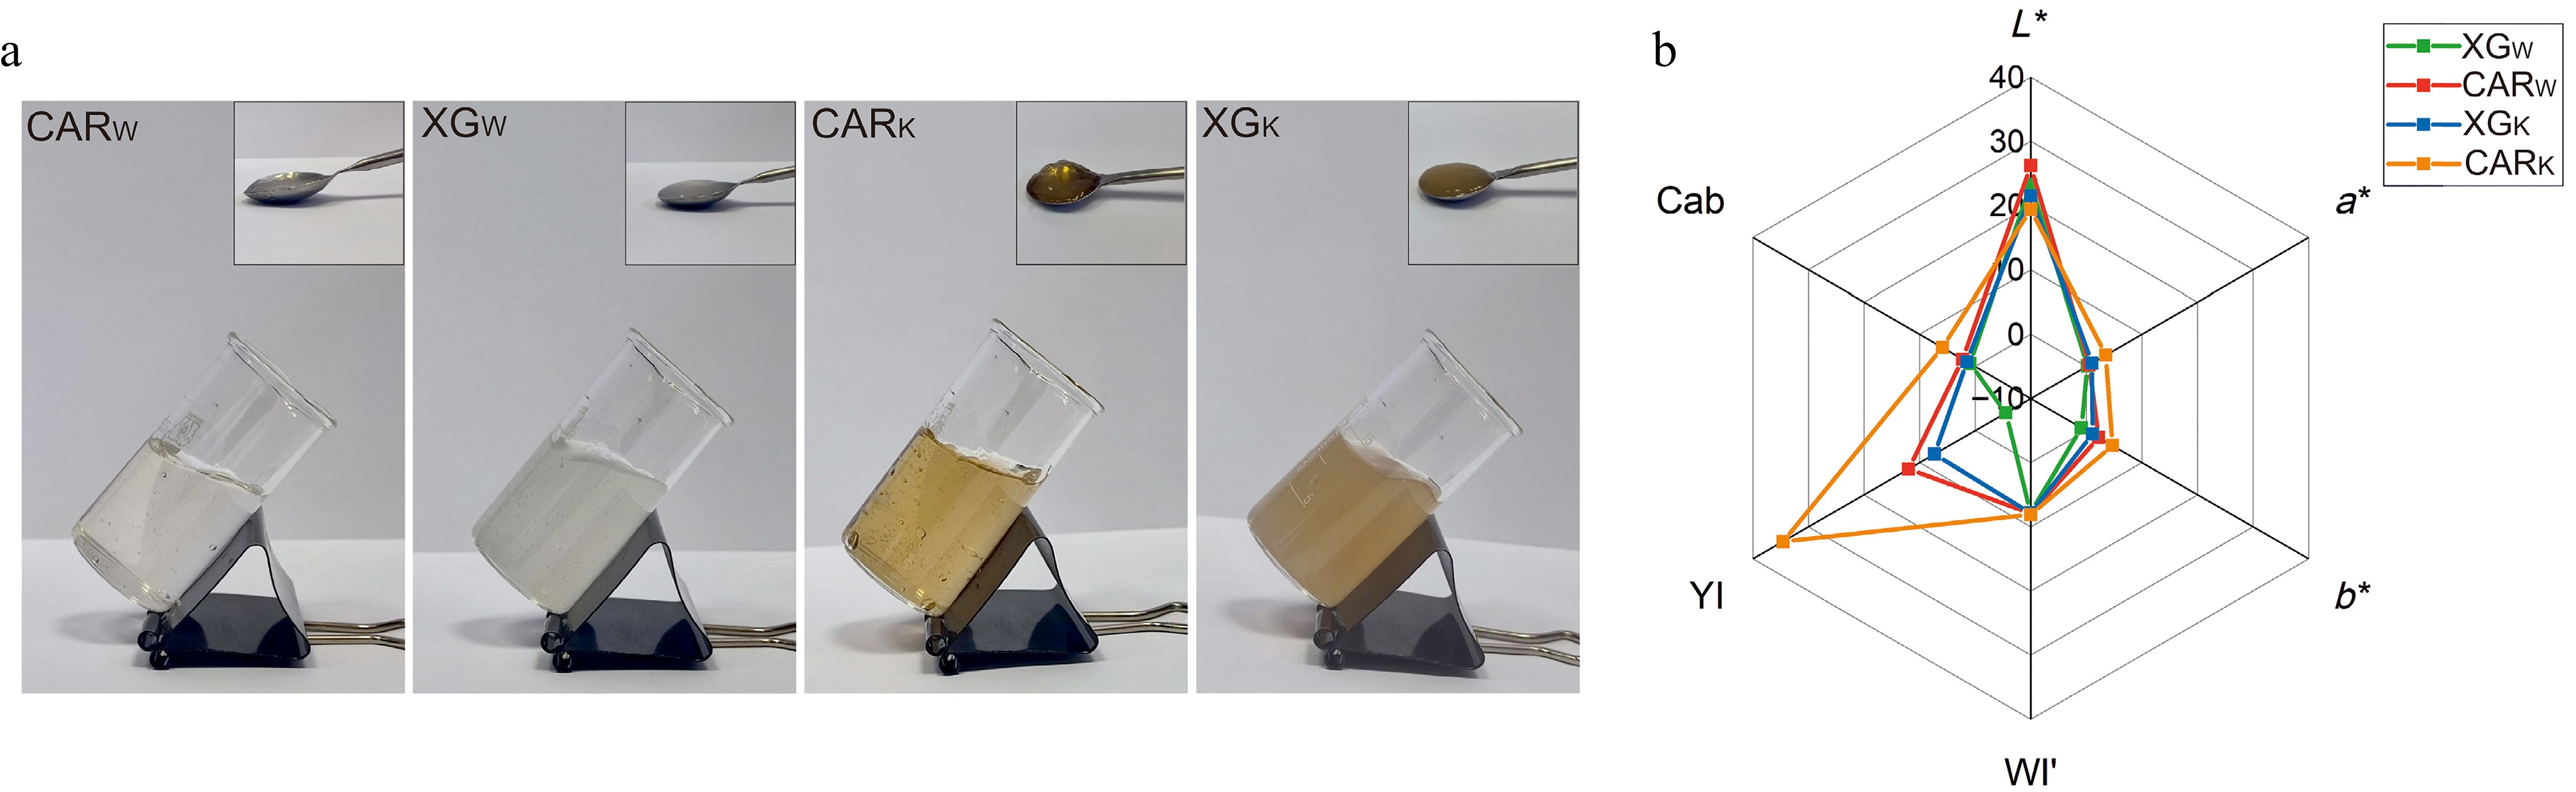
Figure 1.
(a) Appearance of samples (0.9% hydrocolloids). (b) Diagram of color characteristics (L*, a*, b*, whiteness index [WI], yellowness index [YI] and chroma [Cab]) of samples. (WI' – whiteness index values are reduced by a factor of ten in the diagram). XGk and CARk – samples based on 50% kombucha solution structured with xanthan gum and carrageenan. XGw and CARw – water-based samples structured with xanthan gum and carrageenan.
-
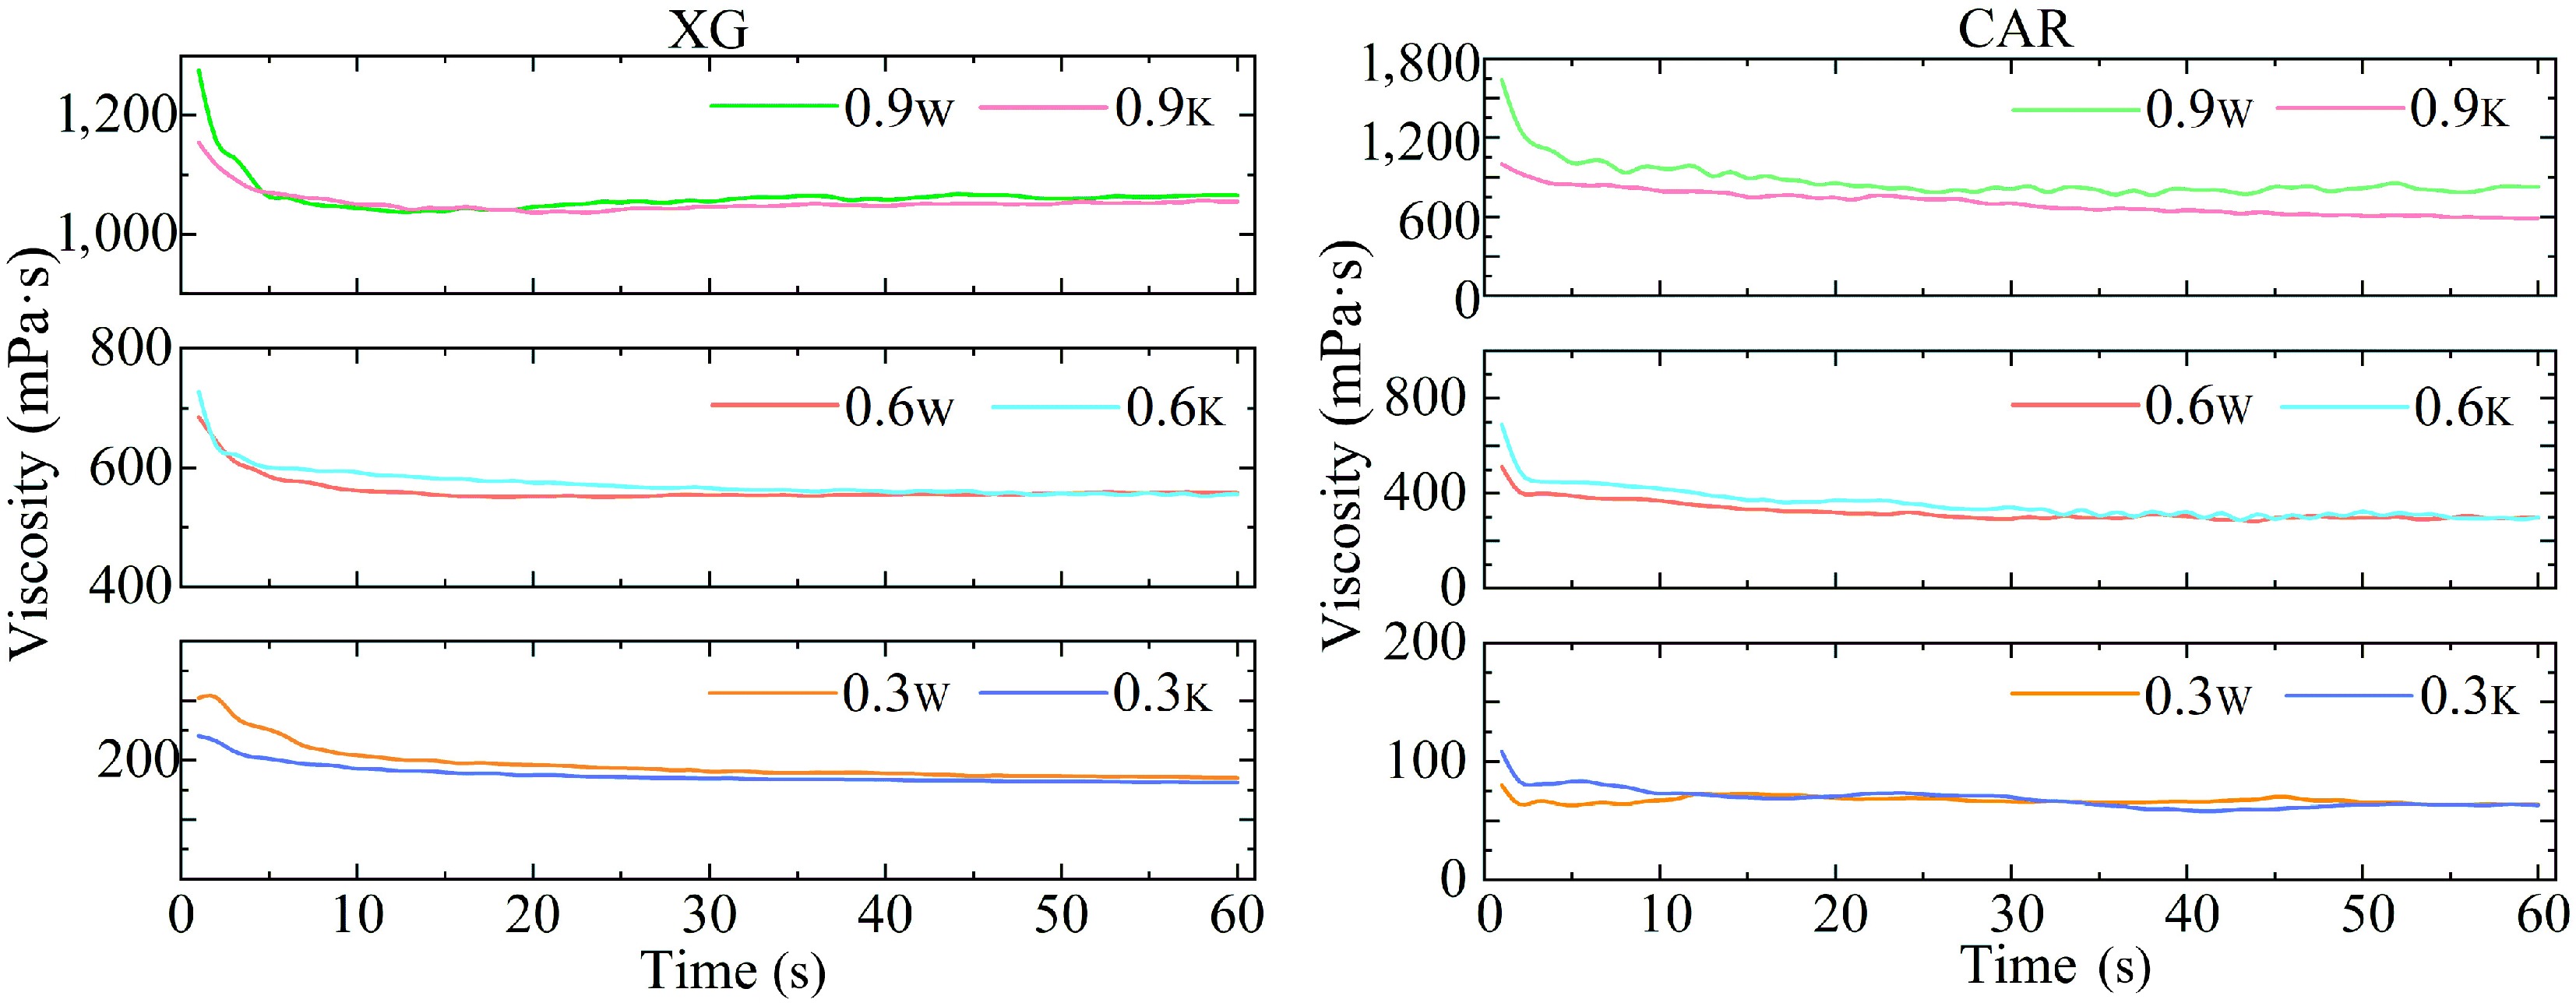
Figure 2.
Variation of viscosity of the investigated samples. XG and CAR – samples structured with xanthan gum and carrageenan respectively. Index 'w' denotes samples based on water; index 'k' denotes samples based on kombucha.
-
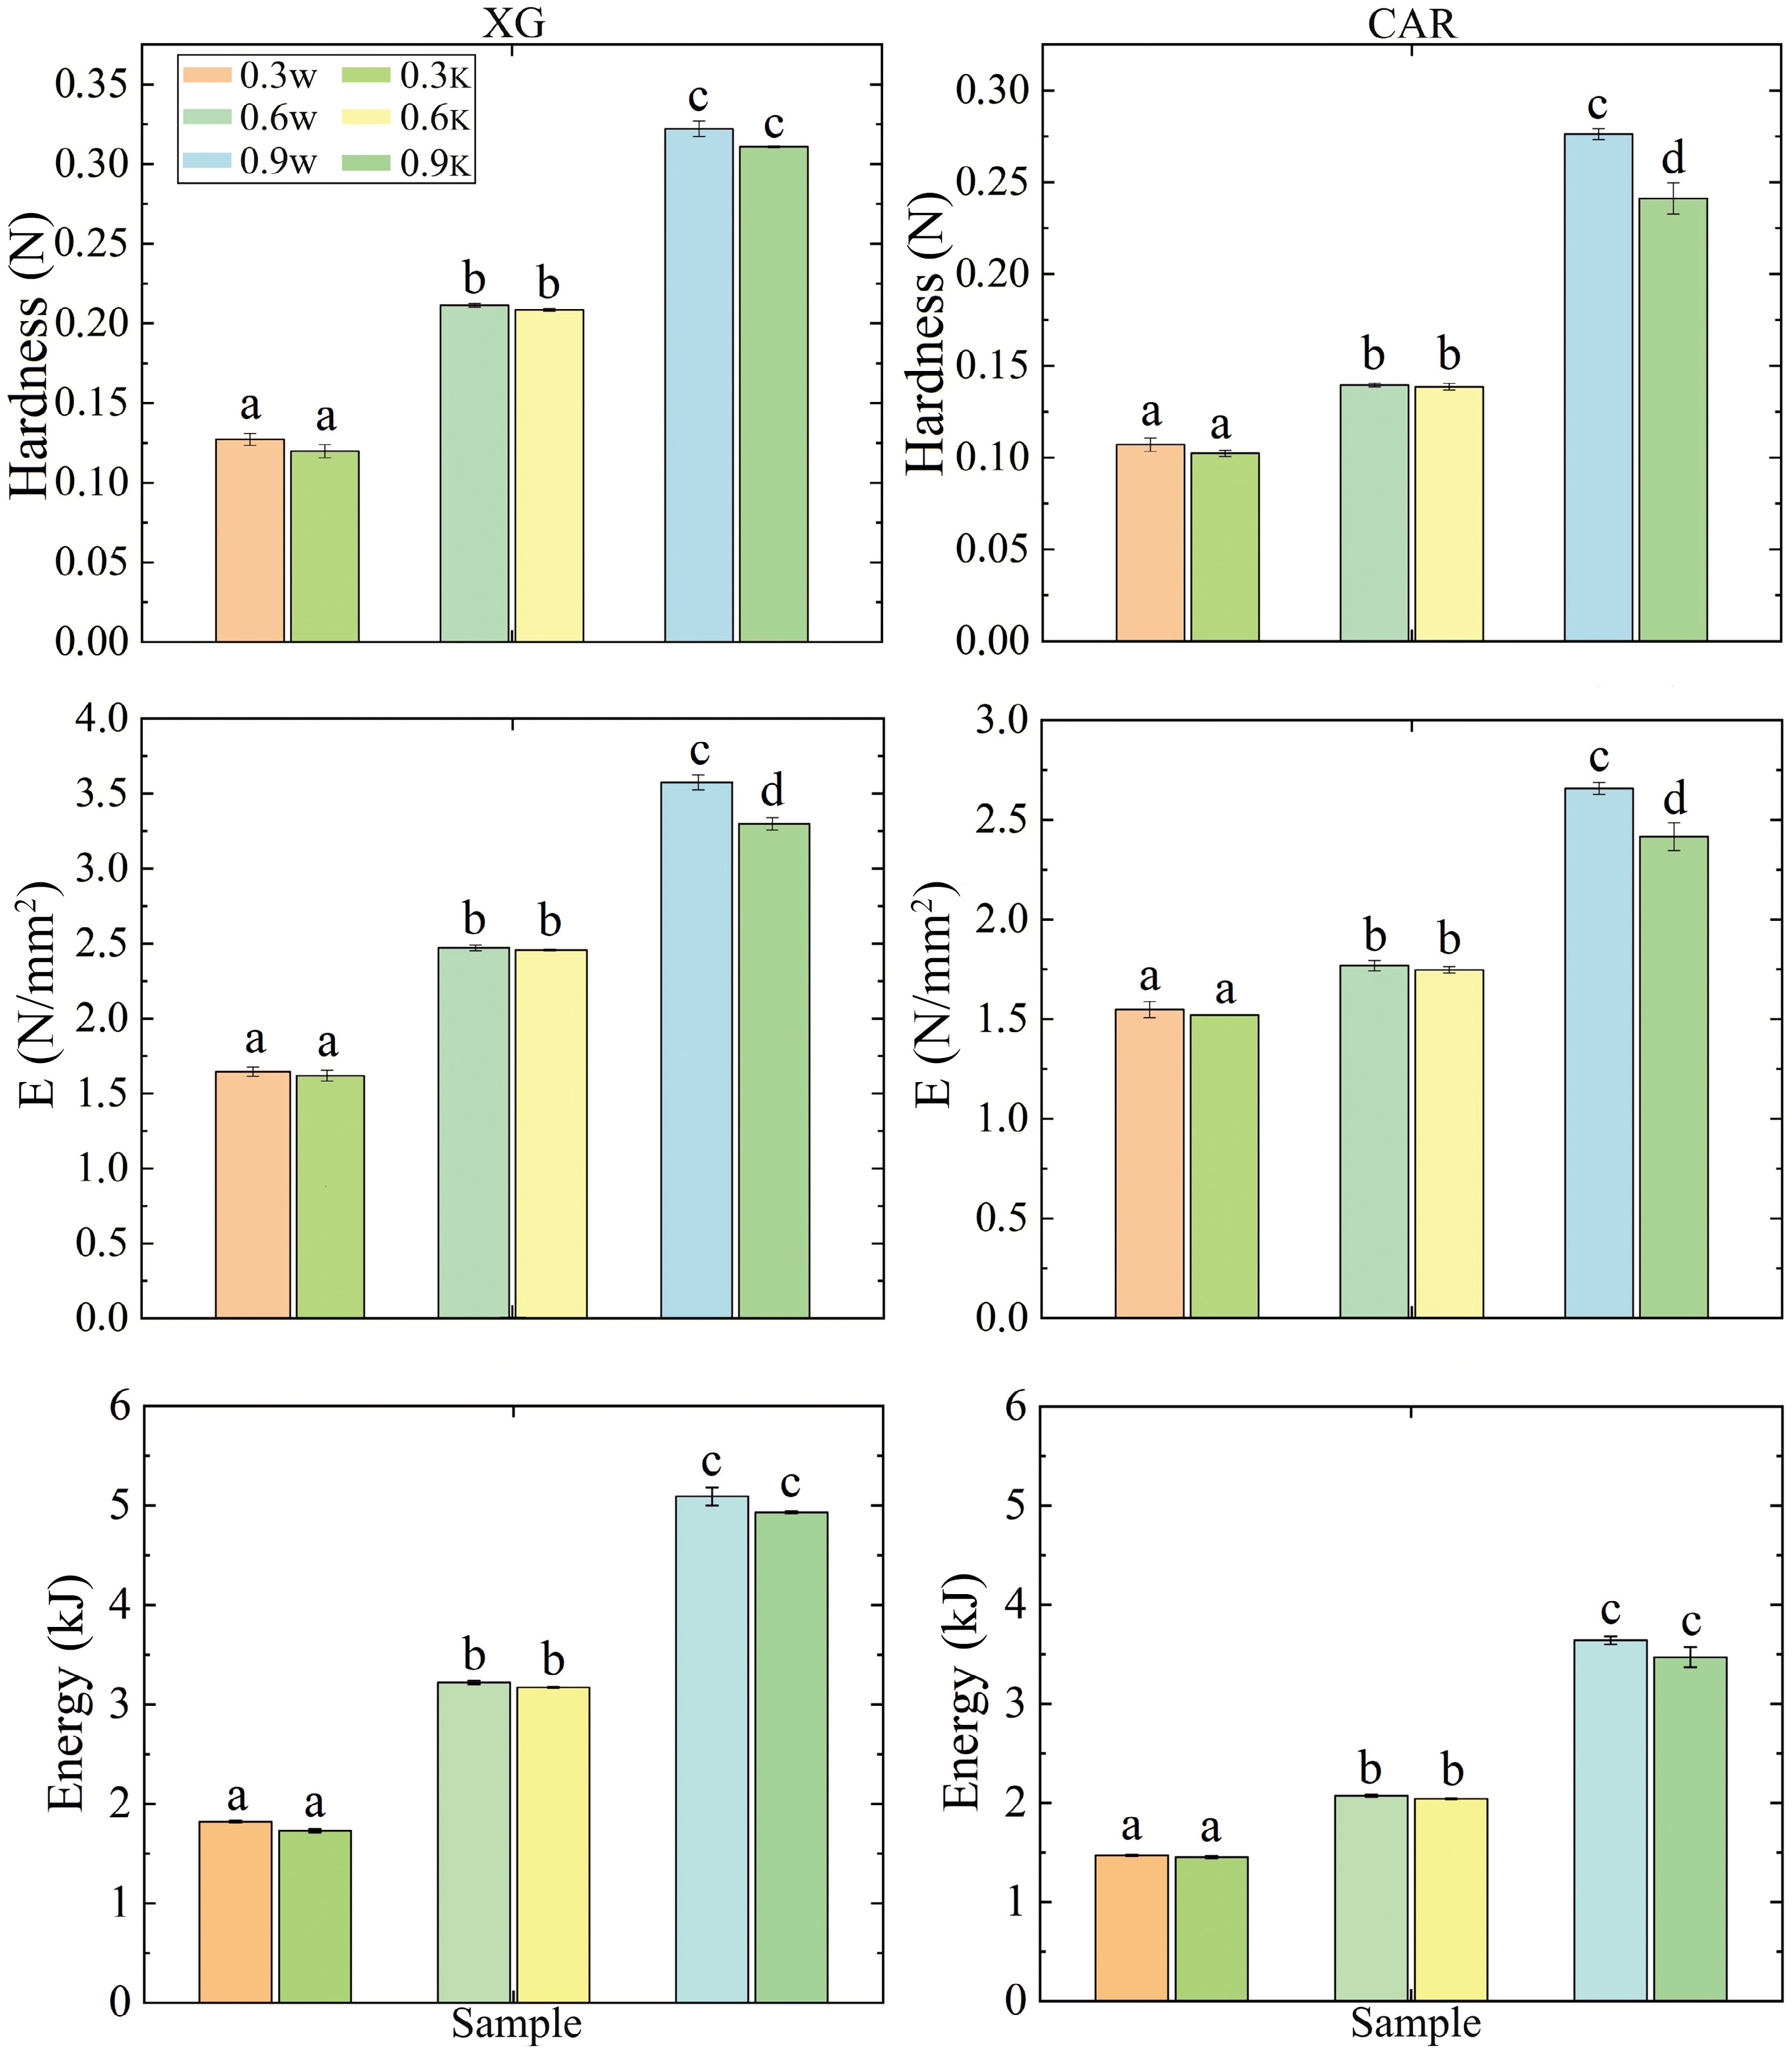
Figure 3.
Determination of the strength of the tested samples. XG and CAR – samples structured with xanthan gum and carrageenan respectively. Index 'w' denotes samples based on water; index 'k' denotes samples based on kombucha. Different letters denote samples that differ from each other (p < 0.05).
-
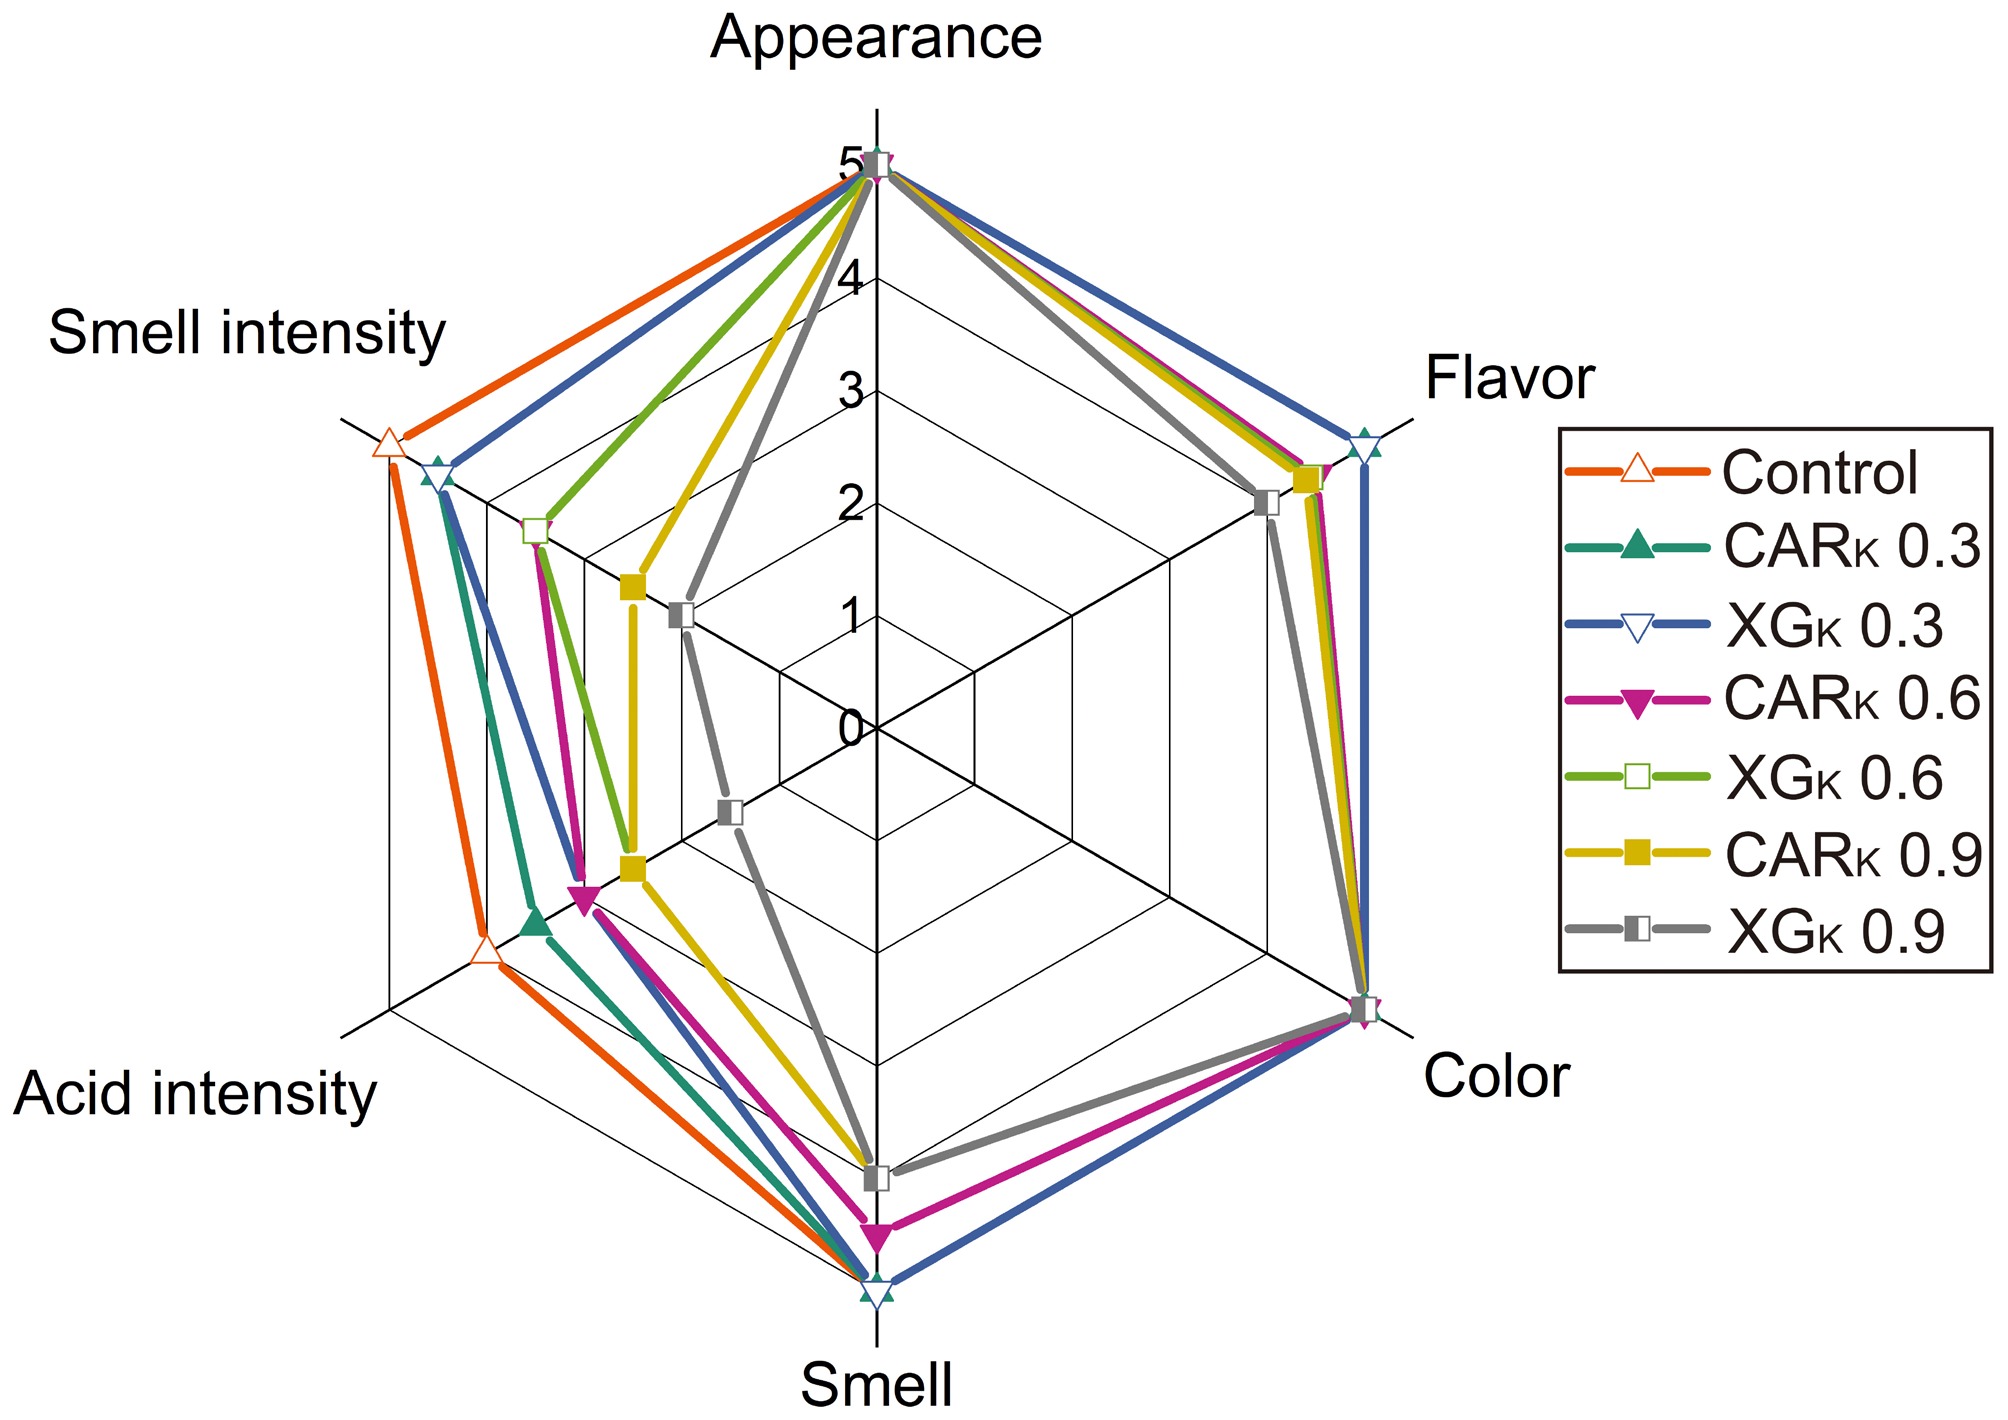
Figure 4.
Organoleptic profile of the investigated samples.
-
Parameters Description Appearance Transparent or slightly opalescent liquid. May be cloudy when hydrocolloids are added. Should not contain lumps. Color From golden amber to dark brown, depending on the variety of tea and the degree of fermentation. Flavor Refreshing, with light acidity, slightly tart. May have fruity or floral notes. Sometimes slightly carbonated. Smell Sour, with fruity or vinegary tones (depending on maturity). There may be a flavor of tea. Table 1.
Criteria for organoleptic evaluation.
-
Parameter Value L* 22.4 ± 0.1 a* 4.9 ± 0.1 b* 5.7 ± 0.2 WI 77.9 ± 0.1 YI 36.5 ± 1.0 Cab 37.8 ± 1.8 pH 3.25 ± 0.05 Acidity, mL (NaOH)/100mL 2.29 ± 0.02 Dry matter content, °Brix 5.0 ± 0.1 Table 2.
Characteristics of initial kombucha.
-
Sample Tonset (°C) Tpeak (°C) Tend (°C) ∆Hm (J/g) Water 1.14 ± 0.04 3.84 ± 0.25 8.05 ± 0.45 230.55 ± 31.19 Base −0.41 ± 0.18 3.10 ± 0.45 6.57 ± 0.87 220.31 ± 44.52 XGw 0.3 0.86 ± 0.02* 3.26 ± 0.13* 7.53 ± 0.93 291.61 ± 9.37 XGw 0.6 0.84 ± 0.02* 3.03 ± 0.16* 8.02 ± 0.59 272.21 ± 36.64 XGw 0.9 0.81 ± 0.06* 3.09 ± 0.13* 8.24 ± 0.48 284.84 ± 13.16 CARw 0.3 0.61 ± 0.01* 3.15 ± 0.03* 7.82 ± 0.76 301.67 ± 0.55* CARw 0.6 0.60 ± 0.04* 3.23 ± 0.25* 6.95 ± 0.11* 293.31 ± 17.79 CARw 0.9 0.56 ± 0.01* 2.95 ± 0.01* 7.56 ± 0.35 298.17 ± 1.36* XGk 0.3 −0.46 ± 0.04 2.49 ± 0.04** 6.91 ± 1.43 255.29 ± 23.76 XGk 0.6 −0.45 ± 0.01 2.35 ± 0.01** 6.24 ± 0.04 266.40 ± 2.83 XGk 0.9 −0.45 ± 0.02 2.32 ± 0.10** 6.31 ± 0.11 269.24 ± 5.75 CARk 0.3 −0.64 ± 0.11** 2.30 ± 0.01** 6.30 ± 1.15 265.43 ± 13.46 CARk 0.6 −0.61 ± 0.06** 2.42 ± 0.13** 6.58 ± 0.81 274.41 ± 15.20 CARk 0.9 −0.64 ± 0.01** 2.15 ± 0.03** 5.78 ± 0.68 247.21 ± 21.11 XGw and CARw – water-based samples structured with xanthan gum and carrageenan. XGk and CARk – kombucha-based samples structured with xanthan gum and carrageenan. Numerical indices show the concentration of structural agent in the sample, e.g., XGw 0.3 – indicated that the sample contained 0.3% xanthan gum. * Samples having significant differences from Water (p < 0.05). ** Samples with significant differences from Base (p < 0.05). Table 3.
Thermal characteristics of the studied samples (the initial temperature (Tonset), peak temperature (Tpeak), final temperature (Tend), enthalpy change (∆Hm)).
-
Vitamins Concentration (mg/100 g) 0 h 16 h 24 h 48 h Base XGk Base XGk Base XGk Base XGk Vitamin B1 0.340 ± 0.014a 0.315 ± 0.035a 0.335 ± 0.007a 0.380 ± 0.014a 0.335 ± 0.007a 0.325 ± 0.007a 0.295 ± 0.007a 0.305 ± 0.007a Vitamin B2 0.255 ± 0.007a 0.265 ± 0.007a 0.250 ± 0.000a 0.275 ± 0.021а 0.280 ± 0.028a 0.245 ± 0.007а 0.230 ± 0.000a 0.250 ± 0.000а Vitamin B6 0.300 ± 0.028a 0.335 ± 0.021a 0.340 ± 0.014a 0.335 ± 0.021a 0.360 ± 0.028a 0.355 ± 0.035a 0.312 ± 0.014a 0.325 ± 0.007a Folic acid 0.040 ± 0.005a 0.039 ± 0.005a 0.040 ± 0.006a 0.035 ± 0.001a 0.040 ± 0.009a 0.034 ± 0.002a 0.039 ± 0.004a 0.033 ± 0.004a Nicotinamide 2.445 ± 0.176a 2.900 ± 0.099a 2.345 ± 0.134a 2.515 ± 0.177a 2.660 ± 0.127a 2.710 ± 0.061a 2.520 ± 0.057a 2.700 ± 0.113a Ascorbic acid 38.20 ± 0.43a 33.70 ± 0.42a 24.25 ± 0.78b 23.75 ± 0.07b 20.55 ± 0.19c 16.65 ± 0.21c 11.40 ± 0.57d 5.01 ± 4.101d Similar letters indicate no significant difference (p > 0.05) within-sample between the control points. Table 4.
Stability of added vitamins in the base and developed sample structured with xanthan (0.9%).
Figures
(4)
Tables
(4)