-
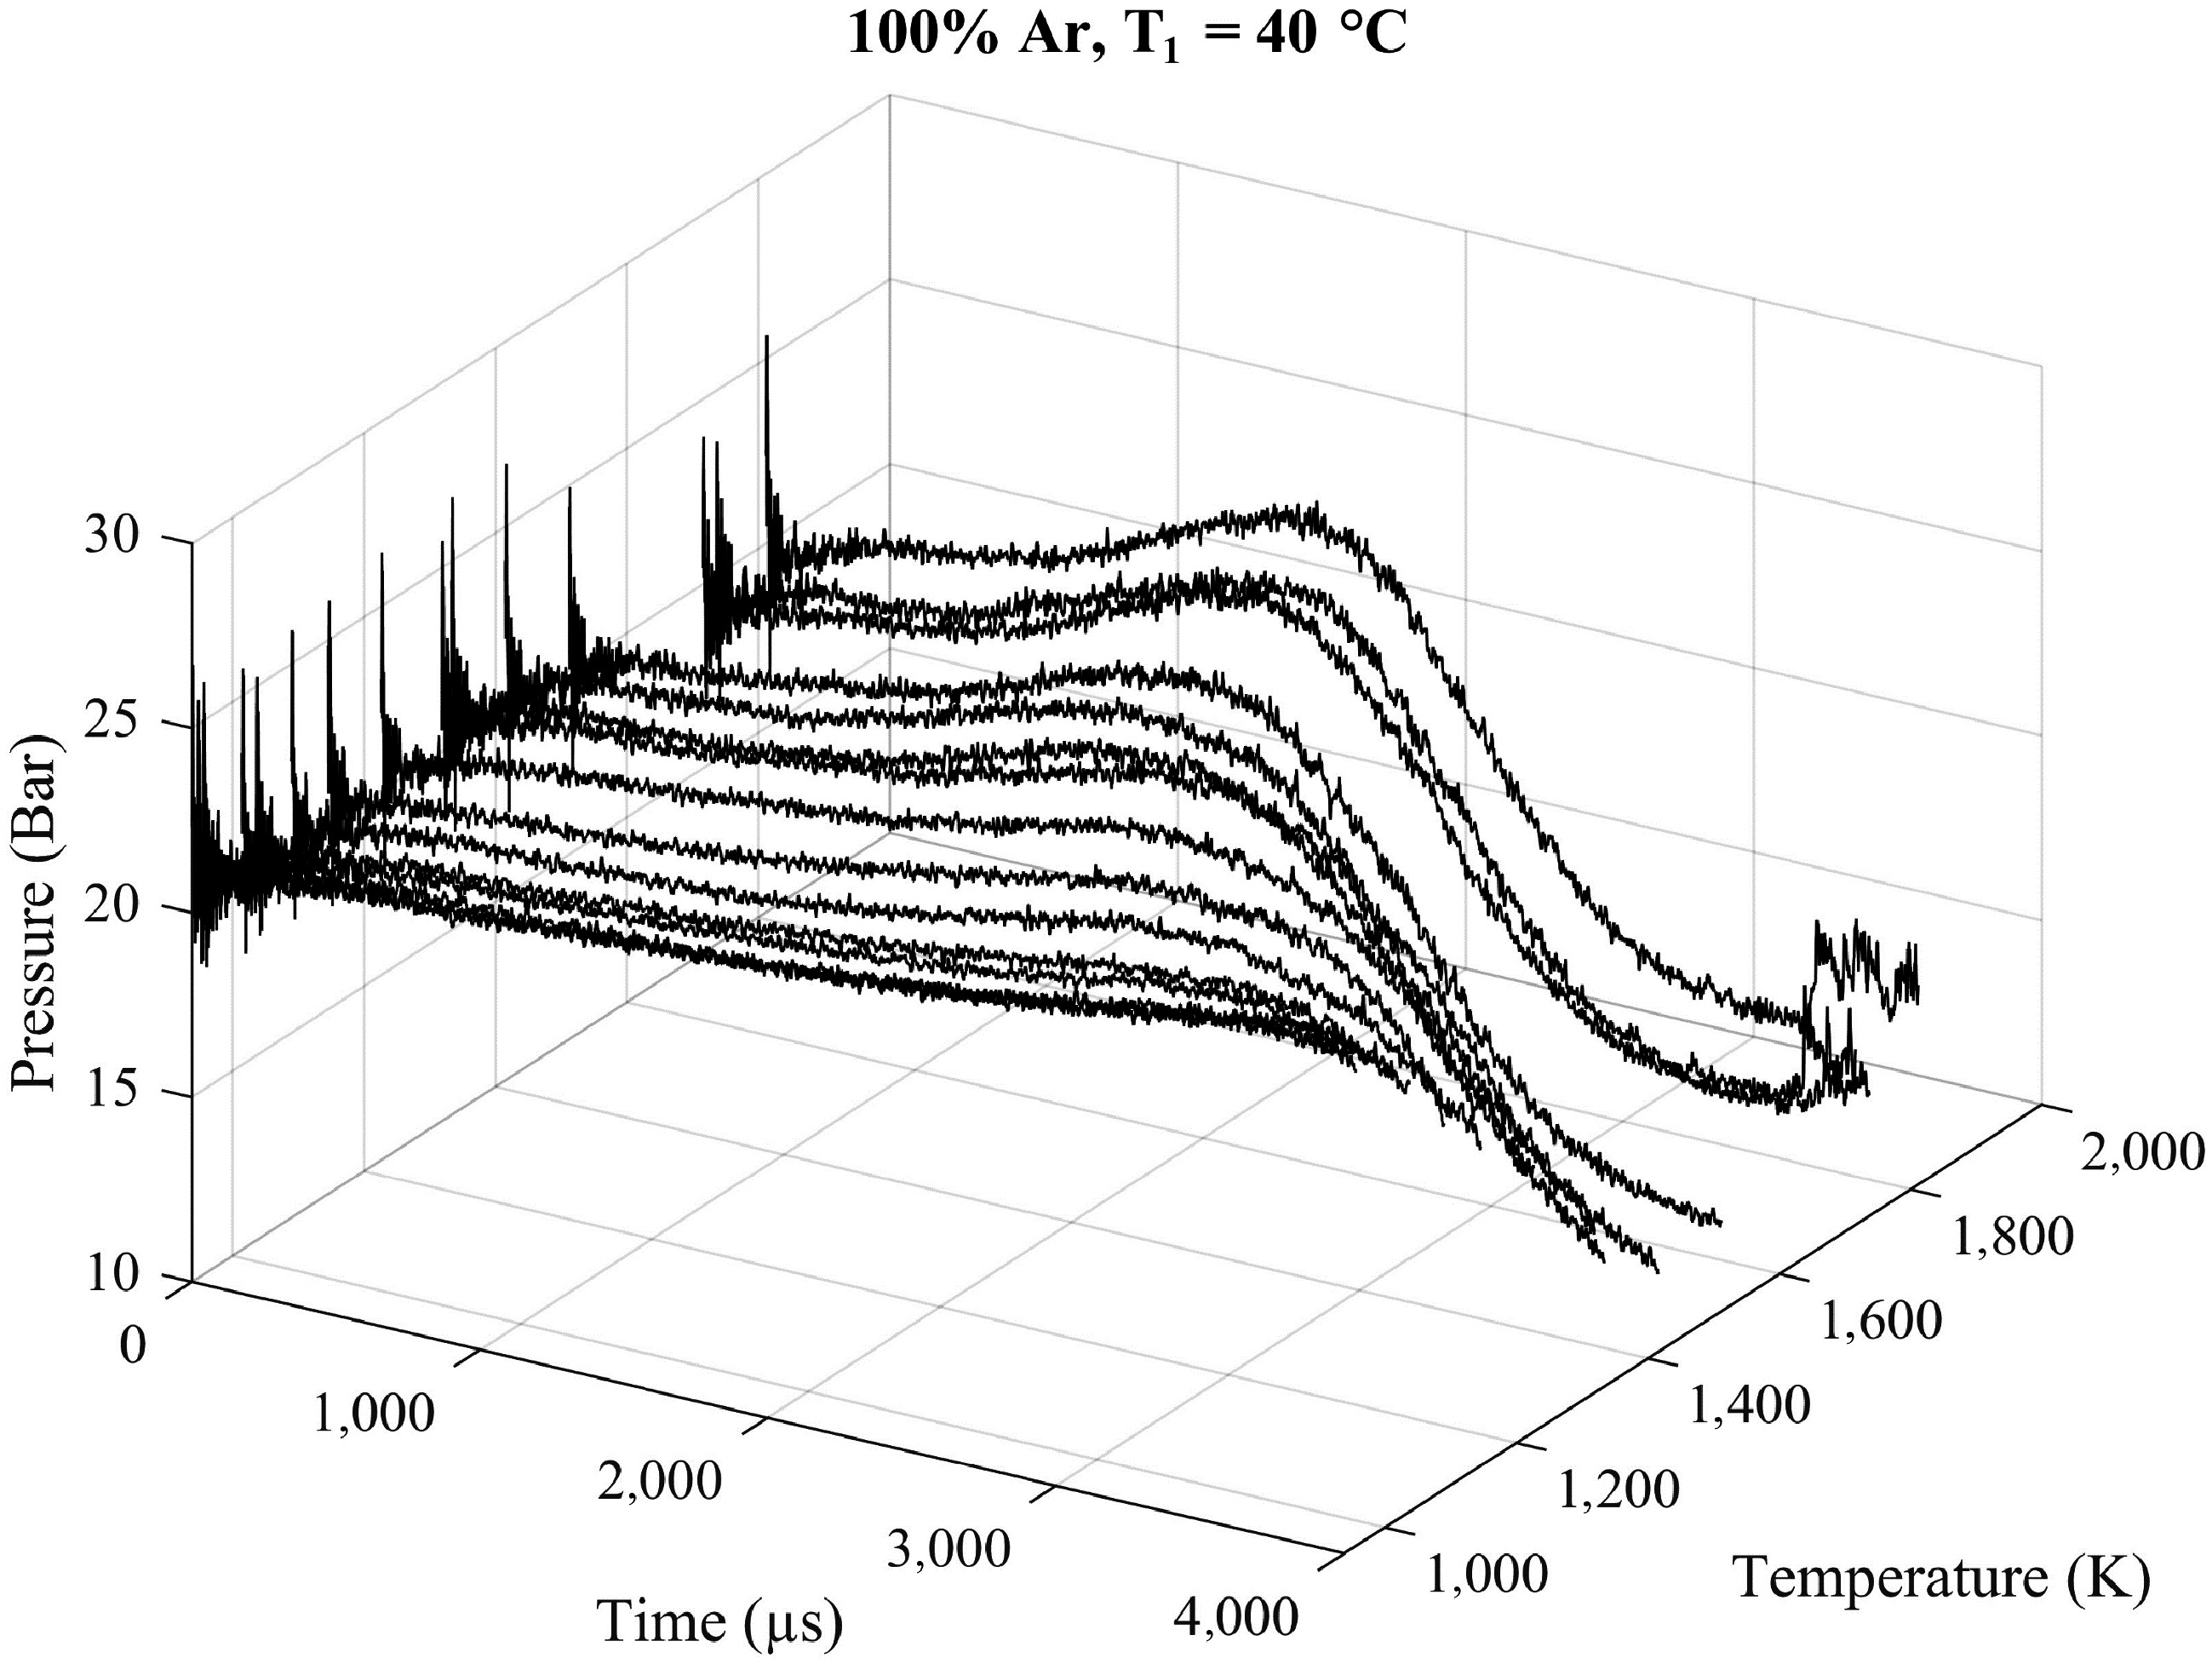
Figure 1.
Nonreactive pressure traces of argon at 20 bar with an initial temperature T1 of 40 °C in the driven section at the different tested temperatures T5 ranging from 940 to 1,800 K.
-
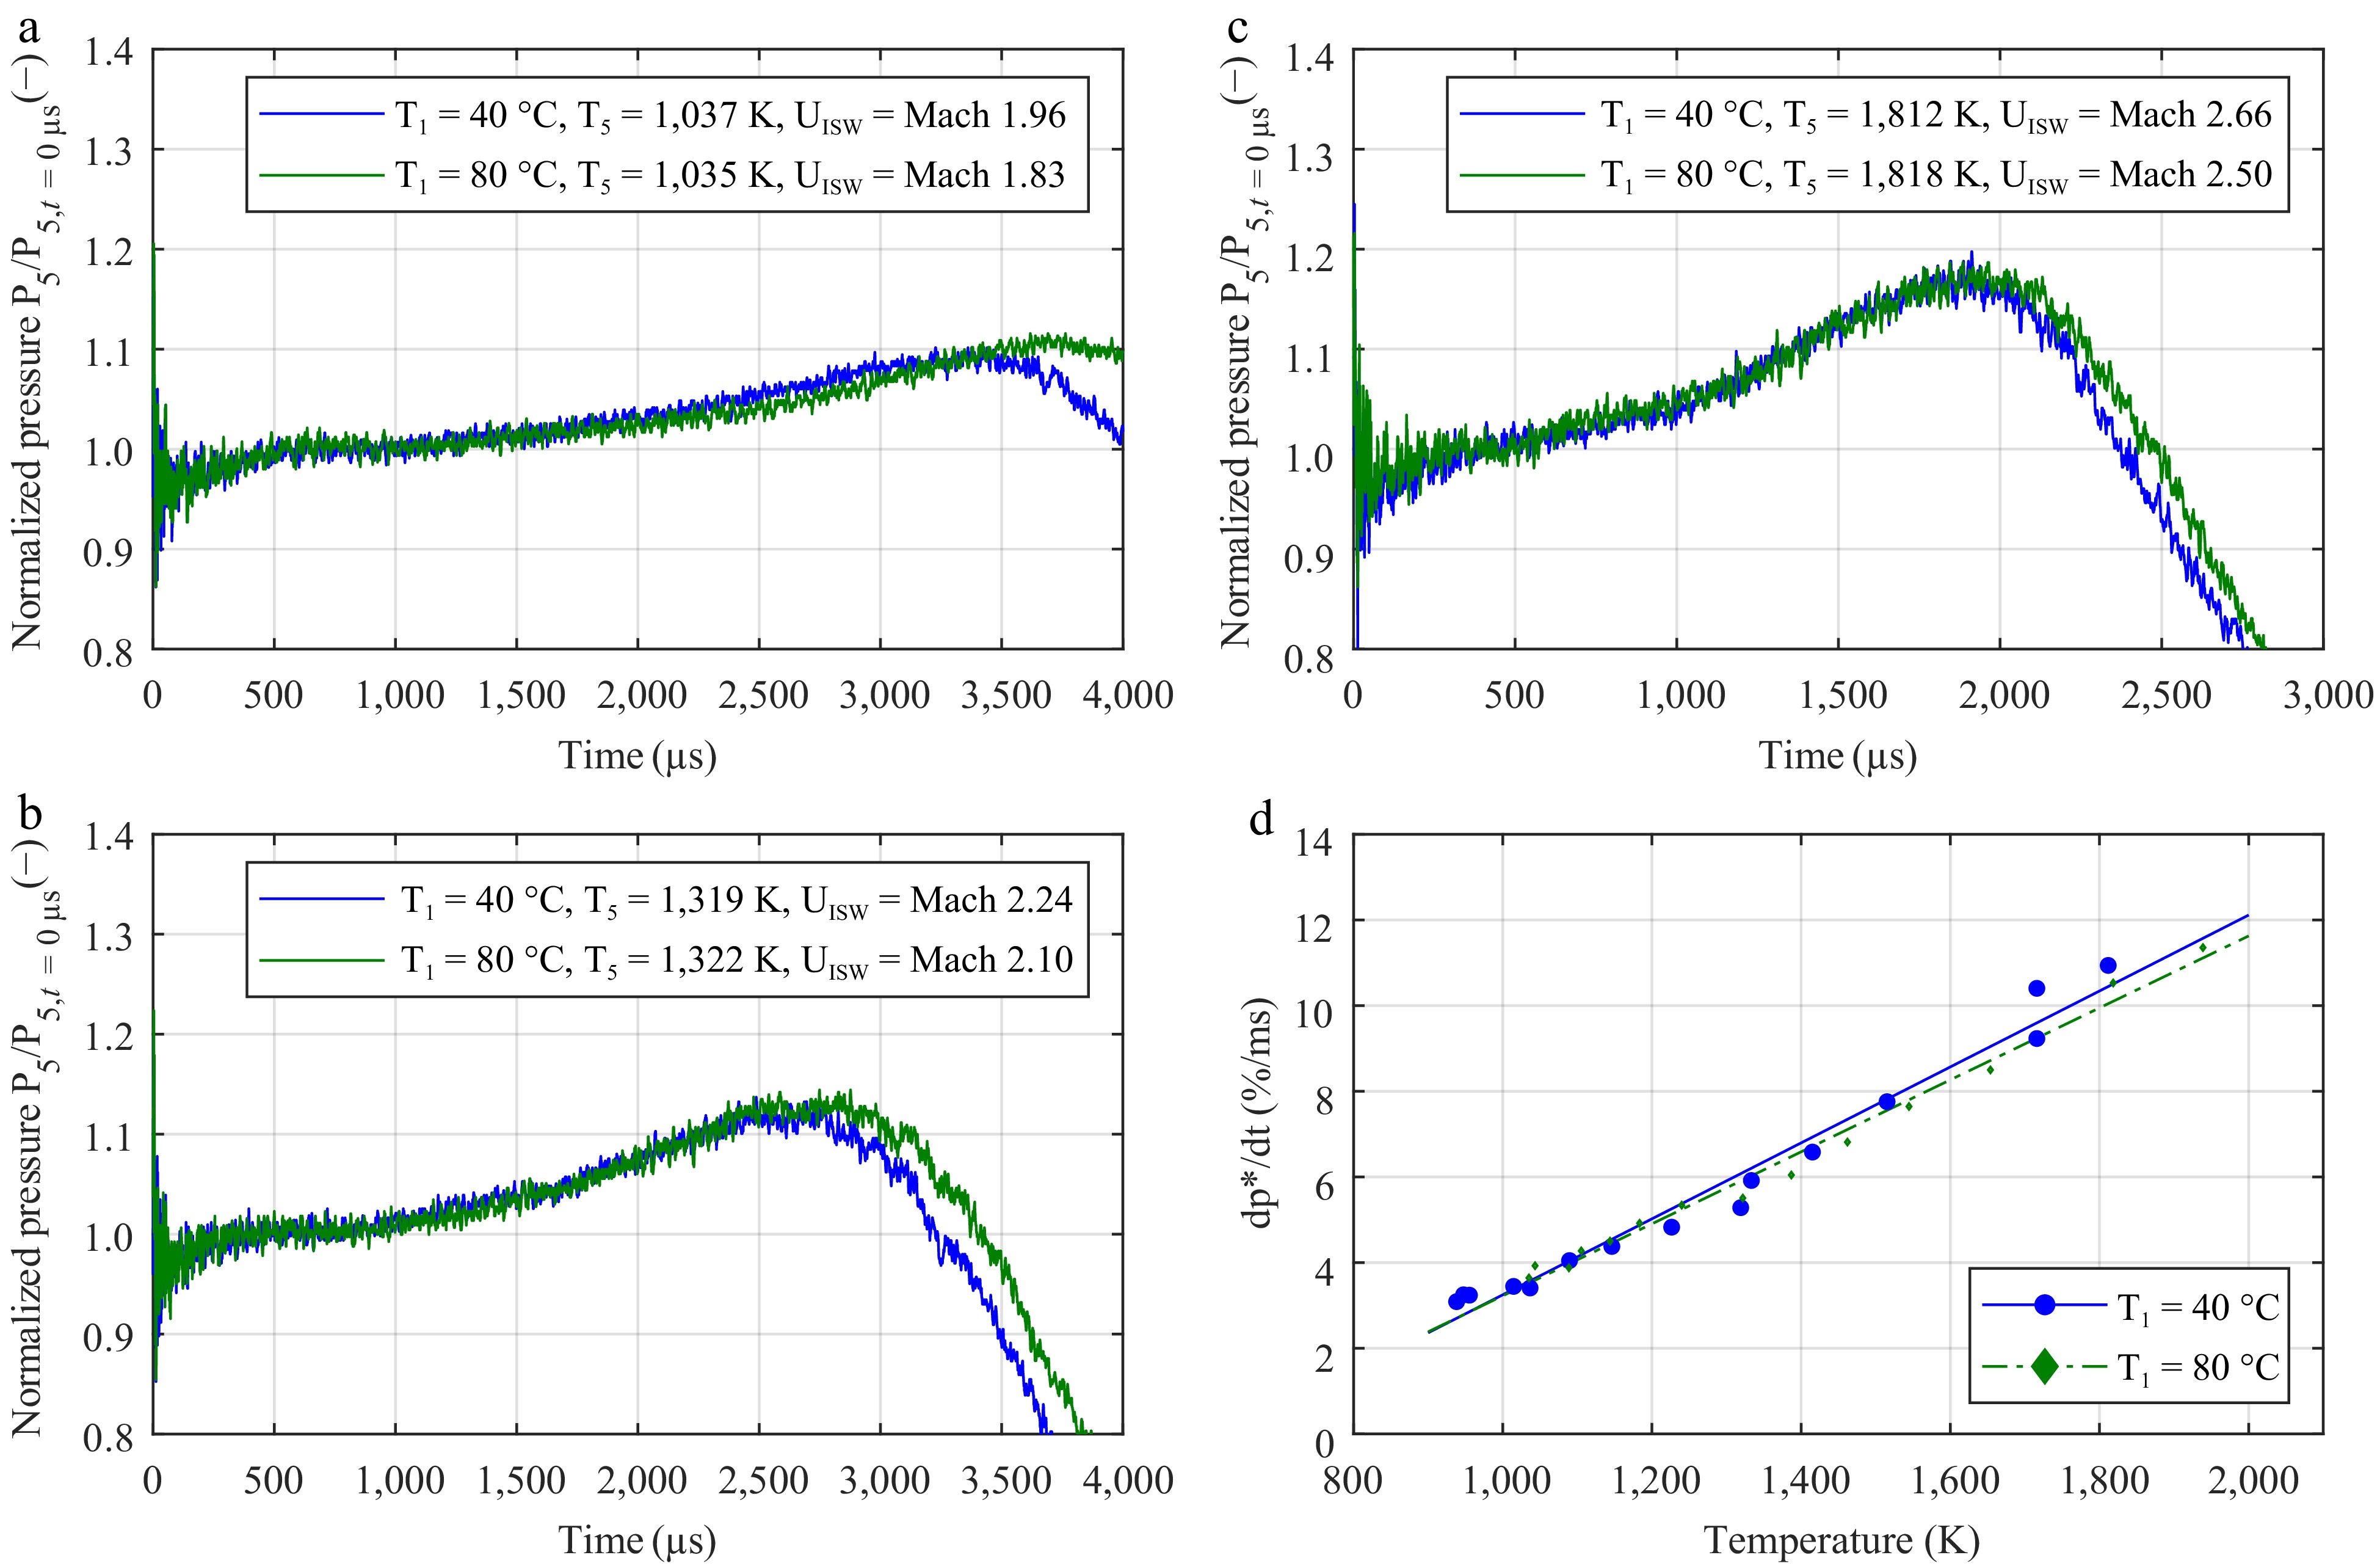
Figure 2.
Impact of the initial temperature in the driven section on the increase in pressure in argon. The mean pressure gradient dp*/dt was determined according to the work of Hargis et al.[23]. The graphs show the normalized pressure traces with an initial temperature T1 of 40 °C (in blue) and 80 °C (in green) at (a) low, (b) intermediate, and (c) high temperatures. (d) Linear fit of the experimental data.
-
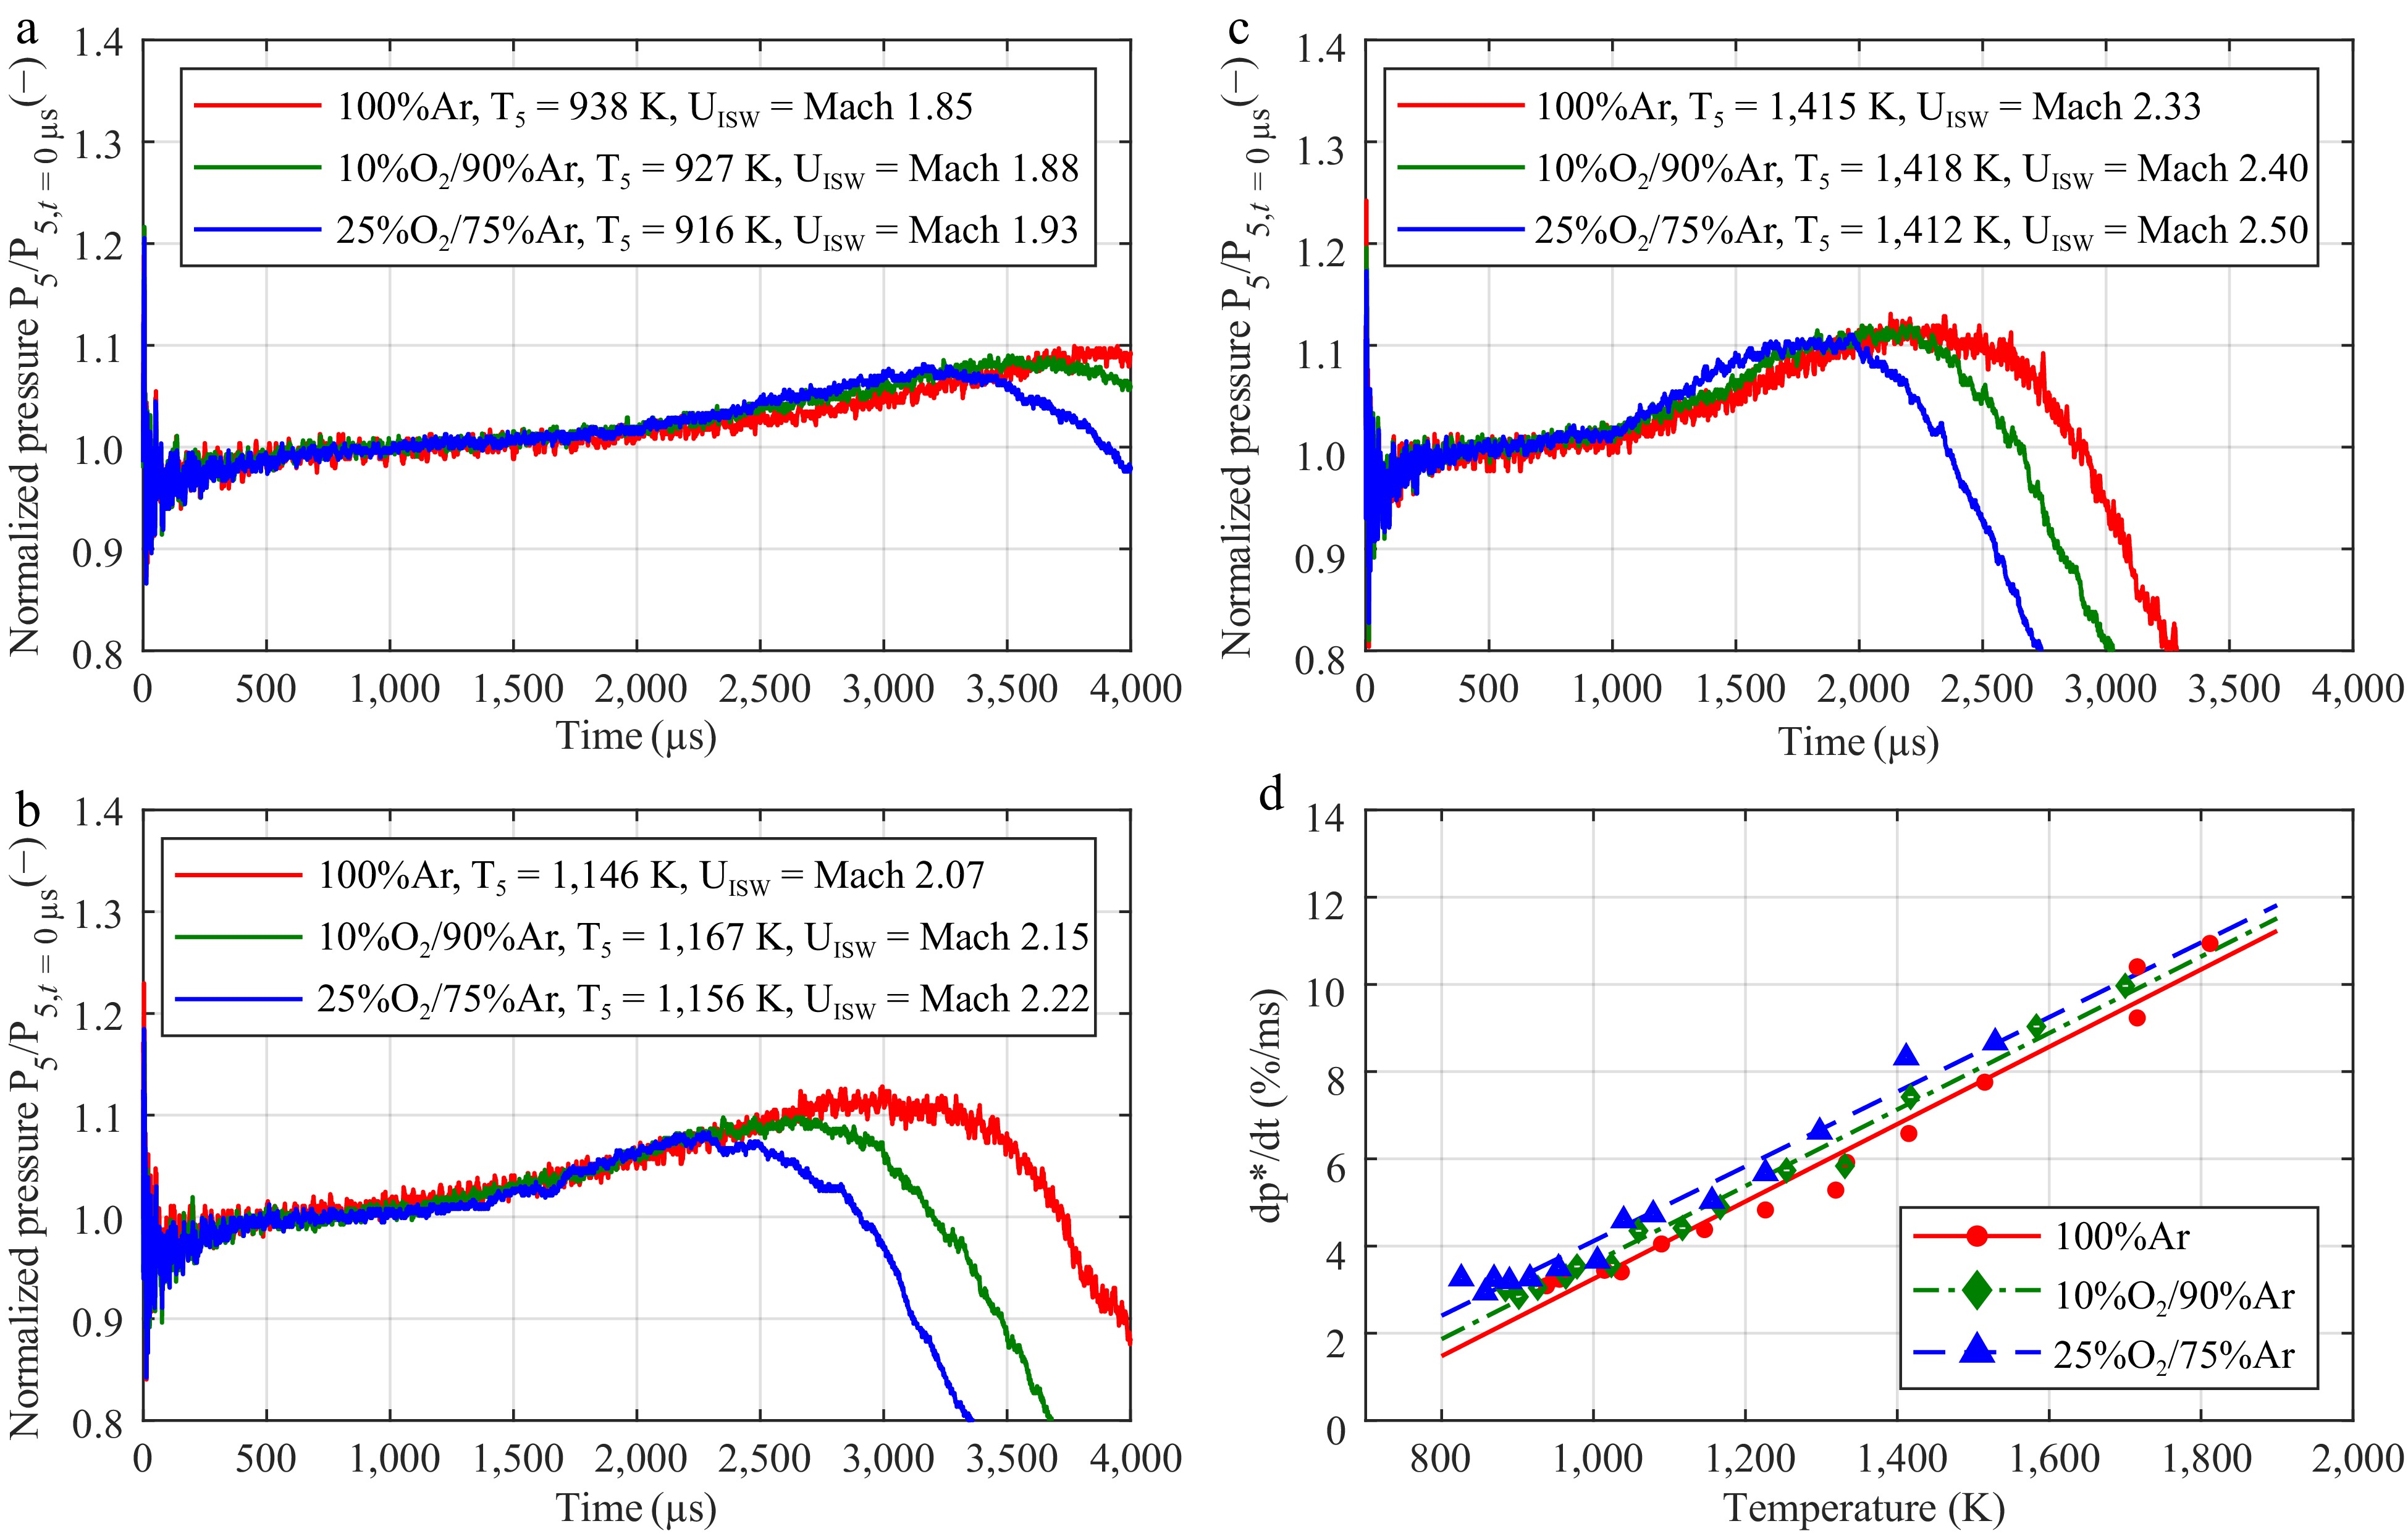
Figure 3.
Impact of the dioxygen concentration in argon on the pressure increase. The mean pressure gradient was determined according to the work of Hargis et al.[23] The normalized pressure traces of the mixtures with 100% argon (in red), 10% O2/90% argon (in green), and 25% O2/75% argon (in blue) at (a)low, (b) intermediate, and (c) high temperatures. (d) Linear fit of the experimental data.
-
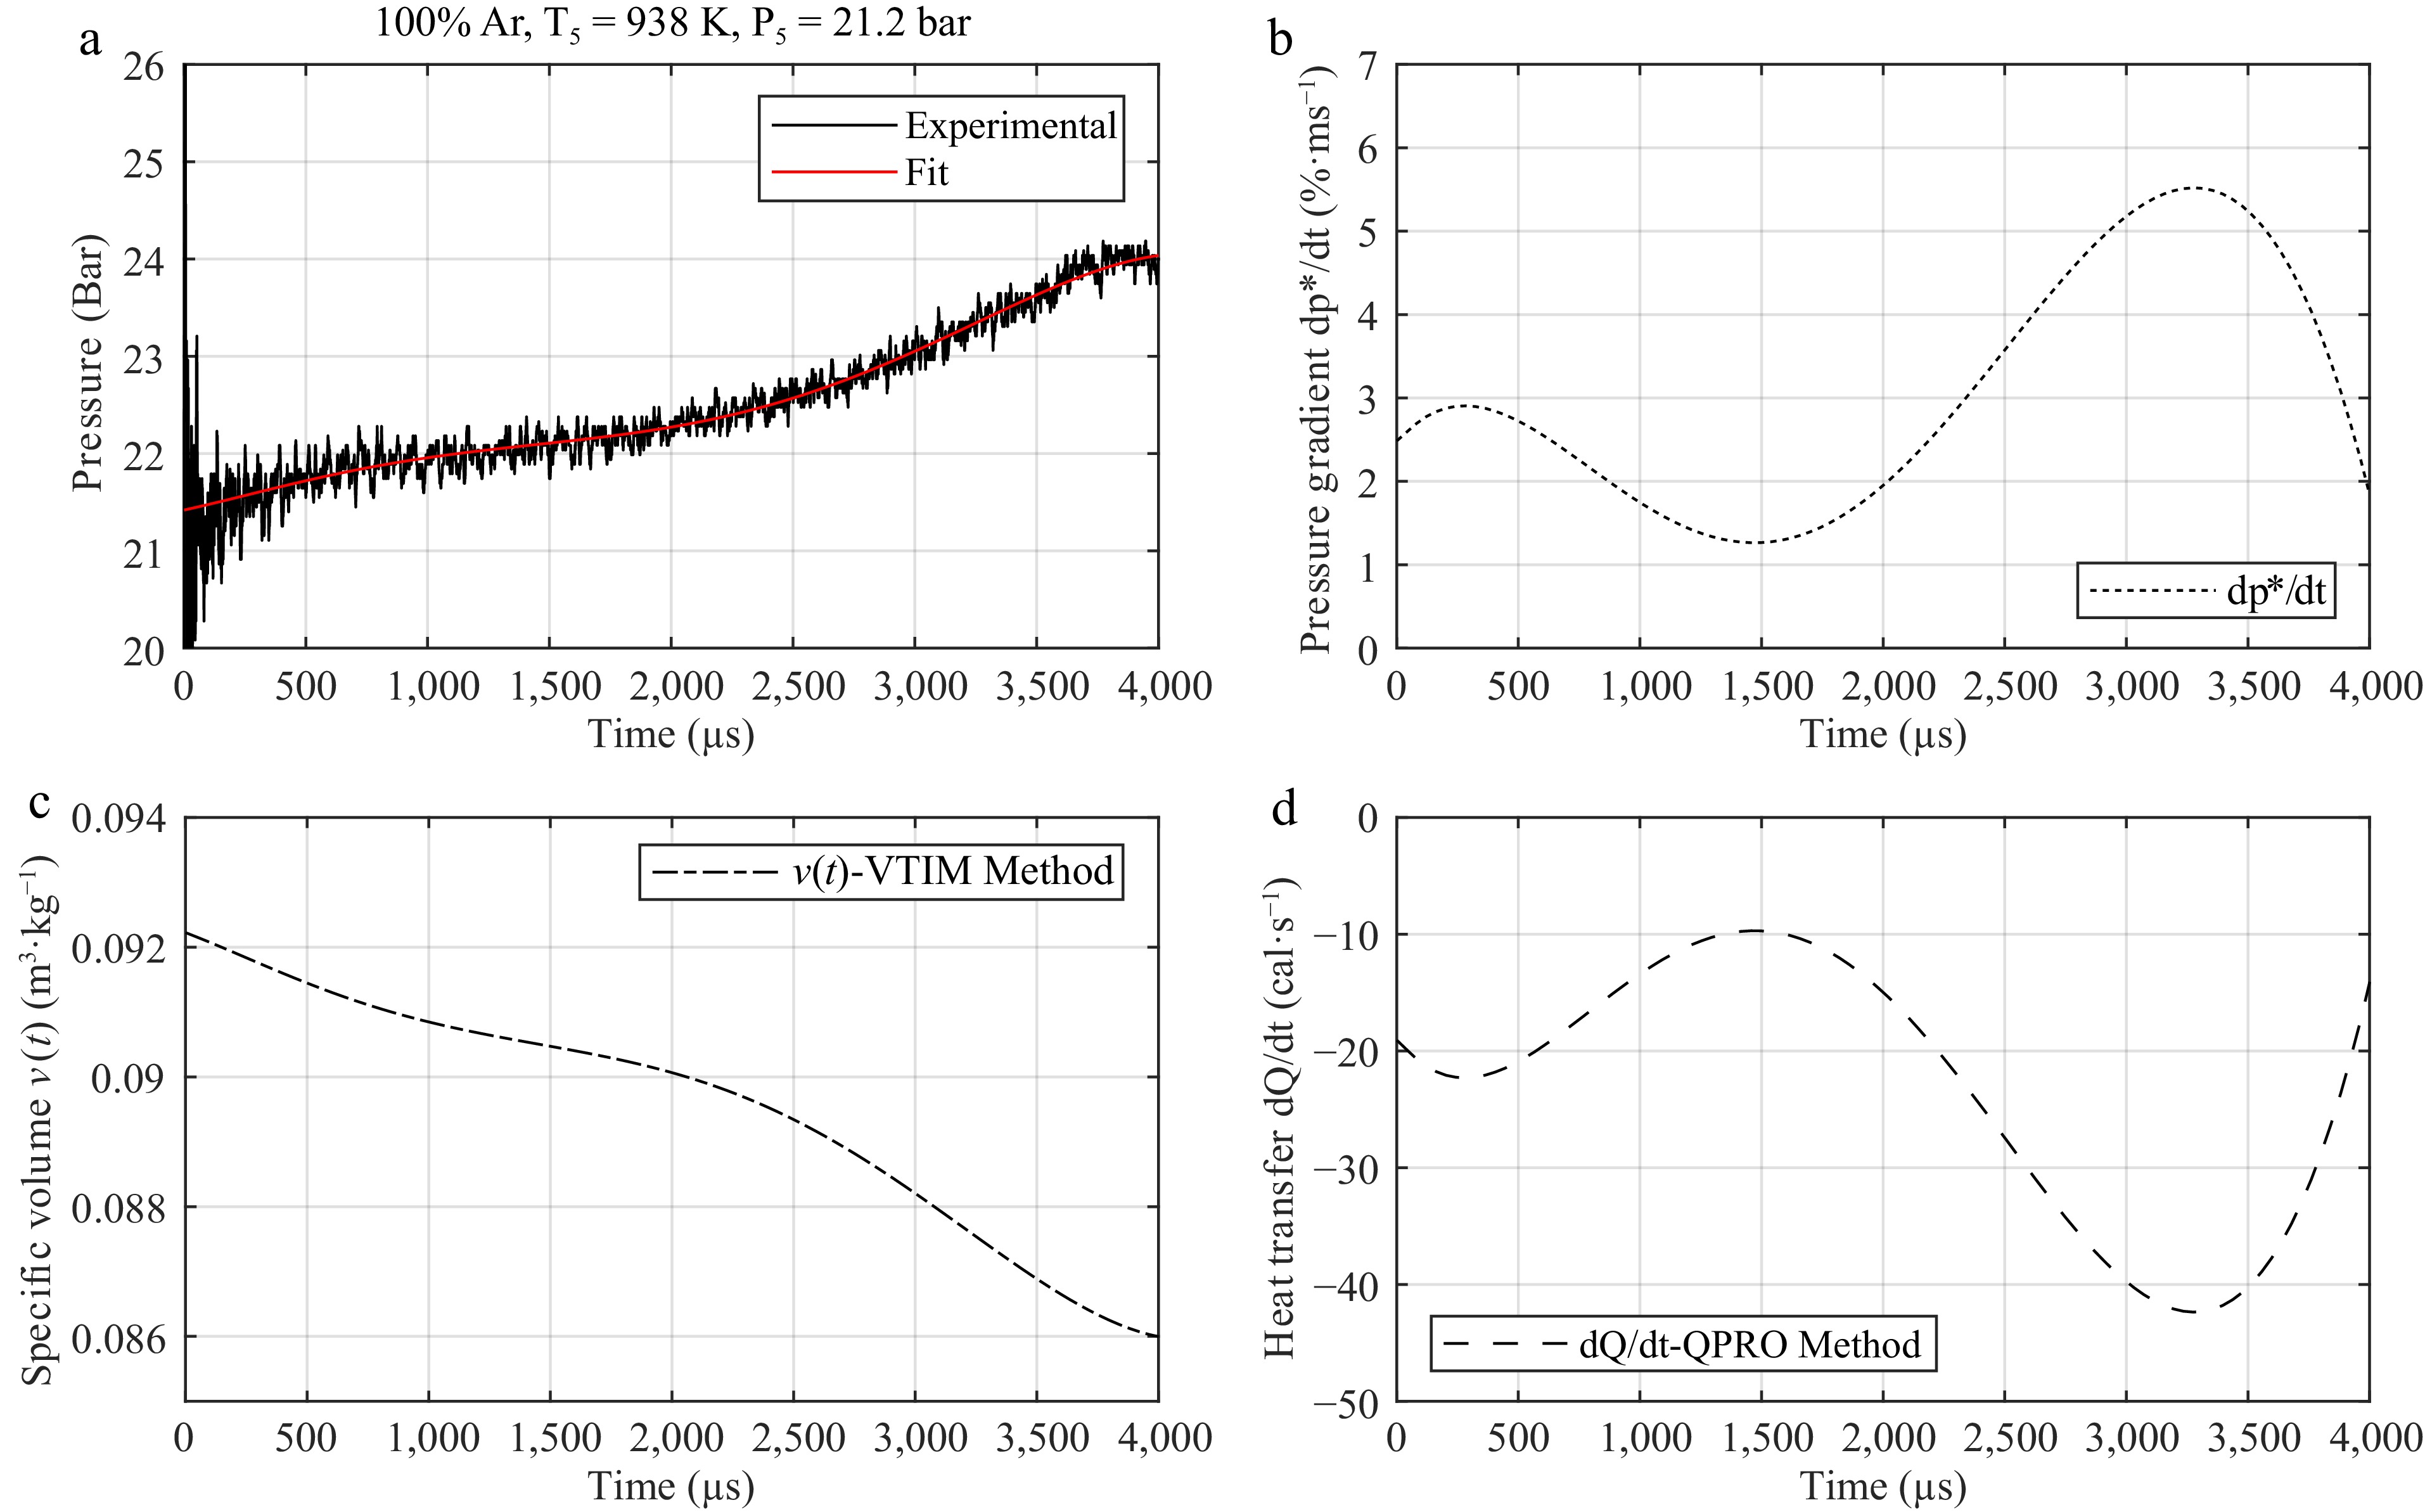
Figure 4.
Steps for using (a) the argon pressure trace at initial conditions of 938 K and 21.2 bar behind the reflected shock wave and (b) its variation for developing a correction table for (c) volume or for (d) internal energy for kinetic models.
-
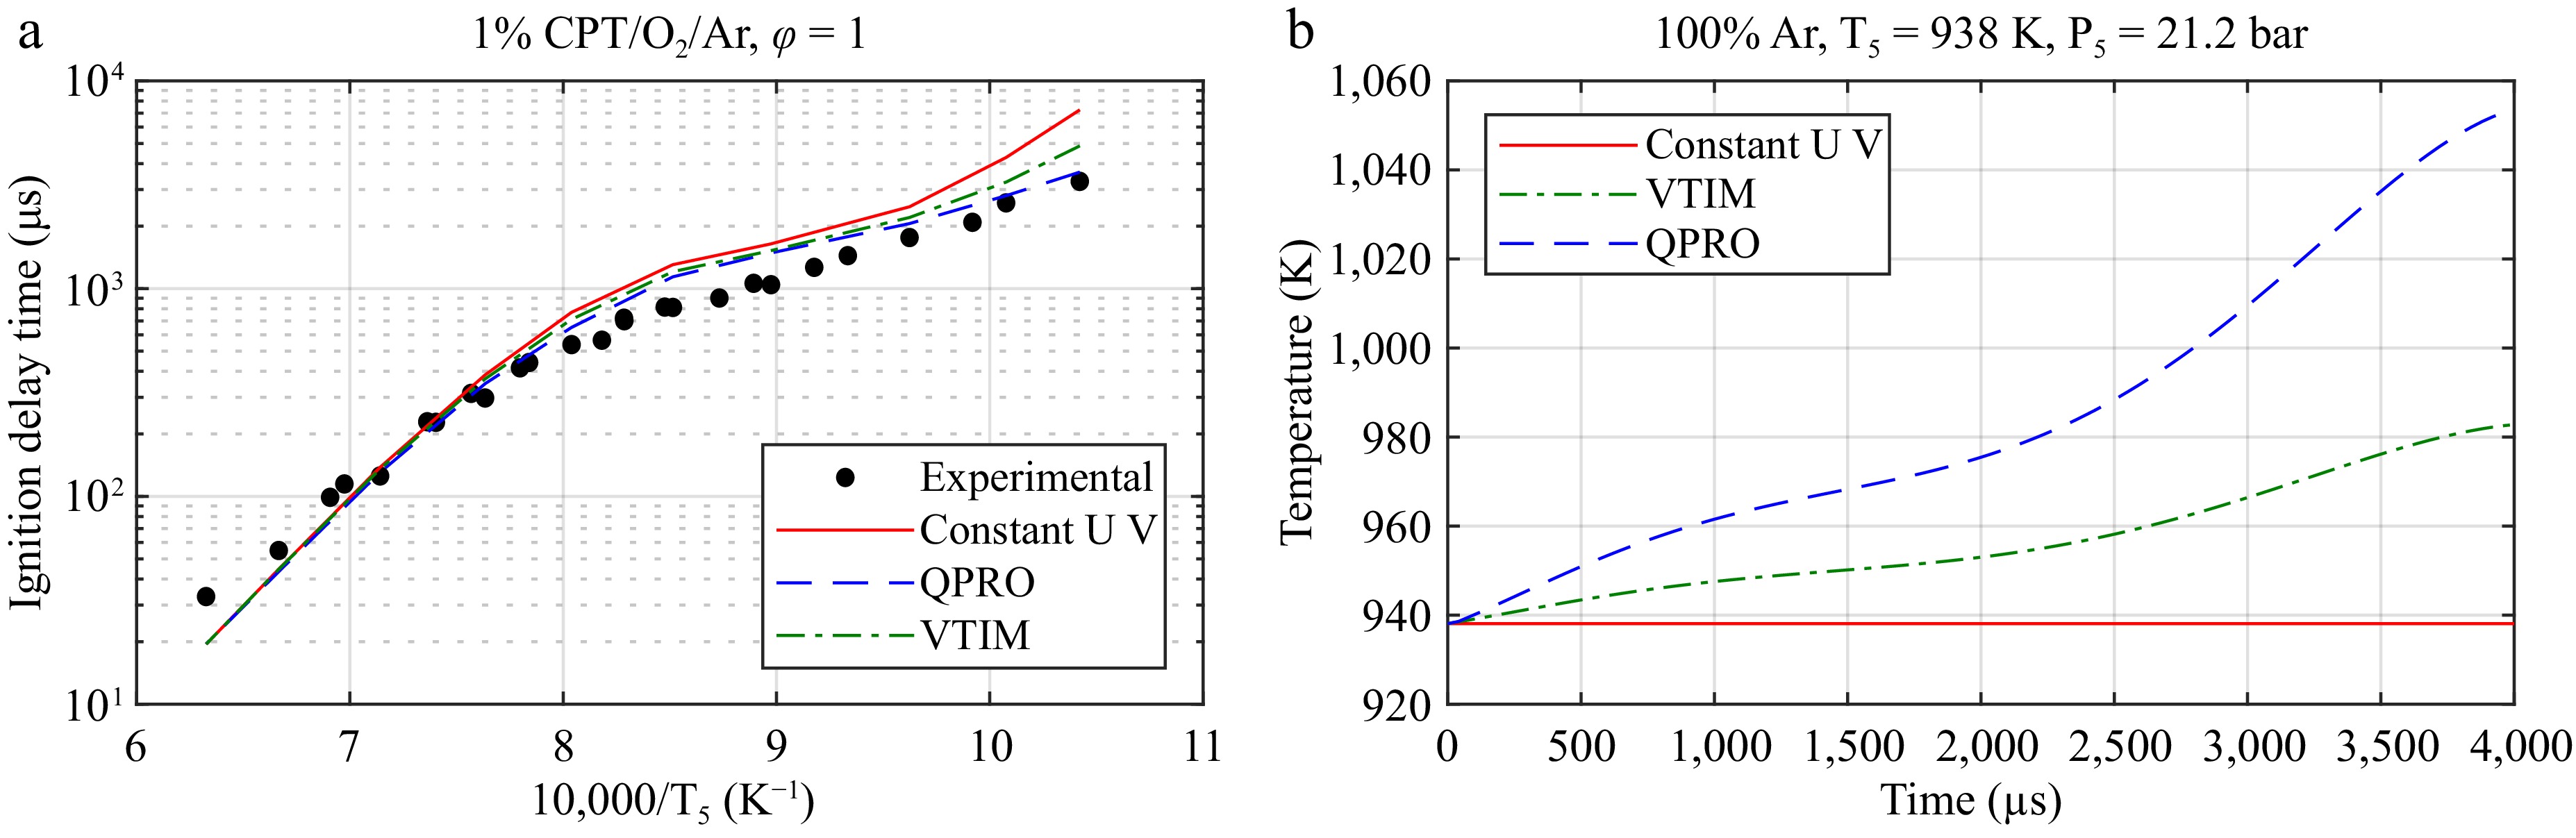
Figure 5.
Application of the VTIM and QPRO methods for predicting the ignition delay time of CPT/O2/Ar. (a) The ignition delay time of CPT at 20 bar and the equivalent ratio φ = 1. (b) The temperature as a function of time for the assumptions of a constant volume and internal energy (UV), a constant internal energy and variable volume (VTIM), and a constant volume and variable internal energy (QPRO) from the non-reactive pressure trace of argon at an initial temperature of 40 °C and the conditions behind the reflected shock wave of 938 K and 21.2 bar.
-
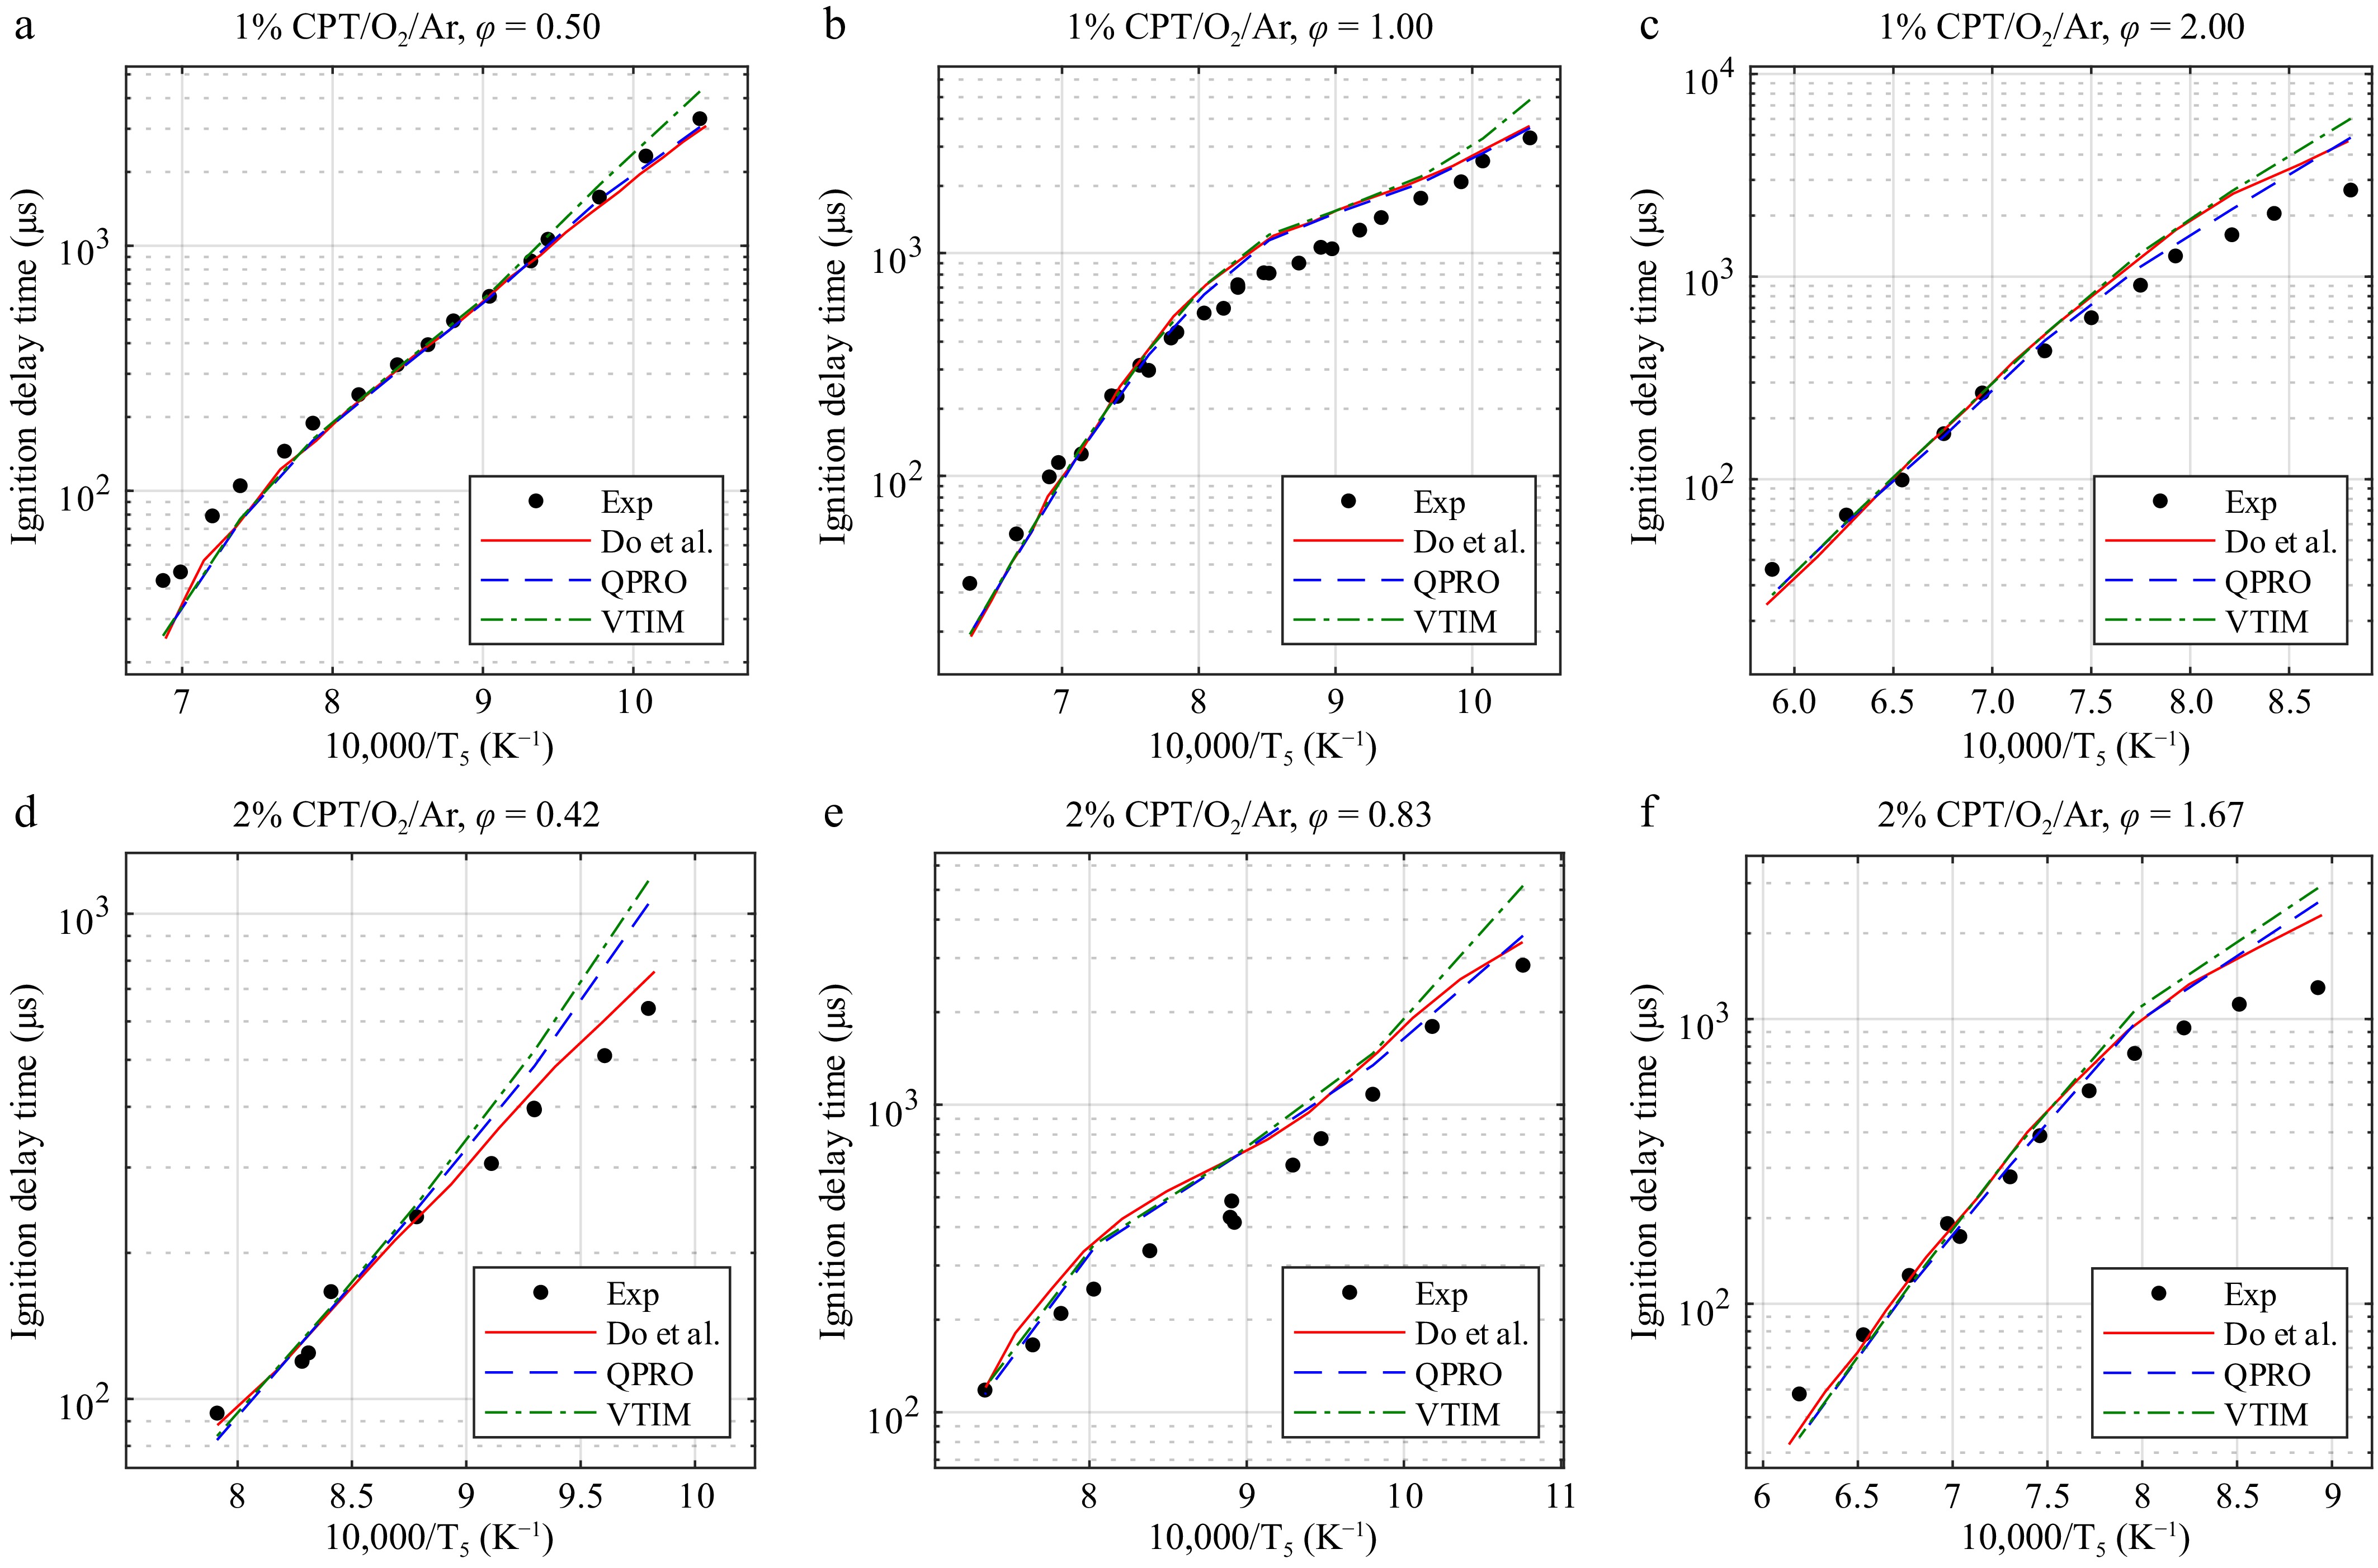
Figure 6.
Ignition delay times of cyclopentane at 20 bar and temperatures from 930 to 1,700 K in O2 and argon (CPT/O2/Ar) for equivalence ratios (φ) of (a) 0.50, (b) 1.00, and (c) 2.00 at 1% and (d) 0.42, (e) 0.83, and (f) 1.67 at 2% fuel concentrations and the combustion kinetic model of cyclopentane with the ignition delay times computed by Do et al.[14], with the variable volume approach and the heat transfer approach. Exp, experimental data from Do et al.[14]. Lines, dashed lines, and dash-dot lines are the predicted ignition delay times.
-
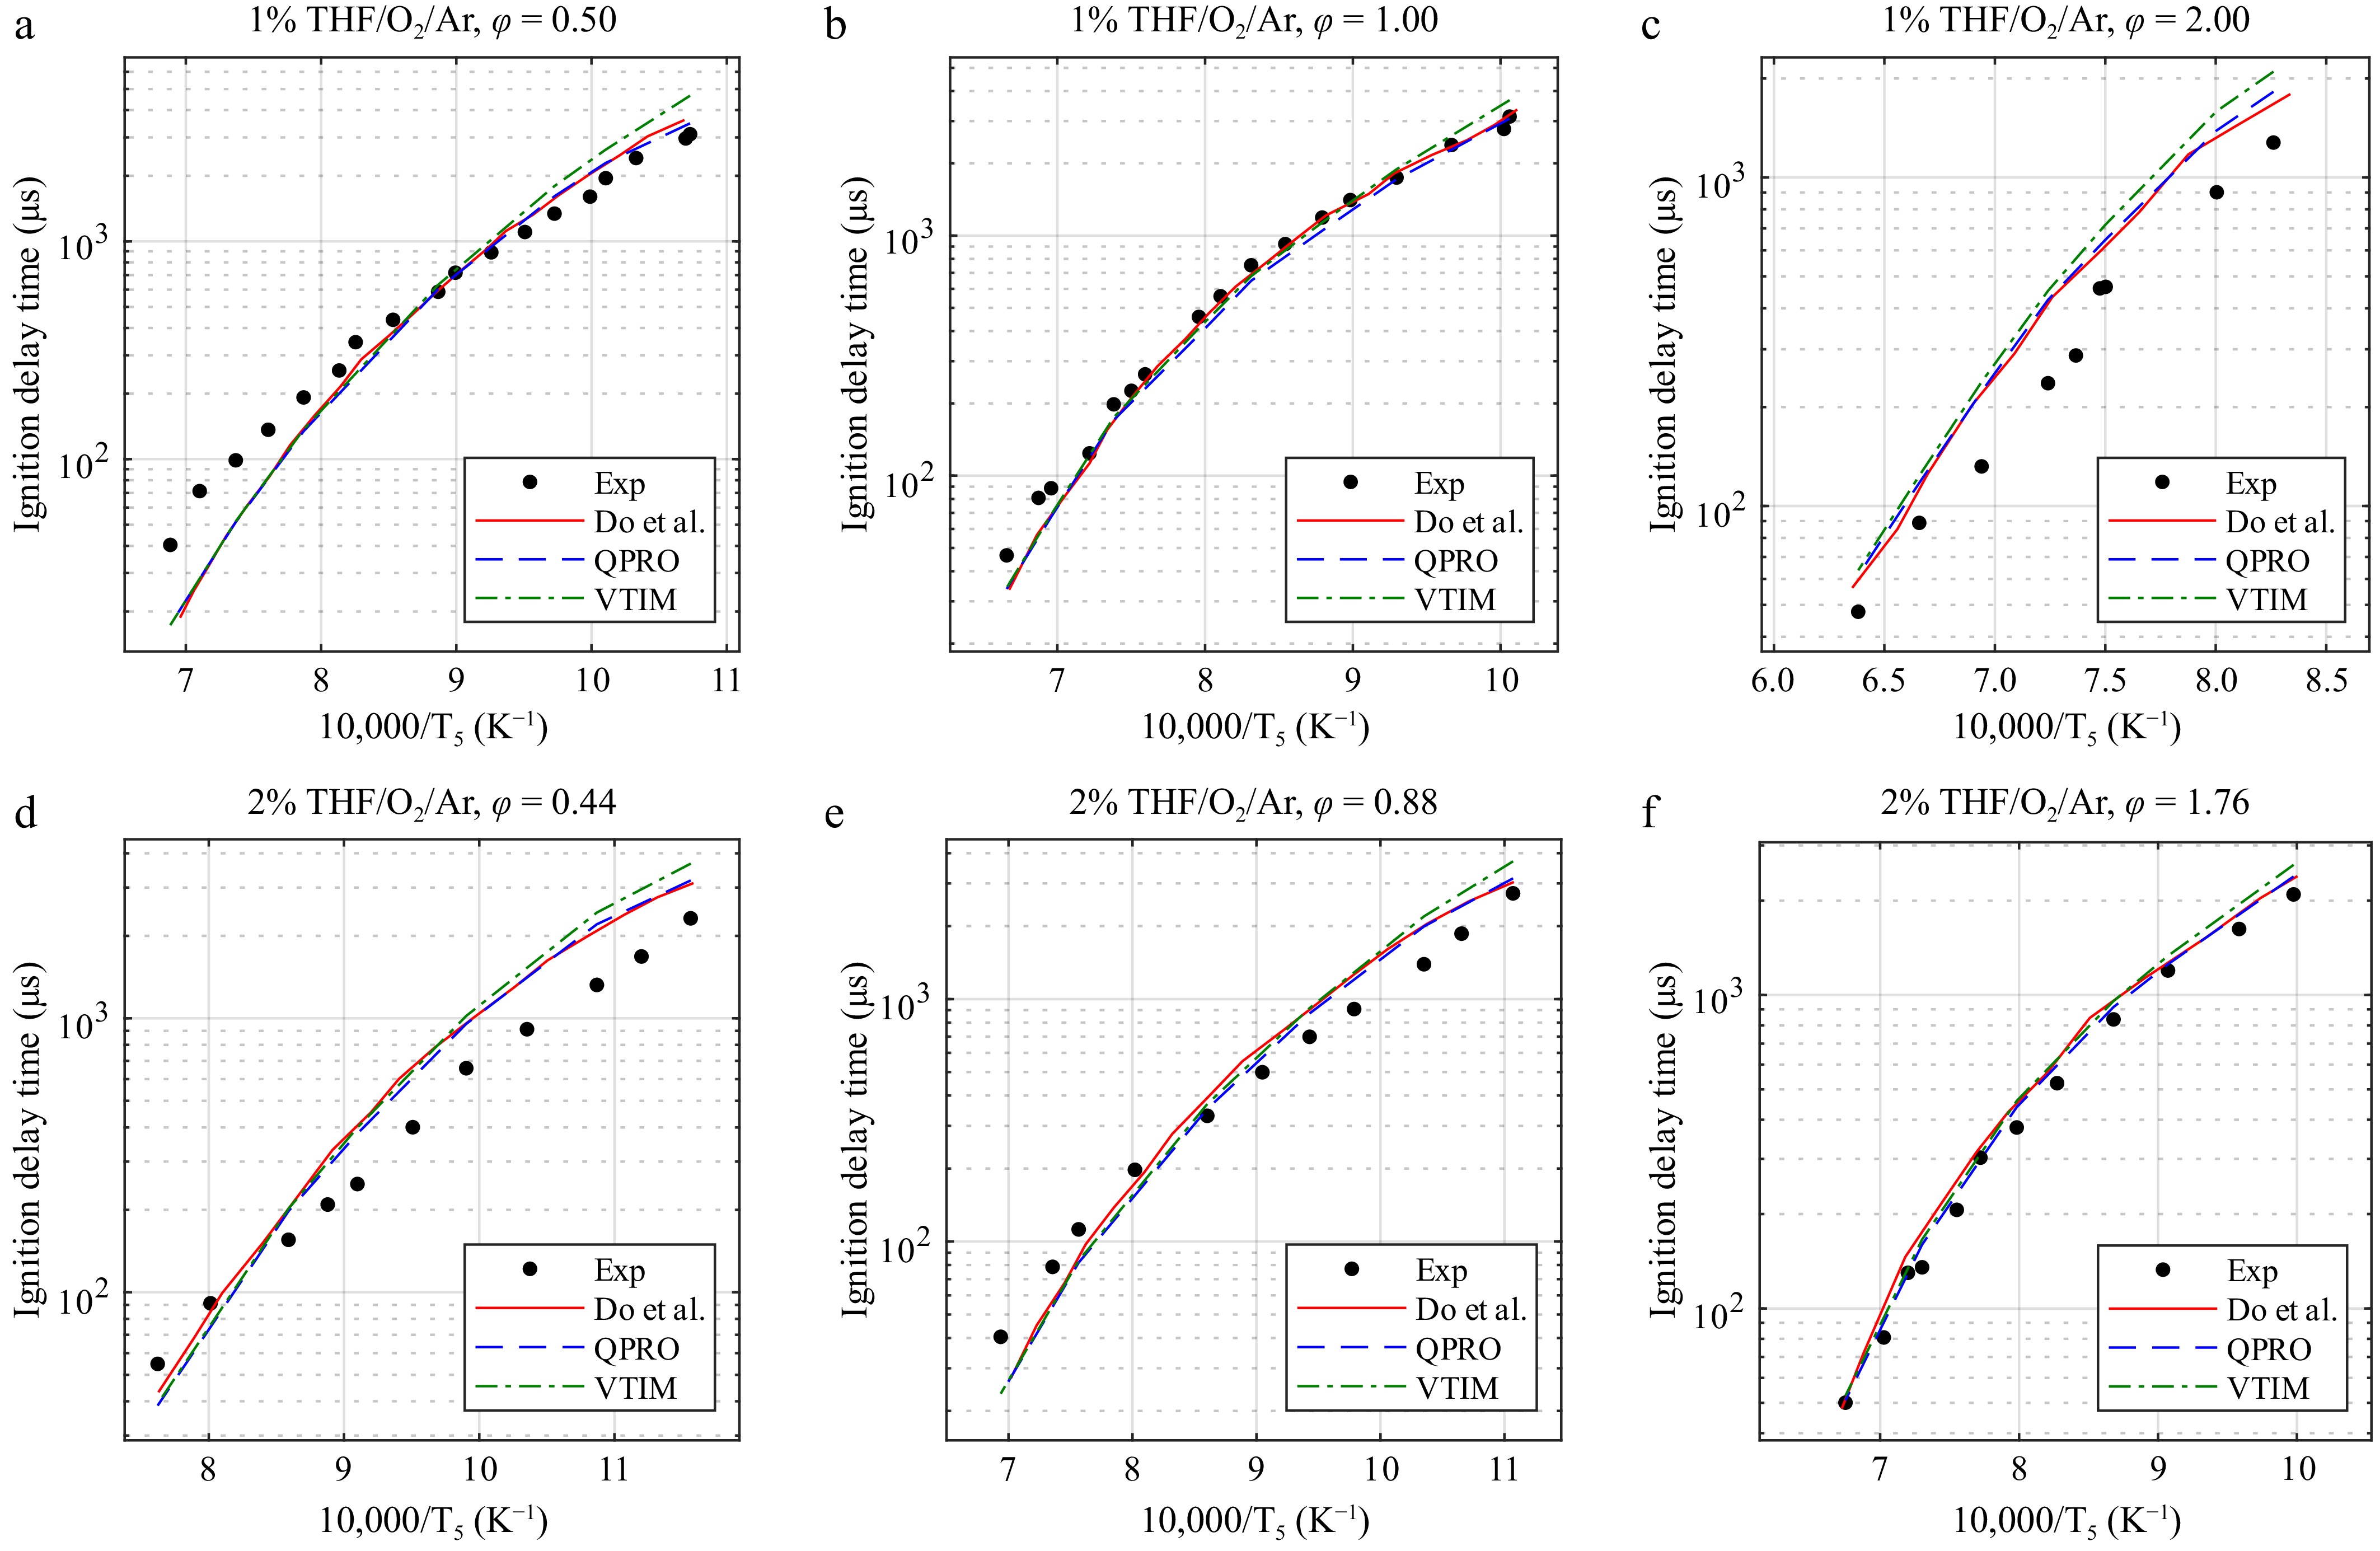
Figure 7.
Ignition delay times of tetrahydrofuran at 20 bar and temperatures from 865 to 1,570 K in O2 and argon (THF/O2/Ar) for equivalence ratios of (a) 0.5, (b) 1.0, and (c) 2.0 at 1% and (d) 0.44, (e) 0.88, and (f) 1.76 at 2% fuel concentrations and the combustion kinetic model of tetrahydrofuran with the ignition delay times computed by Do et al.[14], with the variable volume approach and the heat transfer approach. Exp, experimental data from Do et al.[14]. Lines, dashed lines, and dash-dot lines are the predicted ignition delay times.
-
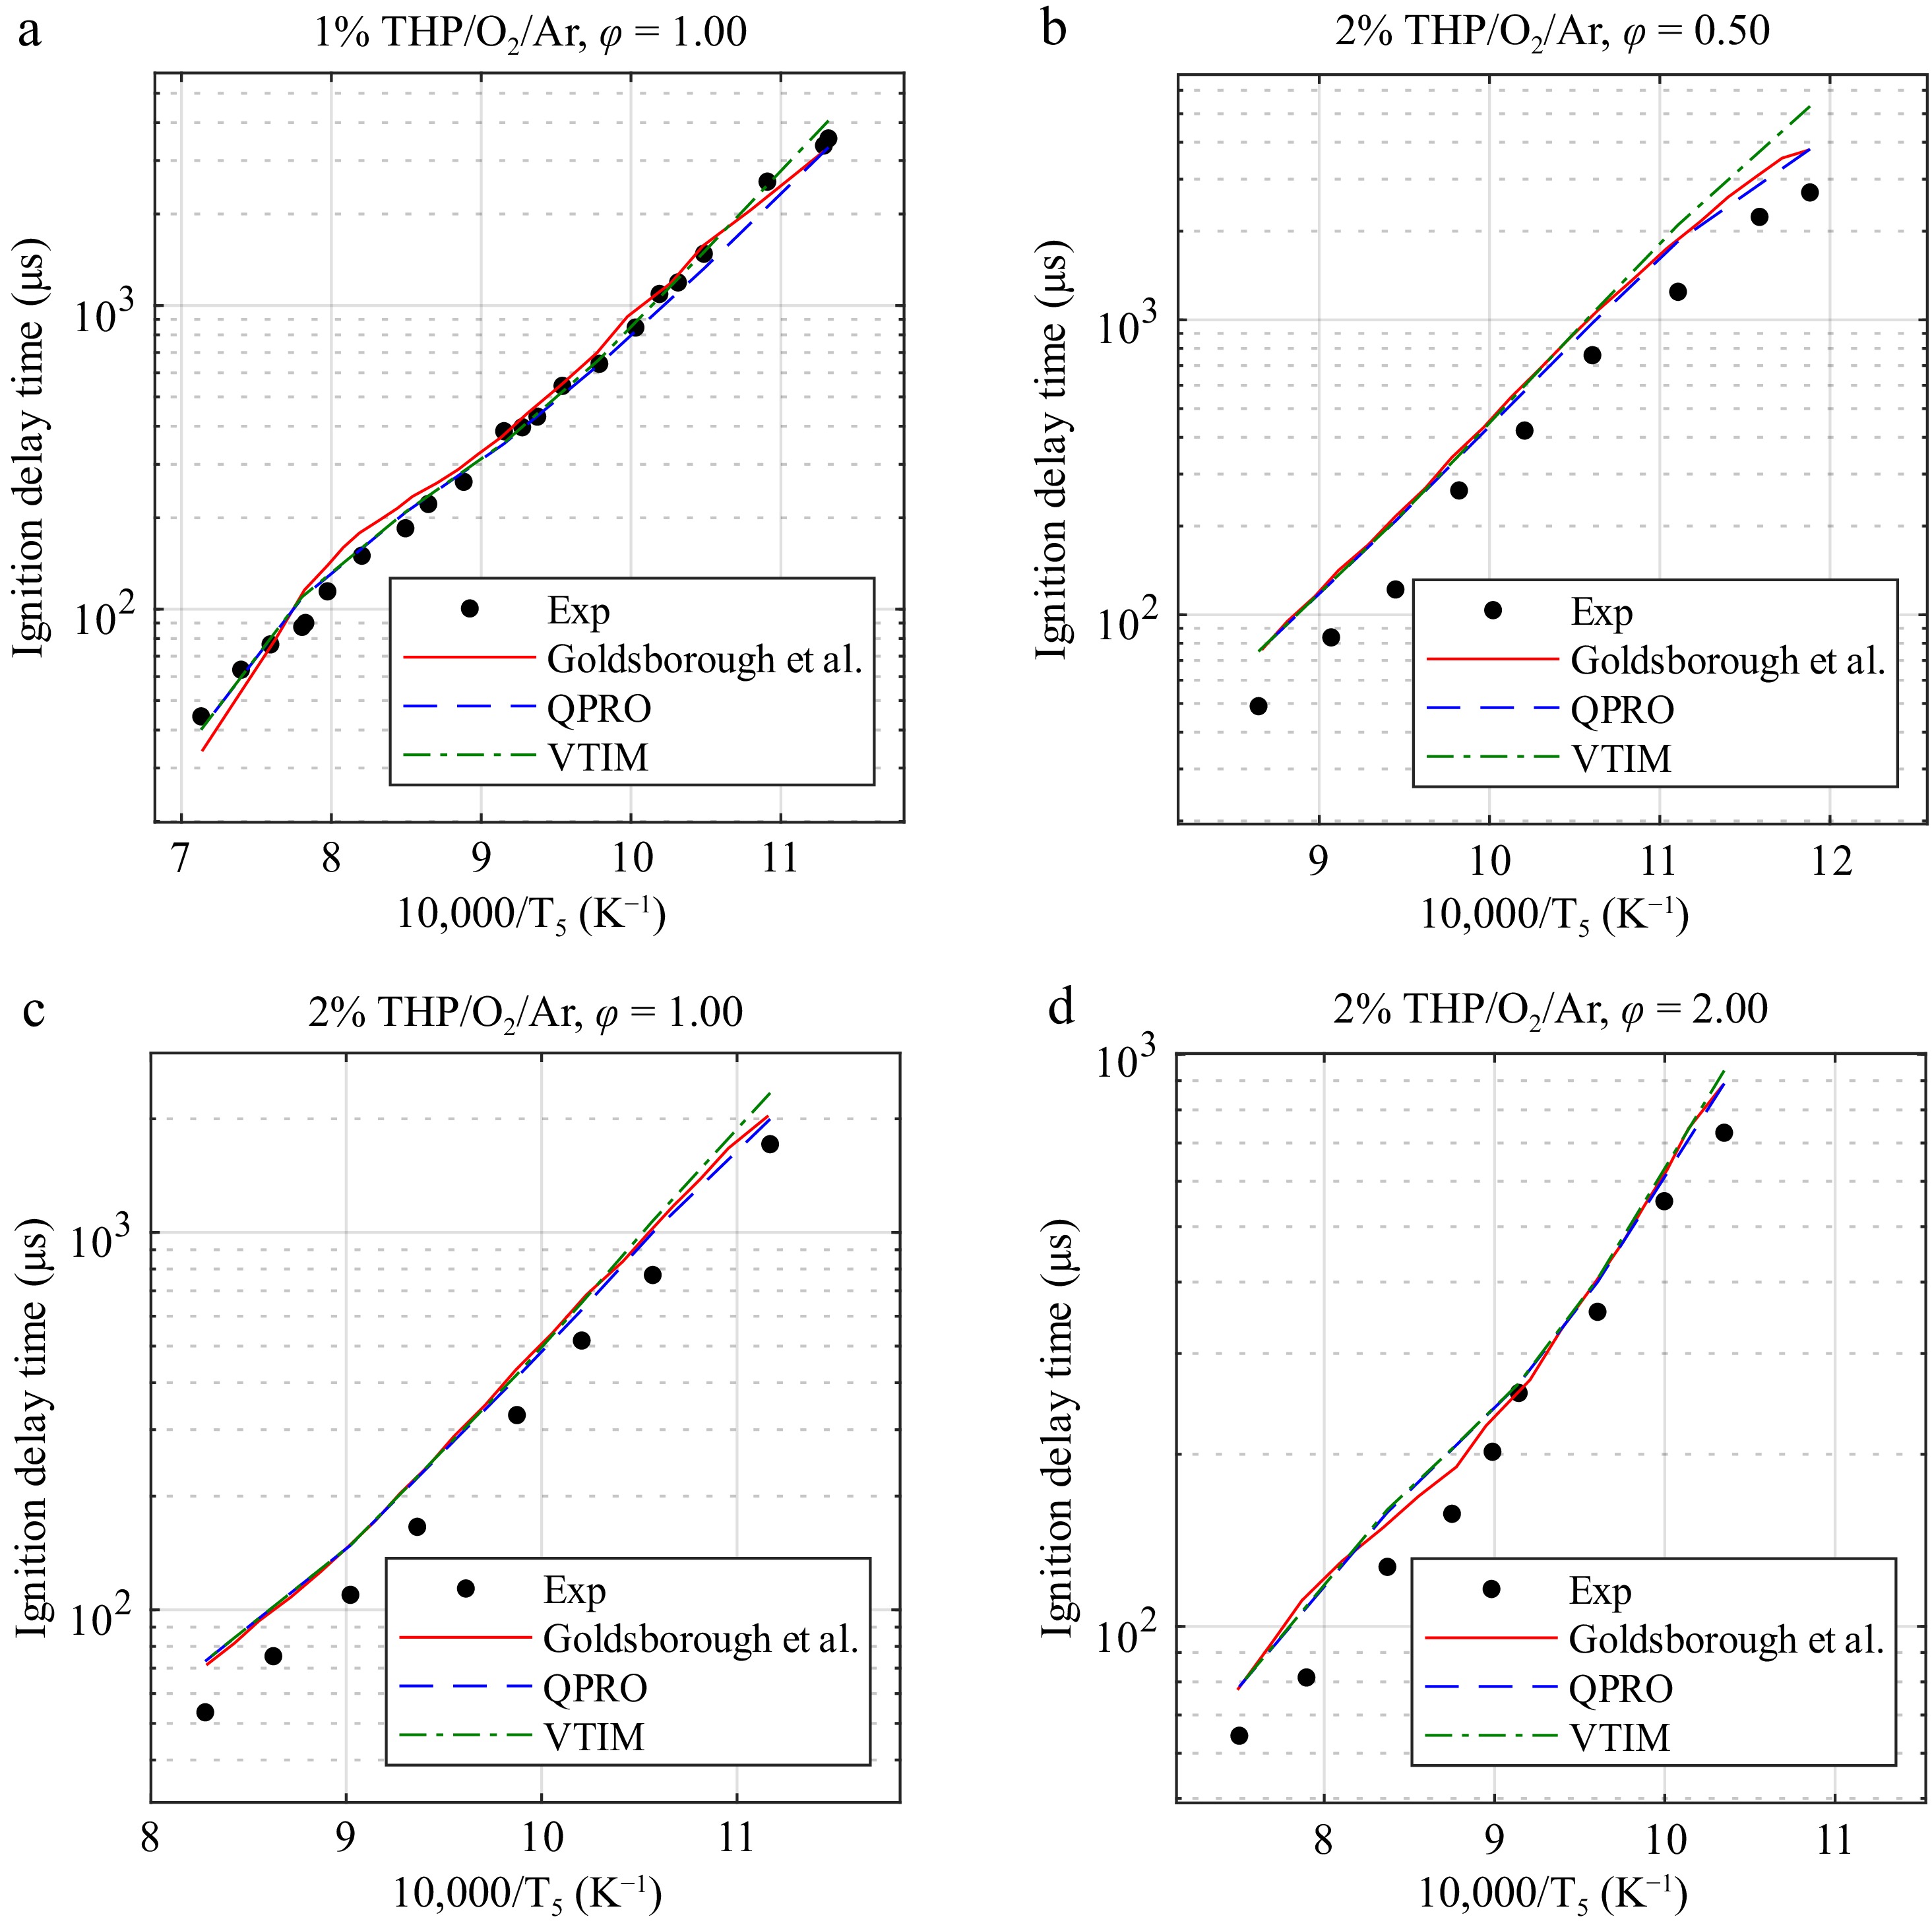
Figure 8.
Ignition delay times of pyrrolidine at 20 bar and temperatures ranging from 840 to 1,400 K in O2 and argon (THP/O2/Ar) for equivalence ratios of 0.5, 1.0, and 2.0 in fuel concentrations of 1% and 2% and temperatures ranging from 840 to 1,400 K and the combustion kinetic model of pyrrolidine with the ignition delay times computed by Goldsborough et al.[15], with the variable volume approach and the heat transfer approach. Exp, experimental data from Goldsborough et al.[15]. Lines, dashed lines, and dash-dot lines are the predicted ignition delay times.
-
Condition T1 ( °C) P5 (bar) Ar * O2* T5 (K) 1 80 20 1 0 940−1,810 K 2 40 20 1 0 1,035−1,940 K 3 40 20 0.9 0.1 880−1,700 K 4 40 20 0.75 0.25 825−1,530 K * is the mole fraction of Ar or O2 in the test mixture. Table 1.
Experimental mixtures and conditions used in this study.
Figures
(8)
Tables
(1)