


-
Shock tubes are an irreplaceable tool for investigating the chemical kinetics of fuel combustion at high temperatures and pressures close to the operating conditions of thermal engines[1,2]. Ideally, the temperature (T5) and pressure (P5) in the region behind reflected shock waves do not vary and should be equal to the values calculated using classical thermodynamic theory. However, non-ideal effects in the shock tube such as incident-shock attenuation and boundary layer growth can lead to an increase in P5 and T5 with time. This variation in P5 and T5 from the ideal values leads to large uncertainties in the rate constants and ignition delay times measured in the shock tubes[3]. Nativel et al.[4] have reported that using larger inner diameters of in test section, higher P5 pressures, and a lower Mach number for the incident shock wave can reduce the increase in P5 and T5 in shock tubes. For an inner diameter of 25 mm, the increase in T5 after 500 µs (75 K) is more than five times that of the larger 127 mm tube (14 K). At 1,800 K and 100 atm, the increase in T5 is nearly 20 K lower than that at 1,800 K and 1 atm[3]. Davidson et al.[5] identified that highly diluted fuel mixtures provided pressure evolution and ignition delay times matching with the results of a model with a constant volume and internal energy before and after the combustion. Hong et al.[6] proposed a physical solution to compensate for the nonideal effects in shock tube by using a driver insert. The principle is to tailor the pressure behind the reflected shock wave by reflecting a fraction of the expansion wave traveling in the high-pressure section towards the test section to mitigate the rise in pressure. A contact surface bump, causing an additional rise in pressure in the shock tube, was studied by Campbell et al.[7], who revealed that it is the result of the interaction of the reflected shock with the contact surface. The use of a lighter driver gas such as helium has shown a great reduction in the impact of this interaction on the behavior of pressure behind the reflected shock wave.
The non-ideal effects observed in the shock tube probably result from various dynamic behaviors of the system and have not been completely identified. The assumption of a constant internal energy and a constant volume is still commonly used in chemical kinetic modeling to simulate ignition delay times, thereby neglecting the impact of gas-dynamics on the reaction's chemistry. To account for these non-ideal effects, several methods have emerged to improve the prediction of ignition delay times. CHEMSHOCK is a two-step gas dynamic model developed by Li et al.[8] where the gas mixture is first allowed to react at a constant internal energy and volume, then the gas is isentropically expanded or compressed to either match the measured history of the gradual rise in pressure prior to ignition or expansion of the gas during combustion. By incorporating the measured pressure, CHEMSHOCK efficiently catches the combustion features in mixtures with significant energy release. The variable volume method proposed by Chaos et al.[9] using Chemkin's volume as a function of time (VTIM) option is used to reproduce an isentropic compression to match the measured increase in pressure prior to ignition. This method provides better predictions for longer ignition delay times, similar to CHEMSHOCK.
The mean P5 gradient (dp*/dt) was determined by assuming a linear increase in P5 in the shock tube prior to combustion and was taken into account to calculate the ignition delay times for zero-dimensional kinetic simulations[10−13]; however, this method was not completely detailed in earlier works. A negative heat loss was introduced as an input of Chemkin in order to account for the mean P5 gradient[14−16]. To the best of our knowledge, the increase in P5 within the shock tube is not entirely linear, potentially because of factors such as a bump in the contact surface[7]. No study has been published that details a method for converting the instantaneous P5 gradient into the equivalent heat loss.
The present work aimed to improve the prediction of ignition delay times in zero-dimensional kinetic simulations, particularly at low temperatures and high pressure, where it is complicated to investigate because of facility-related non-idealities. We updated the methods found in the literature to determine the heat transfer or volume history from the history of P5 measured in the shock tube. To this end, the P5 history of the O2/Ar mixtures (0%–25% O2) was measured in the high-pressure DRIVE shock tube[14,16] under various experimental conditions. The heat transfer profile (QPRO) and VTIM methods were applied for calculating the ignition delay times of biofuels reported in previous studies conducted at this facility at 20 bar.
-
The high-pressure shock tube facility at the DRIVE laboratory, Université Bourgogne Europe, used in this work has been detailed previously[14]. The tube consists of a stainless steel tube (with an inner diameter of 50 mm) and two separated parts (driver section, 4 m; driven section, 5 m) by a double stainless steel diaphragm with a thickness of 30–35 µm. Helium is used as the driver gas and test mixtures (O2/Ar) were injected in the driven section. The rupture of two diaphragms generates a shock wave that propagates toward the driven section. Four piezoelectric pressure transducers (PCB 113B22) located in the end part of the driven section measure the incident shock's speed. The post-shock pressure is recorded by using an additional piezoelectric pressure transducer (Kistler 603B1) positioned at the end wall. The driven section was heated up to 40–80 °C to investigate the effect of the driven section's initial temperature (T1) on the increase in P5. The shock tube is evacuated below 5 Pa with a turbomolecular pump between successive experiments to prevent any contamination of the tested mixture during the experiment.
To ensure that the sample used for the test in the shock tube reflects the global molar concentration of the species during the preparation of the mixture, a comparison of the ignition delay times for the same pressure and temperature conditions was made to determine when the mixture was homogenized and led to the delays converging. El Merhubi et al. mentioned that when the fuel/O2/Ar mixtures were tested after mixing for 1, 3, and 12 h, which led to differences of less than 10% in the ignition delay times for the same experimental setup[17]. Both tanks were purged below 3 Pa before preparing the mixture, and high-purity dioxygen and argon gases delivered by Air-Liquide were used. The three mixtures of O2 in Ar were prepared using Dalton's partial pressure law and stored in two stainless steel tanks heated up to 80 °C and tested according to the conditions in Table 1 below. The mixture of 100% Ar was also tested for an initial temperature (T1) of 80 °C, thus having four different conditions for non-reactive mixtures.
Table 1. Experimental mixtures and conditions used in this study.
Condition T1 ( °C) P5 (bar) Ar * O2* T5 (K) 1 80 20 1 0 940−1,810 K 2 40 20 1 0 1,035−1,940 K 3 40 20 0.9 0.1 880−1,700 K 4 40 20 0.75 0.25 825−1,530 K * is the mole fraction of Ar or O2 in the test mixture. The post-shock pressure (P5) and post-shock temperature (T5) were calculated from the shock wave's velocity and the initial conditions on the basis of the one-dimensional shock relations and the thermodynamics of argon and oxygen using the chemical equilibrium software Gaseq[18].
The accuracy of the post-shock temperature depends on the uncertainty of the incident shock wave's measured velocity, the composition of the driven gas, and T1. This led to variations in the temperature T5 of ± 1% which corresponds to ± 8–17 K for the tested temperature range.
Assumption and theory
-
Two assumptions have been suggested in the literature to account for the increase in pressure caused by the non-ideal effects of gas dynamics in the shock tube. The first one is a variable volume approach with a constant internal energy, and the second one is an increase in internal energy with a constant volume. In the following sections, methods to account for non-ideal effects will be discussed according to the fluid in the test section considered to be fully gaseous with an ideal behavior[3] and therefore remaining at equilibrium and stationary throughout the processes of compression and heat transfer. To use the relation based on ideal gas, the compressibility factor was determined for the tested temperature and pressure range, which was close to 1 using the Peng Robinson cubic equations of state[19]. The calculations are detailed in the supplementary materials (Supplementary Fig. S1a, S1b) with the compressibility factor of argon and O2. The nonideal effects considered in this study for the proposed methods are only related to effects of gas dynamics and were isolated by using inert mixtures of driven gas. This method was compared with a correction using reactive (fuel/O2/Ar) mixture pressure traces to evaluate the impact of potential underlying effects, such as soot radiation or pre-ignition energy release prior to combustion, on the predicted ignition delay time.
The variable volume and constant internal energy approach - VTIM
-
Several works have used a variable volume approach to consider non-ideal effects in kinetic models where the pressure rise would be recreated[20−22]. It has been shown that pressure increases behind reflected shock waves in shock tubes behave like polytropic processes[3]. In order to reproduce these non-ideal effects in shock tube, Chaos and Dryer outlined a method where an isentropic compression would recreate the pressure gradient in a kinetic model[9] with the assumption of constant internal energy. The relation between volume as a function of time and the rise in pressure is as follows:
$ v\left(t\right)=\dfrac{1}{{\rho }_{0}}{\left[\dfrac{P\left(t\right)}{{P}_{0}}\right]}^{-\frac{1}{\gamma }} $ (1) where, v is the specific volume,
$ \gamma $ $ {\rho }_{0} $ The variable internal energy change and constant volume approach - QPRO
-
Although the volume change approach is widely used, another method has emerged that assumes a constant volume with heat transfer used to account for non-ideal effects[14,16]. The relation between the increase in internal energy, later considered as heat transfer for its application in kinetic models, and the pressure gradient is as follows:
$ \dfrac{dq}{dt}=\dfrac{du}{dt}=\dfrac{v}{\gamma -1}\dfrac{dP}{dt} $ (2) where, q is the heat transfer, u is the internal energy,
$ \gamma $ -
Figure 1 presents the nonreactive pressure traces measured in the DRIVE shock tube at an initial temperature of 40 °C in the driven section. Time 0 is taken as the time when incident shock wave is reflected on the end wall of the driven section in the shock tube at the target pressure of around 20 bar. From then on, the pressure continues increasing to a maximum and finally collapses because of the arrival of the expansion wave.
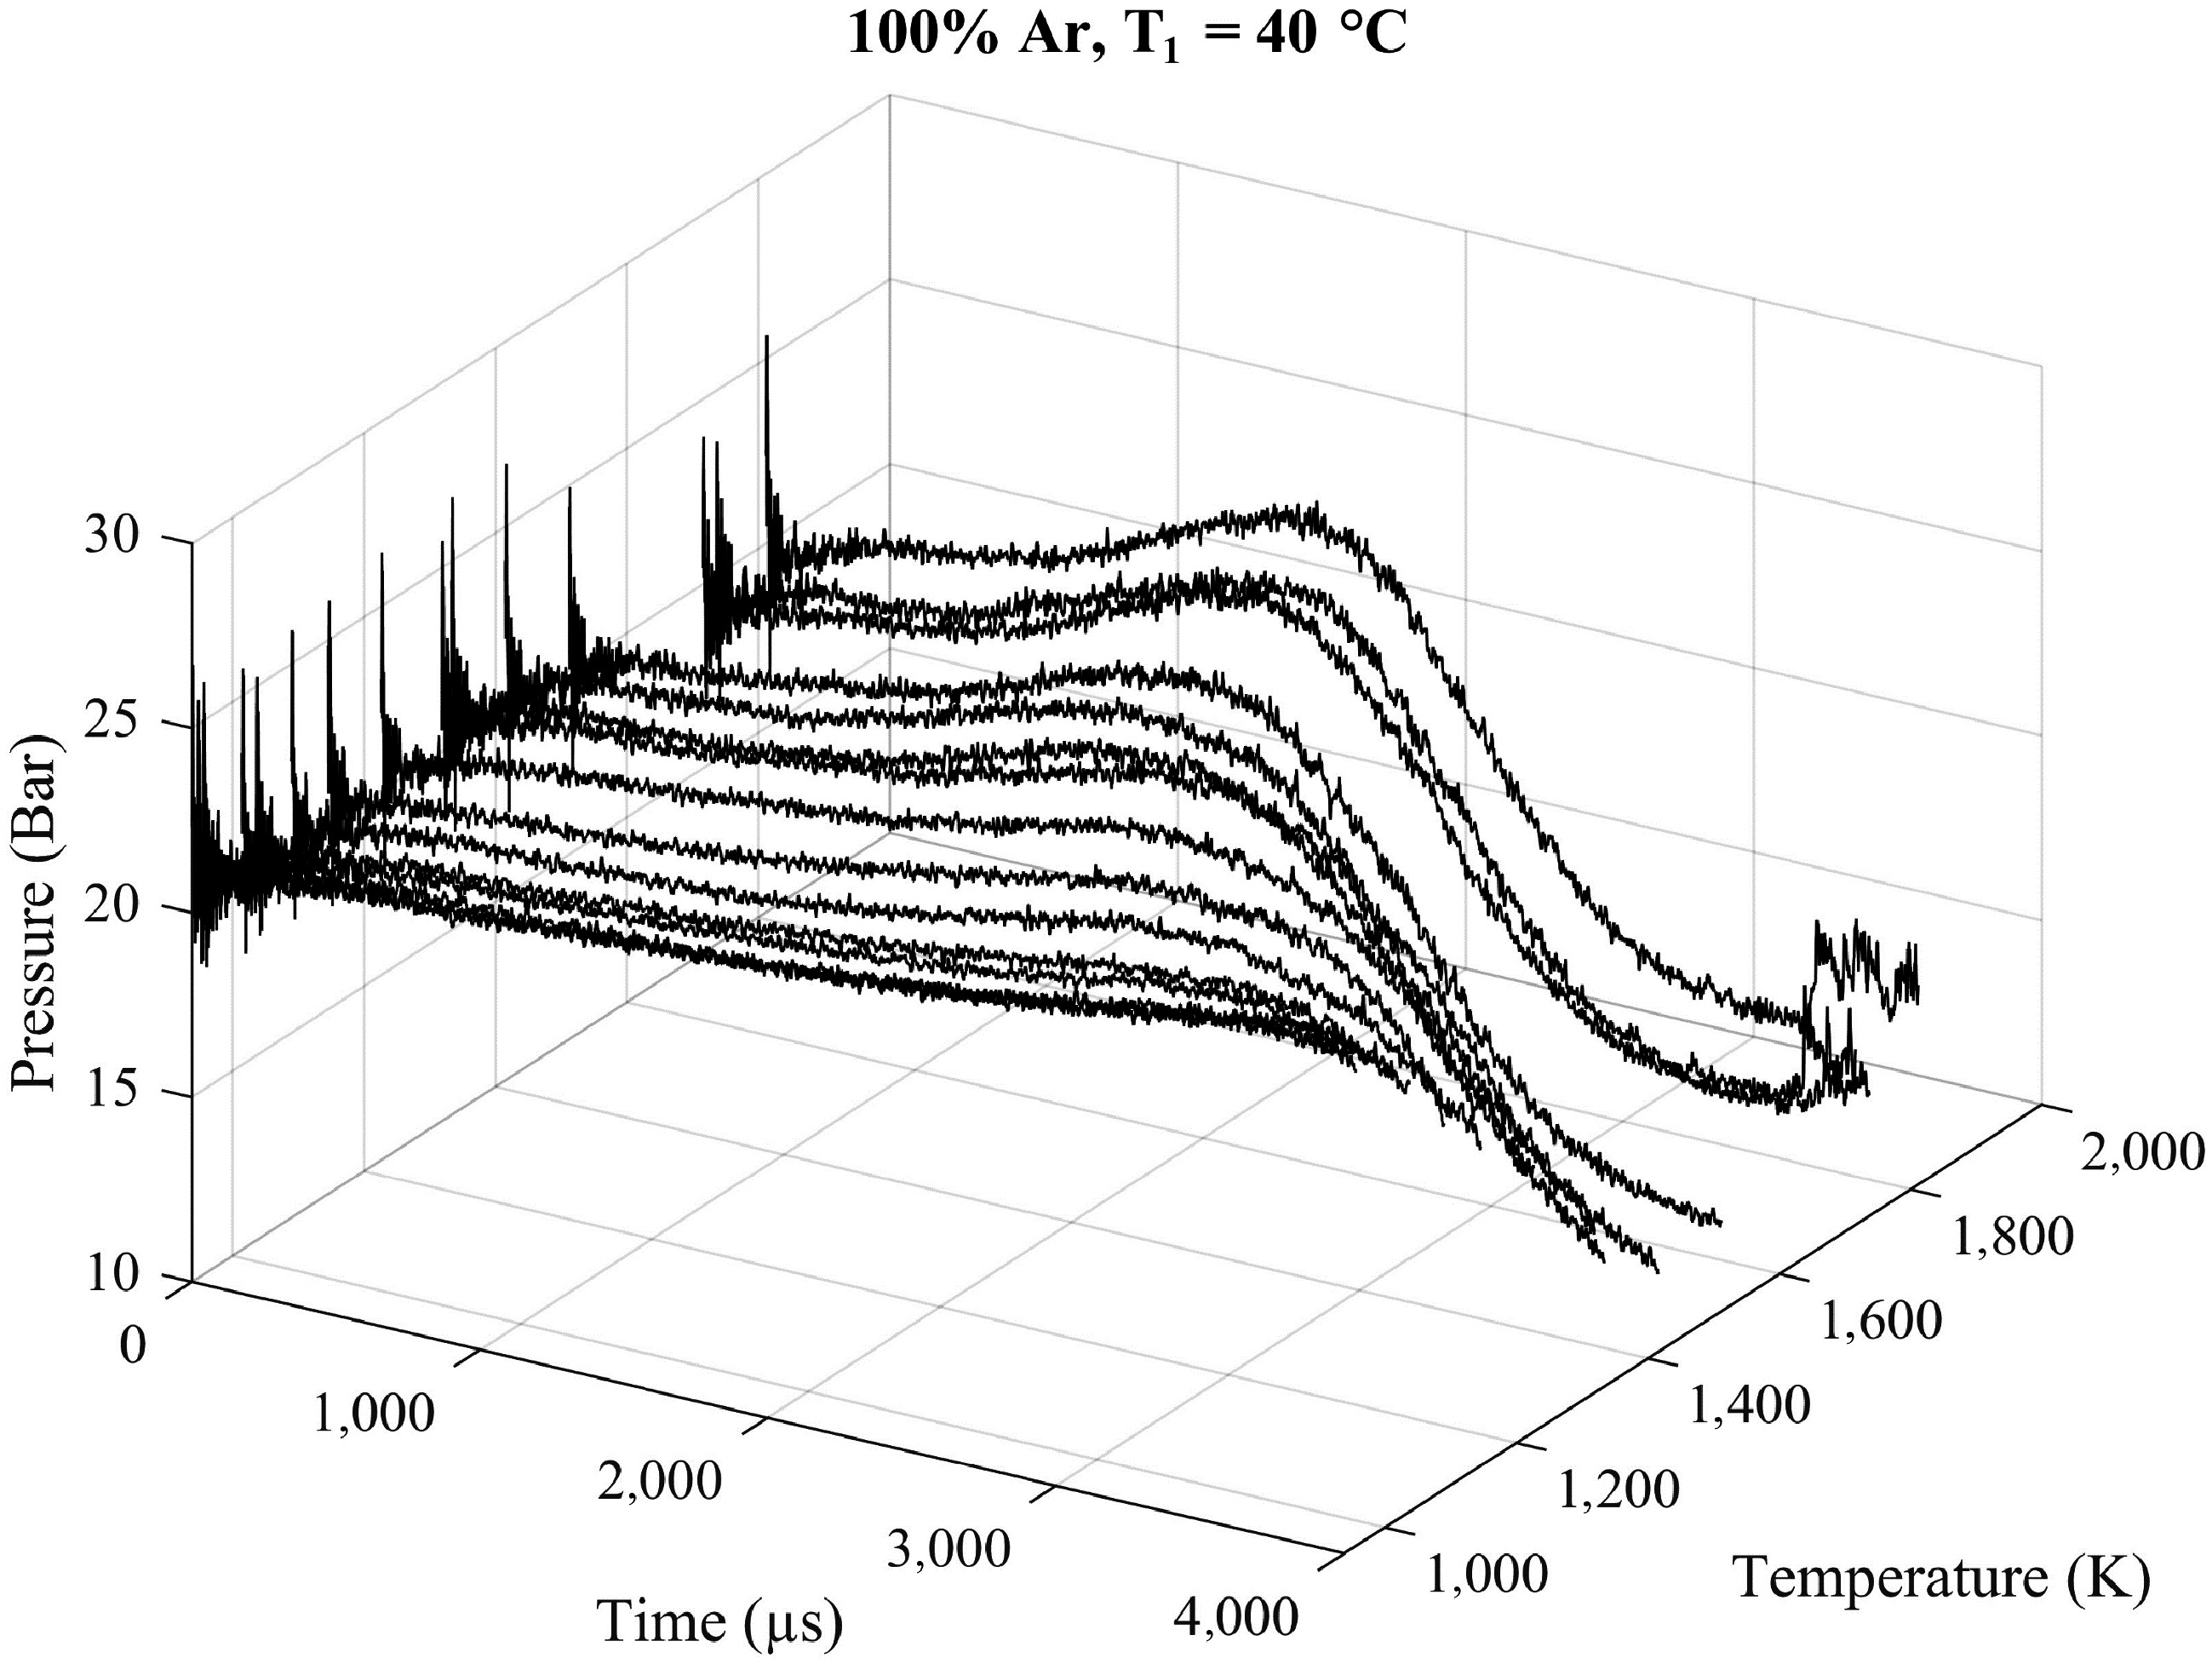
Figure 1.
Nonreactive pressure traces of argon at 20 bar with an initial temperature T1 of 40 °C in the driven section at the different tested temperatures T5 ranging from 940 to 1,800 K.
The evolution of the pressure P5 over time depends on the incident shock wave's velocity, which is strongly related to the temperature T5. Indeed, as the incident shock wave's velocity increases along with the temperature T5, the rise in pressure becomes more significant and the test time decreases. For lower temperatures (T5 < 1,000 K), the pressure traces show almost linear behavior until the maximum pressure occurs. For higher velocities of the incident shock wave, as the impact of the contact surface bump is stronger, the rise in pressure should be considered as a two-stepped increase. Campbell et al. studied its effects and they can be reduced using either a lighter driver gas or a denser driven diluent for the driven gas[7]; in our case, we used helium as the driver gas and a mixture of argon and O2 for the driven gas. Moreover, the test time decreases as the incident shock wave's velocity increases because of the expansion wave traveling and being reflected in the high-pressure section at faster velocities, causing its arrival at the end wall of the low-pressure section earlier. The same behavior is observed in Section S2 of the Supplementary Material for pure argon with an initial temperature of 80 °C (Supplementary Fig. S2) and with concentrations of 10% O2 and 25% O2 in the argon (Supplementary Figs S3 and S4, respectively).
Figure 2 presents the impact of the initial temperature T1 on the increase in P5. The average relative pressure gradients were defined according to the work of Hargis et al.[23]. The initial temperature seems to have a negligible influence on the shape of the P5 trace and the mean relative pressure gradient. The minor differences in the shape of P5 pressure resulting from different initial pressures have been corrected using the normalized pressure according to the initial pressure P5 upon the reflection of the shock wave at the end wall. The non-normalized pressure traces are available in the Supplementary Material (Supplementary Fig. S5a–S5c).
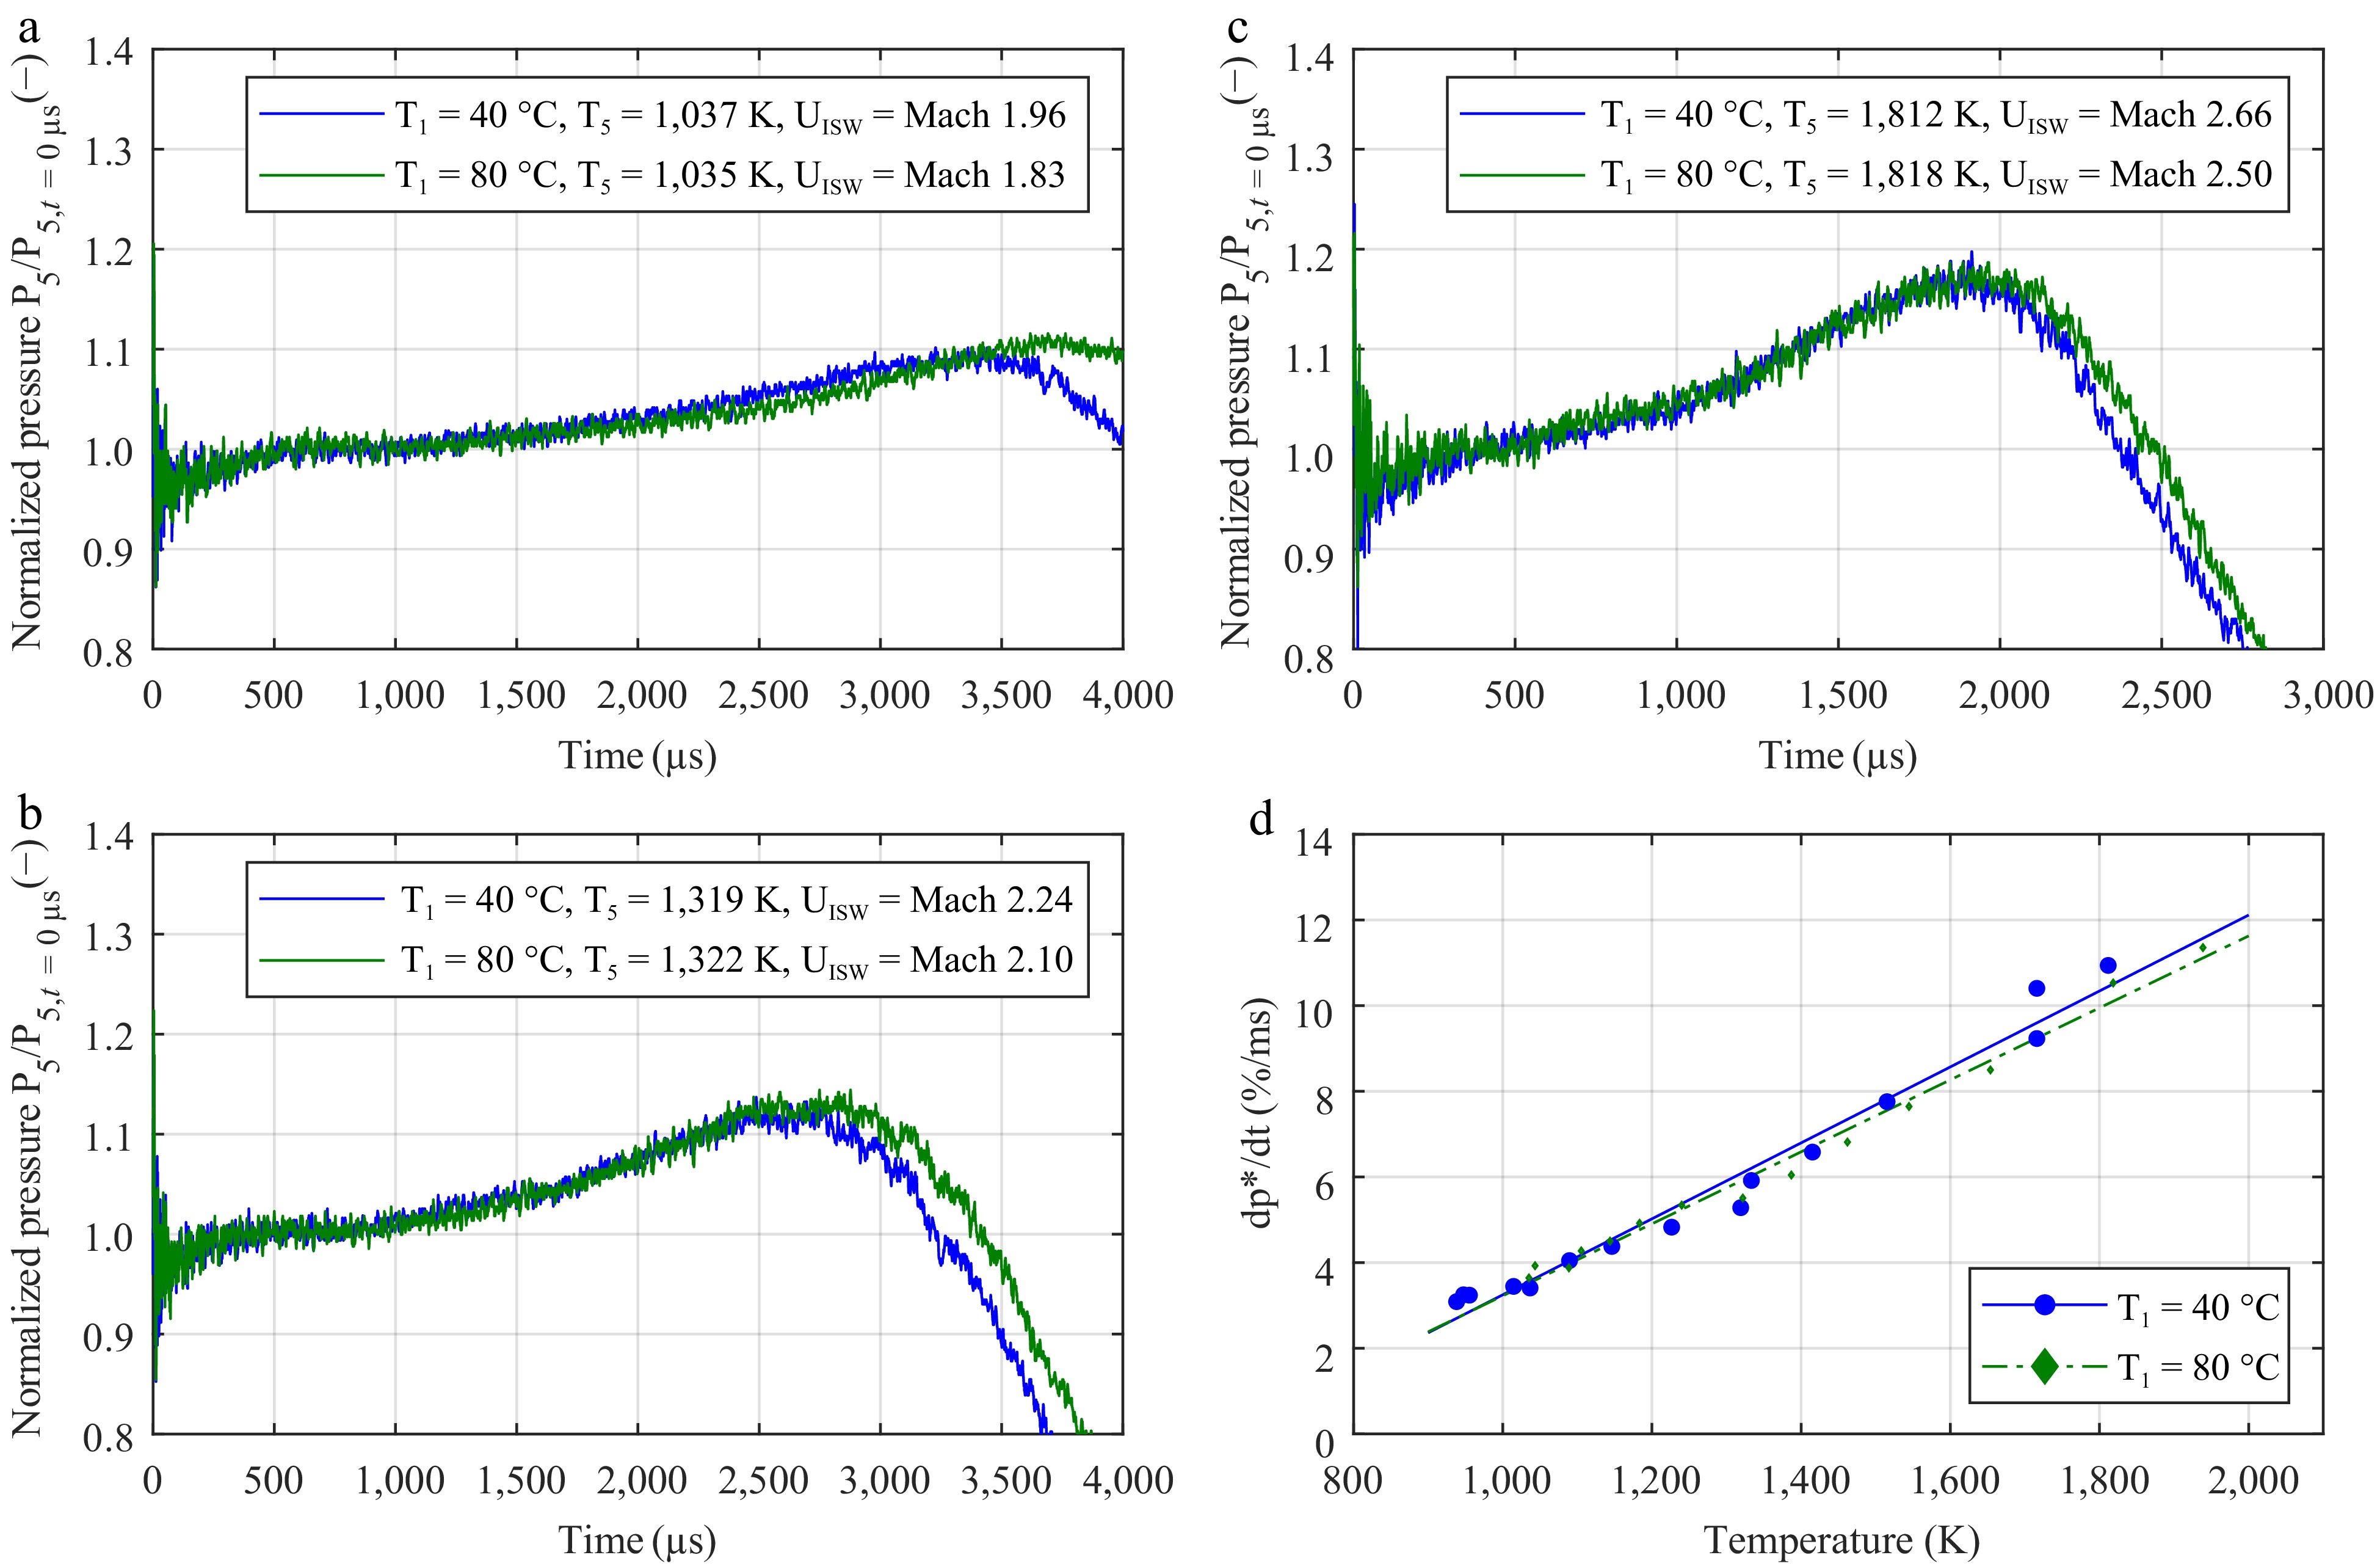
Figure 2.
Impact of the initial temperature in the driven section on the increase in pressure in argon. The mean pressure gradient dp*/dt was determined according to the work of Hargis et al.[23]. The graphs show the normalized pressure traces with an initial temperature T1 of 40 °C (in blue) and 80 °C (in green) at (a) low, (b) intermediate, and (c) high temperatures. (d) Linear fit of the experimental data.
The main differences in the pressure traces between the two tested values of T1 are mostly related to the contact surface bump arriving slightly sooner for T1 = 40 °C. The lower initial temperatures require a greater shock wave velocity, leading to a shortened test time. The relative pressure gradient in Fig. 2d reveals negligible differences between the two cases, regardless of the temperature T5 behind the reflected shock wave. The pressure trace from the initial temperature of 40 °C in the driven section can be used regardless of the measured initial temperature, as long as the ignition occurs prior to the arrival of the expansion shock wave and if the temperature T5 is used as the reference parameter when using the non-reactive pressure trace for correction.
In Supplementary Material, Supplementary Fig. S6a–S6d reveal important differences in the pressure gradients for similar Mach numbers of the incident shock wave. At the lowest temperatures, the pressure traces are very similar but as the Mach number increases, the pressure increases at a faster rate with a higher initial temperature T1 of 80 °C. This is mostly caused by the different speeds of the physical shock wave; for example, Mach 2.15 corresponds to approximately 709 m/s in argon at 40 °C, whereas it would correspond to 754 m/s at 80 °C. This causes a faster arrival of the contact surface bump in the test section, leading to the average relative pressure gradients to be higher at 80 °C.
Figure 3 presents the influence of different concentrations of dioxygen in argon on the rise in measured normalized pressure. A comparison with the non-normalized pressure traces are available in Supplementary Fig. S7a–S7c. For the different concentrations of dioxygen in argon, slight differences in the pressure gradients can be observed in Fig. 3d However, the test times become significantly shorter as the concentration of dioxygen increases.
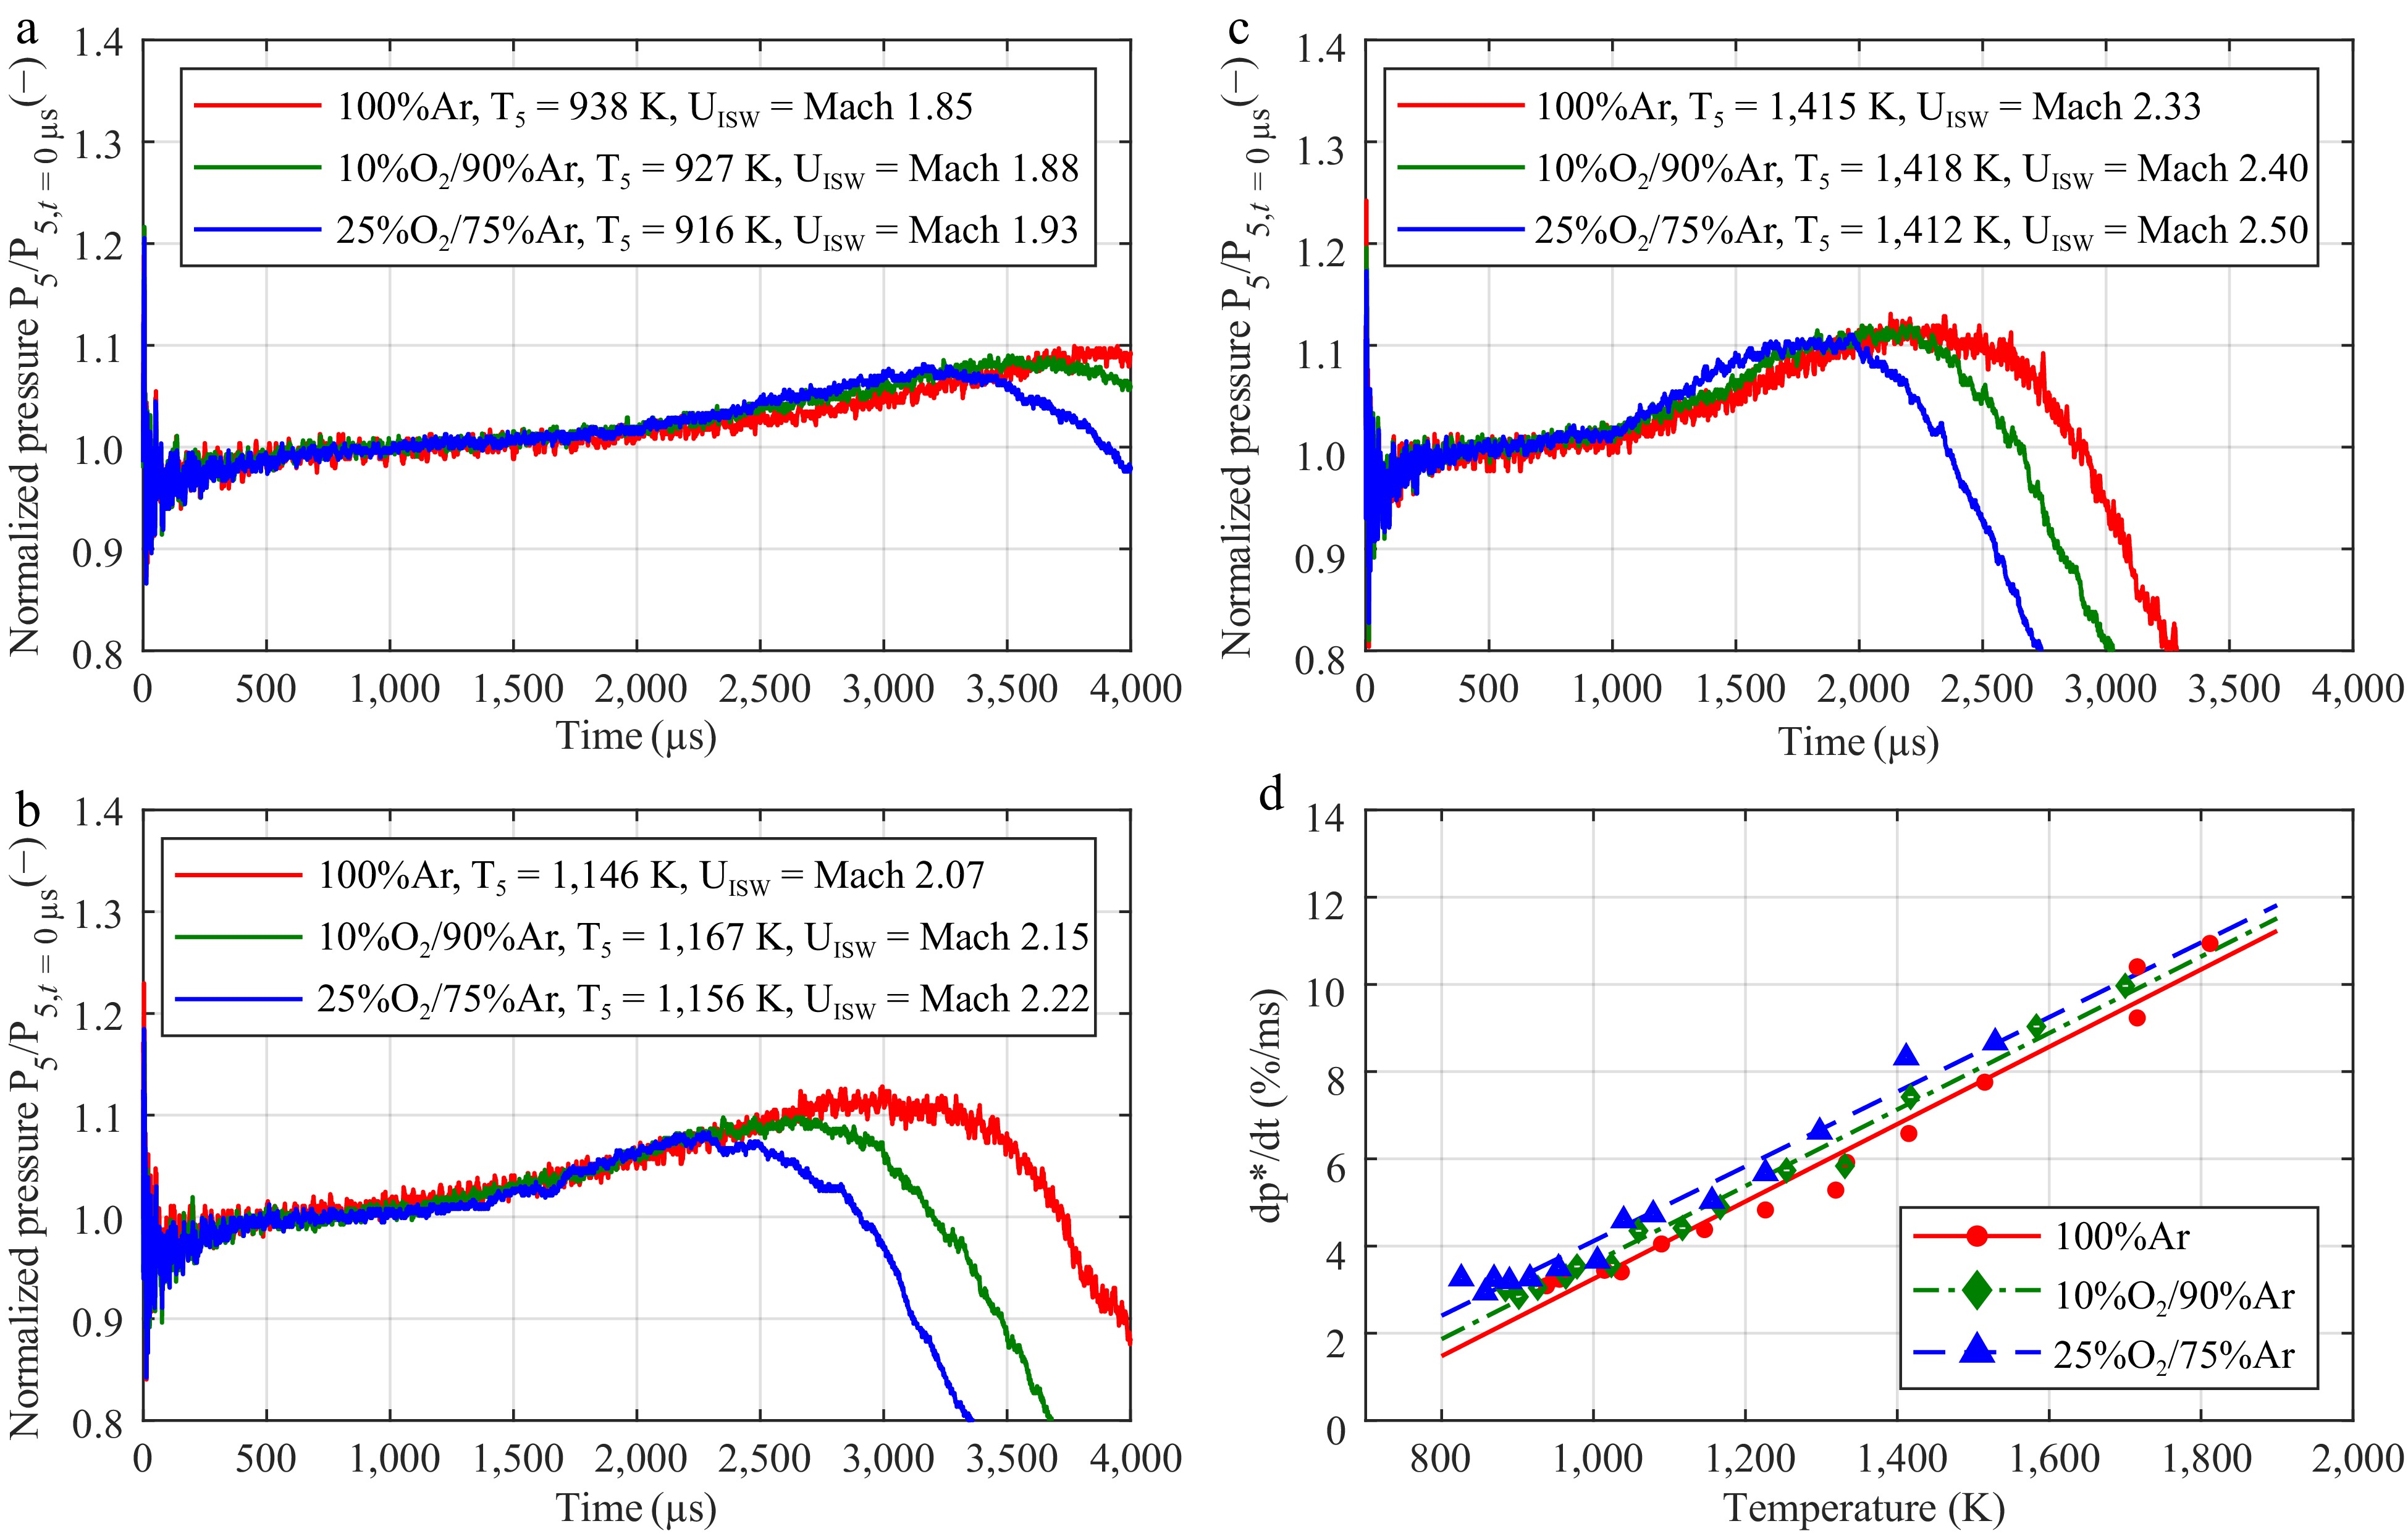
Figure 3.
Impact of the dioxygen concentration in argon on the pressure increase. The mean pressure gradient was determined according to the work of Hargis et al.[23] The normalized pressure traces of the mixtures with 100% argon (in red), 10% O2/90% argon (in green), and 25% O2/75% argon (in blue) at (a)low, (b) intermediate, and (c) high temperatures. (d) Linear fit of the experimental data.
The normalized pressure traces, however, overlap until the arrival of the expansion shock wave. For higher concentrations of dioxygen, the test time becomes noticeably shorter. As the heat ratio decreases with an increasing fraction of O2 in argon, the incident shock wave's velocity must be higher to reach a similar temperature level. This leads to the sooner arrival of the contact surface bump in the test section behind the reflected shock wave. In a similar manner to the different initial temperature in the driven section, the pressure trace of pure argon can also be used for correcting the rise in pressure in the models as long as the ignition occurs much sooner than the arrival of the expansion shock wave. As described in the Supplementary Materials, the pressure gradients were also compared, depending on the Mach number of the incident shock wave, and revealed negligible differences (Supplementary Fig. S8d). The pressure traces in Supplementary Fig. S8a–S8c reveal a much closer overlap which is mostly caused by the very similar physical shock wave speeds. Using the same example of Mach 2.15, it would approximately correspond to 710 m/s regardless of the tested concentrations of O2.
Overall, the experimental results with inert driven gas mixtures suggest that the non-reactive pressure traces measured at the end wall of the high-pressure DRIVE shock tube at T1 = 40 °C, 100% Ar, and P5 = 20 bar could be used for both the VTIM and QPRO methods. This allows us to calculate the ignition delay time of different fuel/O2/Ar mixtures under different operating conditions: 0–25% O2 in the mixture, P5 = 20 bar, and T1 = 40–80 °C. A fuel concentration of 1%–2% in the mixture is recommended for measurements of the ignition delay time conducted by this facility. Therefore, the composition of the fuel/O2/Ar mixtures was very similar to those mentioned above.
Applying the method based on measured non-ideal effects to chemical kinetic modeling
-
A practical example of determining the specific volume and internal energy for the argon pressure trace at T5 = 938 K and P5 = 21.2 bar is shown in Fig. 4.
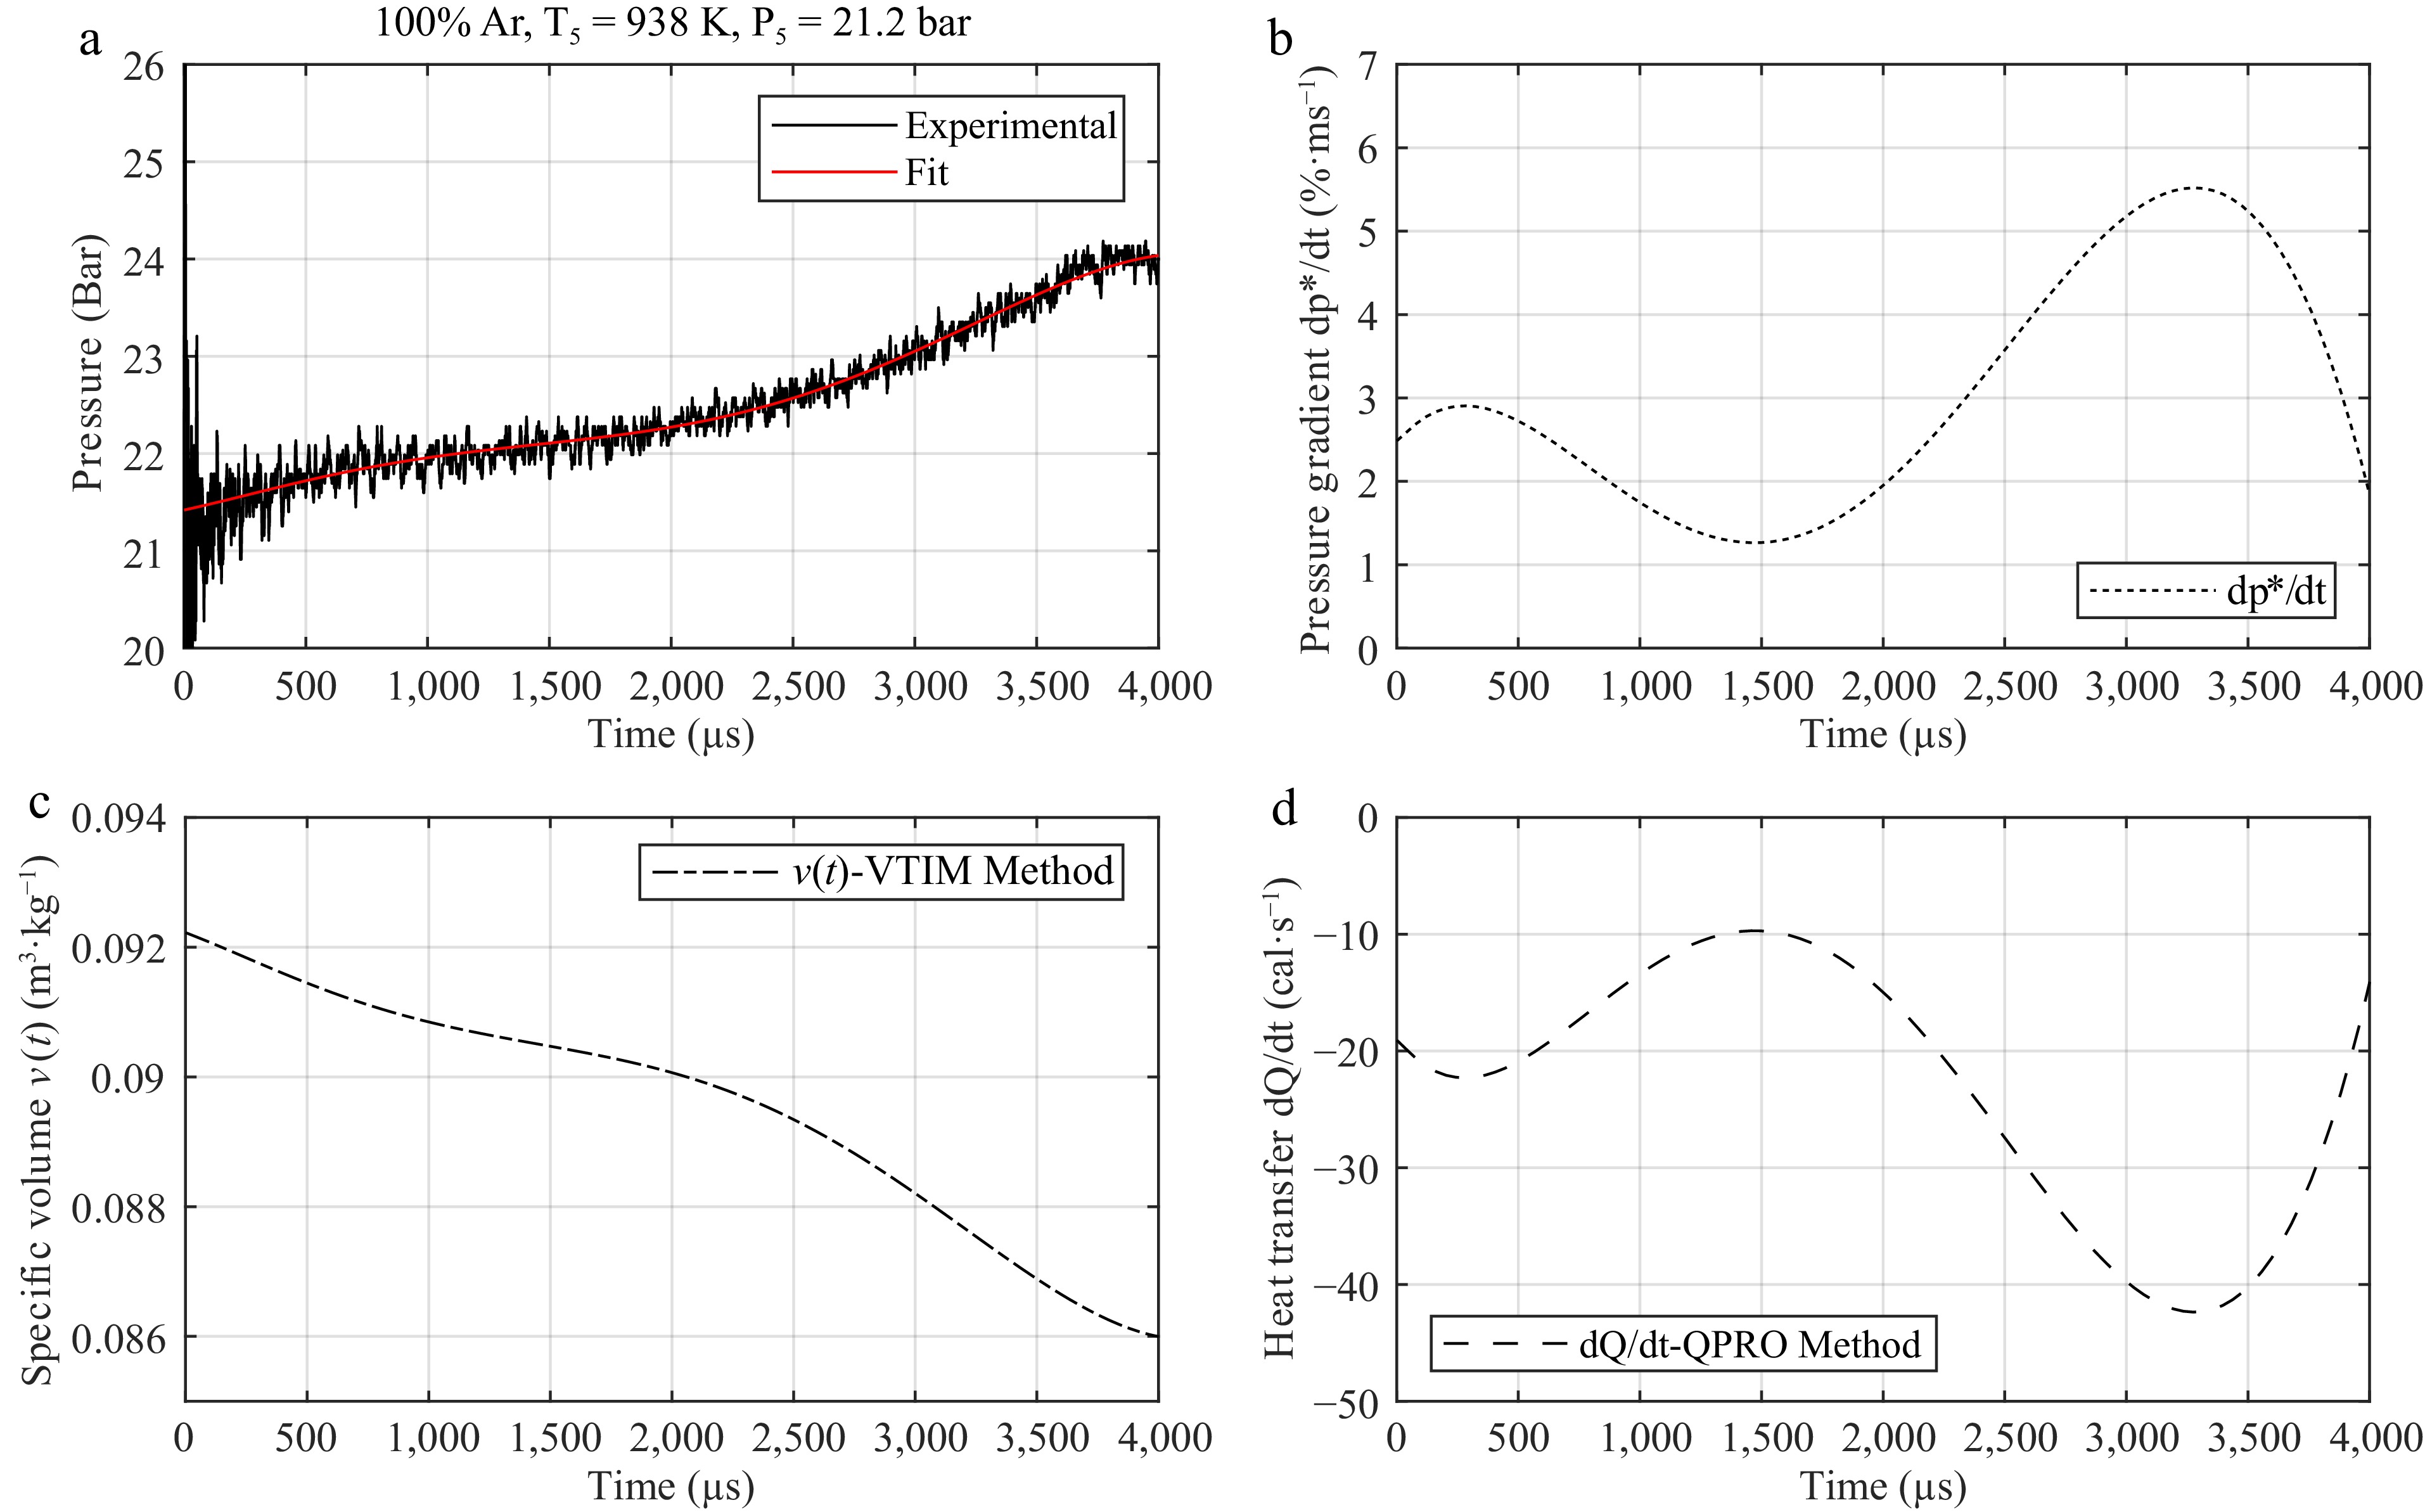
Figure 4.
Steps for using (a) the argon pressure trace at initial conditions of 938 K and 21.2 bar behind the reflected shock wave and (b) its variation for developing a correction table for (c) volume or for (d) internal energy for kinetic models.
Figure 4a is a sixth-order polynomial fit function of the argon pressure trace used for the variable volume approach and the internal energy change method. Figure 4b reports the pressure gradient as a function of time calculated from the fit of the pressure curve in Fig. 4a. Figure 4c presents the variation in the specific volume as a function of time, which is obtained from the fit of the pressure trace according to Eq. (1). The value of v(t) is applied in a zero-dimensional homogeneous reactor in Chemkin, assuming the initial volume of the reactor to be 1 cm3 and the internal energy to be constant. Figure 4d presents the variation in the internal energy as a function of time obtained from pressure gradient curves, based on Eq. (2). The variation in energy is used in a zero-dimensional homogeneous reactor in Ansys Chemkin with the heat transfer module QPRO at a constant volume to calculate the ignition delay time. Here, the change in internal energy is not related to any heat transfer caused by radiation or conduction with the walls of the shock tube; instead, it is a way to interpret the change in pressure as an change in energy in the zero-dimensional reactor. For both methods, the inert pressure trace is used instead of the reactive one to separate chemical-related effects from those of gas dynamics on the rise in pressure prior to combustion. The impact of using the reactive pressure trace with the VTIM method was investigated in the Supplementary Material (Supplementary Fig. S12). The slight pre-ignition energy release from the reactive mixture causes the pressure to be overpredicted compared with the VTIM method using inert pressure traces. The use of the reactive pressure traces for correction in the supporting information only exposes the undesirable effects of the reactive mixture on the computed ignition delay times and only emphasizes the use of the inert gas for model correction in this work.
To obtain a pressure trace as a function of time that can be used for the kinetic model, fit functions were used to match the different measured rates of the rise in pressure, mostly to compensate for the noise. Moreover, the fit functions allowed the creation of interpolated pressure traces for intermediate conditions that were not experimentally tested for correcting reactive mixtures. This allowed us not to run the experimental conditions twice with an inert gas first and then with the test gas afterwards. The method of creating intermediate pressure traces is detailed in Supplementary Material, with Supplementary Fig. S11 showing the result of an interpolated normalized pressure trace, from which the relative pressure gradient was extracted to be used, in a similar manner to Fig. 4b, in either the QPRO or the VTIM method. The repeatability of the shock tube is also regularly validated by comparing the pressure traces of argon and biofuels such as tetrahydrofuran (THF), at 20 bar, with the results from previous operations.
In Fig. 4a, the sixth-order polynomial fit was used to match the change in the pressure increase with the contact surface bump. A comparison with underfitting lower-order polynomial, exponential, and average fit are detailed in the Supplementary Material. Supplementary Fig. S9a–S9c compares how the different functions tested fit the pressure traces of argon for three different temperatures. Supplementary Fig. S9d summarizes and quantifies the accuracy of each fit function using the normalized root mean square error (NRMSE). Both the average and the exponential fit functions showed NRMSE at 3% and 1.5% respectively, with the third-degree polynomial fit being below 1%. Supplementary Fig. S10 compares the ignition delay times between consecutive polynomial orders, thus determining at which order the fit function converges. Relative differences in ignition delay time were calculated by both the VTIM and QPRO method and converged after the sixth-order polynomial fit function with a difference below 1%.
As the average relative pressure gradient is commonly used for correction with the variable volume approach in the literature, both the average and the pressure gradient as a function of time were compared (Section S6 of the Supplementary Material). Supplementary Fig. S13 presents a comparison between the measured pressure trace of the oxidation of tetrahydrofura (THF) with O2 in argon and simulated ignition delay times using the chemical kinetic mechanism of Do et al.[14]. The constant volume and internal energy approach (constant U V) was used as the reference, and the VTIM method was applied using non-reactive pressure trace in two different ways. The first one used the average pressure gradient and the second one used the pressure gradient as a function of time. Using the average pressure gradient for the VTIM method underpredicted the ignition delay time compared with the pressure gradient depending on time, as the average value accounts for the contact surface bump interaction before it occurs. Supplementary Fig. S14 shows similar results by using QPRO method, with the average value overpredicting the pressure prior to combustion.
Figure 5 reports the application of the VTIM and QPRO methods to calculate the ignition delay time for the cyclopentane (CPT)/O2/Ar mixture at 20 bar and an equivalence ratio φ = 1. As can be seen in Fig. 5a, the VTIM and QPRO methods converge with the constant volume and internal energy approach and match the experimental data well at high temperatures. Because of the short ignition delay times, the rise in pressure prior to combustion is negligible and does not require correction. The accuracy of the kinetic mechanism prevails in regards to the non-ideal effects of gas-dynamics. Any chemical-related non-idealities such as possible soot formation and radiation prior to combustion should also be considered, as these increased the ignition delay time by lowering the core gas temperature, but this is out of the scope of this study. However, it is possible to account for soot and radiation by adding the calculated radiation heat transfer prior to combustion to either the VTIM or QPRO methods using the heat transfer module from Ansys Chemkin.
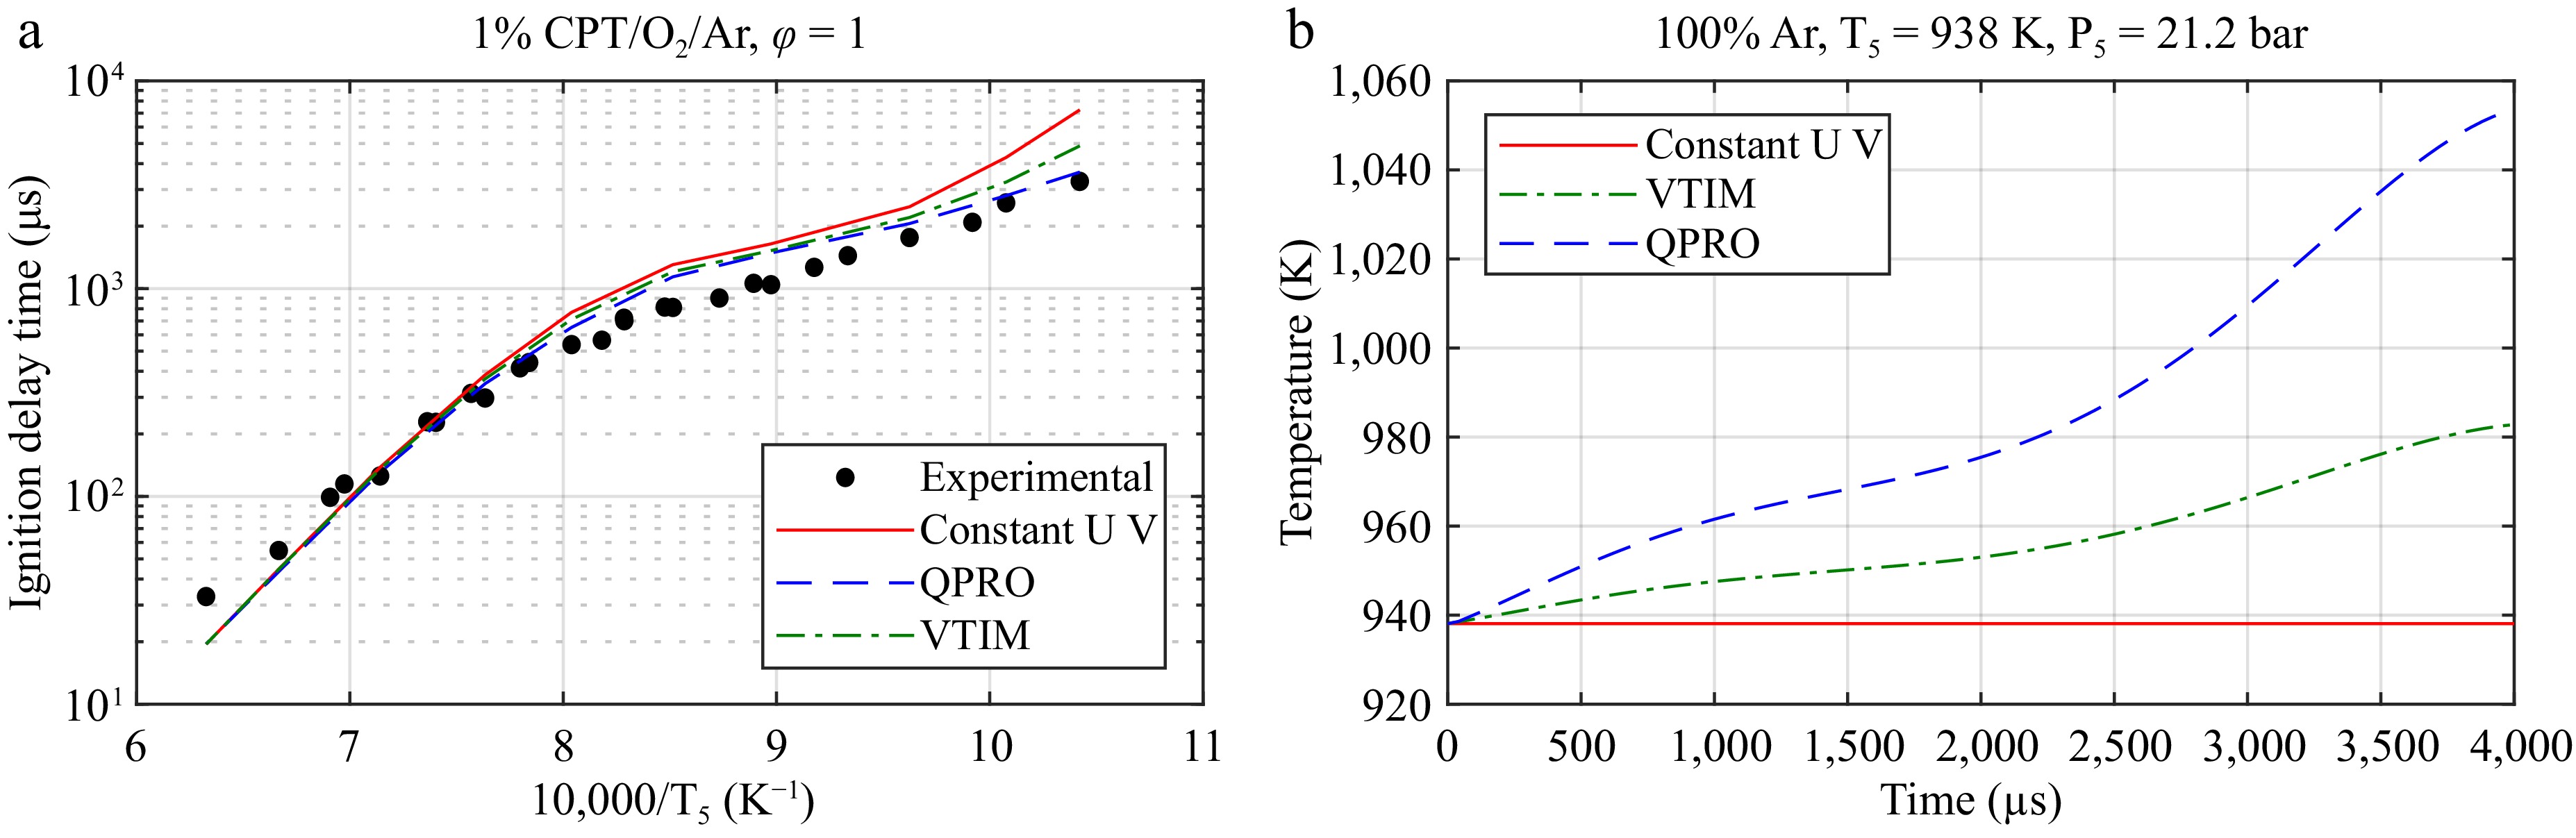
Figure 5.
Application of the VTIM and QPRO methods for predicting the ignition delay time of CPT/O2/Ar. (a) The ignition delay time of CPT at 20 bar and the equivalent ratio φ = 1. (b) The temperature as a function of time for the assumptions of a constant volume and internal energy (UV), a constant internal energy and variable volume (VTIM), and a constant volume and variable internal energy (QPRO) from the non-reactive pressure trace of argon at an initial temperature of 40 °C and the conditions behind the reflected shock wave of 938 K and 21.2 bar.
For high temperatures where ignition occurs at < 1,000 µs, the influence of the rise in pressure can be neglected[9]. However, the QPRO method predicts the ignition delay time well at low and intermediate temperatures (850–1,100 K) with longer ignition delay times where the rise in pressure has a noticeable impact. To explain the prediction capacity of the VTIM and QPRO methods at low temperatures, Fig. 5b presents the calculated temperature variation based on the polytropic processes involved in each method. The temperature rises from around 940 to 1,055 K in 4 ms with the QPRO method, whereas the temperature rises to 980 K in the same time for the variable volume method, leading to significant differences in the ignition delay times. In a shock tube, measurements of the temperature variations can be complex to obtain, as opposed to the pressure, as the test times only last for few milliseconds. However, temperature estimation remains important for the validation of kinetic models. The assumptions of the methods are chosen according to the relation between the temperature and the pressure observed experimentally to limit the misprediction of ignition delay times in kinetic models.
Application of the method for chemical kinetic modeling of biofuels
-
We report the predicted ignition delay times of the VTIM and QPRO methods for CPT/O2/Ar mixtures in Fig. 6. Figures 7 and 8 present the predictions of models in the literature[14–16,24] using the QPRO and VTIM methods for calculating the ignition delay times of biofuels such as tetrahydrofuran (THF) and pyrrolidine (THP). Overall, the simulation results with the QPRO method are similar to those reported in the literature[14] using a constant heat loss. However, the simulation results are overpredicted at low temperatures by the VTIM method. The results of both methods can be applied regardless of the fuel, as long as the oxygen concentrations remain below 25%.
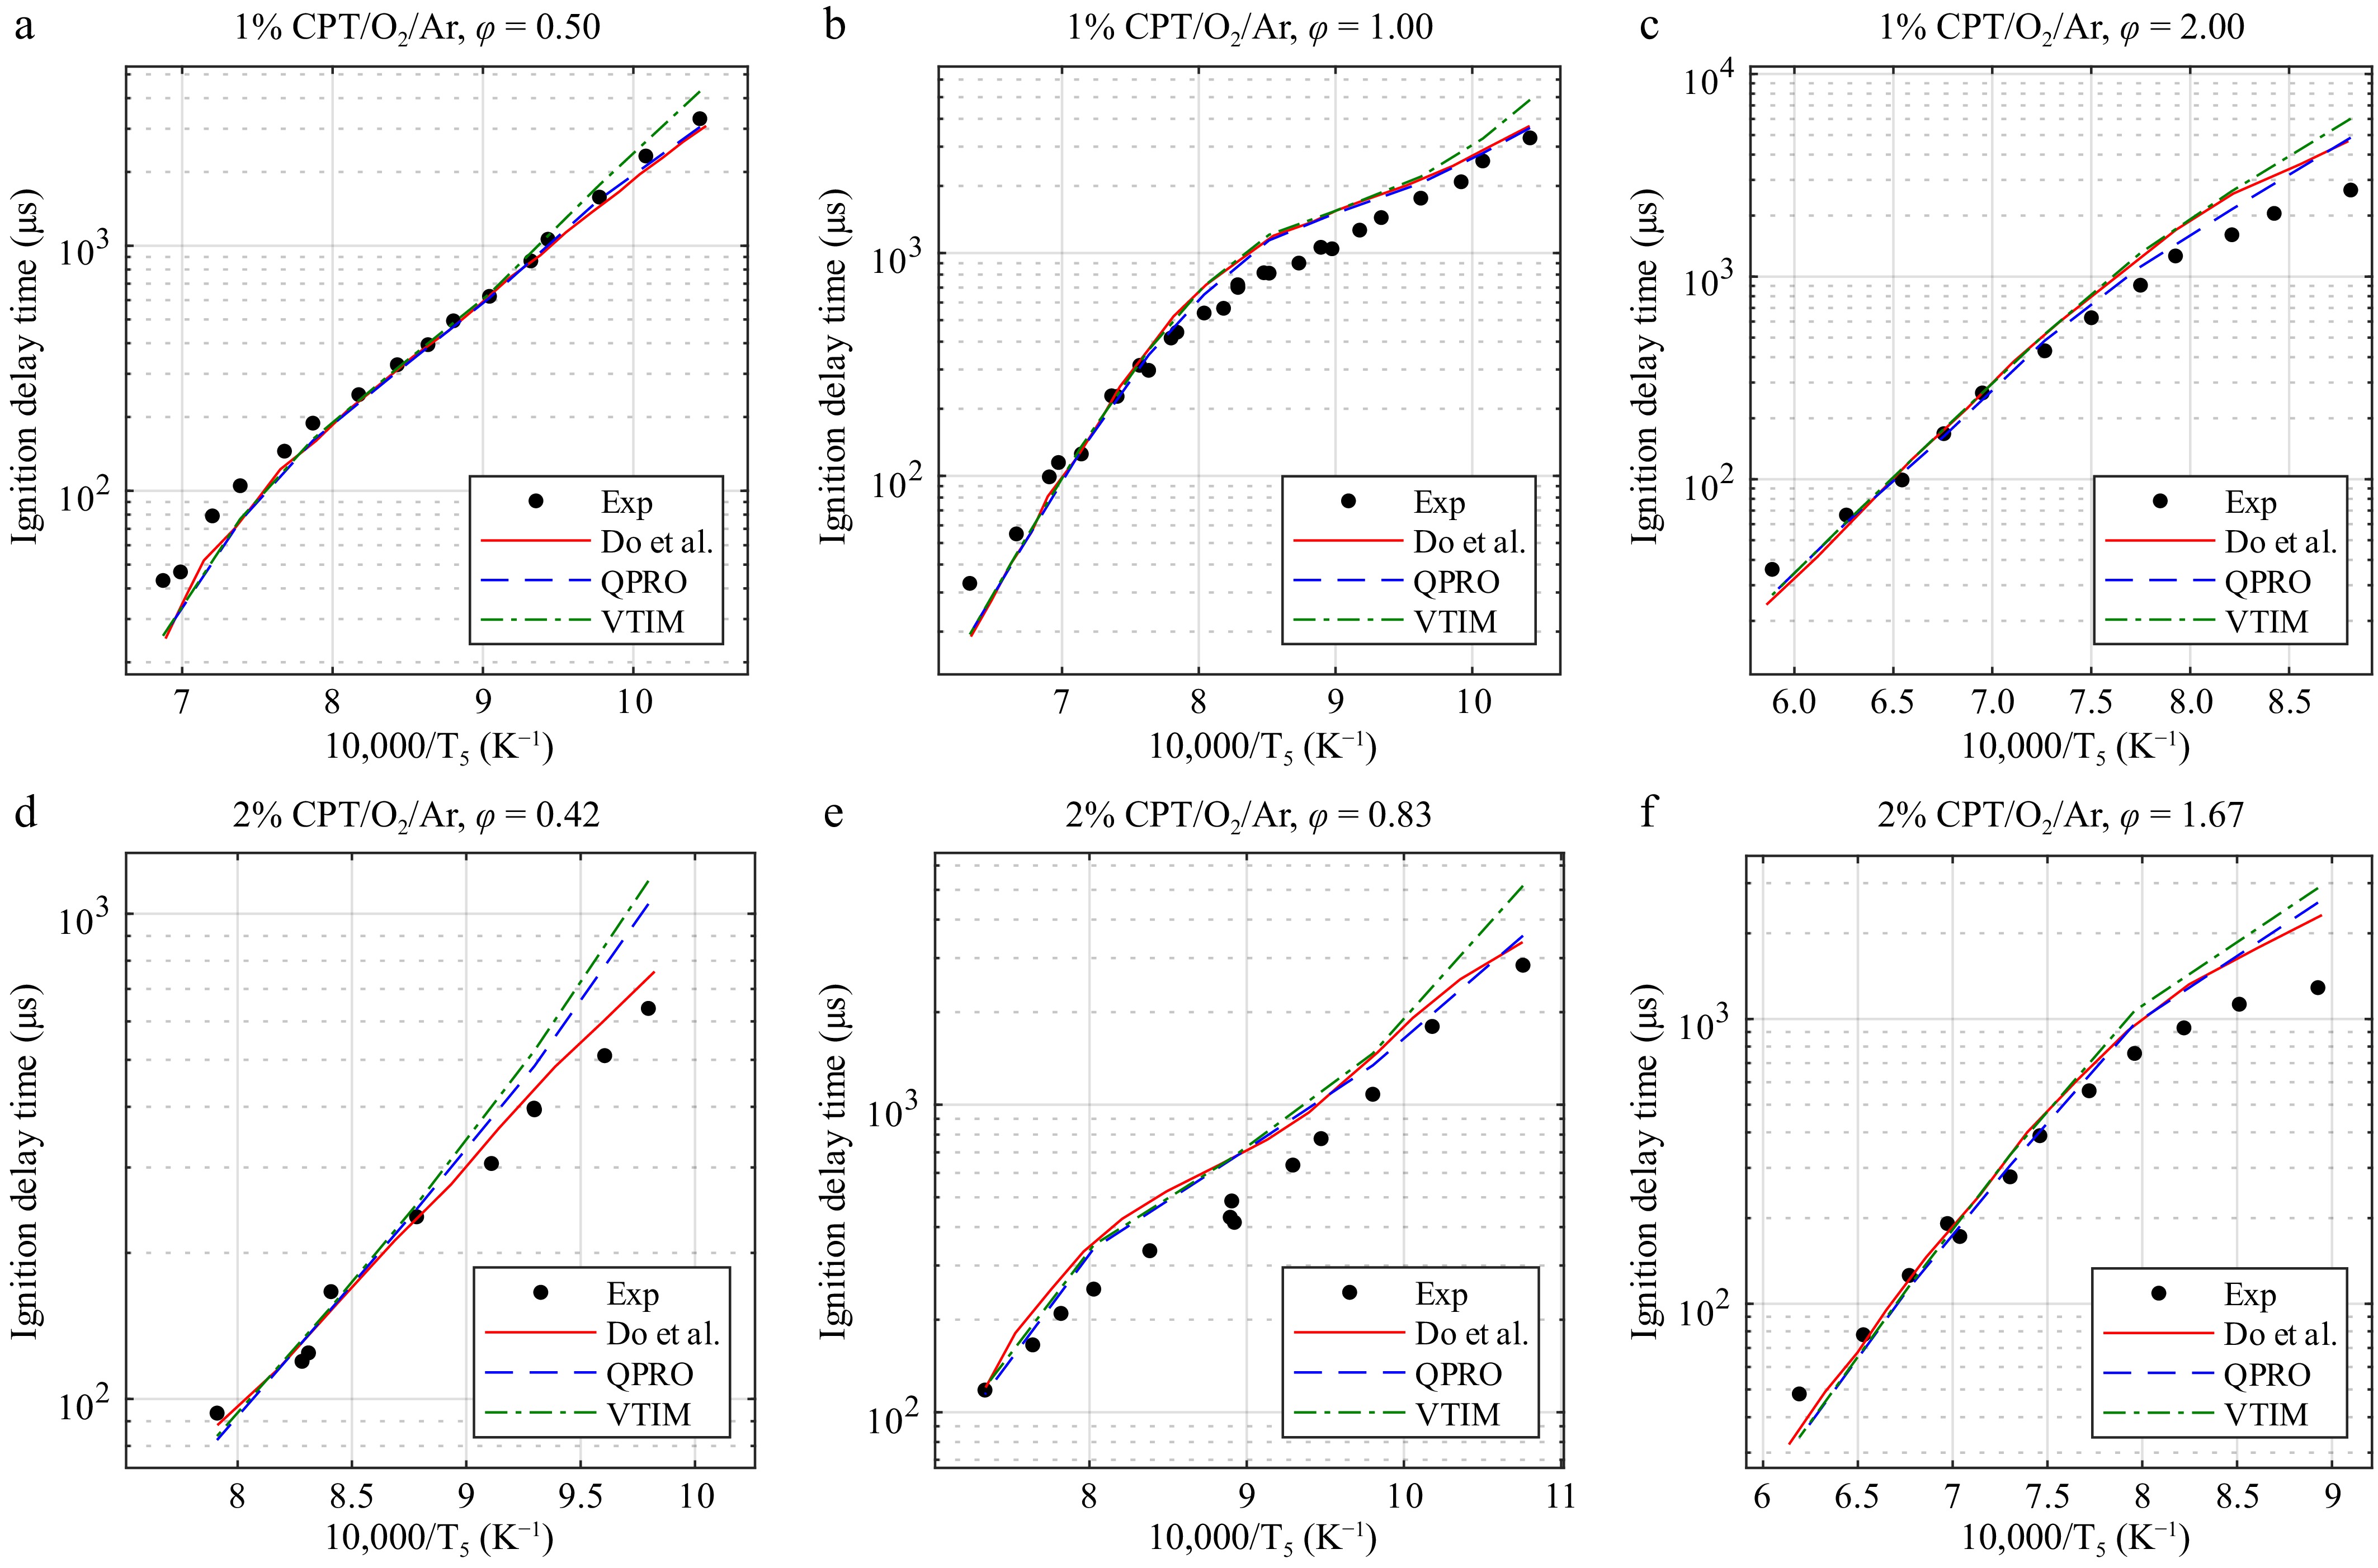
Figure 6.
Ignition delay times of cyclopentane at 20 bar and temperatures from 930 to 1,700 K in O2 and argon (CPT/O2/Ar) for equivalence ratios (φ) of (a) 0.50, (b) 1.00, and (c) 2.00 at 1% and (d) 0.42, (e) 0.83, and (f) 1.67 at 2% fuel concentrations and the combustion kinetic model of cyclopentane with the ignition delay times computed by Do et al.[14], with the variable volume approach and the heat transfer approach. Exp, experimental data from Do et al.[14]. Lines, dashed lines, and dash-dot lines are the predicted ignition delay times.
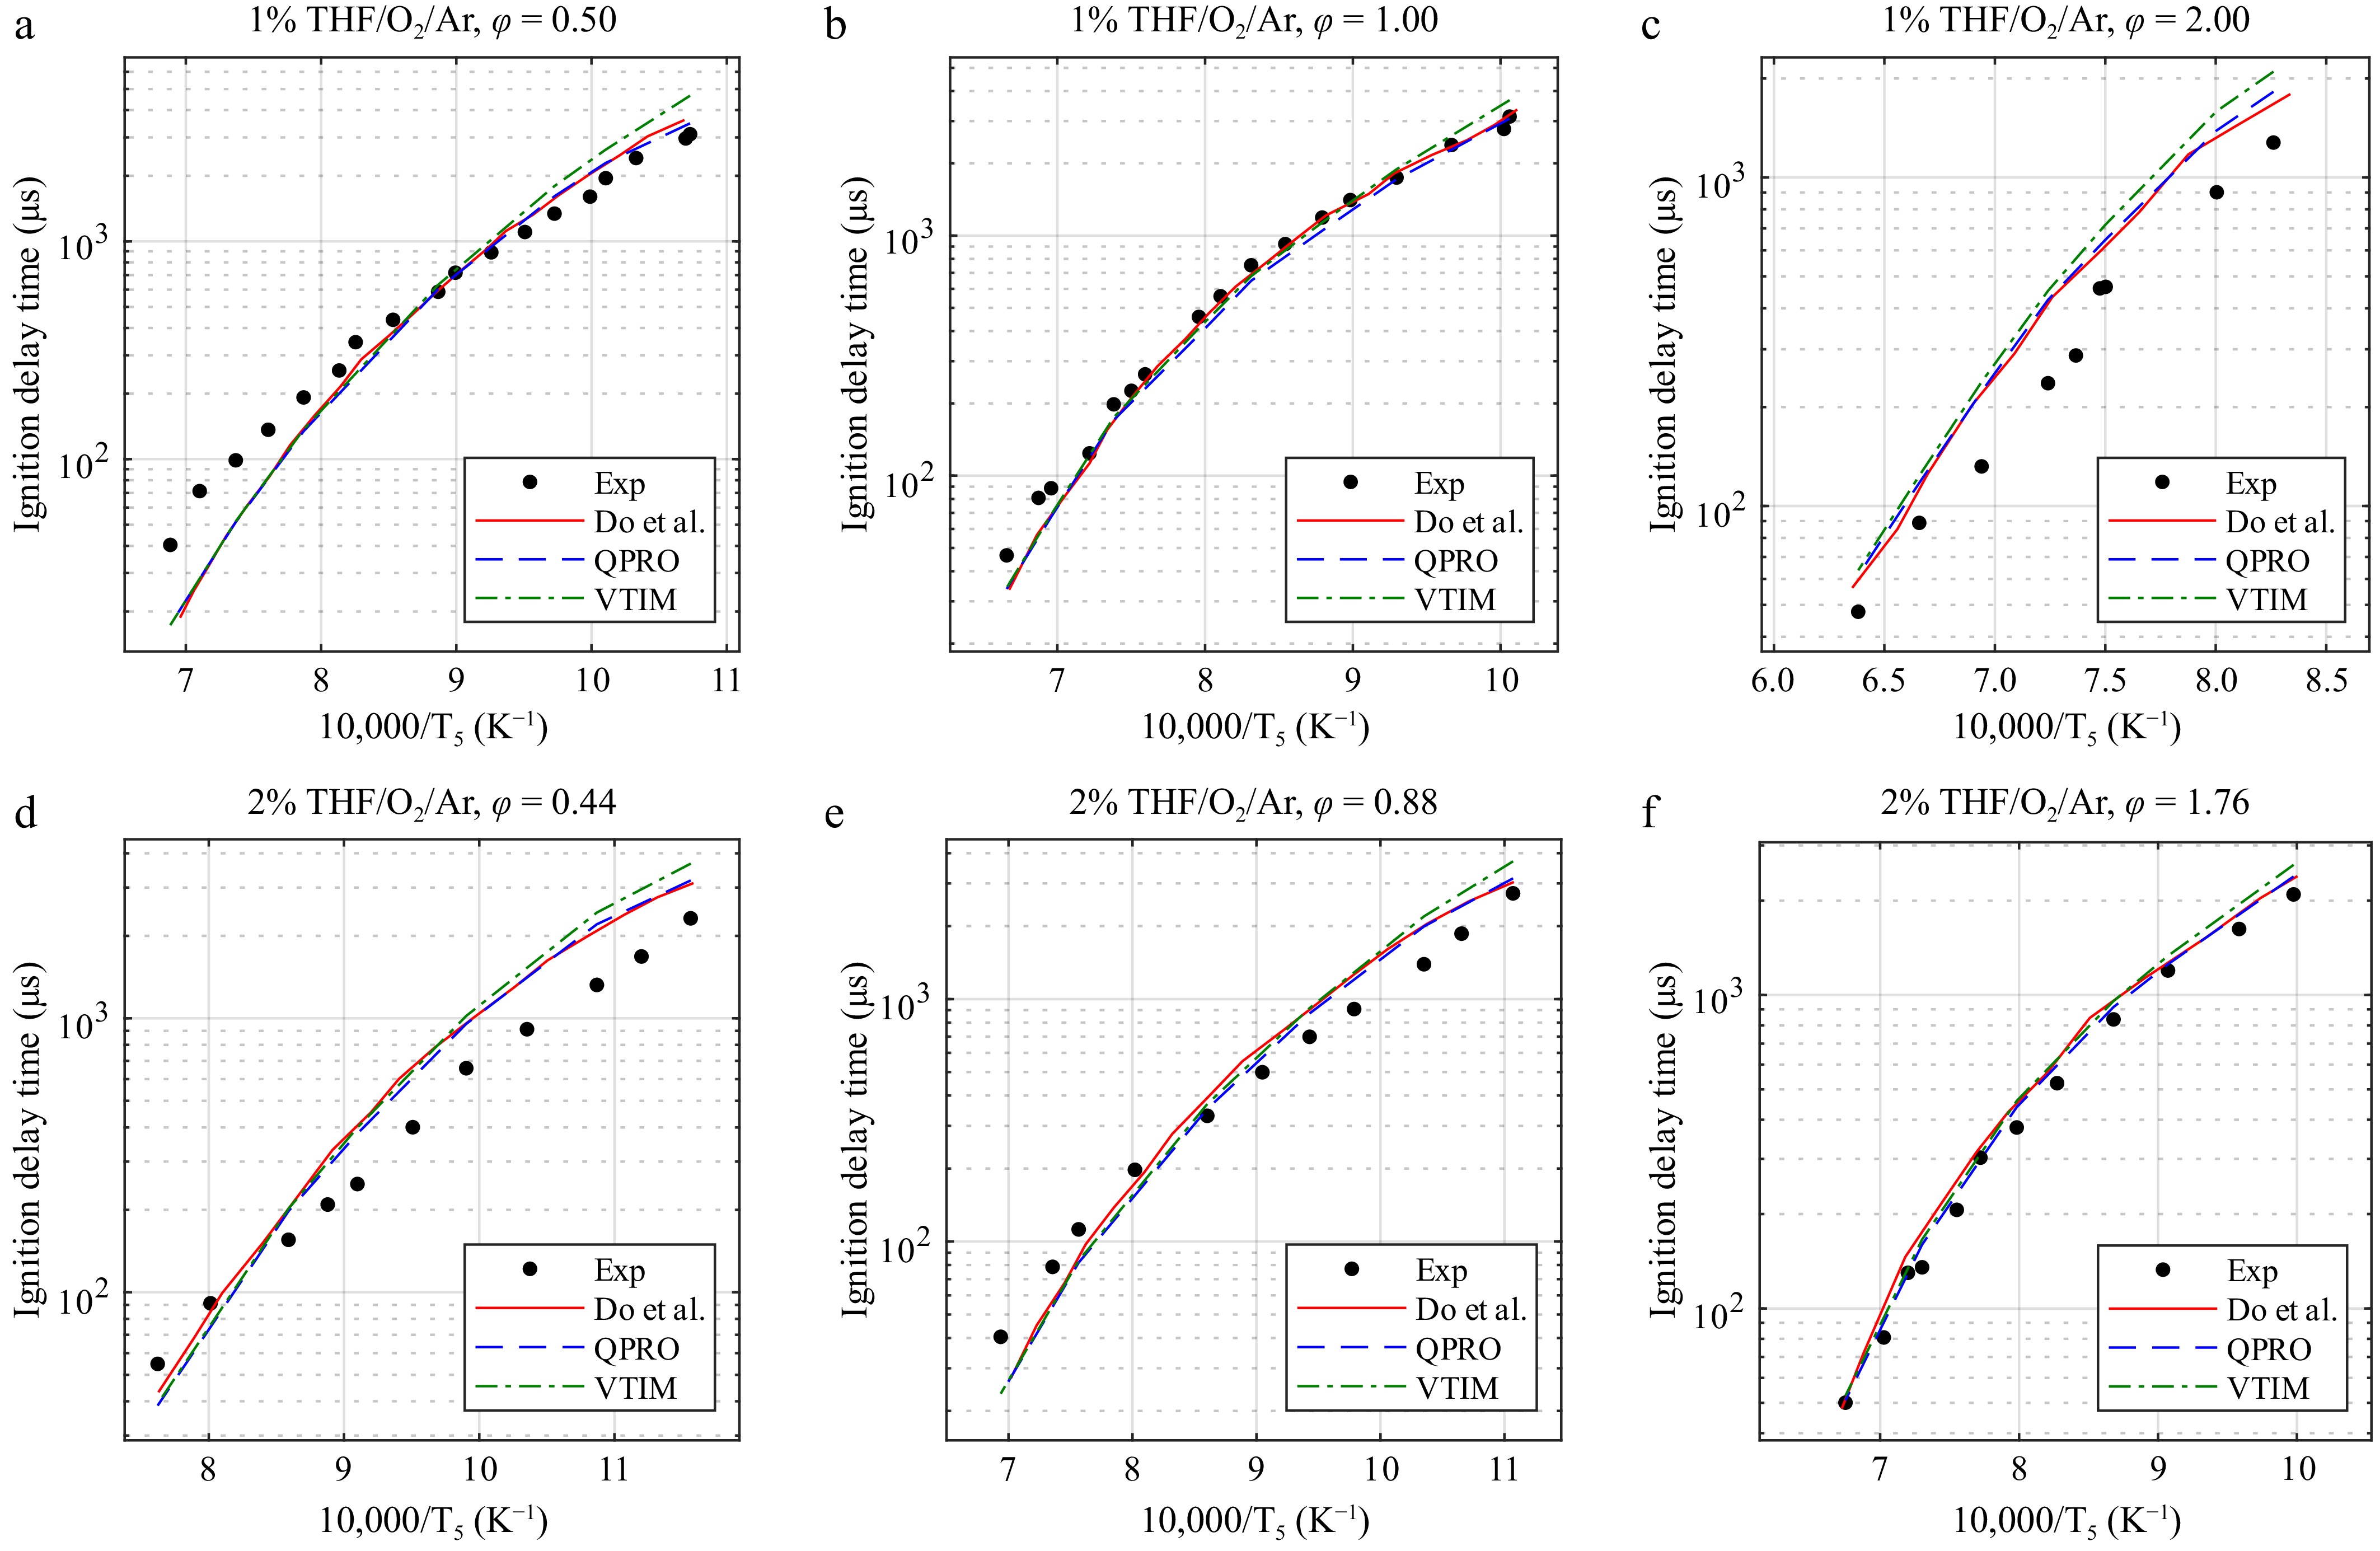
Figure 7.
Ignition delay times of tetrahydrofuran at 20 bar and temperatures from 865 to 1,570 K in O2 and argon (THF/O2/Ar) for equivalence ratios of (a) 0.5, (b) 1.0, and (c) 2.0 at 1% and (d) 0.44, (e) 0.88, and (f) 1.76 at 2% fuel concentrations and the combustion kinetic model of tetrahydrofuran with the ignition delay times computed by Do et al.[14], with the variable volume approach and the heat transfer approach. Exp, experimental data from Do et al.[14]. Lines, dashed lines, and dash-dot lines are the predicted ignition delay times.
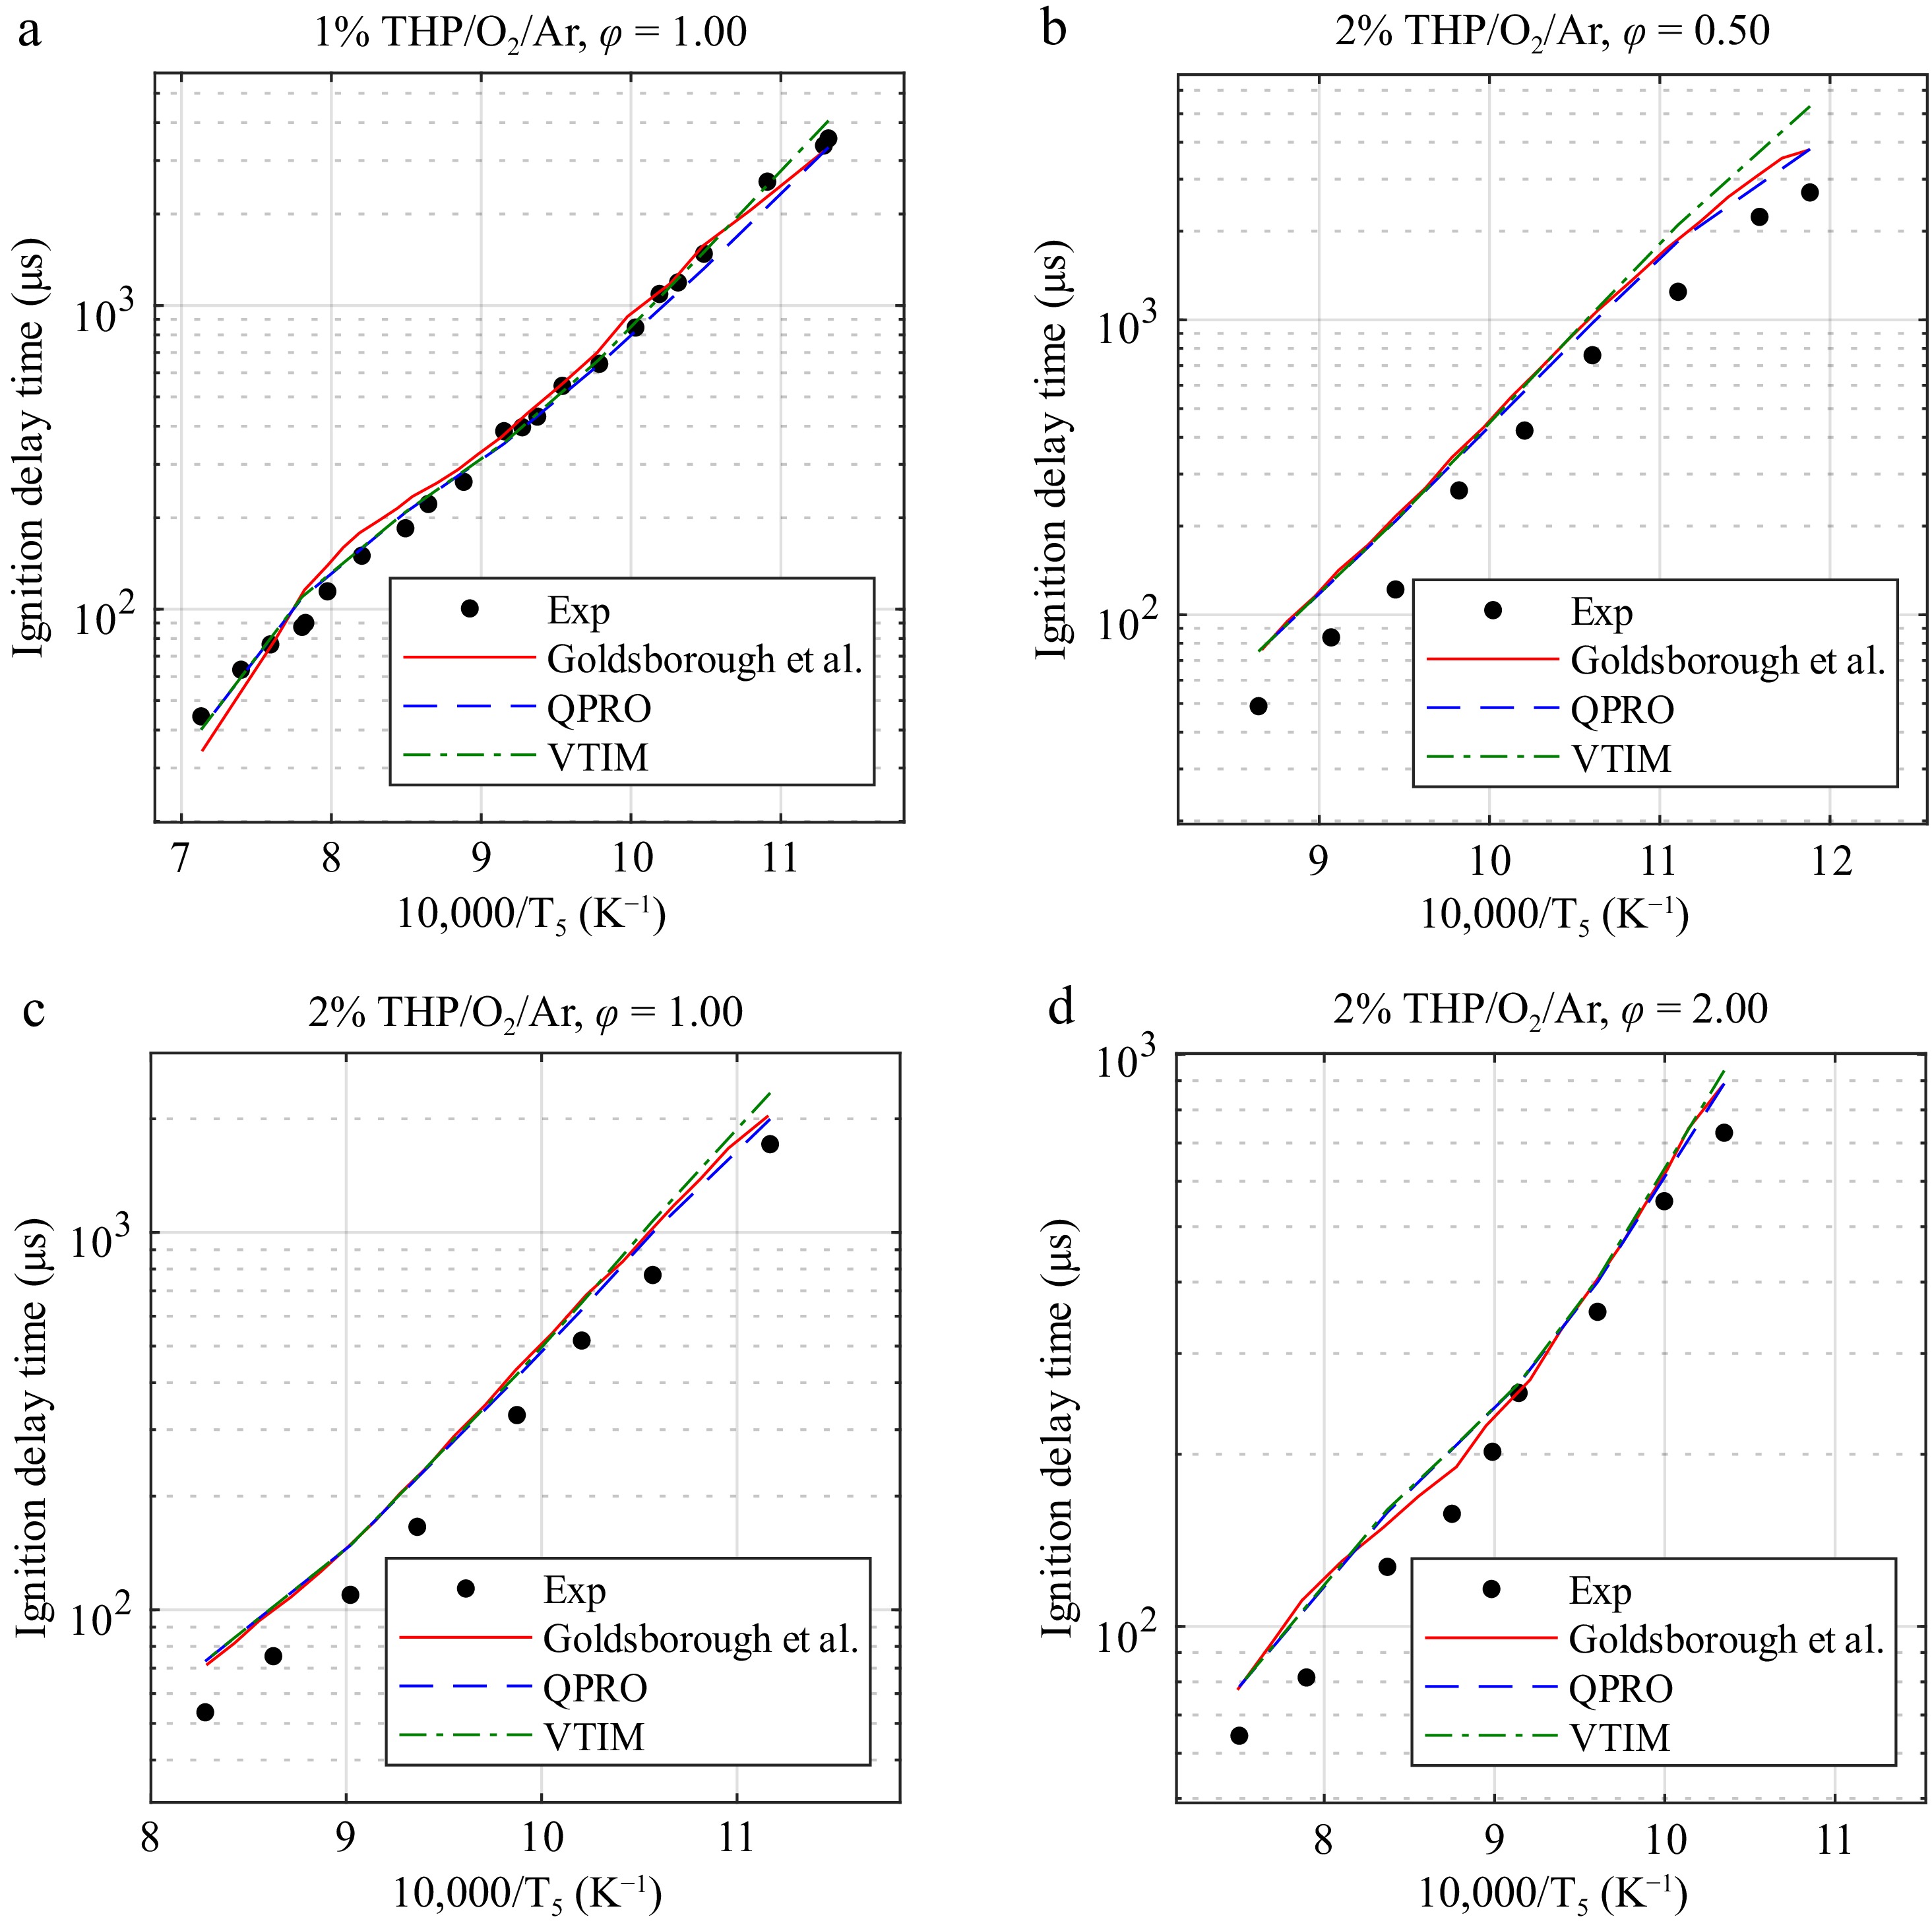
Figure 8.
Ignition delay times of pyrrolidine at 20 bar and temperatures ranging from 840 to 1,400 K in O2 and argon (THP/O2/Ar) for equivalence ratios of 0.5, 1.0, and 2.0 in fuel concentrations of 1% and 2% and temperatures ranging from 840 to 1,400 K and the combustion kinetic model of pyrrolidine with the ignition delay times computed by Goldsborough et al.[15], with the variable volume approach and the heat transfer approach. Exp, experimental data from Goldsborough et al.[15]. Lines, dashed lines, and dash-dot lines are the predicted ignition delay times.
Facility-related non-ideal effects in the shock tube involve several mechanisms of gas-dynamics that can be complex to consider in a model. However, if they could be compensated for by using a simple polytropic process, predicted ignition delay times would then only rely on the reaction's chemistry, putting physical phenomena aside.
Petersen et al.[3] observed the relationship between the variations in temperature and pressure behind the reflected shock wave in a shock tube. Despite the scatter between the experimental results and the isentropic assumption model, there was satisfactory agreement regarding the fact that the rise in pressure could be similar to an isentropic compression.
The main differences between the VTIM and QPRO methods appear at low temperatures, especially with ignition delay times above 1,000 µs, where the relation between the rise in pressure and the temperature change has a strong impact on the predicted ignition delay time. Regardless of the equivalence ratio or the concentration of the fuel in the mixture, considering the rise in pressure for short ignition delay times below 500 µs becomes unnecessary, as the overall increases in pressure and temperature are not significant enough to generate noticeable differences.
The predicted ignition delay times for THF reveal the same observations as those of CPT, showing that both methods operate efficiently for long ignition delay times above 1,000 µs. The methods are unable to compensate for the remaining differences between the predicted and the measured delay times. The differences observed for concentrations of 1% and 2% for the respective equivalence ratios of 2 and 0.44 may be caused by the mechanism itself.
For pyrrolidine, the same observations as for THF and CPT can be made here, with a significant correction in the predicted ignition delay time for low temperatures. The kinetic mechanism used for the predicted ignition delay times using both the VTIM and QPRO methods was provided in Goldsborough's work.
Two other reactive mixtures of pentan-2-ol and methyl-3-hexenoate with O2 in argon were also compared (see Supplementary Fig. S16). Because of the short ignition delay times (below 1,000 µs for all the tested cases), the methods have shown limits impacting the ignition delay times. The relative error between the tested models and the experimental results are available in Section S8 of the Supplementary Material and emphasize the limitations of both methods in approaching the experimental results of the kinetic model, especially at high temperatures, where no significant change in pressure and temperature can be found to improve the model by any method for short durations below 1 ms, as seen in Supplementary Fig. S15, with ignition delay times of roughly 300 μs. Supplementary Figs S17–S19 relates to the combustion of THF, CPT, and THP and highlight the limitations of both the QPRO and VTIM methods at high temperatures and when the model already underpredicts the ignition delay times at any temperature range in our shock tube.
Overall, the model aims toward an increase in precision at lower temperatures by reproducing the non-ideal effects of the core gas behind the reflected shock wave in the model, in the transition area between shock tubes and rapid compression mechanisms from 825 to 1,200 K. Because of the very short ignition delay times (< 500 µs) at high temperatures, the chemical kinetic mechanism prevails to a point where the accounted pressure increase becomes negligible. Other phenomena related to the reactive mixture were not considered in this work. Thus, our numerical results found by using VTIM and QPRO methods are similar to those reported in the articles used for comparison. The remaining differences between the measured and predicted ignition delay times related to the chemical kinetic model were out of this study's scope.
The main goal was to reproduce a pressure trace that reflects the measured pressure trace in the shock tube to dissociate the effects of gas-dynamics as much as possible from the chemical kinetic mechanism. The importance of assumptions that reflect the real conditions occurring behind the reflected shock wave and the relation between the rise in pressure and the temperature change leads to non-negligible differences when comparing the results of VTIM and QPRO based on the same pressure trace, where the second one overpredicts the rise in temperature. The relation reported in Petersen's work[3] between the pressure and temperature behaves similarly to compression, and remains as the most probable one that is used in chemical kinetic studies. Using this assumption as well as the pressure traces from nonreactive mixtures provides a simple and accurate solution to the oxidation chemical kinetics of biofuels for low and intermediate temperatures at high pressure while considering the facility-related non-idealities of shock tubes.
-
In this work, the non-ideal effects of pressure on ignition delay times were investigated in DRIVE's high-pressure shock tube at 20 bar. A wide range of operating conditions with inert O2/Ar mixtures were tested with different initial temperatures in the driven section (40–80 °C), concentrations of O2 (0%–25% O2) in argon, and reflected shock wave temperatures (800–1,800 K). The experimental results revealed a negligible dependence between the rise in pressure and the initial temperature for highly diluted concentrations of O2 (< 10%); the pressure gradients, however, started deviating at a concentration of 25%.
The reproduction of the non-ideal rise in pressure in kinetic models was discussed and updated regarding the use of non-reactive pressure traces to avoid considering the preignition energy release in the correction method. Moreover, the use of instantaneous pressure gradients showed better matching with the experimental data compared with the average one. This work promotes use of the measured non-reactive pressure trace as a way to account for non-ideal effects, improving the prediction of the pressure trace prior to combustion and the ignition delay time of the reactive mixture in the models. Two methods were tested by considering a constant internal energy and variable volume for the first one, and a constant volume and variable internal energy for the second one. Their impacts were evaluated and compared for biofuels studied in previous works in the same shock tube, and the methodology proposed here improved the predictions of ignition delay times and the evolution of pressure at low temperatures. This zone is the transition working range of shock tubes and rapid compression machines. At high and intermediate temperatures, both methods show similar results to the chemical reaction process that underlies the physical pressure variations. Overall, the QPRO method predicted shorter ignition delay times than the VTIM because of the nature of its assumptions, with results close to the experimental values, and both yielded promising results with operations that can be applied simply and in an inexpensive way. The choice of the method depends on the experimentally observed relation between the variations in pressure and temperature behind the reflected shock wave and should not be used to compensate for differences between the model and the experiment. The aim of both methods is to reproduce within the model the same temperature and pressure conditions that the core gas undergoes over time behind the reflected shock wave in the experiment.
Future work should aim at exploring the detailed mechanisms at the origin of the variations in pressure and should provide a robust theoretical basis for the proposed compensation of pressure traces.
Authors gratefully acknowledge funding received from The Bourgogne Franche-Comté Council and the Ministère Chargé de l'Enseignement Supérieur et de la Recherche.
-
The authors confirm their contributions to the paper as follows: study conception and design: Do HQ, Jouanguy J, Le Moyne L; data collection, analysis and interpretation of the results: Pinna L, Do HQ; draft manuscript preparation: Pinna L, Do HQ, Jouanguy J, Le Moyne L. All authors reviewed the results and approved the final version of the manuscript.
-
All data generated or analyzed during this study are included in this published article and its supplementary information files.
-
The authors declare that they have no conflict of interest.
- Supplementary Material Supplementary information to this study.
- Supplementary Fig. S5a
- Supplementary Fig. S6a
- Supplementary Fig. S7a
- Supplementary Fig. S8d)
- Supplementary Fig. S12)
- Supplementary Fig. S11
- Supplementary Fig. S9a
- Supplementary Fig. S10
- Supplementary Fig. S13
- Supplementary Fig. S14
- Supplementary Fig. S16)
- Supplementary Fig. S15
- Supplementary Figs S17
- S19
- Copyright: © 2026 by the author(s). Published by Maximum Academic Press, Fayetteville, GA. This article is an open access article distributed under Creative Commons Attribution License (CC BY 4.0), visit https://creativecommons.org/licenses/by/4.0/.
-
About this article
Cite this article
Pinna L, Do HQ, Jouanguy J, Le Moyne L. 2026. Non-reactive shock tube data-based model to reproduce non-ideal gas-dynamics effects to predict ignition delay times. Progress in Reaction Kinetics and Mechanism 51: e005 doi: 10.48130/prkm-0025-0030 

Non-reactive shock tube data-based model to reproduce non-ideal gas-dynamics effects to predict ignition delay times
- Received: 07 July 2025
- Revised: 14 November 2025
- Accepted: 25 November 2025
- Published online: 10 February 2026
Abstract: This study focuses on methods to correct the non-ideal behaviors of a gas following a reflected shock wave, as applied in chemical kinetic modeling. These non-ideal behaviors of gas were experimentally observed through an increase in the pressure (P5) of the inert argon gas behind the reflected shock wave. The impact of the initial temperature in the driven section (T1) and the concentration of a diatomic gas, O2, in argon on the P5 pressure trace is discussed. The experimental results show a negligible dependence between the rise in P5 pressure and both the initial temperature T1 (40–80 °C) and significant concentrations of O2, up to 25%. To account for facility-related non-ideal effects in chemical kinetic models, two methods found in the literature were analyzed, as well as the commonly used assumptions of constant volume or constant internal energy. Updated approaches are proposed to improve the prediction of both the ignition delay times and the evolution of pressure during fuel combustion by using pressure traces of argon as the test gas. The updated methods yielded promising results regardless of the fuel/O2/Ar mixtures for temperatures ranging from 825 to 1,700 K at 20 bar in a 50 mm internal diameter shock tube, especially below 1,200 K.