-
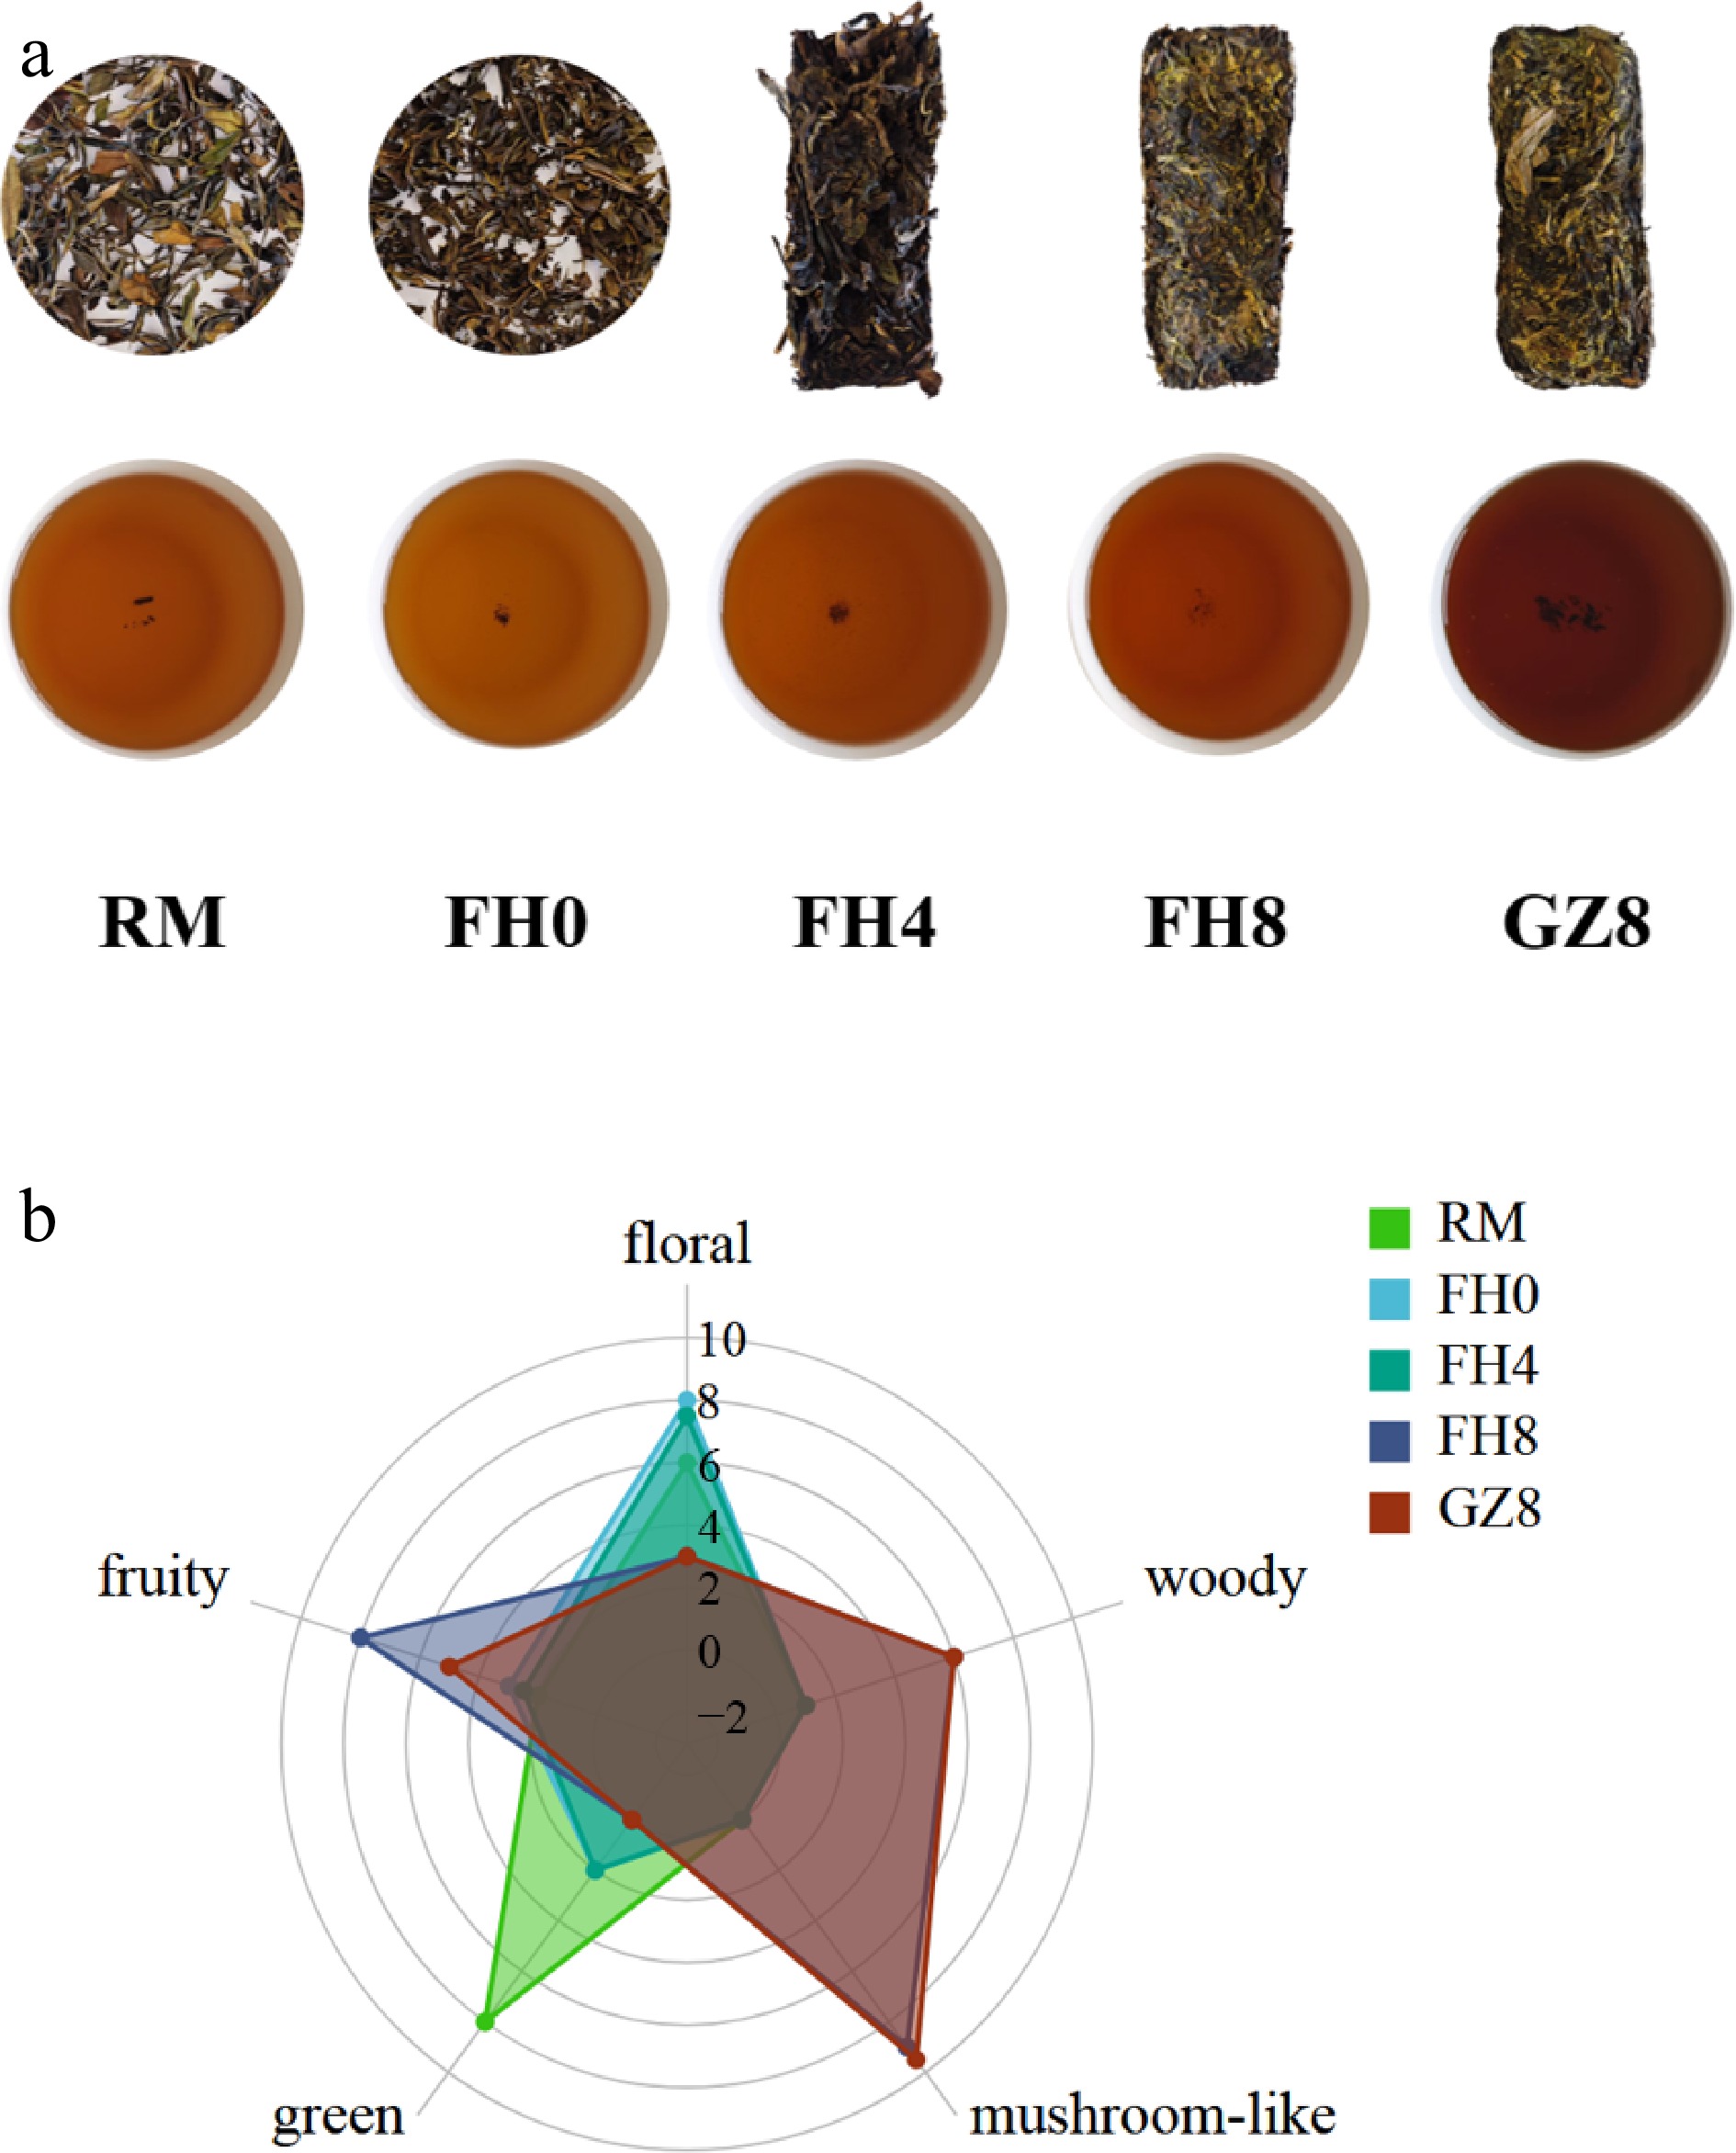
Figure 1.
Sensory evaluation and key volatile compound correlations. (a) GFWT samples and the corresponding tea infusion. (b) Radar map of aroma diversity of GFWT samples.
-
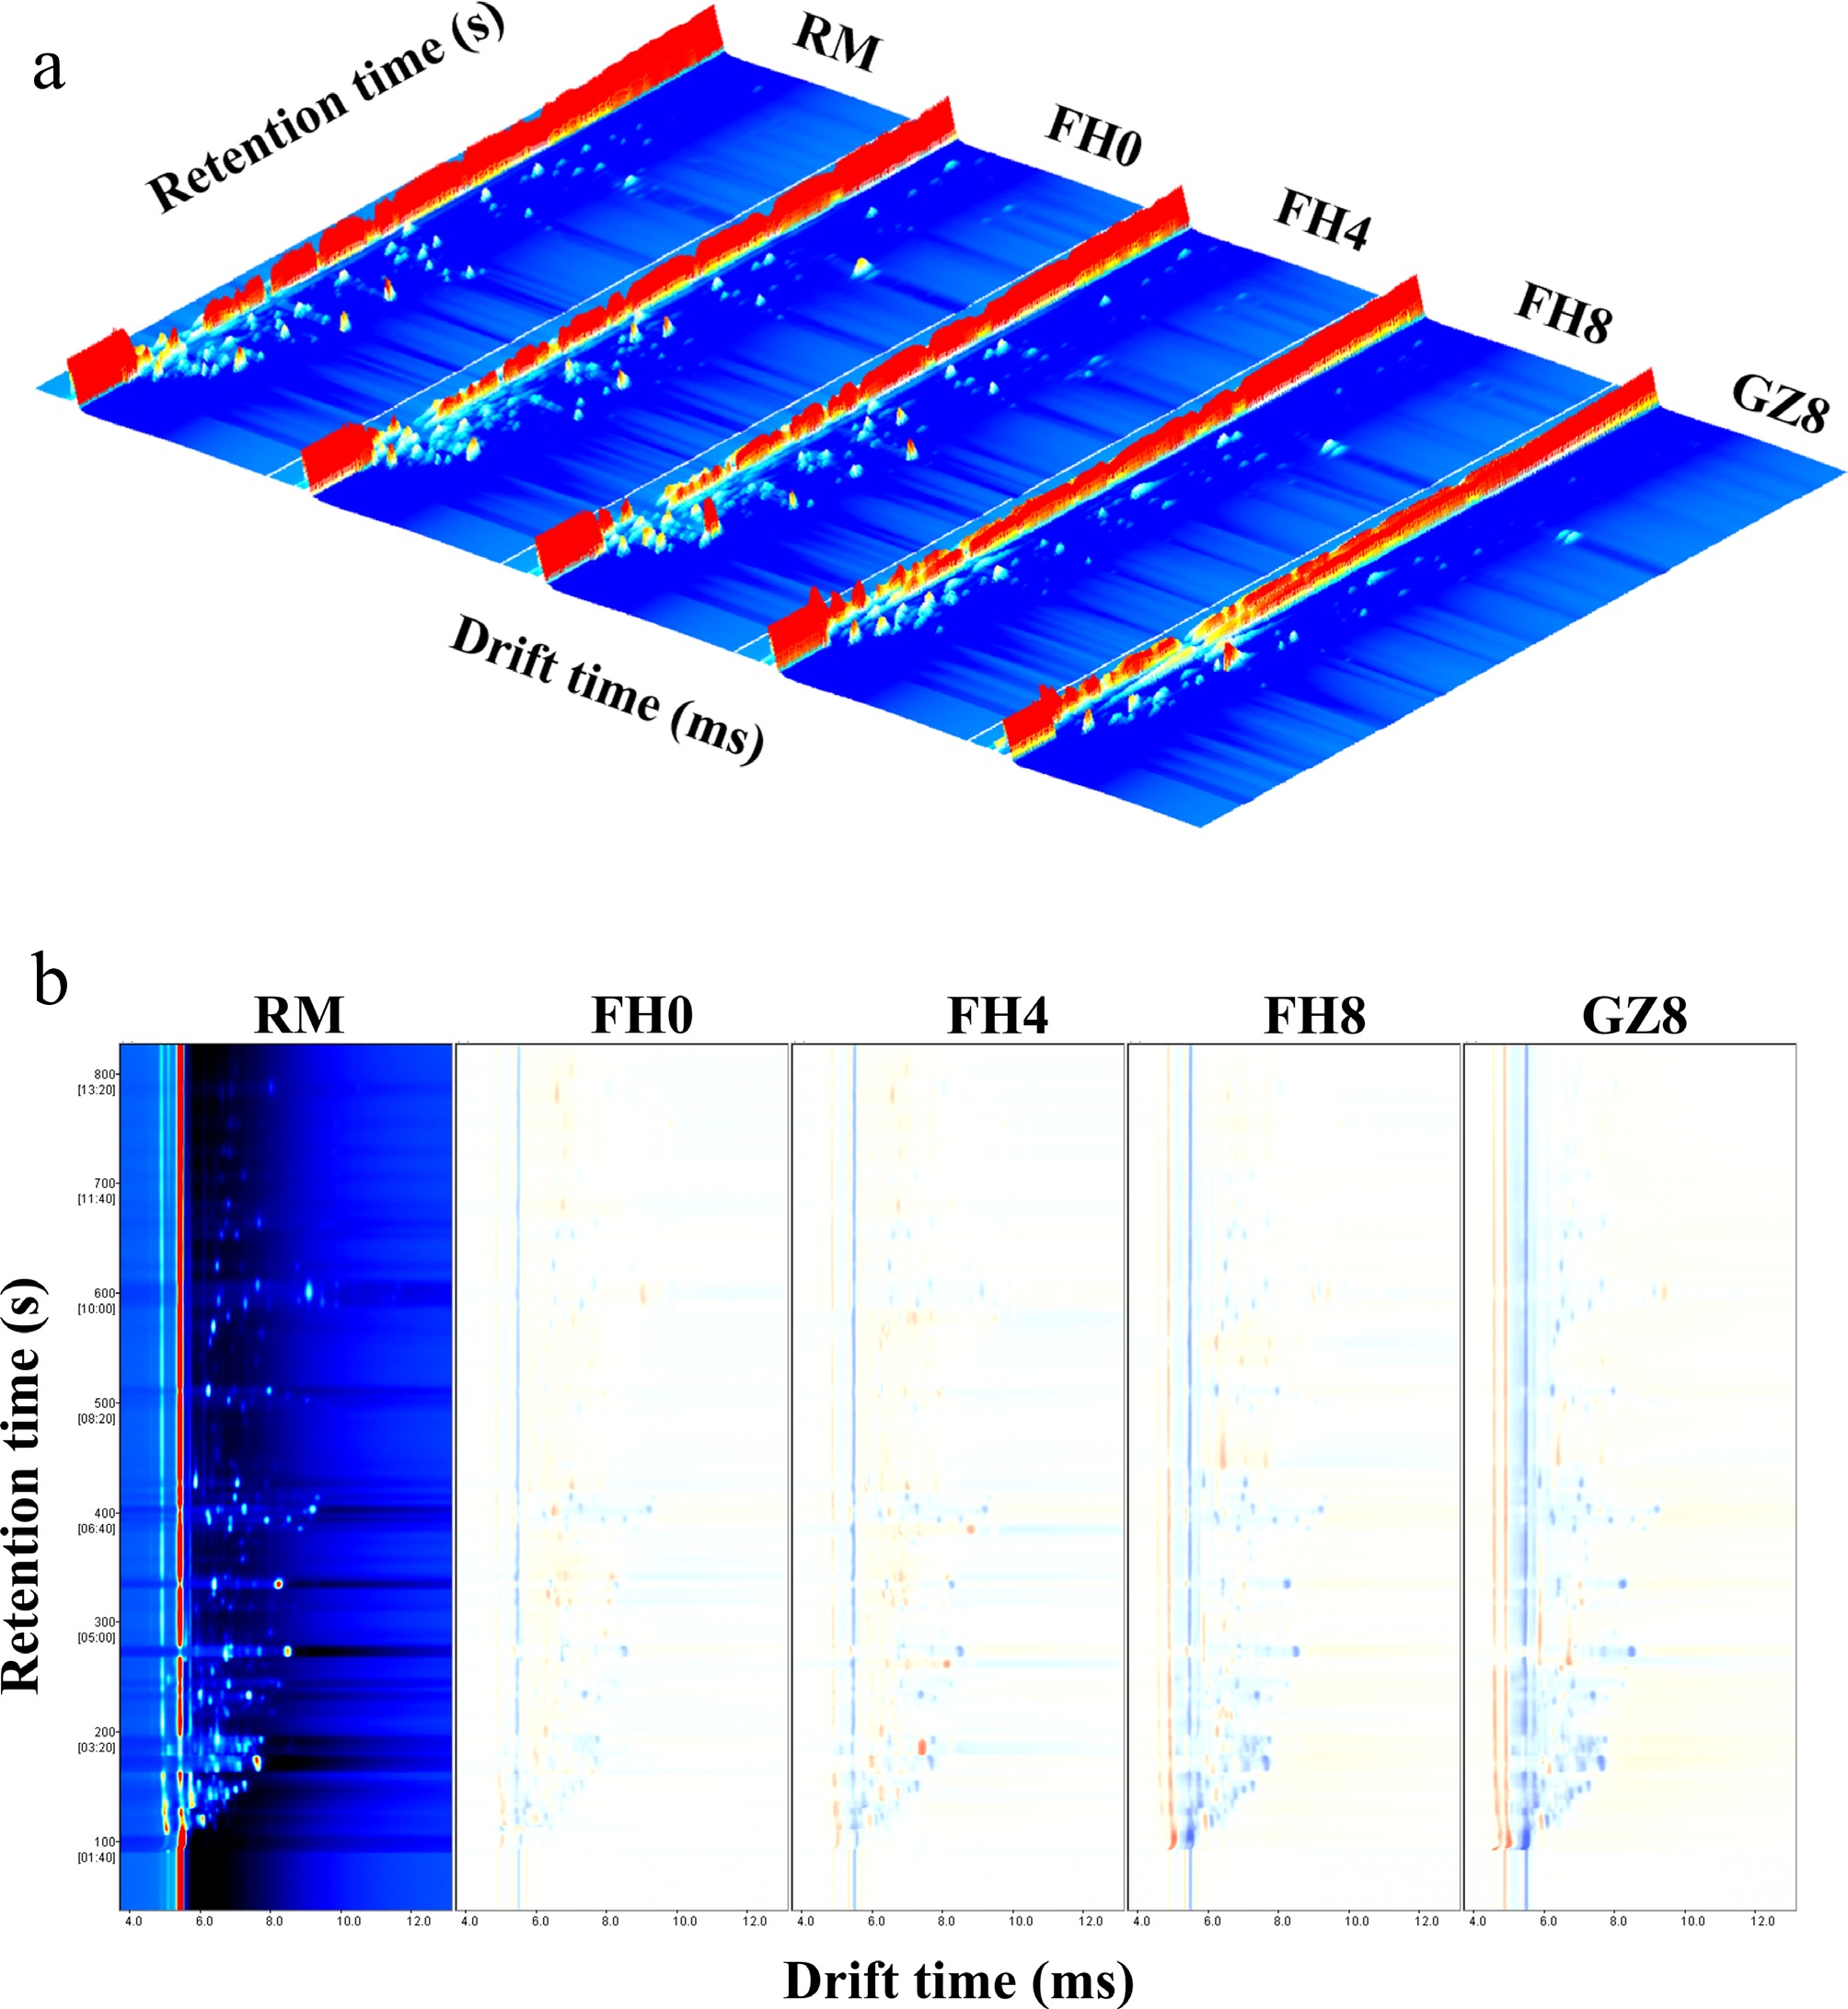
Figure 2.
GC-IMS topographic plots of the samples. (a) 3D-topographic plot; (b) identification diagram of volatile compounds. RM represents raw material; FH0 represents after-steaming; FH4 represents 4-day flowering; FH8 represents 8-day flowering; GZ8 represents after-drying.
-
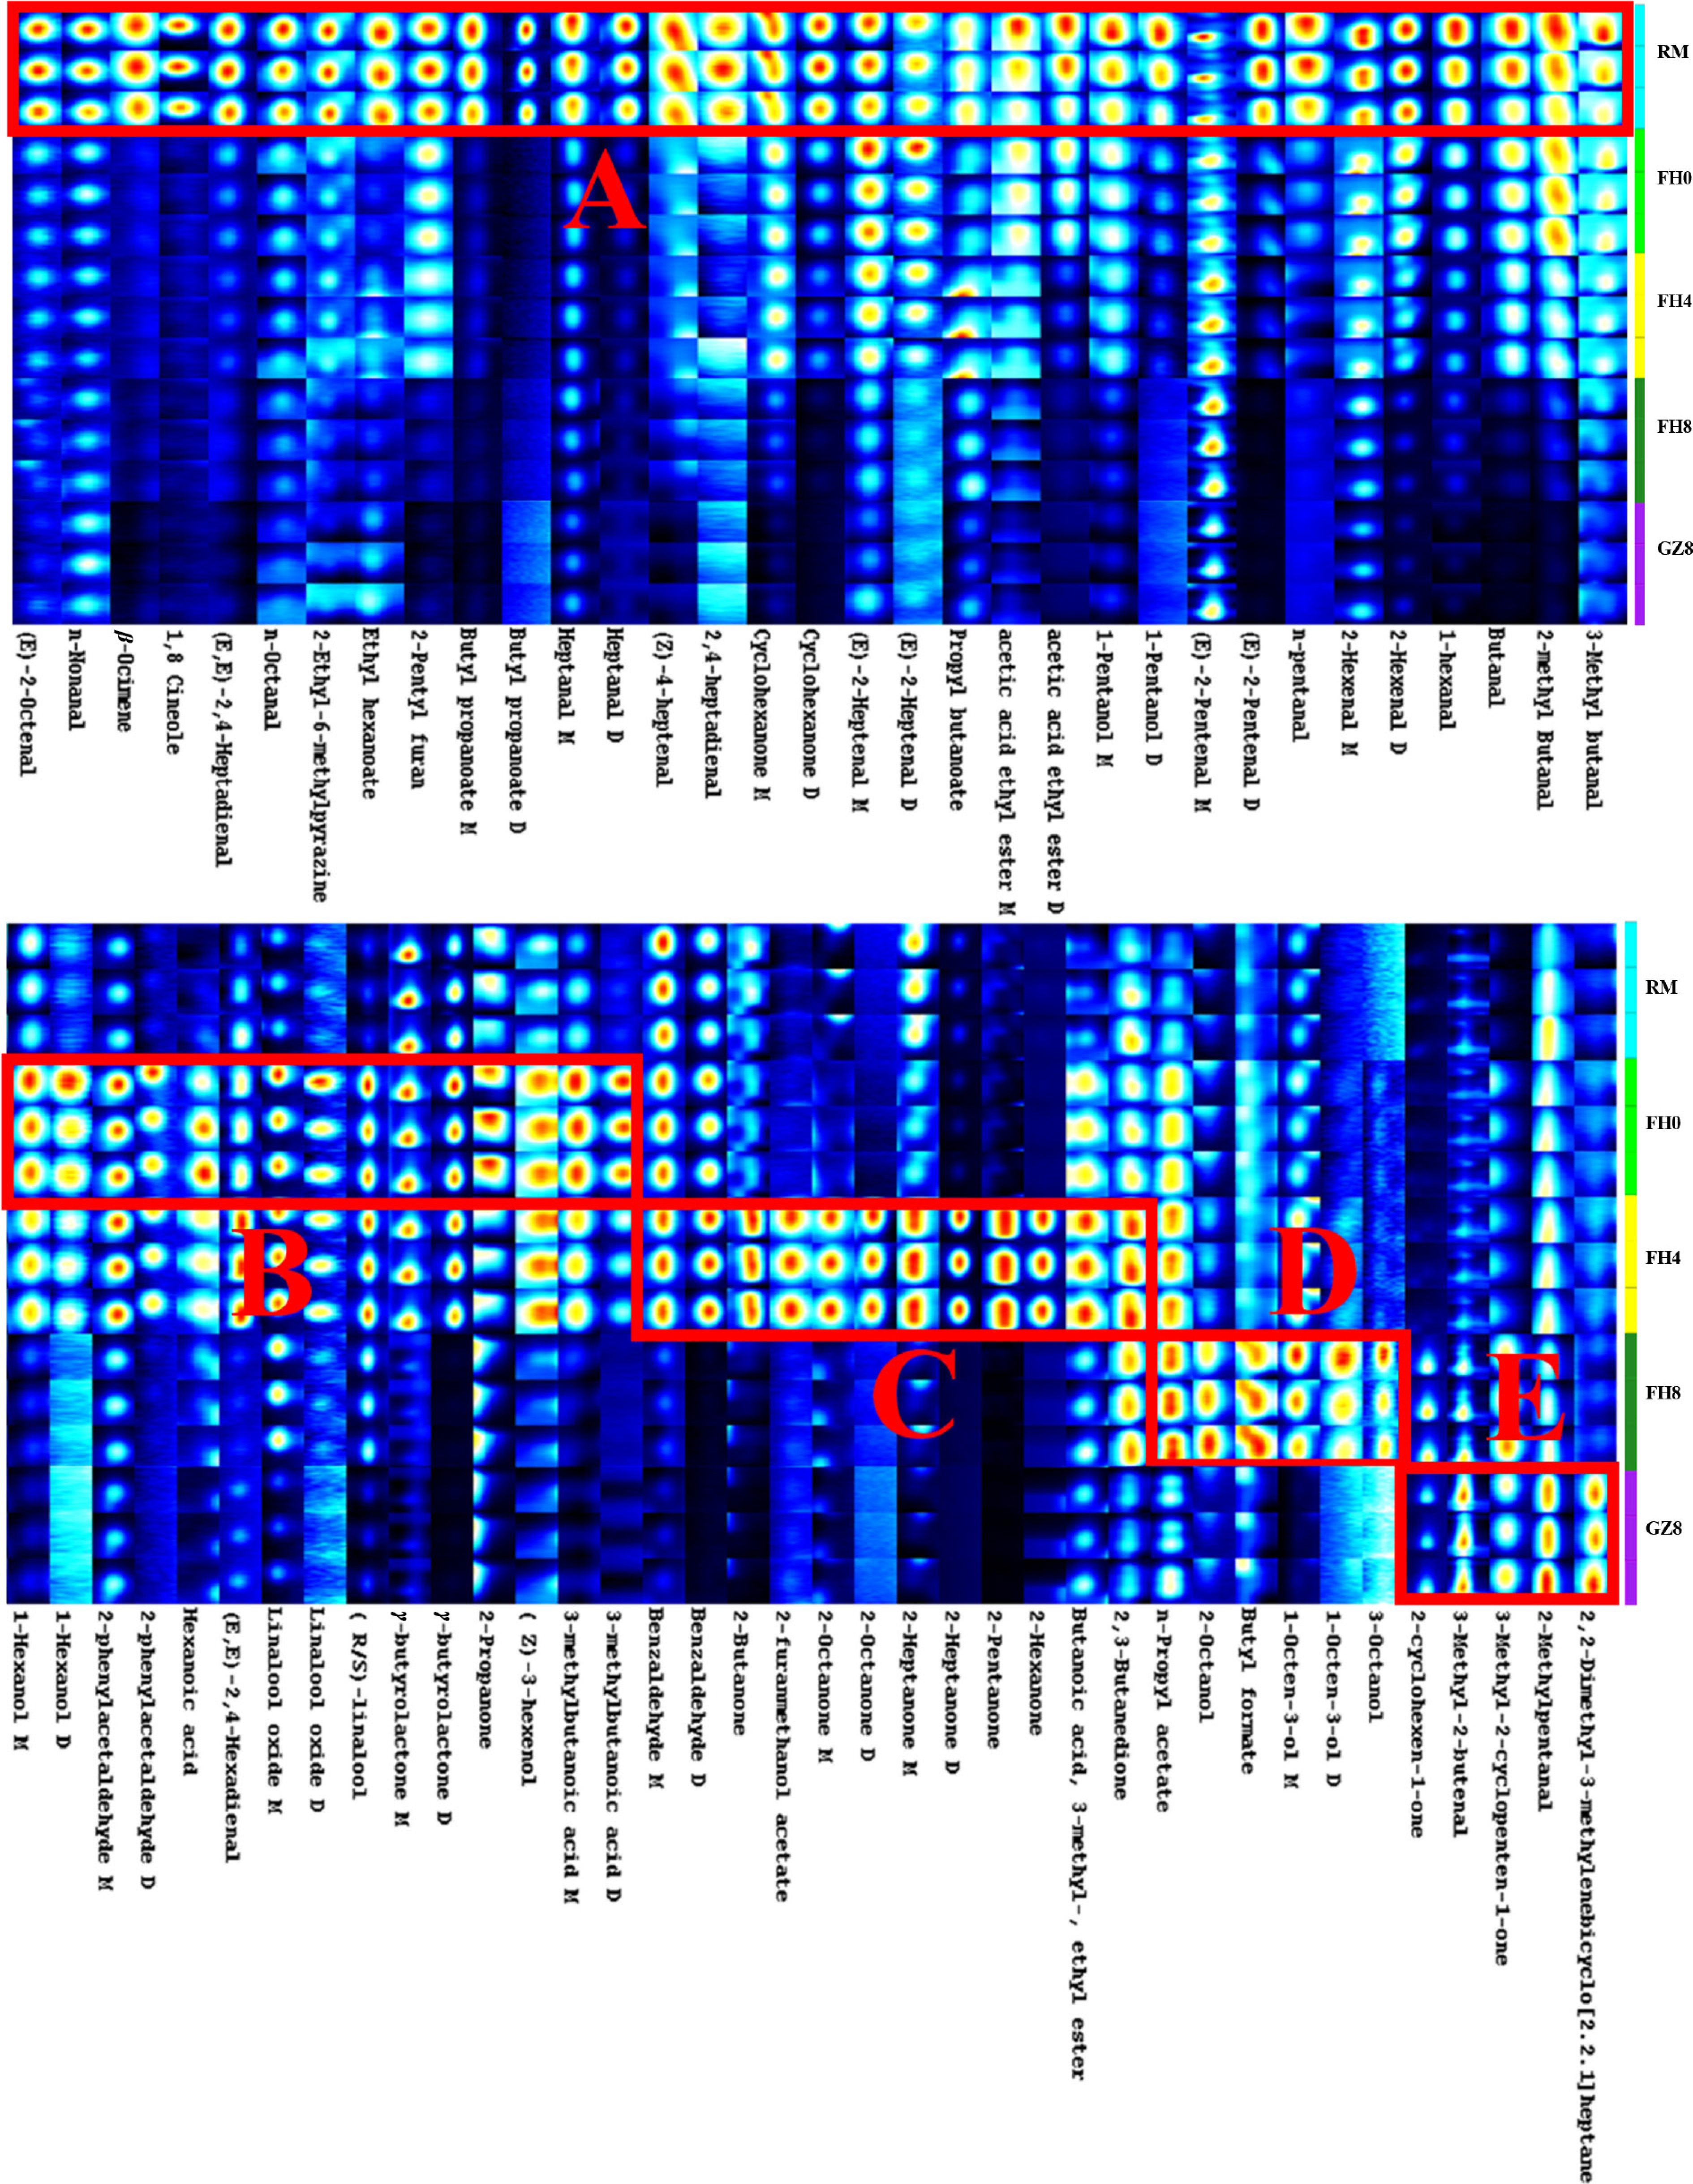
Figure 3.
Gallery plot fingerprint of different tea samples by GC-IMS. The compounds with higher content are framed in the colored boxes: A for RM, B for FH0, C for FH4, D for FH8, and E for GZ8.
-
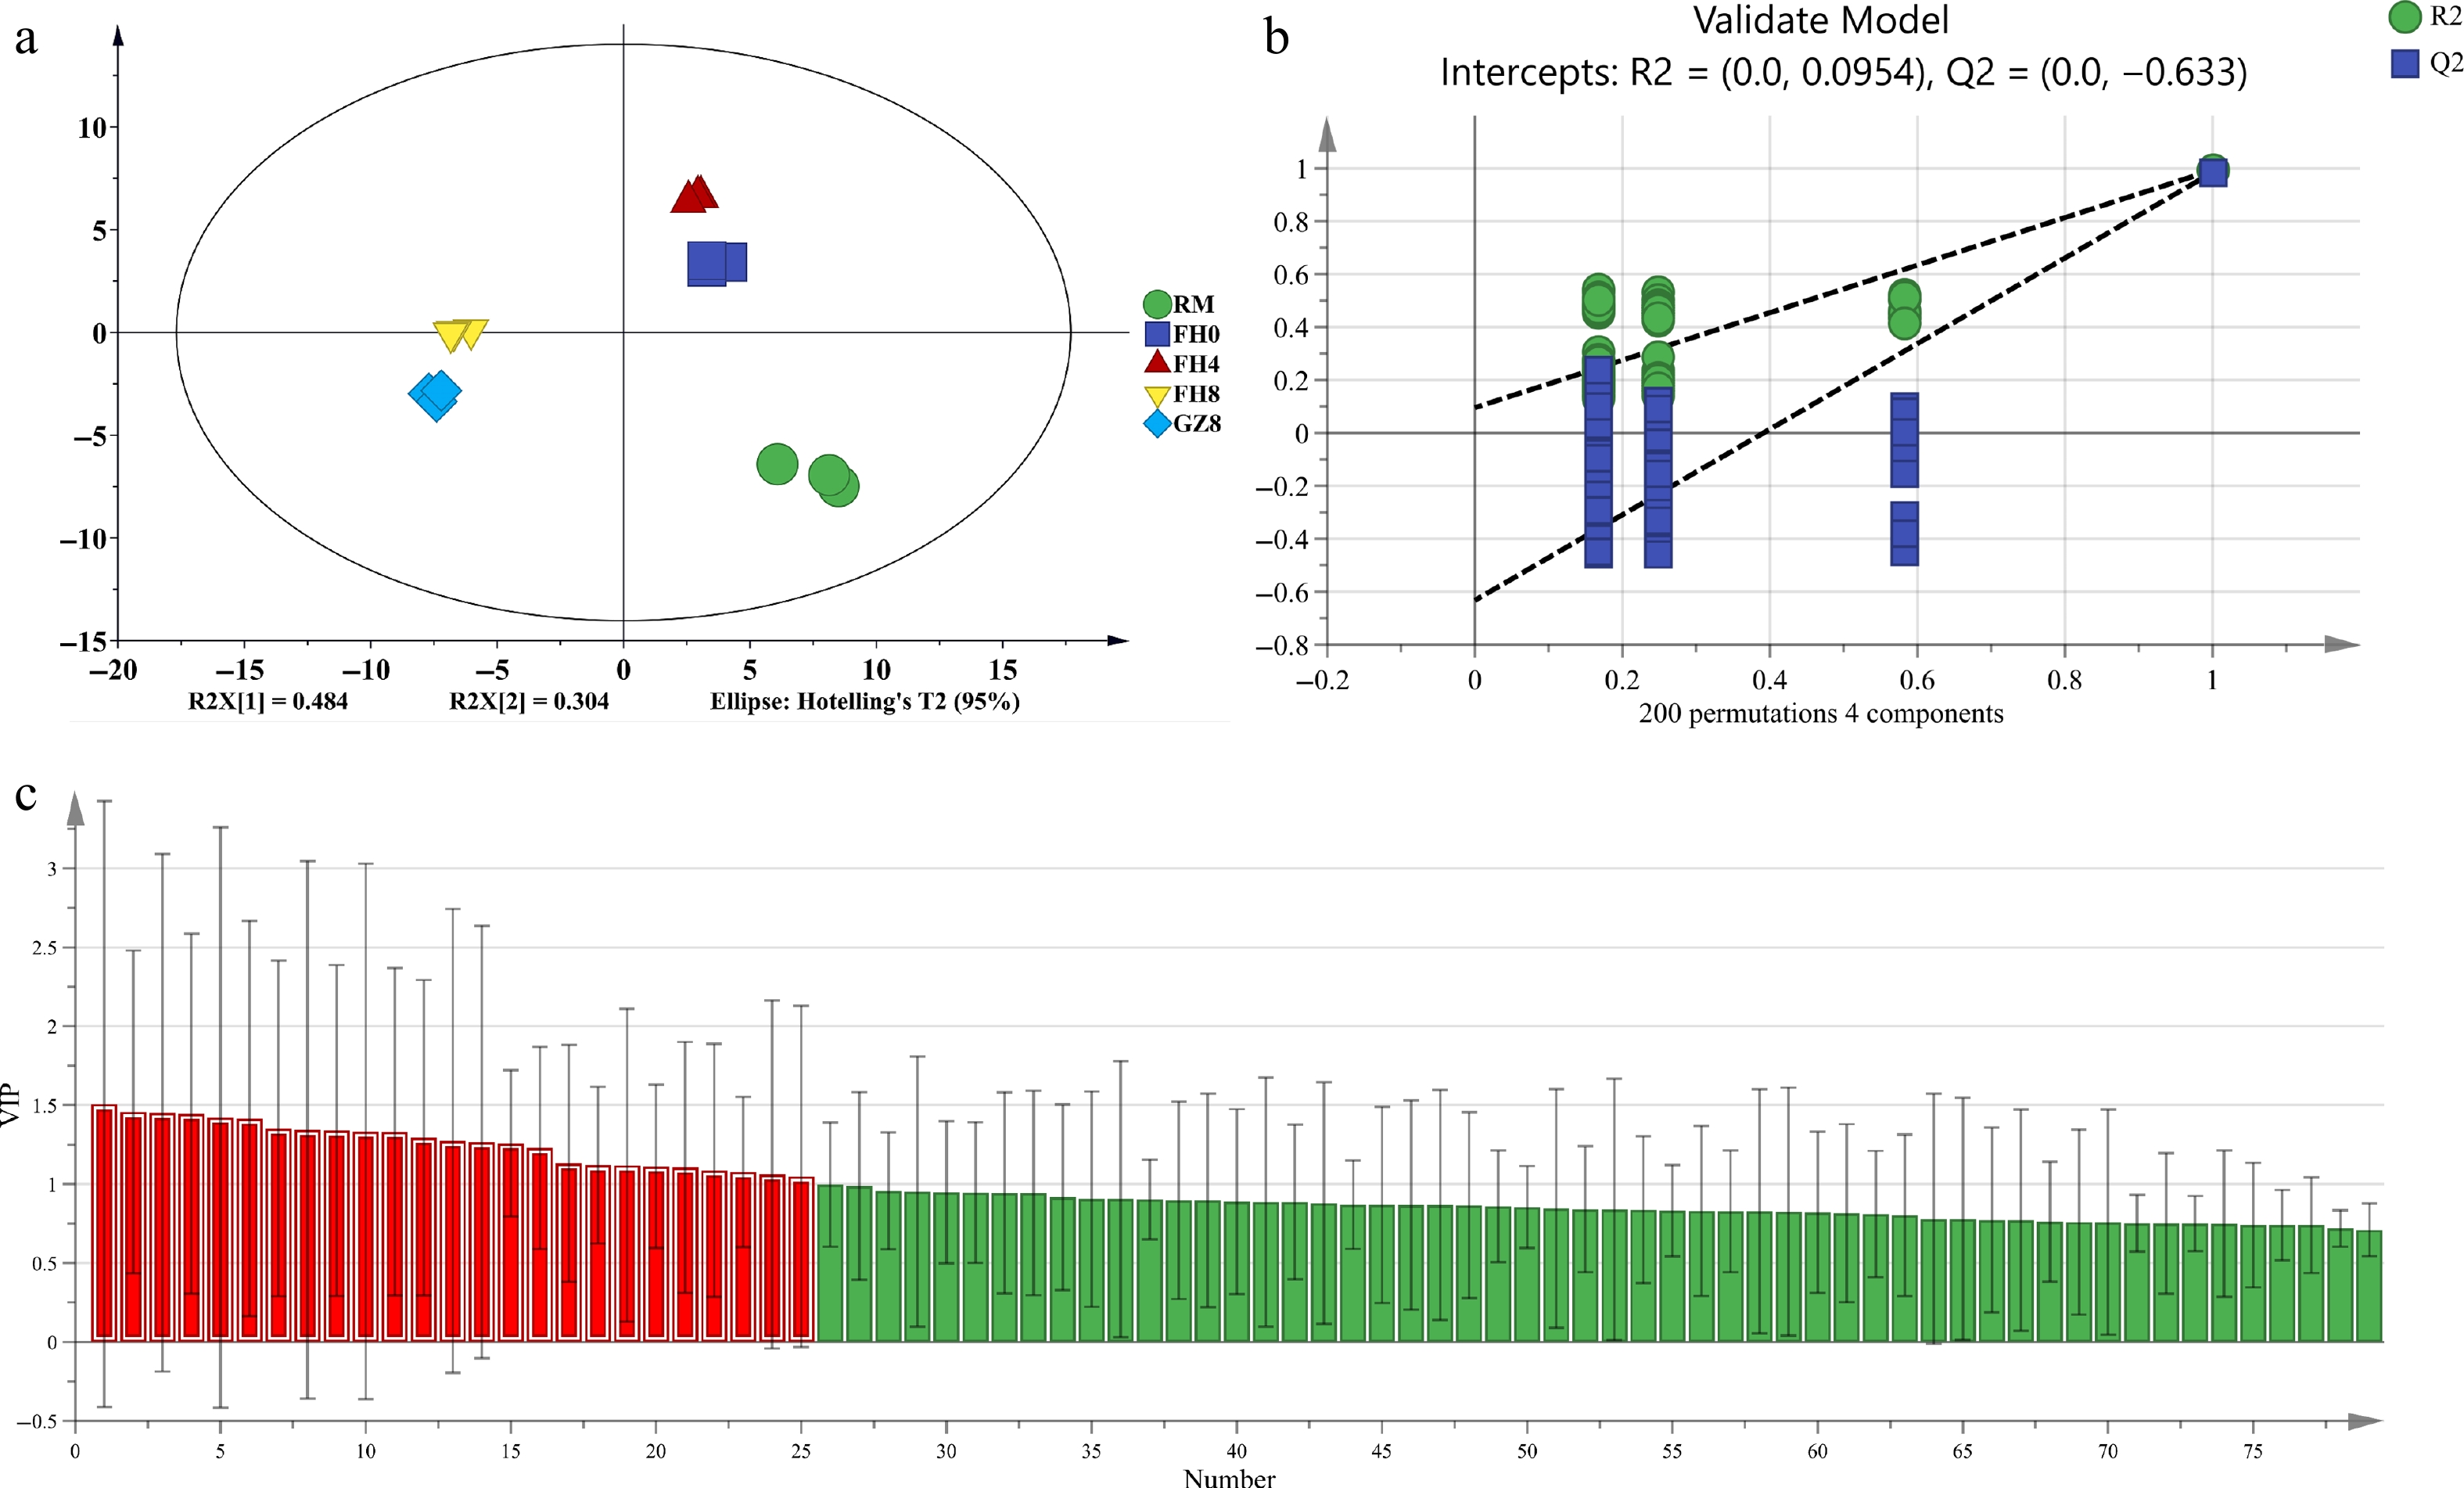
Figure 4.
The PLS-DA results of GFWT samples at five processing stages by GC-IMS. (a) Scores graph of PLS-DA (R2Y = 0.994, Q2 = 0.989). (b) Cross-validation graph by 200 permutation tests (R2 = 0.0954, Q2 = −0.633). (c) The red zone indicates the key compounds with VIP > 1.
-
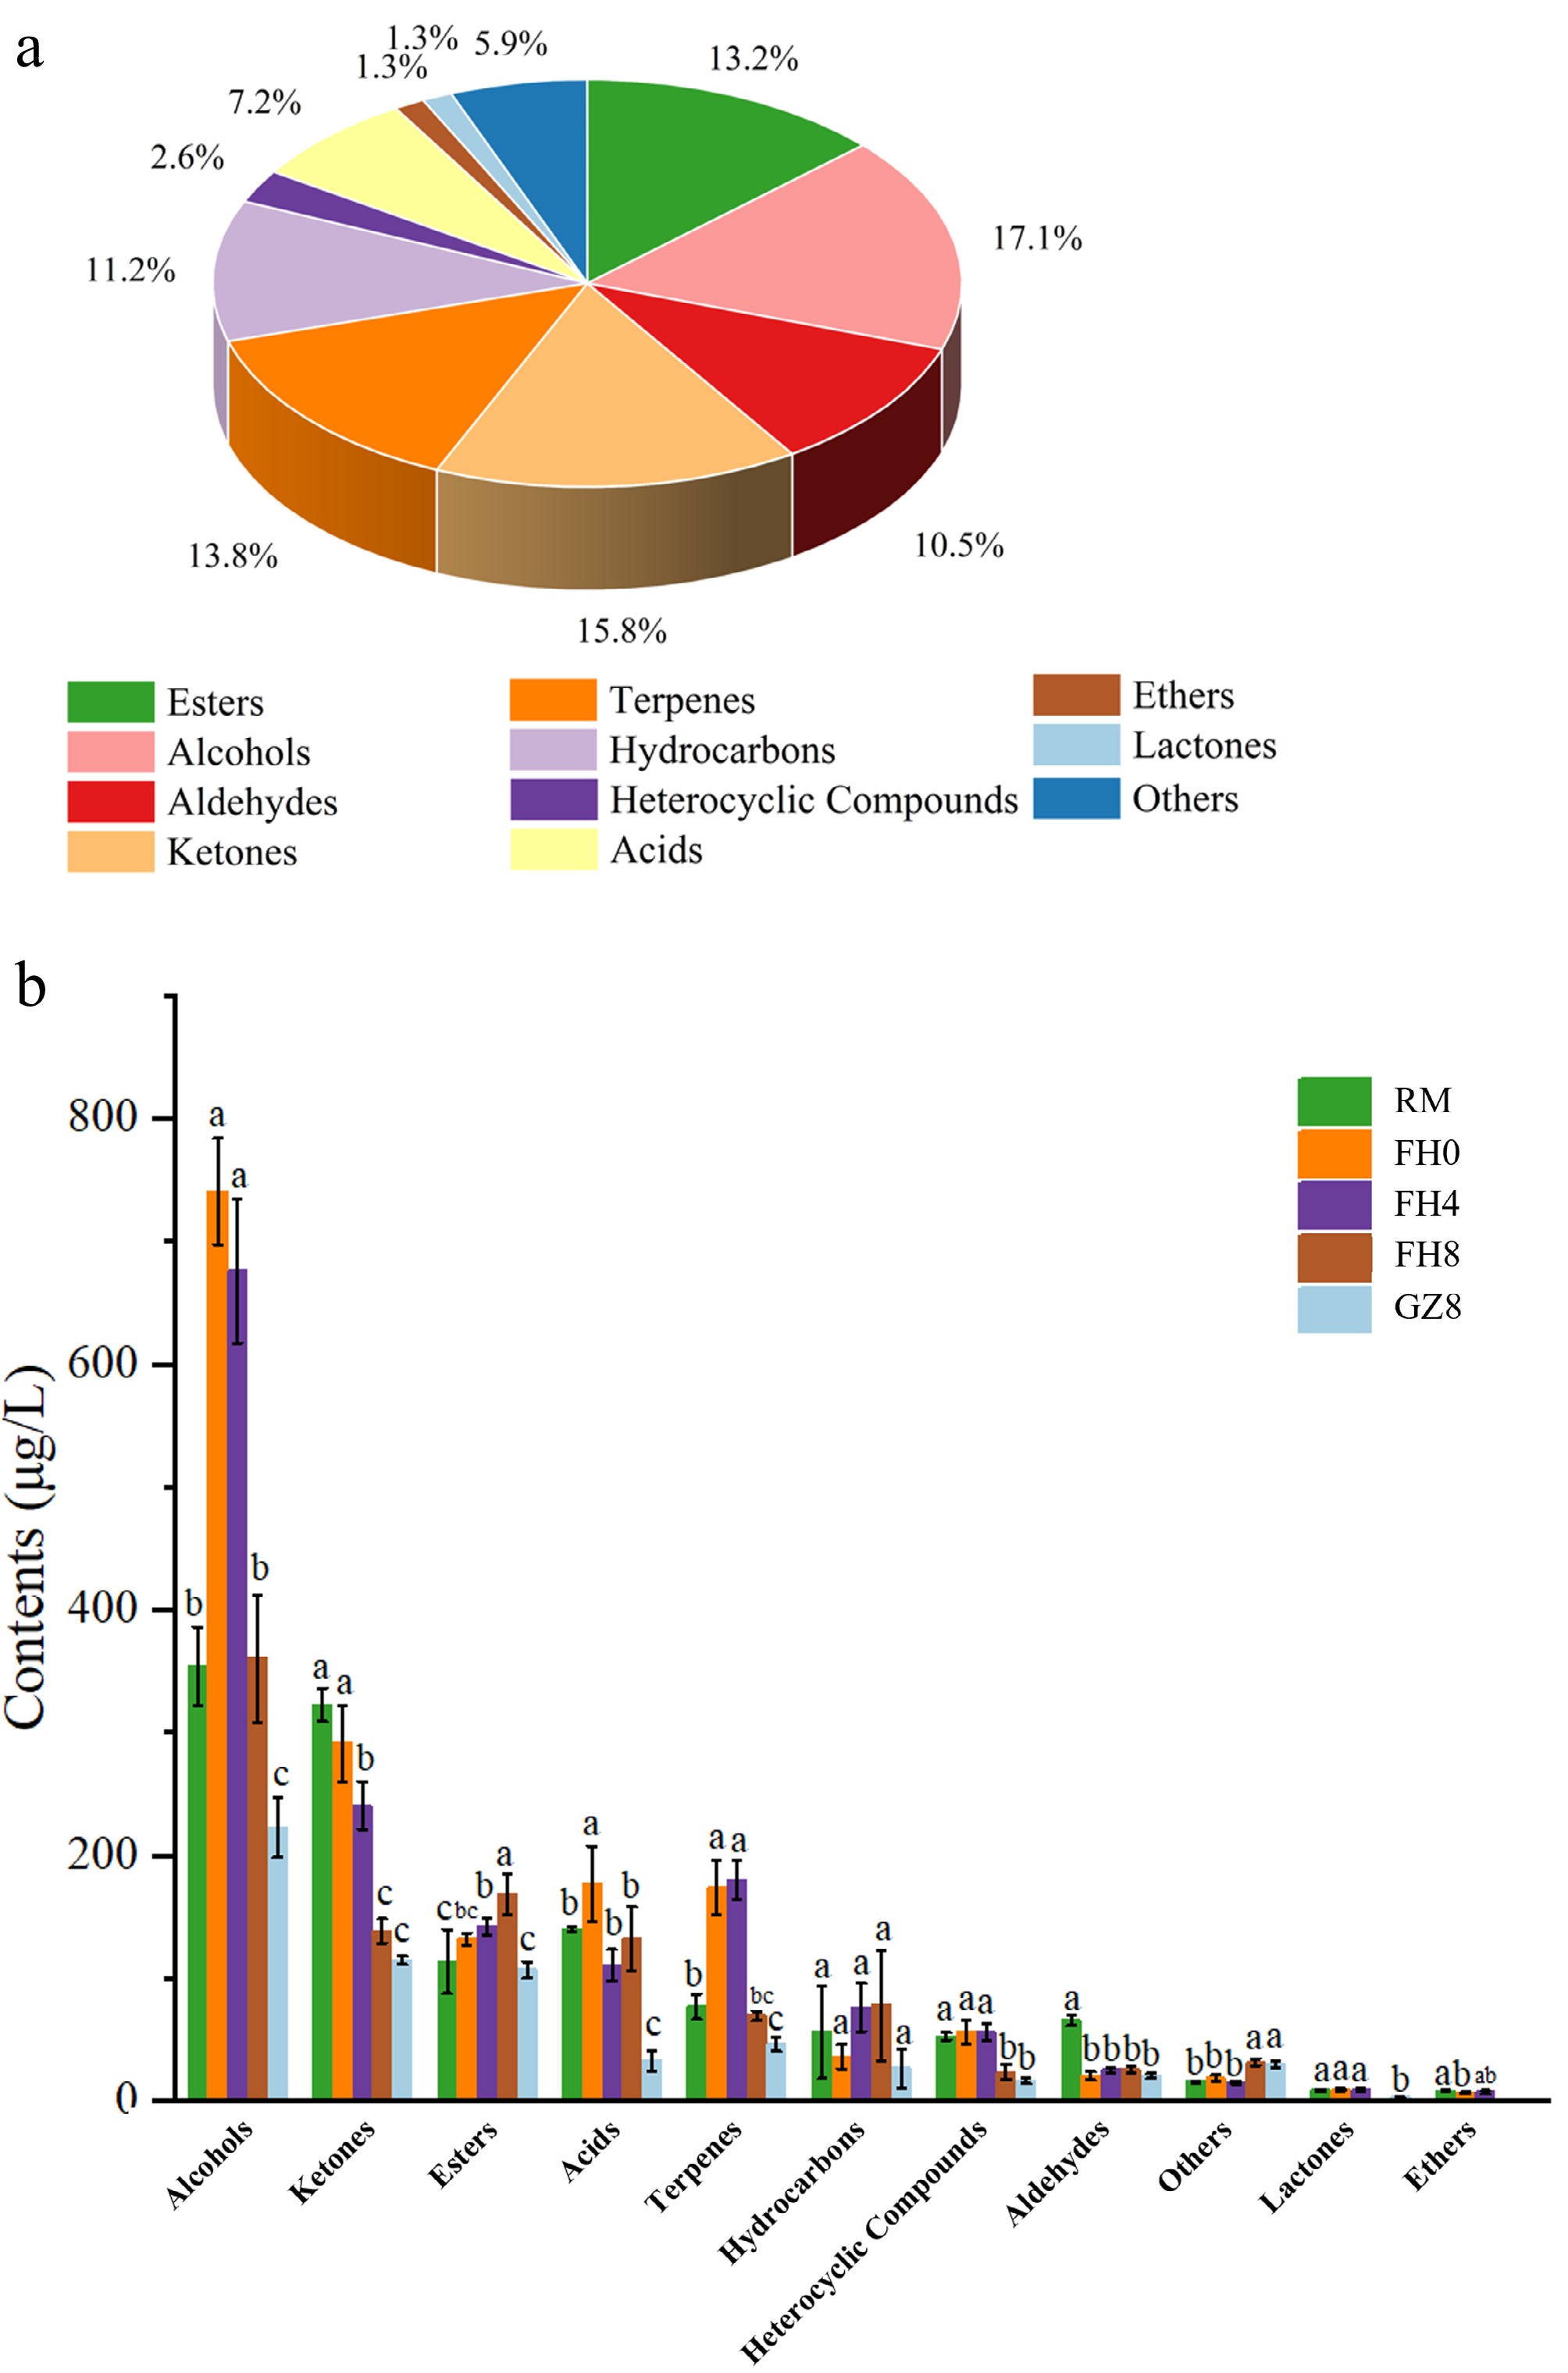
Figure 5.
The volatile compounds in GFWT samples were identified by GC-MS. (a) Pie chart of the obtained volatile compounds with their proportion. (b) Bar chart of components of different volatile compounds. Different letters mean significant variations (p < 0.05).
-
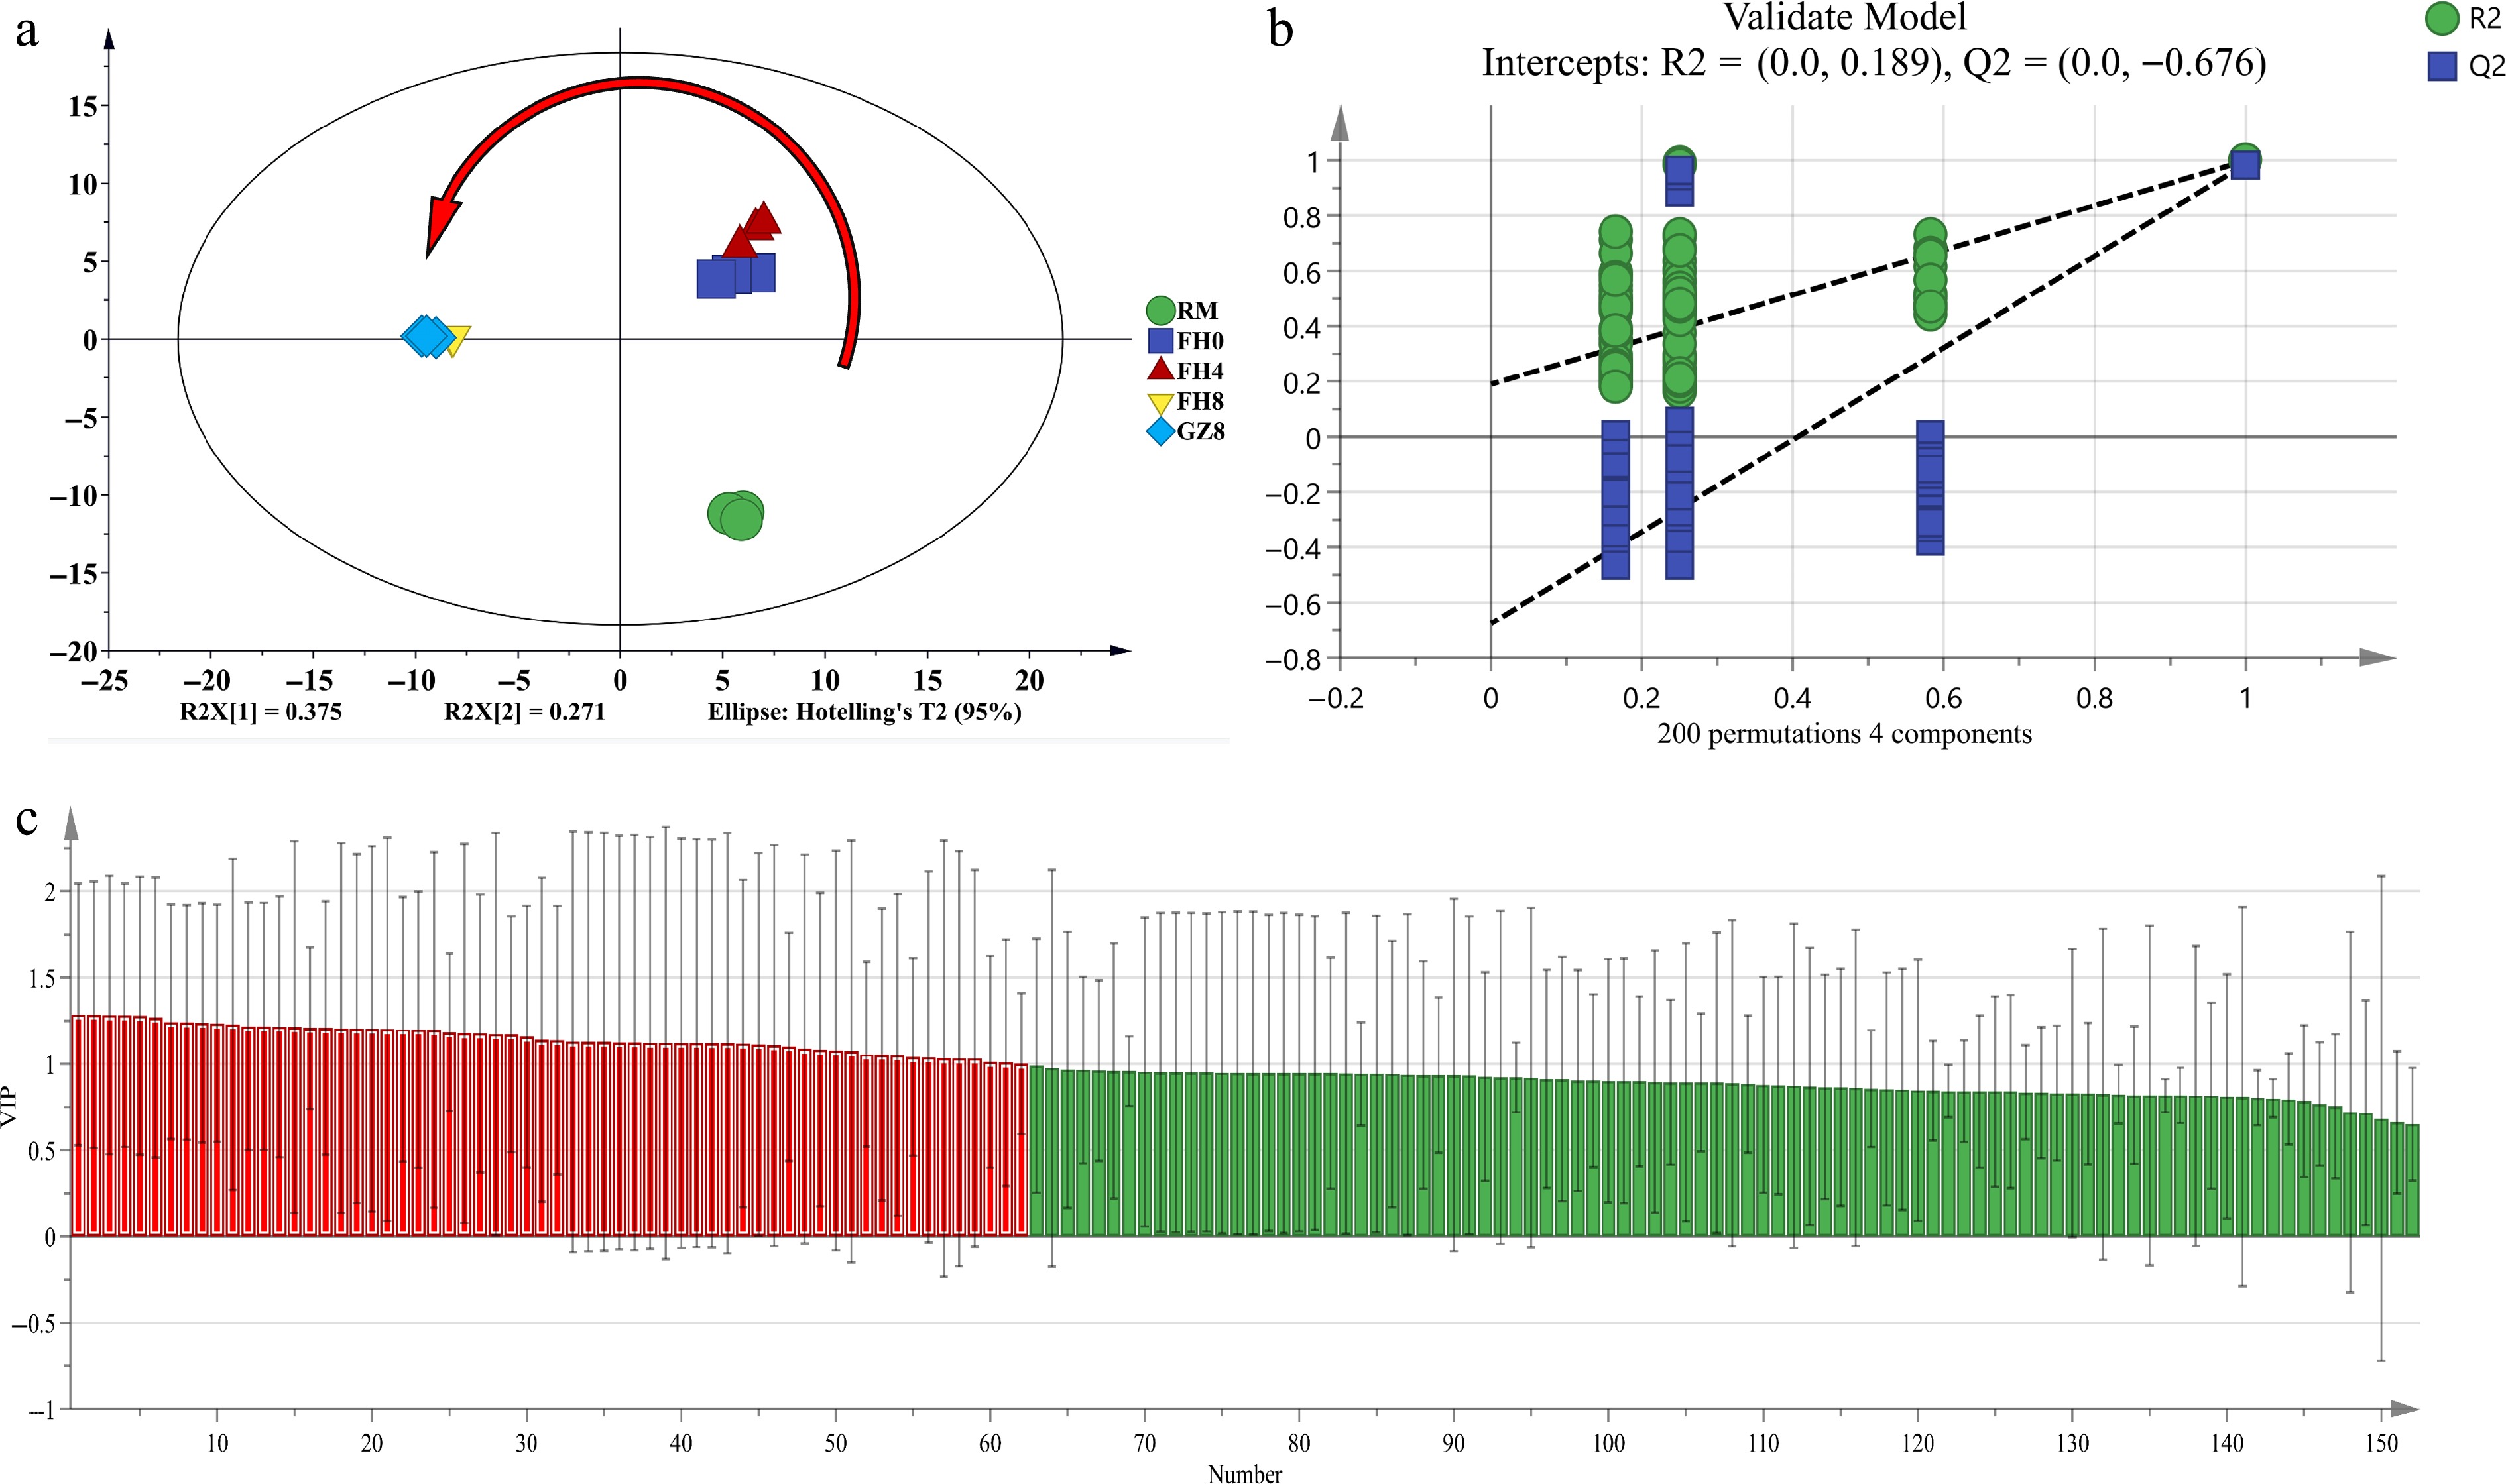
Figure 6.
The PLS-DA results of GFWT samples at five processing stages by GC-MS. (a) Scores graph of PLS-DA (R2Y = 0.99, Q2 = 0.979). (b) Cross-validation graph by 200 permutation tests (R2 = 0.189, Q2 = −0.676). (c) The red zone indicates the most distinctive compounds with VIP > 1.
-
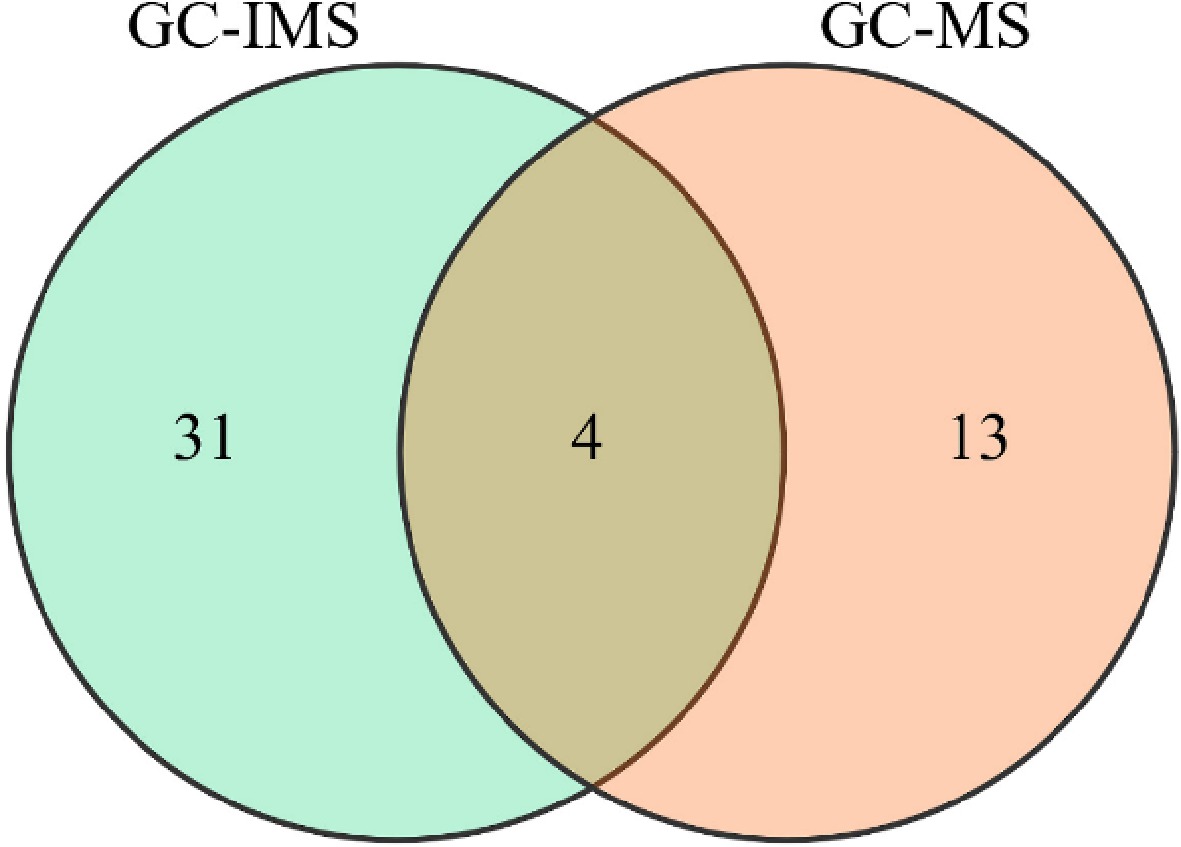
Figure 7.
Venn diagram of key volatile compounds (ROAV > 1) detected by GC-IMS and HS-SPME-GC-MS.
-
Volatile compounds ROAVs RM FH0 FH4 FH8 GZ8 (2E,4E)-2,4-Decadienal 174.14 − − − − (2E,4E)-2,4-Nonadienal 54.19 − − − − (E)-2-Nonenal 38.37 12.56 16.59 − 7.14 Hexanal 2.46 0.46 − 0.58 0.47 β−Cyclocitral 1.32 0.67 0.73 0.34 − Octanal 1.47 − − − − 1-Octen-3-ol − − − 6.89 − β−Ionone 557.05 402.26 403.12 182.66 147.13 Linalool 11.52 17.80 18.05 11.71 6.88 Phenylethyl alcohol 16.98 28.51 24.63 8.52 6.79 Geraniol 3.75 33.85 28.03 7.51 5.13 Methyl salicylate 0.39 1.61 1.68 3.04 1.56 Nonanal 6.68 3.46 3.88 2.41 3.02 α−Terpineol 1.81 2.20 2.45 1.49 1.06 β−Myrcene 0.94 5.37 4.60 1.45 1.00 α−Ionone 2.77 1.97 2.43 0.99 0.66 γ−Dodecalactone − − − − 1.74 Table 1.
The specific ROAVs of 17 volatile compounds in GFWT during the whole process.
-
Compound name Sensory evaluation Green Floral Fruity Woody Mushroom-like GC-MS (2E,4E)-2,4-Decadienal 0.95* 0.12 −0.55 −0.41 −0.41 (2E,4E)-2,4-Nonadienal 0.95* 0.12 −0.55 −0.41 −0.41 (E)-2-Nonenal 0.98** 0.47 −0.85 −0.72 −0.71 Hexanal 0.88* −0.03 −0.39 −0.26 −0.26 β−Cyclocitral 0.93* 0.62 −0.83 −0.82 −0.83 Octanal 0.95* 0.12 −0.55 −0.41 −0.41 1-Octen-3-ol −0.41 −0.58 0.75 0.61 0.58 β−Ionone 0.89* 0.77 −0.94* −0.93* −0.93* Linalool 0.09 0.88 −0.55 −0.75 −0.76 Phenylethyl alcohol 0.29 0.99** −0.76 −0.90* −0.90* Geraniol −0.18 0.82 −0.41 −0.60 −0.60 Methyl salicylate −0.82 −0.44 0.81 0.63 0.61 Nonanal 0.99** 0.39 −0.79 −0.65 −0.64 α−Terpineol 0.30 0.93* −0.72 −0.87 −0.88 β−Myrcene −0.16 0.83 −0.42 −0.62 −0.62 α−Ionone 0.82 0.81 −0.94* −0.94* −0.95* γ−Dodecalactone −0.41 −0.58 0.42 0.61 0.64 GC-IMS Butanoic acid, 3-methyl-, ethyl ester −0.91* −0.01 0.46 0.31 0.31 3-Methyl butanal M 0.64 −0.25 −0.04 0.02 0.01 3-Methyl butanal D 0.56 0.84 −0.72 −0.84 −0.84 1-Octen-3-ol M −0.40 −0.40 0.63 0.45 0.42 n-Octanal 0.38 −0.58 0.17 0.37 0.38 n-Nonanal −0.08 −0.85 0.54 0.73 0.74 2-Methylpentanal −0.52 −0.82 0.69 0.84 0.86 2,3-Butanedione −0.68 −0.64 0.84 0.73 0.71 2(5H)-Furanone, 3-hydroxy-4,5-dimethyl- −0.64 0.20 0.34 0.06 0.05 2-phenylacetaldehyde M −0.91* −0.17 0.57 0.46 0.46 1-Octen-3-ol D −0.56 −0.66 0.84 0.72 0.69 Heptanal M 0.67 −0.38 −0.08 0.10 0.11 1-Hexanal 0.95* 0.34 −0.64 −0.57 −0.58 2-Octanol −0.48 −0.59 0.78 0.64 0.61 Heptanal D 0.90* 0.00 −0.45 −0.29 −0.29 1-Penten-3-one 0.80 0.46 −0.59 −0.60 −0.61 2-methyl Butanal 0.70 0.82 −0.79 −0.88 −0.88* (E)-2-Heptenal M −0.19 0.30 0.08 −0.13 −0.14 2-Octanone M −0.30 0.05 −0.02 0.00 0.00 2-Phenylacetaldehyde D −0.56 0.48 0.01 −0.19 −0.19 (E)-2-Octenal 0.87 −0.06 −0.36 −0.22 −0.22 2-Pentyl furan 0.97** 0.52 −0.77 −0.73 −0.74 2-Ethyl-6-methylpyrazine −0.13 −0.82 0.53 0.73 0.74 2-Hexenal M 0.51 −0.56 0.11 0.30 0.30 1,8 Cineole 0.85 −0.11 −0.34 −0.19 −0.19 2-Hexenal D 0.69 0.85 −0.84 −0.90* −0.90* Butanal 0.88* 0.75 −0.88* −0.89* −0.90* 2-Hexanone −0.44 −0.09 0.09 0.17 0.18 Butyl propanoate D 0.43 −0.64 0.18 0.37 0.37 (E)-2-Heptenal D 0.15 0.93* −0.71 −0.80 −0.79 1-Pentanal 1.00*** 0.40 −0.76 −0.66 −0.66 (E,E)-2,4-Heptadienal 0.79 −0.20 −0.22 −0.09 −0.09 Butyl propanoate M 0.96** 0.15 −0.59 −0.44 −0.44 (Z)-3-hexenol D 0.39 0.97** −0.77 −0.90* −0.90* The correlation coefficient was calculated using the Pearson method. The significance levels are marked as: * p < 0.05, ** p < 0.01, *** p < 0.001. Table 2.
Pearson correlation analysis between key volatile compounds (VOCs) with ROAV > 1 and the sensory aroma attributes of GFWT.
Figures
(7)
Tables
(2)