


-
Golden Flower White Tea (GFWT) is made from white tea through the traditional Fu brick tea process, including piling, steaming, pressing, microbial fermentation (also called the flowering process), and drying[1]. The microbial fermentation process[2,3] is a special step to catalyze many complex biochemical reactions, which is crucial to the formation of the unique 'golden flower (Eurotium cristatum)' flavor characteristics of the Fu brick tea[4]. Meanwhile, after the flowering process, the typical aroma of aged white tea like herb medicine or sweet jujube, will be produced, which indicates that this process may be a promising natural and rapid aging process for the white tea[5]. However, the dynamic changes of volatile compounds in GFWT throughout the traditional processing, based on Jingyang Fu Tea manufacturing, have not been systematically explored.
For tea aroma and flavor identification and analysis, HS-SPME-GC-MS and GC-MS-O are commonly used because of their rapid qualitative and accurate quantitative analysis[6,7], but they're not sensitive enough to low concentrations of volatile organic compounds (VOCs), leading to the neglect of VOCs[8]. Recently, a new equipment headspace-gas chromatography-ion mobility spectrometry (HS-GC-IMS) is becoming popular for its instant detection, high sensitivity, strong visualization, and easy operation with no need of sample pretreatment[4,9]. Nevertheless, the database of the HS-GC-IMS is incomplete, thus certain VOCs may not be identified. Therefore, many researchers tend to integrate both the HS-SPME-GC-MS and HS-GC-IMS together to acquire more comprehensive and credible data[10].
This study was designed to deeply analyze the volatile compounds and their dynamic changes in GFWT during the manufacturing process using both GC-IMS and GC-MS. By setting up a theoretical foundation for the key aroma substances and their volatile components, the present results may provide innovative solutions for flavor control and enhancement of the GFWT in the future.
-
The white tea raw material (RM) was collected from Ziyang, Shaanxi Province in spring 2019. They were further processed into GFWT in Jingyang Fu Tea R&D Center (Jingyang, Shaanxi Province, China) in spring 2024. The purified water was mixed to RM to set the moisture content to 45%. After the moisture was spread evenly, the RM were steamed for 10 min and pressed into 15 cm × 10 cm × 3.5 cm tea bricks weighing 630 g each. The bricks were sent to the flowering room when they were cooled down to room temperature.
In the flowering room, the temperature was set to rise slowly from 23 to 27 °C, and the relative humidity was 72.5% ± 2.5% for 8 d. Afterwards, the bricks were transferred to the drying room. The temperature was set to rise slowly from 30 to 40 °C for 8 d for the bricks to dry to a constant weight. Five samples, RM, white tea after steaming (FH0), 4 d after flowering (FH4), 8 d after flowering (FH8), and after drying (GZ8) were collected. These samples were first processed by a vacuum freeze-dryer, and then kept in the refrigerator (−80 °C) for subsequent analysis.
The C4–C9 n-ketone used in the GC-IMS study was supplied by Sinopharm Chemical Reagent Beijing Co., Ltd. (Beijing, China). Ethyl caprate was provided by CATO Co., Ltd. (Guangzhou, China), and the other reagents or chemicals were of chromatographic grade.
Gas chromatography-ion mobility spectrometry analysis
-
To analyze the fingerprint of GFWT at different processing stages, the GC-IMS instrument (FlavourSpec®, G.A.S, Dortmund, Germany) was employed. First, 0.5 g of each tea sample was exactly weighed and separately put into 20 mL headspace vials with an agitation speed of 500 rpm, followed by incubation at 80 °C for 15 min. Then, through a syringe heated to 85 °C, 500 μL headspace gas was injected. A MXT-5 capillary column (15 m × 0.53 mm × 1 μm, Restek, Bellefonte, USA) was applied to separate the volatile components at 60 °C, and the ion migration spectrum was set at 45 °C. High-purity nitrogen gas, with a purity of 99.999%, was selected as the carrier gas. The programmatic flow rate was set differently along with the time. The initial flow rate was 2.0 mL·min−1 for 0–2 min, and 10.0 mL·min−1 from 2 to 8 min, then linearly increased to 100.0 mL·min−1 within 10 min and held for 20 min. The rate of drift gas was set to be 150 mL·min−1. Each sample was subjected to analysis in triplicate.
Taking n-ketones C4–C9 mixtures as the external references, the volatile compounds RI (retention index) in GFWT samples were calculated. The calibration curve of retention time and retention index was established, and then the retention index of the volatile compounds was calculated by the retention time of the volatile compounds. The GC retention Index (NIST 2020) database was built in the VOCal software, and the IMS migration time database was used to retrieve and compare the qualitative analysis of the volatile compounds. The topographic maps and the differential fingerprints were recorded by the Reporter plug-in, and the Gallery Plot plug-in, respectively.
Gas chromatography-mass spectrometry analysis
-
An Agilent 7000D system (Agilent, Palo Alto, CA, USA) was used for the GC-MS analysis of the volatile organic compounds, which were extracted by HS-SPME. Briefly, the GFWT samples were ground in liquid nitrogen, and mixed evenly by vortex. Then 0.5 g samples were added to a 20 mL headspace bottle containing 5 μL (100 μg·mL−1) ethyl caprate internal standard solution, 5 mL boiled ultrapure water, and 0.5 g sodium chloride. The bottles were sealed with a clamp cover equipped with a silicon septum. The headspace glass bottles were oscillated for 10 min at a constant temperature of 80 °C. Afterwards, 65 μm PDMS/DVB fiber (Supelco, Inc., Bellefonte, PA, USA) was injected into a headspace bottle and VOCs were extracted for 50 min under the same condition. Desorption was performed at 250 °C for 5 min, and then isolated and identified by GC-MS. Each sample was tested three times.
VOCs were separated using HP-5MS capillary column (30 m × 0.25 mm × 0.25 μm, Agilent, USA). The inlet temperature was 250 °C. The temperature rise procedure was illustrated as follows. The initial temperature was 40 °C for 3 min and raised to 80 °C at the rate of 2 °C·min−1, then to 180 °C at 7 °C·min-1 held for 1 min, and finally to 230 °C at 15 °C·min−1 held for 2 min. The flow rate of the carrier gas helium, with a purity of ≥ 99.999%, was set to be 1 mL·min−1. The mass spectrometry condition was: ionization mode, electron impact; electron energy 70 eV; ion source 230 °C, quadrupole temperature 150 °C, and the transmission line temperature 250 °C. The scanning mode was full scanning with a quality scanning range of 50 ~ 500 m/z.
Comprehensive comparisons were conducted in the NIST 17.0 library, the Wiley MS Library and other public databases for the mass spectra of all the identified metabolites. The internal standard ethyl caprate was used for quantitative analysis.
Relative odor activity value (ROAV) analysis
-
Odor activity values (OAV) make sense in evaluating how much a certain aroma compound contributes to the distinctive aroma of a sample, and those with OAV > 1 are normally considered. The calculation formula of OAV is:
$ \mathrm{OAV=Ci/OTi.} $ where, OAV means the odor activity value of the compound, OTi refers to the compound threshold value in water, and Ci means the relative concentration ratio of the volatile constituent.
In this study, the GC-IMS acquired VOC concentration was taken as the relative content (RC, %). ROAV was to evaluate the contribution of compounds to GFWT aroma, which was reported in previous studies[11,12]. Then the ROAV of each aroma compound was calculated as follows:
$ \rm ROAVi = Ci/C\max \;\times\; T\max /Ti\;\times 100 $ where, Ci refers to the RC of a specific tea aroma compound (%), while Ti represents the threshold of it in water (μg·kg−1). Cmax means the RC and Tmax denotes the threshold of the most important aroma compound to shape the main flavor.
According to the formula, the ROAV of all compounds calculated is less than 100, which is considered to be a typical value to judge how much the components contribute to the main flavor of the sample. Those with ROAV ≥ 1 are considered to be the key flavor compounds, and those with 0.1 ≤ ROAV < 1 have important modifying effects on the overall flavor of samples.
Sensory evaluation
-
According to the Chinese National Standard on Tea Sensory Evaluation (GB/T 23776-2018), a sensory evaluation on GFWT samples (RM, FH0, FH4, FH8, GZ8) was conducted. Briefly, 5 g of each sample was placed in standardized sensory evaluation containers, respectively, followed by infusion with 100 °C boiling water for 5 min. Afterwards, the tea liquor of each sample was poured into the corresponding standard bowls for the aroma assessment. The evaluation was performed by eight professional tea tasters with related qualifications (four females and four males, aged 22–50 years) from Northwest A&F University, who were well trained and skilled in tea aroma identification, description, and discrimination. As a result, five key aroma descriptors to characterize the overall aroma profile of GFWT were identified, including green, floral, fruity, woody, and mushroom-like. The aroma intensity was rated using a 10-point categorical scale (0 = no perception, 5 = moderate perception, 10 = strong perception), where higher scores indicated stronger aroma intensity. The arithmetic mean of the scores given by the tea tasters for each attribute was calculated and visualized using a radar chart.
Statistical analysis
-
Partial least squares discriminant analysis (PLS-DA) was carried through to get a model using SIMCA 14.1 software (Umetrics, Sweden). The five GFWT samples were analyzed by ANOVA using the SPSS statistics 24.0 software (SPSS Inc., Chicago, IL, USA) to obtain their significance levels. All the pie graphs, bar charts, and box diagrams were drawn using Origin software (Originlab, USA).
-
To investigate the flavor divergence of GFWT samples across distinct processing stages, a sensory evaluation was conducted. As shown in Fig. 1a, the color of the five sample GFWT infusions exhibited a pronounced progressive darkening trend during processing. Specifically, the raw material (RM) tea infusion displayed a bright orange-yellow hue representing the typical visual characteristic of unprocessed white tea. After steaming (FH0), and the 4-d flowering (FH4) process, the color of FH0 and FH4 infusion gradually deepened and turned golden. By the 8th d of flowering (FH8) and after drying (GZ8), the color of the FH8 and GZ8 infusion changed into reddish-brown. This color change directly reflected the accumulation of oxidation metabolic products (such as oxidized polyphenols and melanin polymers) during the microbial fermentation (by E. cristatum) and drying process, providing an intuitive indicator for the processing maturity of GFWT.
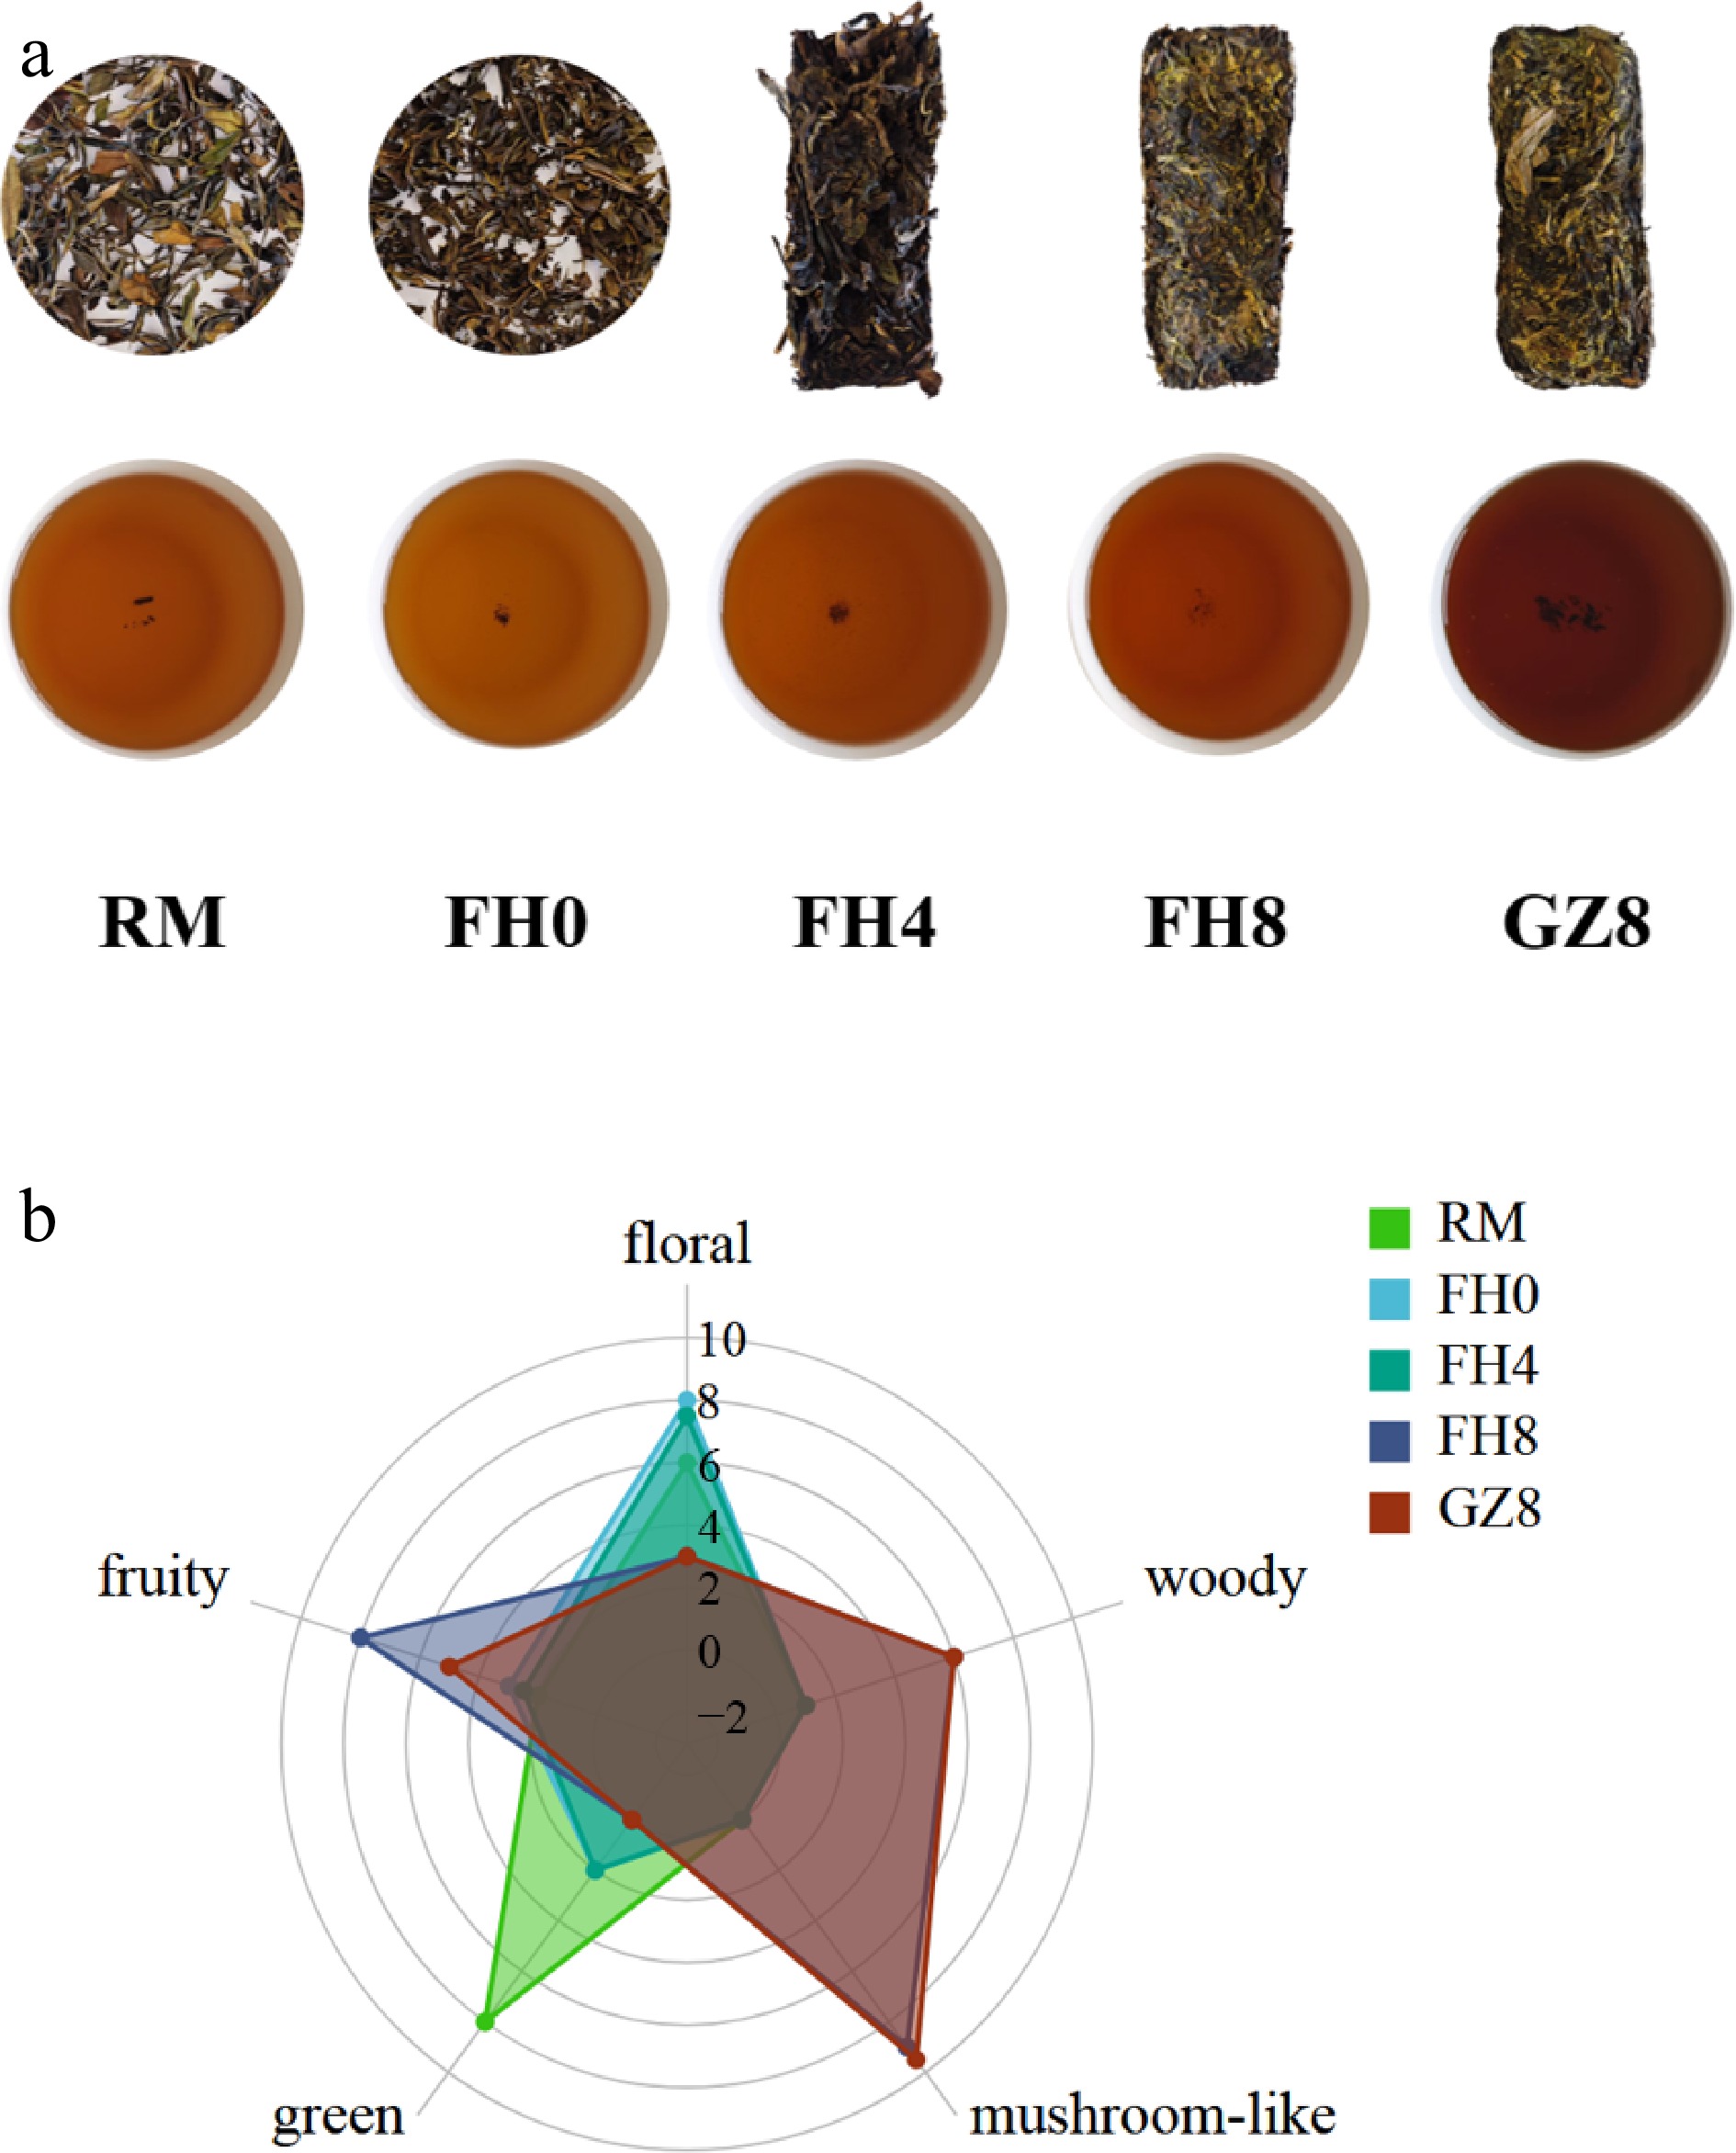
Figure 1.
Sensory evaluation and key volatile compound correlations. (a) GFWT samples and the corresponding tea infusion. (b) Radar map of aroma diversity of GFWT samples.
To systematically characterize the aroma profile of GFWT, five key aroma descriptors were established based on the panel's consensus: green, floral, fruity, woody, and mushroom-like. The results were visualized in the radar chart (Fig. 1b). Notably, significant differences in flavor attributes were observed across the GFWT samples at various processing stages. Specifically, RM exhibited a high intensity of green aroma, whereas FH8 displayed the most distinct fruity aroma intensity. Both GZ8 and FH8 were characterized by the strongest mushroom-like and woody notes. The processing path of GFWT was characterized by a sequential transformation: beginning with the dominant green aroma of RM, progressing to the fruity scents of intermediate stages (FH0 and FH4), and ultimately maturing into a profile featured with woody and mushroom-like (fungal floral) aroma.
The sensory results outlined above defined the core trajectory of GFWT's flavor evolution, a transition from green-dominated (RM) to fruity-intermediate (FH0/FH4) and finally to mushroom-like/woody-dominated (FH8/GZ8). This trajectory provided a target-oriented framework for the subsequent instrumental analyses of GC-IMS and HS-SPME-GC-MS.
Analysis of volatile compounds in GFWT at different manufacturing processes through GC-IMS
GC-IMS topographic plots of volatile components
-
To visually see the differences of the volatile organic compounds in GFWT samples, the three-dimensional topographic maps of GFWT from different processing stages were illustrated in Fig. 2a. It could be found that the volatile components looked similar, but some peaks significantly varied across different processing periods. To further visually compare the differences of volatile components in GFWT samples, the spectral diagram of RM was as the reference, with others deducted to obtain the differential spectra, as shown in Fig. 2b. If the target sample had the same VOC content as the reference, the deducted background would be white. If it had a higher VOC concentration, the color would be red. If the color turned blue, it indicated that the sample had less VOC content than the reference. Compared with RM, both FH0 and FH4 had more red and blue dots, indicating the major changes of the volatile compounds during the steaming process. Interestingly, there were more blue dots after the FH8 stage, indicating a sharp decrease in some volatile compounds. Xiao et al.[13] conducted an experiment of E. cristatum solid-state fermentation on the black tea and detected the volatile compound changes through GC-IMS, finding that the changes in VOCs were the greatest during the middle fermentation period (days 4 to 10). It could be inferred that during this period, the growth of E. cristatum exerted an important influence on the GFWT.
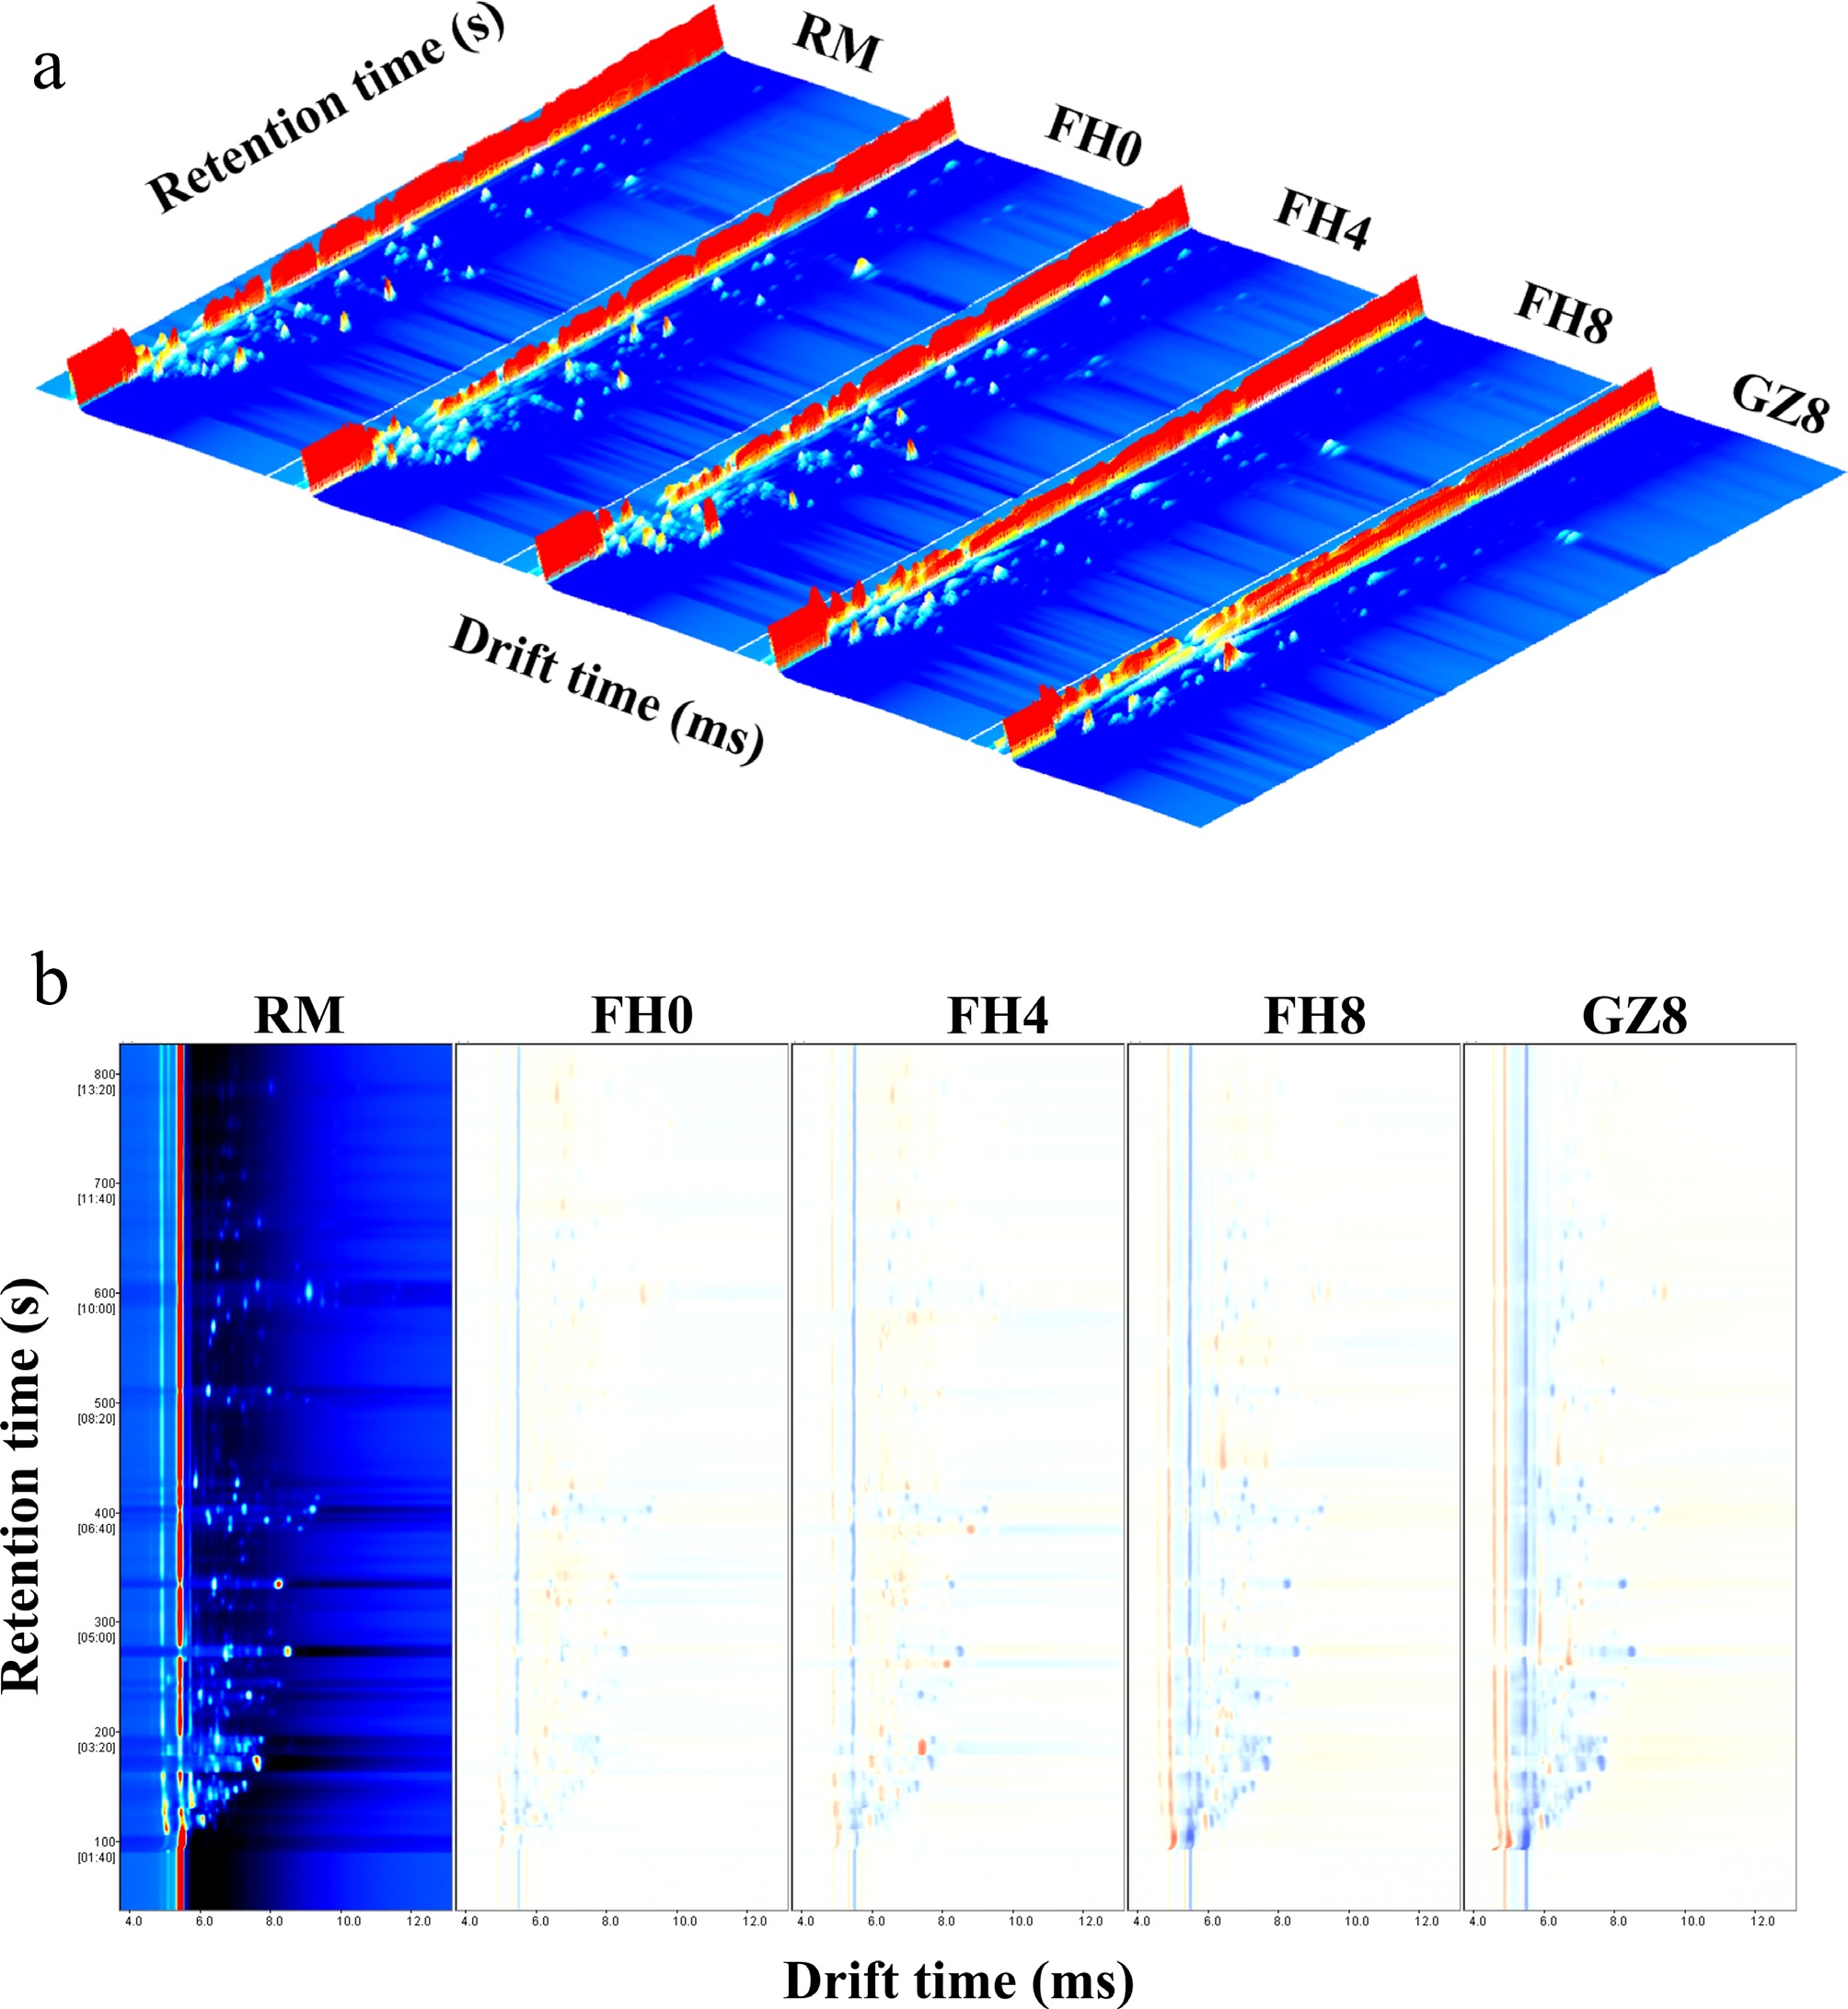
Figure 2.
GC-IMS topographic plots of the samples. (a) 3D-topographic plot; (b) identification diagram of volatile compounds. RM represents raw material; FH0 represents after-steaming; FH4 represents 4-day flowering; FH8 represents 8-day flowering; GZ8 represents after-drying.
Fingerprint analysis of GFWT in process
-
To further study the changes of specific volatile components in GFWT in process, the retention time and migration time of volatile flavor components were compared to characterize the volatile components qualitatively. As a result, 59 known volatile substances were found to be in accordance with 78 peak signals in GFWT. They were then classified into eight types, including 18 aldehydes, nine alcohols, 12 ketones, eight esters, three acids, one furan, one lactone, and seven other compounds (Supplementary Table S1). Notably, some volatiles with high proton affinity or in high concentration tended to form multiple signals of dimers or polymers in the ionization region[14]. Similarly, a total of 19 volatile compounds in GFWT were discovered in the form of monomers and dimers in this study.
To directly reflect the subtle trend and difference of the volatile compounds at five processing stages of GFWT, the fingerprint was constructed using the gallery plot plug-in. The volatile compounds in the samples were listed in the rows, while their signal strength was shown in the columns. The color turned brighter with the enhancement of the signal. In Fig. 3, the variation trend of volatile compounds in the whole manufacturing process were mapped into five zones: A, B, C, D, and E. The A region showed the highest concentration of the volatile components in RM, among which aldehydes with low boiling points (such as (E)-2-octenal, nonanal, heptanal M, heptanal D, pentanal, (E,E)-2,4-heptadienal, 2-hexenal M and 2-hexenal D, etc.) were the most. After RM was steamed, the aldehyde with a low boiling point was volatilized, while the aroma substance with a high boiling point was revealed. The content of volatile compounds such as 2-propanone, γ-butyrolactone M, γ-butyrolactone D, linalool, 2-phenylacetaldehyde M, linalool oxide M, 3-methylbutanoic acid M, hexanol M in the B region were higher than those in FH0. During the tea manufacturing process, monoterpene alcohols (such as linalool) were released by hydrolyzing glycosidic bonds[15], but they would be reduced at the end of the processing, indicating that linalool could be degraded or oxidized to linalool oxide[4]. Wang et al.[16] identified a high content of γ-butyrolactone in the compressed white tea by GC-IMS method, and speculated that GC-IMS has a unique advantage in identifying γ-butyrolactone and its dimer. As a common lactone, γ-butyrolactone has a creamy and fatty aroma. It reached the highest concentration during the FH4 stage of the processing of GFWT. Ketones and aldehydes were predominant in region C, and reached the highest concentration in FH8. The key compounds included 2-butanone, 2-pentanone, 2,3-butanedione, monomer and dimer of 2-heptanone, and benzaldehyde, etc. In the D region in the FH8 stage, the content of esters (such as n-propyl acetate and butyl formate) and alcohols like 1-octen-3-ol monomer and dimer and 2-octanol were the highest. It was proven that linoleic acid could produce 1-octen-3-ol[15], a widely available fatty acid derived from fungal volatile. In previous studies, it was found to show a high content in Fu brick tea[17,18], giving the tea a mushroom-like flavor. As in the E region, the typical compounds including 3-Methyl-2-butenal, 2-Methylpentanal, and 2,2-Dimethyl-3-methylenebicyclo[2.2.1]heptane attained their peak levels in the drying stage. Changes in these VOCs during the processing stage profoundly affected the flavor of the tea, but not all VOCs contributed to the aroma. Therefore, it should be further illustrated by combining with chemometrics to discover the key aroma components.
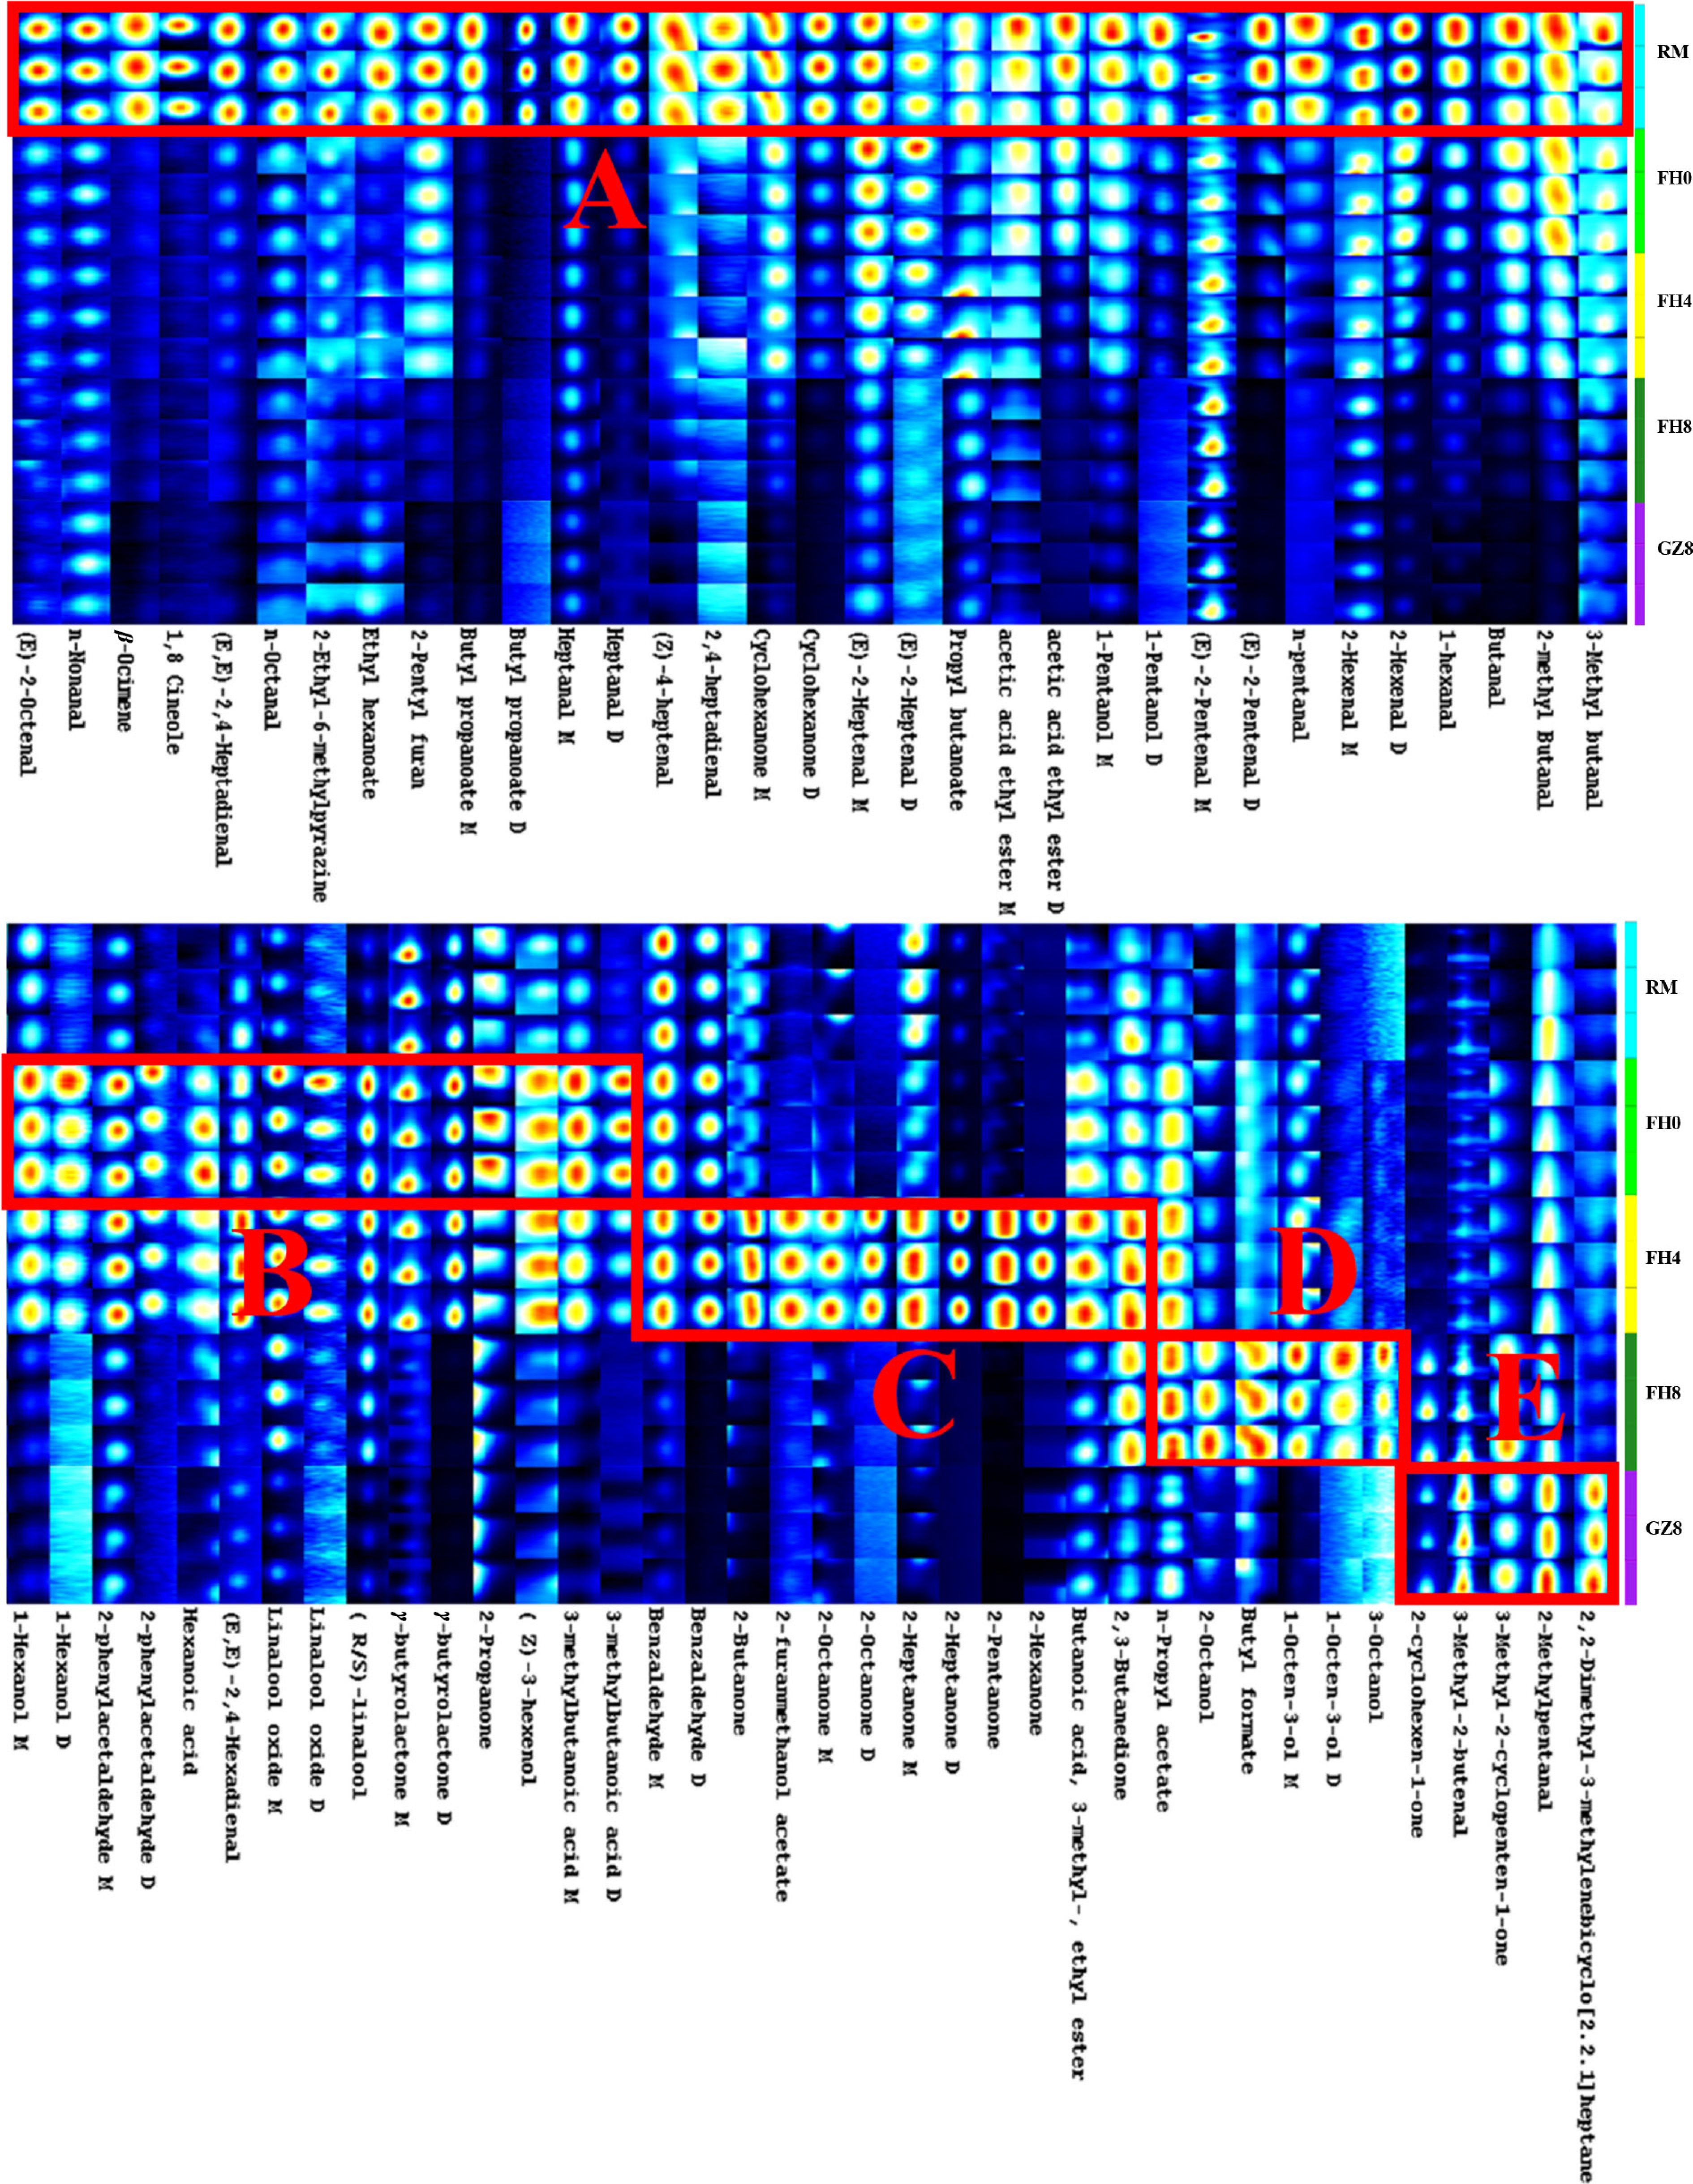
Figure 3.
Gallery plot fingerprint of different tea samples by GC-IMS. The compounds with higher content are framed in the colored boxes: A for RM, B for FH0, C for FH4, D for FH8, and E for GZ8.
Multivariate statistical analysis
-
To better investigate the volatile components variation trend in GFWT at different processing stages, the volatile component fingerprints were minified using the PLS-DA model. The model parameter R2Y = 0.994 indicated a high explanatory power, and Q2Y = 0.989 indicated a strong prediction ability. Figure 4a clearly showed the five GFWT samples in different colors, where RM in green was on the lower right corner separately, FH0 and FH4 in blue and red gathered on the upper right, and FH8 and GZ8 in yellow and light blue clustered on the left half. The results showed that the volatile metabolites of GFWT were obviously differentiated at the steaming and flowering process from the 4th to 8th d, and the valid model parameters (R2 = 0.0954, Q2 = −0.633) revealed that they were very stable without overfitting (Fig. 4b). Additionally, 25 variables were set to be differential variables (Fig. 4c) as they were found to be in accordance with 25 volatile compounds and their VIP values were greater than 1. Among them, five volatile compounds including 2-methyl-butanol (VIP = 1.507), 2-hexanone (VIP = 1.457), 2,2-Dimethyl-3-methylenebicyclo[2.2.1]heptane (VIP = 1.452), 2-furanmethanol acetate (VIP = 1.446), and 2-octanol (VIP = 1.422) were particularly important. The key aroma compounds during the GFWT process would be further screened in combination with ROAV values. In this way, the different key volatile compounds during all the processing stages of GFWT would be clearly identified.
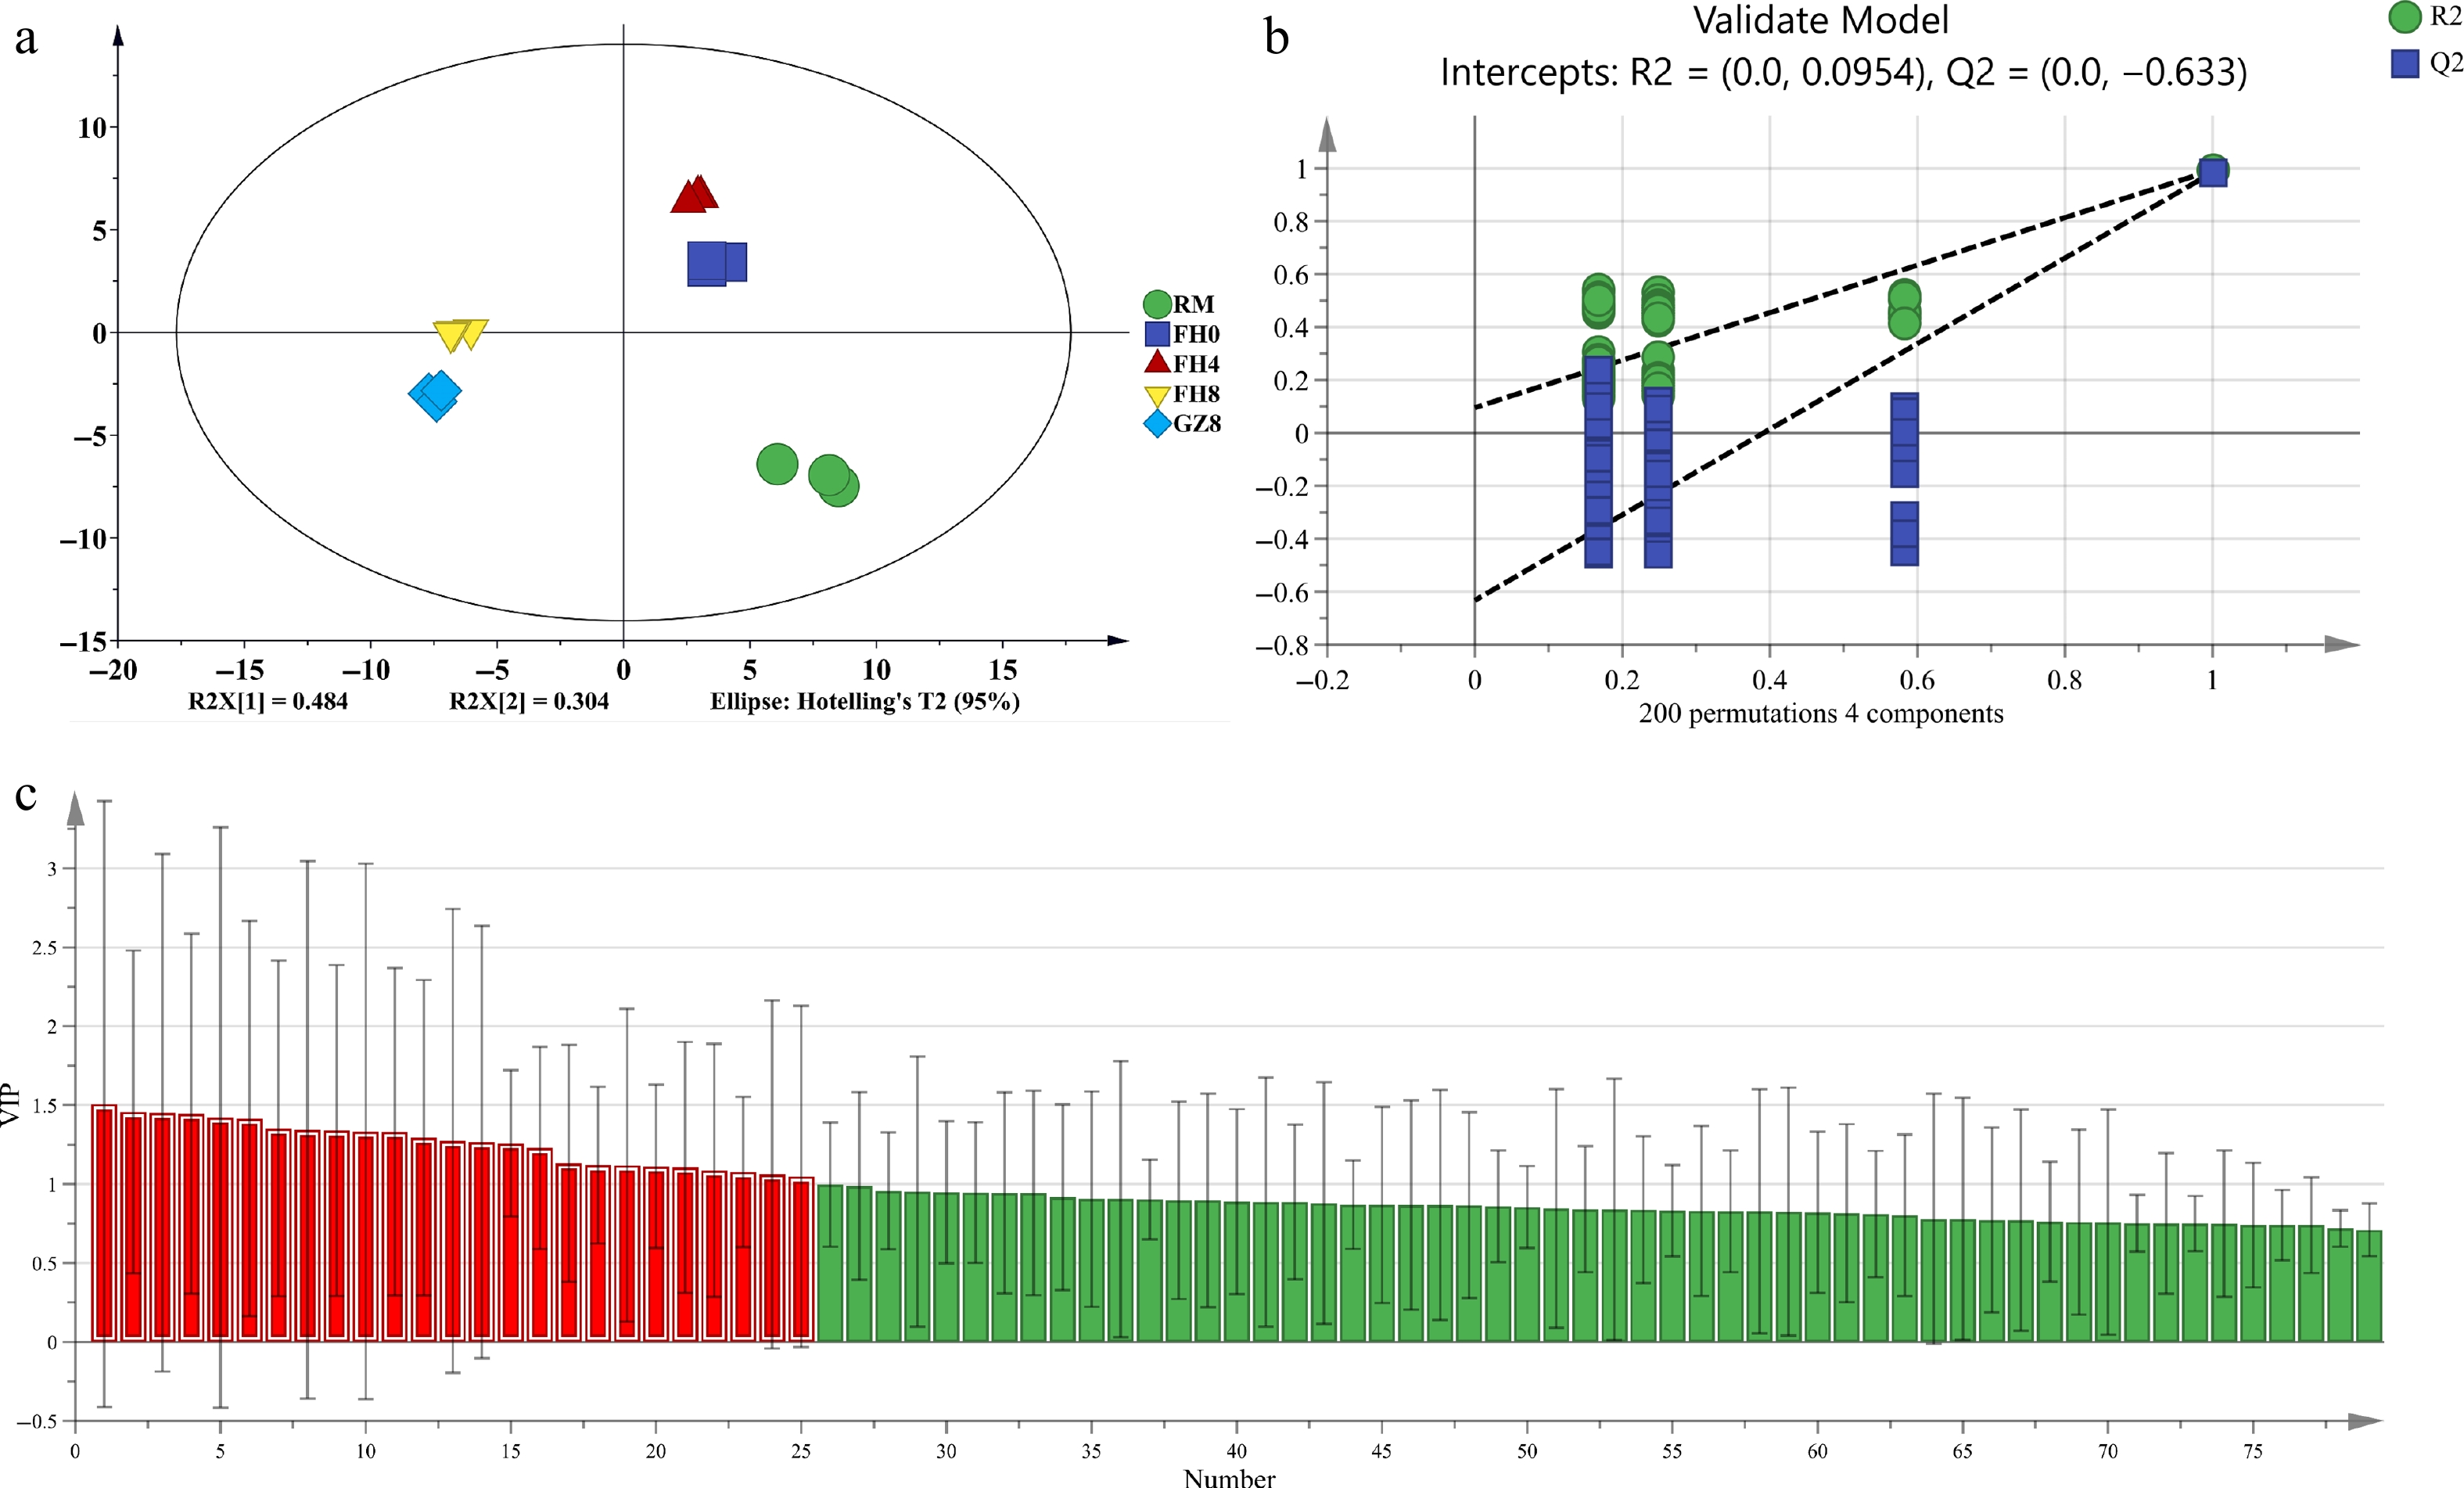
Figure 4.
The PLS-DA results of GFWT samples at five processing stages by GC-IMS. (a) Scores graph of PLS-DA (R2Y = 0.994, Q2 = 0.989). (b) Cross-validation graph by 200 permutation tests (R2 = 0.0954, Q2 = −0.633). (c) The red zone indicates the key compounds with VIP > 1.
Key-aroma compounds analysis
-
The key aroma compounds refer to those that make sense in determining the overall flavor of the tea[19]. ROAV could be computed based on the relative content of compounds as well as their threshold values, serving as a crucial metric to assess the contribution of compounds to food flavor[20].
The ROAV values of 35 volatile compounds (screened as key aroma-related VOCs with ROAV > 1) were calculated and analyzed (see Supplementary Table S2). Combined with ROAV > 1, VIP > 1, four key VOCs were selected, which had an important contribution to the aroma during GFWT processing, including 2-octanol, 1-octen-3-ol M (mushroom), 2,3-butanedione (creamy and buttery), and 2-methylpentanal (fruity and green). These volatile compounds were the key substances during the manufacturing process of GFWT. Among them, 2-octanol had a bad odor of spicy, and the ROAV value was greater than 1 in FH8, but less than 1 in other samples, which might contribute to the bad odor in FH8[21]. 2-octanol is a fungal metabolite produced by a hydrolysis reaction catalyzed by lipase[22,23]. During the drying stage, the fungal activity was weakened, so the ROAV value of 2-octanol in GZ8 decreased to 0.29 after drying, with little impact on the aroma quality of the finished product.
The ROAV of 1-octen-3-ol M peaked at 21.07 during the FH8 stage and decreased to 4.82 after drying. Interestingly, both values were considerably greater than 1, signifying that 1-octen-3-ol M substantially contributed to the aroma profile of GFWT. It has been reported that 1-octen-3-ol is a representative fatty acid-derived volatile compound[24]. Characterized by a mushroom-like aroma, it is actually one of the oxidative products of the unsaturated fatty acids, including alpha-linolenic acid and oleic acid, catalyzed by fatty oxygenase[15,24]. 2,3-Butanedione is an important aroma substance in cheese processing and has been detected in some Wuyi Rock teas, with a creamy and roasted aroma[25,26]. During the processing of GFWT, the ROAV value of 2,3-Butanedione exhibited a trend of increasing at first and then decreasing, which reached the highest value of 3.14 at the FH8 stage and significantly contributed to the formation of the creamy aroma in GFWT. These key aroma substances could have a tremendous impact on the aroma quality of GFWT.
Analysis of volatile compounds in GFWT at different manufacturing processes through HS-SPME-GC-MS
VOCs in the GFWT manufacturing process
-
The five GFWT samples at different processing stages were analyzed by HS-SPME-GC-MS to reveal the dynamic changes of volatile components. A total of 152 volatile compounds were found and classified into 11 categories, including 20 esters, 26 alcohols, 16 aldehydes, 24 ketones, 21 terpenes, 17 hydrocarbons, four heterocyclic compounds, 11 acids, two ethers, two lactones, and nine others. Supplementary Table S3 lists all the VOCs data found in the GFWT samples, such as name, odor descriptions, CAS number, formula, retention time, and relative content. Figure 5a shows the proportion of different categories, among which four types including alcohols (17.1%), ketones (15.8%), terpenes (13.8%), and esters (13.2%) accounting for higher proportions. Figure 5b reveals that different volatile components have varying concentration during the five stages due to the biochemical reactions, including lipid breakdown and glycoside hydrolysis. Alcohols, ketones, esters, acids, and terpenes were the most abundant aroma categories detected. Previous studies have shown that the effects of microorganisms significantly reduce the contents of alcohols and ketones, but significantly increase the content of esters in tea[5,27], which is consistent with this study. In addition, Zhu et al.[5] found a significant increase in hydrocarbons contents. In contrast, the content change of hydrocarbons in this study was not significant, which might be related to the different detection conditions and samples.
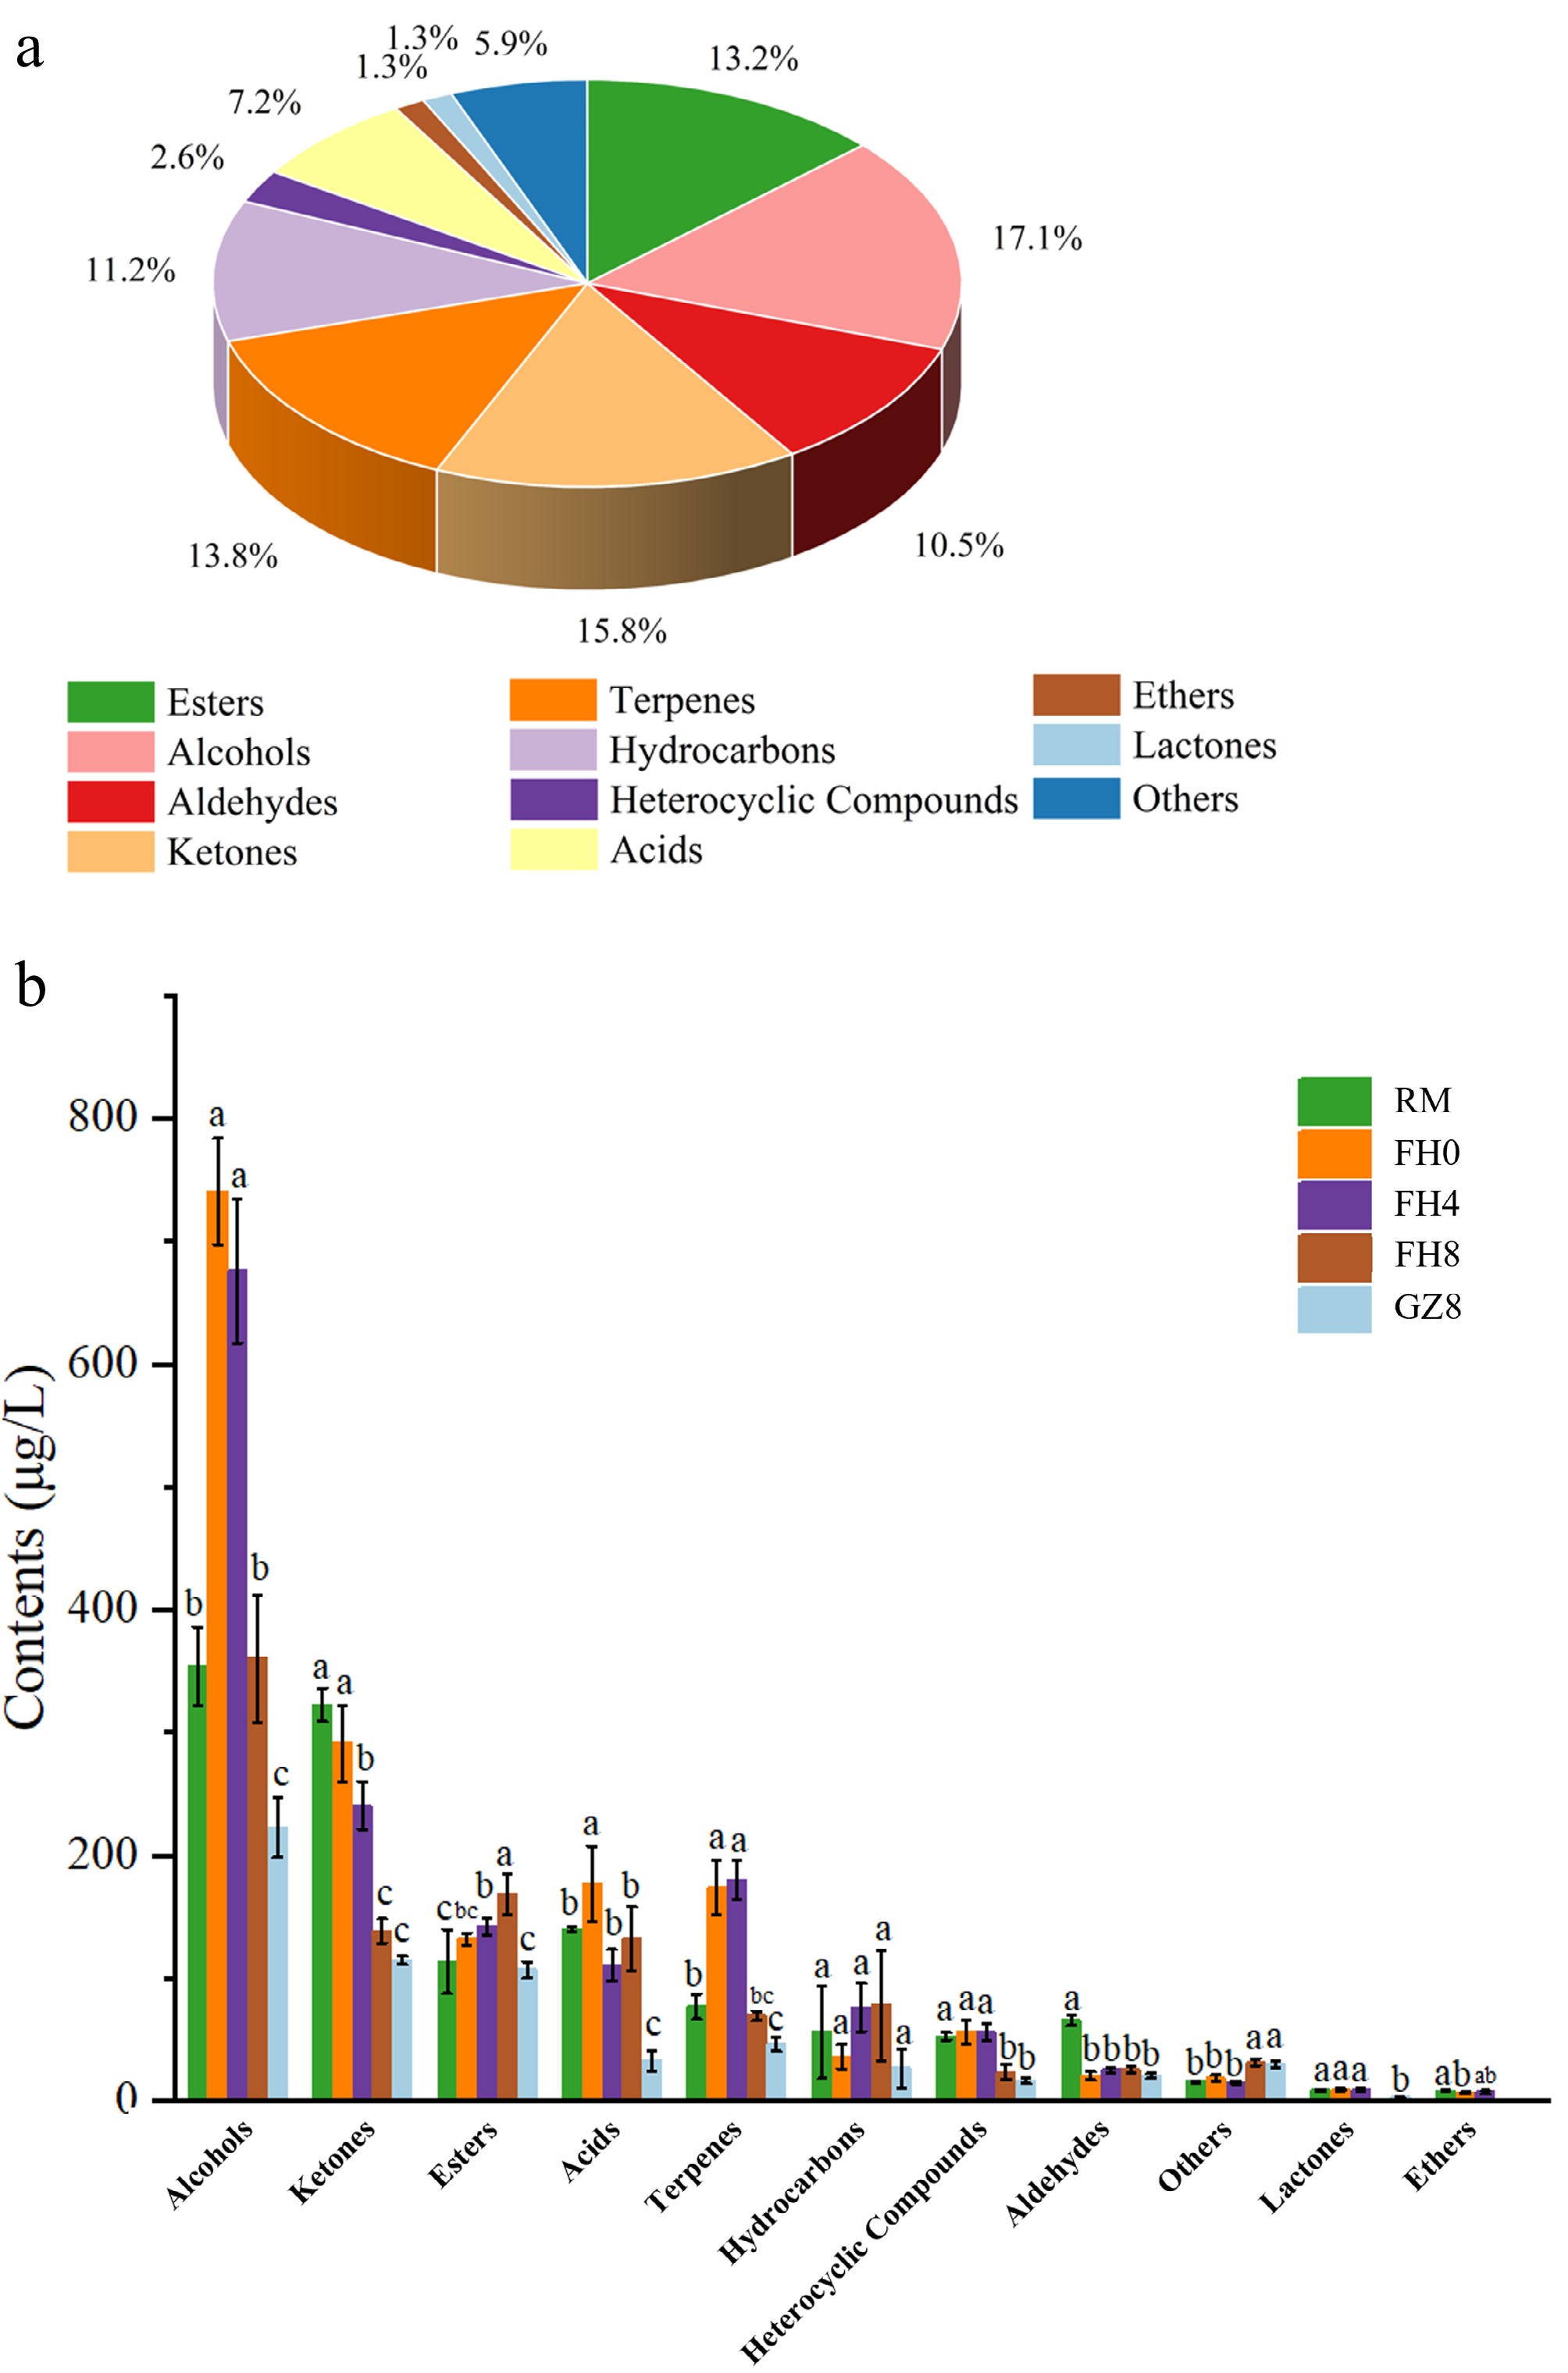
Figure 5.
The volatile compounds in GFWT samples were identified by GC-MS. (a) Pie chart of the obtained volatile compounds with their proportion. (b) Bar chart of components of different volatile compounds. Different letters mean significant variations (p < 0.05).
The significant increase in the content of esters, especially methyl salicylate, makes a great contribution to the 'fungal flower' flavor of Fu brick tea[17]. In GFWT, the content of methyl salicylate was lower in RM, FH0, and FH4 (13.51 ± 1.41 μg/L, 56.18 ± 3.99 μg/L, and 58.65 ± 4.59 μg/L, respectively), while in the FH8 period, it reached the highest value of 106.25 ± 15.48 μg/L. As an important aroma substance produced in the tea manufacturing process, methyl salicylate provides fresh, grassy, faint gingery, minty, and milky odors, which might be mainly derived from the product of the hydrolysis of β-glucosidase and β-prime-veroside enzymes secreted by E. cristatum[4,28].
Normally, ketones with low threshold values shape the tea aroma to the greatest extent, such as α-Ionone and 3-methyl-2(5H)-furanone[10]. As the degradation products of β-carotene, α-Ionone and β-Ionone belong to the volatile compounds derived from carotenoids[29]. In this study, the content of β-Ionone (floral, violet) decreased significantly along with the manufacturing process, from 55.71 ± 2.53 μg/L in the RM stage to 14.71 ± 1.21 μg/L in the GZ8 stage. The content of α-Ionone (woody, floral, and violet) reached the highest level in the FH4 stage (9.19 ± 1.65 μg/L), and then decreased to 2.48 ± 0.08 μg/L in the GZ8 stage.
Alcohols were found to be another group of important volatile compounds in five GFWT samples, among which linalool was one of the most important, with the content fluctuating at different stages and reaching a maximum value of 108.3 ± 11.73 μg/L in the FH4 stage. Moreover, the oxidized products of linalool, such as (Z)-linalool oxide, (E)-linalool oxide, (E)-Linalool oxide (pyranoid), and (Z)-linalool oxide (pyranoid) were detected in five samples. Linalool and its oxides bring floral, citrusy, and sweet aromas to the tea[13,30]. The content of geraniol with rose aroma peaked in the FH0 stage, but decreased remarkably along with the manufacturing process, from 338.51 ± 11.26 μg/L (FH0 stage) to 280.34 ± 18.08 μg/L (FH8 stage). Other low-content alcohols, such as α-Terpineol, (E)-Nerolidol, 1-Octen-3-ol, and (+)-Cedrol, also contributed to the formation of the key aromas during the tea manufacturing process[17], and they might give GFWT clove, citrus, woody, and mushroom aroma. The specific contribution of each VOC to the aroma of GFWT still needs to be further analyzed.
Multivariate statistical analysis of volatile components
-
PLS-DA model, with the parameters of (R2Y = 0.99, Q2 = 0.979) were employed to analyze the volatile components identified by GC-MS. Corresponding to the GC-IMS results, the PLS-DA results obtained by GC-MS also showed obviously different volatile components of the five samples (Fig. 6a). Furthermore, it indicated that steaming and flowering process from the 4th to 8th days had a great impact on the volatile metabolites of GFWT. The parameters of the replacement test (R2 = 0.189 and Q2 = −0.676) demonstrated that the validated model fits well (Fig. 6b).
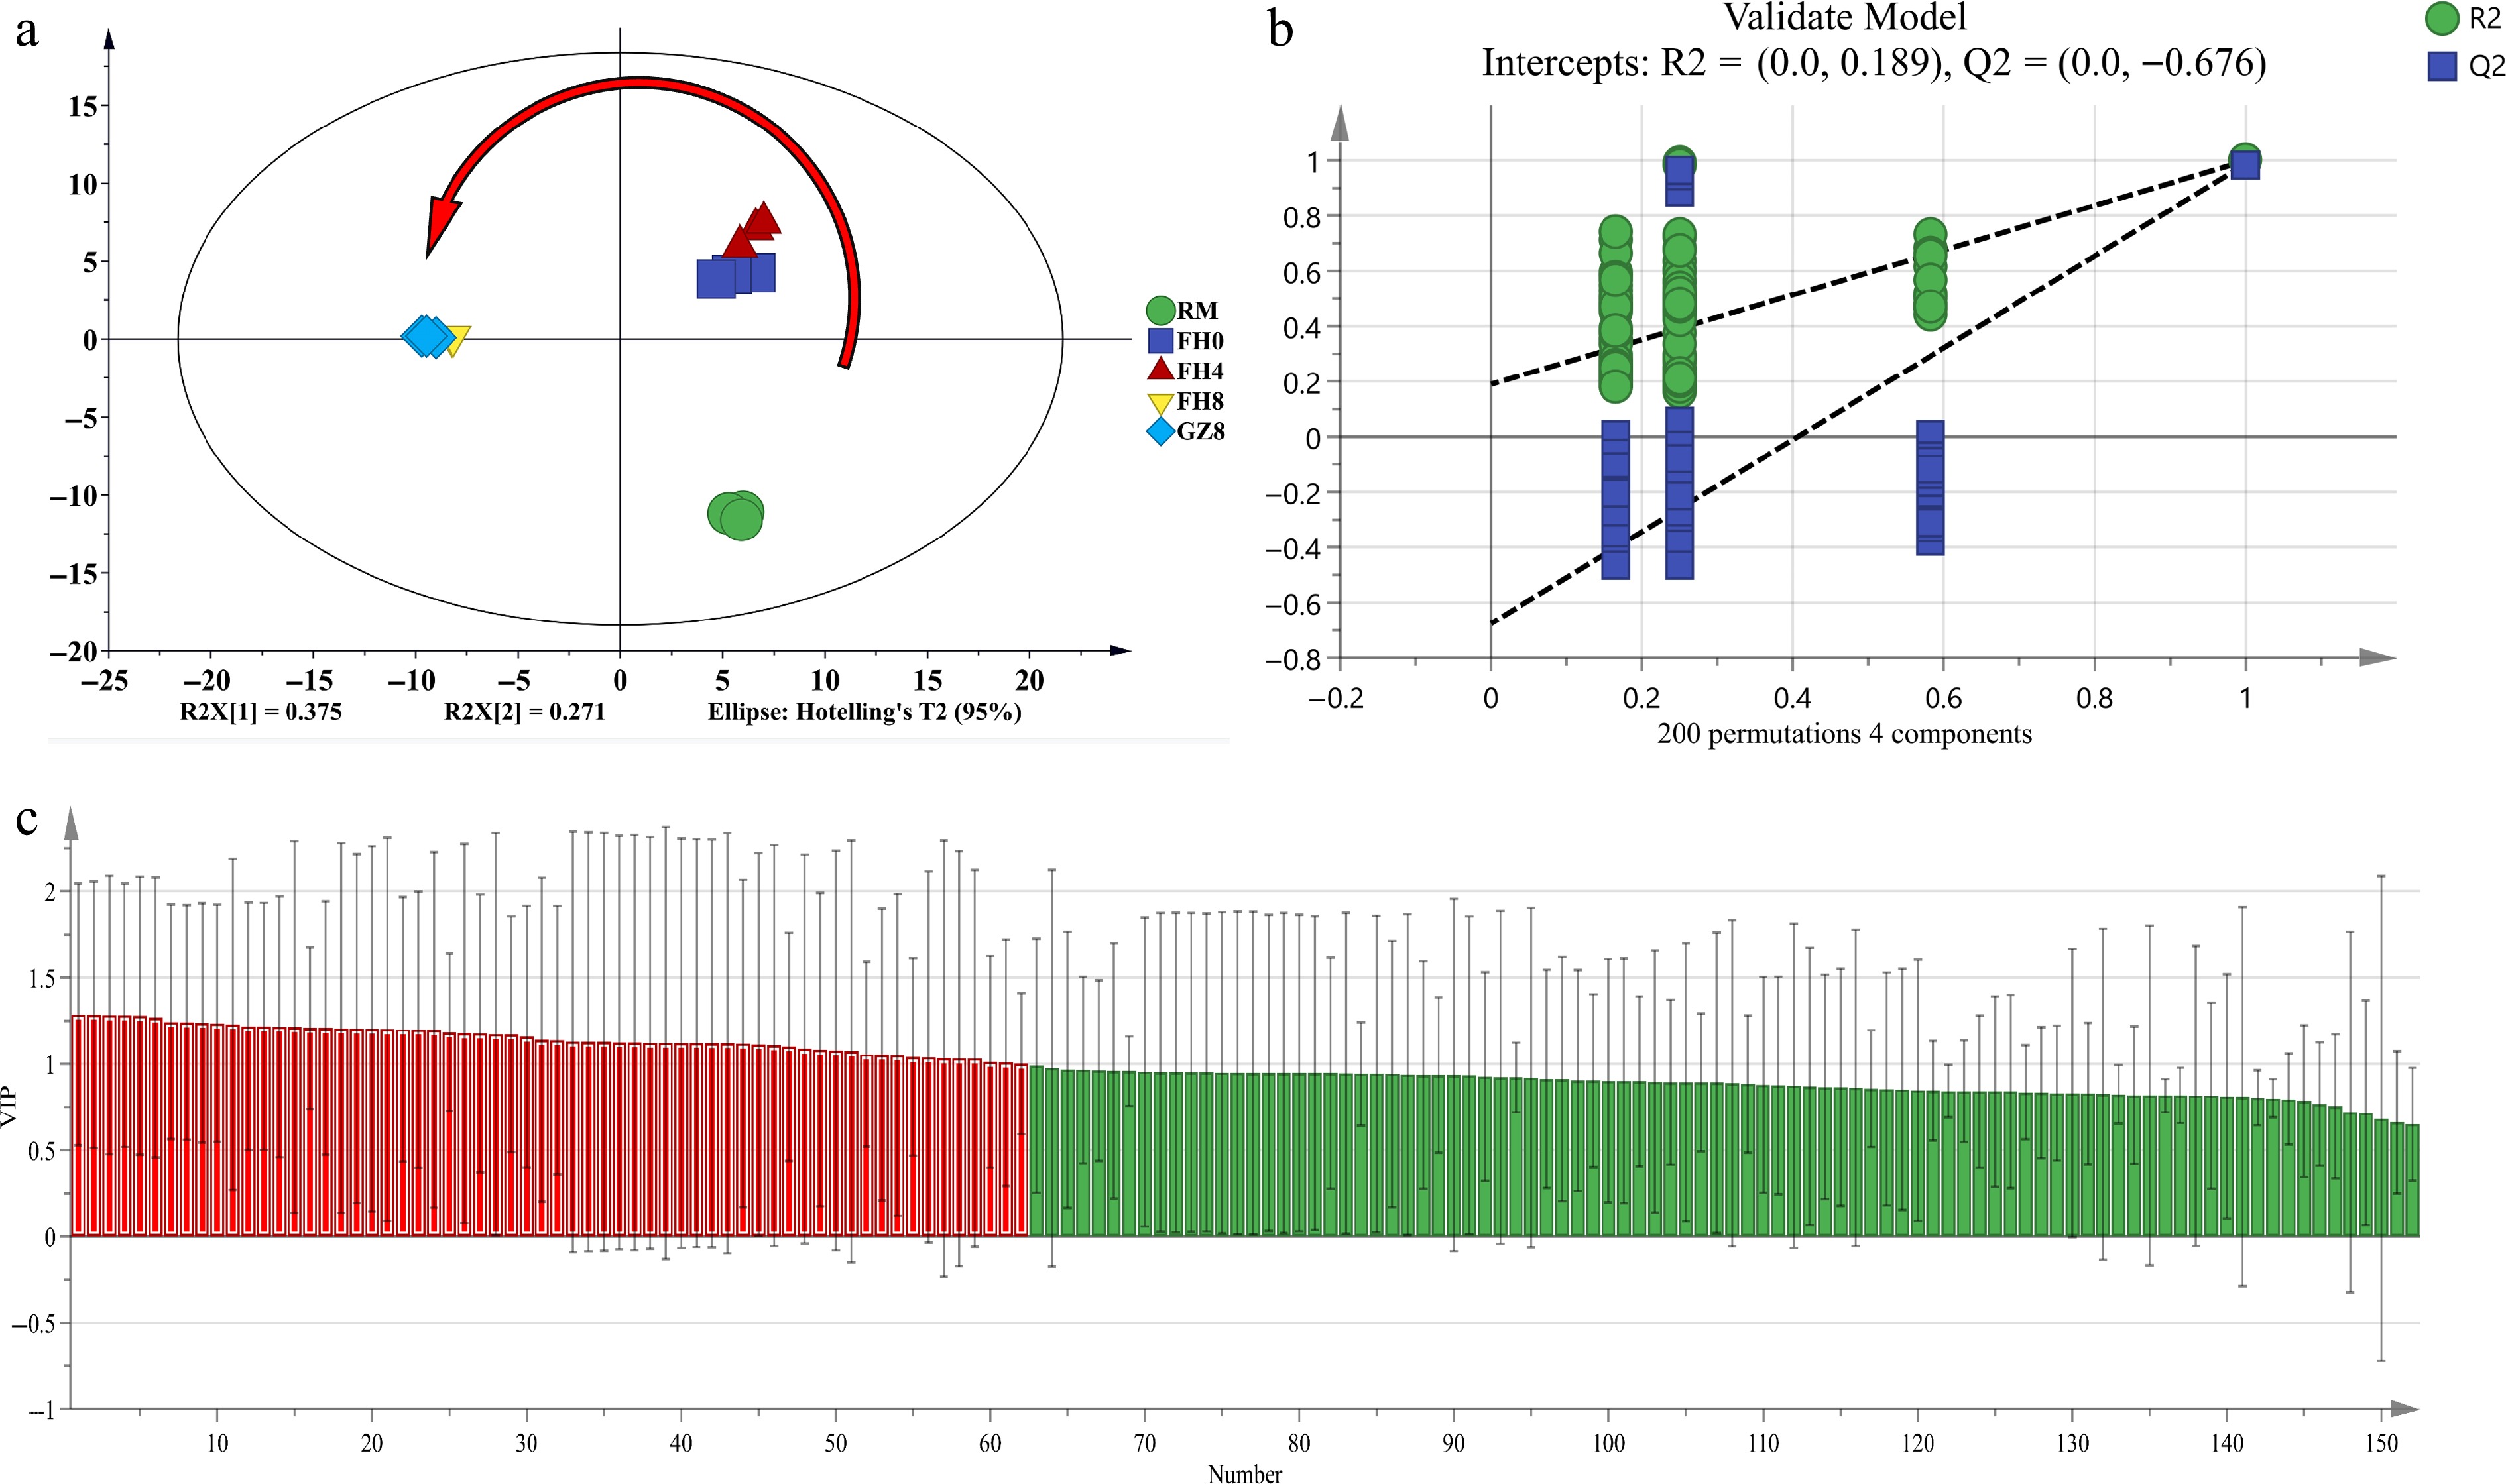
Figure 6.
The PLS-DA results of GFWT samples at five processing stages by GC-MS. (a) Scores graph of PLS-DA (R2Y = 0.99, Q2 = 0.979). (b) Cross-validation graph by 200 permutation tests (R2 = 0.189, Q2 = −0.676). (c) The red zone indicates the most distinctive compounds with VIP > 1.
Moreover, the VIP values were calculated to figure out the crucial volatile compounds that contributed most to the different aromas of the five samples. It was found that the VIP values of 62 volatile compounds were greater than 1, which were then set as the differential variables (Fig. 6c). Analysis on the key variables with VIP > 1 showed that 1-octen-3-ol and 2-heptanone obtained by both GC-MS and GC-IMS were the key differential variables of the volatile compounds.
Key volatile components during the manufacturing process
-
The volatile components with concentrations above the threshold are known as the main aroma of the tea. The present research has found 17 aroma substances, mainly consisting of alcohols and aldehydes (Table 1), with ROAV > 1 during the five main processing stages of the GFWT. Importantly, in all five processing stages, the ROAV values of β-ionone, linalool, phenylethyl alcohol, geraniol, nonanal, and α-Terpineol were all greater than 1. What's more, β-ionone had the highest ROVA of 147.13, thus might be the key aroma components of GFWT. In addition, (E)-2-nonenal (ROAV = 7.14, fatty and green), linalool (ROAV = 6.88, coriander and floral aroma), and phenylethyl alcohol (ROAV = 6.79, floral and rose aroma) contributed to the aroma formation of GFWT to different extents. It was worth noting that some aldehydes in RM, such as (2E,4E)-2, 4-decadienal (ROAV = 174.14, fatty and melon) and (2E,4E)-2, 4-nonadienal (ROAV = 54.19, fatty and green) with high aroma disappeared along with the processing stage. However, the aroma substances such as methyl salicylate (ROAV = 1.56, almond, caramel, and peppermint), 1-Octen-3-ol (ROAV = 6.89, Mushroom-like), and γ-dodecalactone (ROAV = 1.74, fatty, peach, sweet, and fruity) gradually appeared in the late processing stage and formed the unique aroma quality of GFWT.
Table 1. The specific ROAVs of 17 volatile compounds in GFWT during the whole process.
Volatile compounds ROAVs RM FH0 FH4 FH8 GZ8 (2E,4E)-2,4-Decadienal 174.14 − − − − (2E,4E)-2,4-Nonadienal 54.19 − − − − (E)-2-Nonenal 38.37 12.56 16.59 − 7.14 Hexanal 2.46 0.46 − 0.58 0.47 β−Cyclocitral 1.32 0.67 0.73 0.34 − Octanal 1.47 − − − − 1-Octen-3-ol − − − 6.89 − β−Ionone 557.05 402.26 403.12 182.66 147.13 Linalool 11.52 17.80 18.05 11.71 6.88 Phenylethyl alcohol 16.98 28.51 24.63 8.52 6.79 Geraniol 3.75 33.85 28.03 7.51 5.13 Methyl salicylate 0.39 1.61 1.68 3.04 1.56 Nonanal 6.68 3.46 3.88 2.41 3.02 α−Terpineol 1.81 2.20 2.45 1.49 1.06 β−Myrcene 0.94 5.37 4.60 1.45 1.00 α−Ionone 2.77 1.97 2.43 0.99 0.66 γ−Dodecalactone − − − − 1.74 Integrated data analysis
Overlap of key compounds between GC-IMS and HS-SPME-GC-MS
-
A Venn diagram was constructed to visually display the intersection of key VOCs (ROAV > 1) between GC-IMS and HS-SPME-GC-MS (Fig. 7). The results showed that 31 volatile compounds were unique in GC-IMS, 13 volatile compounds were unique in GC-MS, and four compounds were identified in both GC-IMS and GC-MS. Among the four common compounds including 1-octen-3-ol (mushroom-like aroma), hexanal (green aroma), octanal (green-fruity aroma), and nonanal (green-woody aroma). These compounds were not only detected by both GC-IMS and GC-MS but also exhibited consistent variation trends. Thus, these four volatile compounds were probably the core consensus compounds that contribute to the flavor of GFWT.
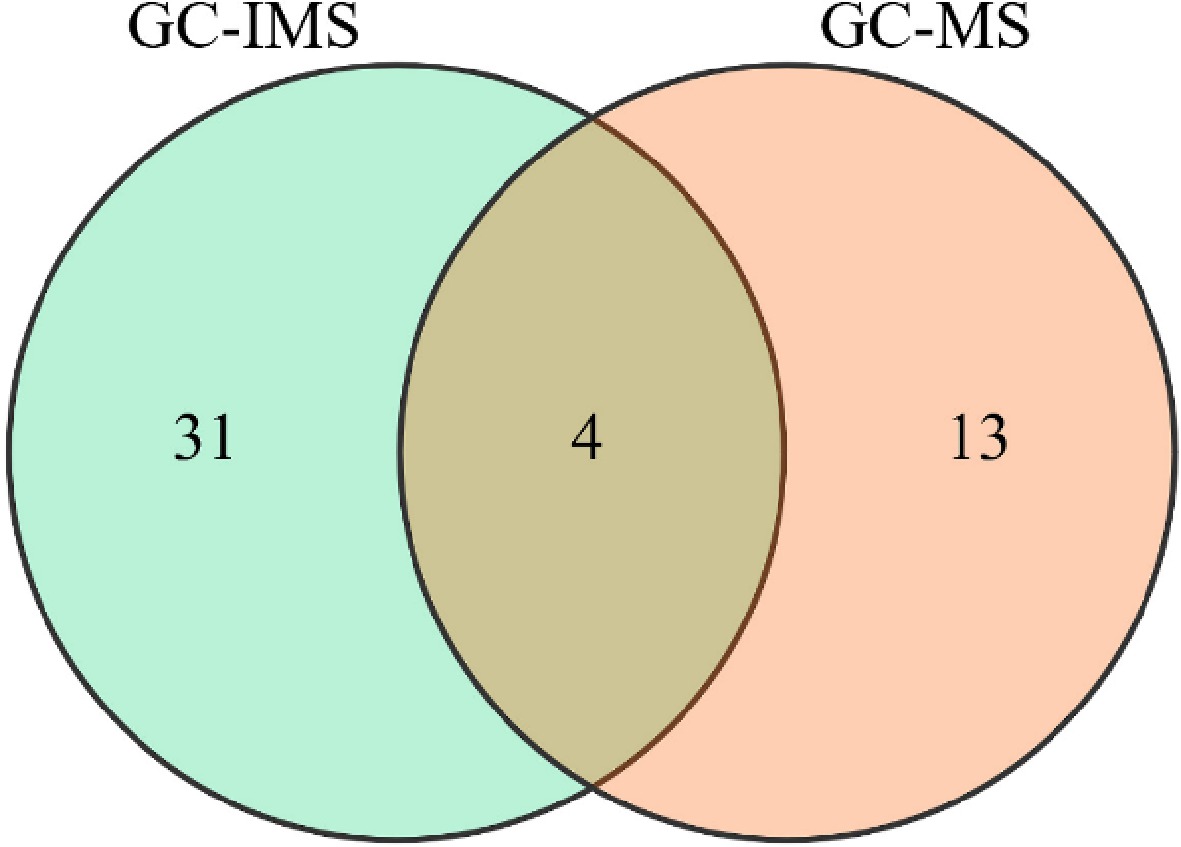
Figure 7.
Venn diagram of key volatile compounds (ROAV > 1) detected by GC-IMS and HS-SPME-GC-MS.
1-octen-3-ol is the key contributor to mushroom-like aroma. Its monomer (M) and dimer (D) forms were detected by GC-IMS, and their ROAV values were 21.07 (for M, FH8), and 18.52 (for D, FH8), respectively. 1-octen-3-ol was also detected by GC-MS, and its absolute concentration was 68.5 ± 4.2 μg/L (FH8), and the value of ROAV was 6.89. Although the ROAV values differed by the two methods (due to GC-IMS using relative peak areas while GC-MS using absolute concentrations), these results confirmed that 1-octen-3-ol peaked in FH8 and decreased slightly in GZ8. This indicated that 1-octen-3-ol may as the signature compound of E. cristatum fermentation. Similarly, the content of hexanal with floral and green aromas decreased by 82% from RM to GZ8. This directly corresponded to the attenuation of the floral-like green aroma in the sensory evaluation. These results revealed the aroma dynamic changes during the formation process of GFWT, including the disappearance of green aroma and the generation of mushroom-like aroma.
Correlation between volatile compounds and sensory evaluation
-
To further clarify the relationship between sensory properties and volatile organic compounds (VOCs), a correlation analysis was conducted between compounds with ROAV > 1 and sensory evaluation scores (Table 2). Significant positive correlations were observed between short-chain aldehydes and the green aroma in GC-MS and GC-IMS. (2E,4E)-2,4-decadienal (r = 0.95*), (2E,4E)-2,4-nonadienal (r = 0.95*), hexanal (r = 0.88*), and octanal (r = 0.95*) were identified by GC-MS, which have highly positive correlation with green aroma, and exhibited the highest ROAV value in RM. However, these compounds were undetected in the late processing stages. The similar result also appeared in the analysis of GC-IMS, 1-pentanal (r = 1.00***), and 2-pentylfuran (r = 0.97**) which have positive correlation with green aroma, were detected the highest peak in RM. These results collectively explained the attenuation of the green aroma of white tea during the traditional flowering process. In addition, terpenols and aromatic aldehydes showed strong positive correlations with floral aroma. Such as geraniol (r = 0.82, ROAV value was 33.85 in FH0), β-myrcene (r = 0.83), linalool (r = 0.88, ROAV value was 18.05 in FH4), phenylethanol (r = 0.99**, ROAV value was 28.51 in FH0), and α-terpineol (r = 0.93*), which showed a floral aroma, were identified by GC-MS. Meanwhile, 3-methylbutanal D (r = 0.84) and (Z)-3-hexenol D (r = 0.97**), which have high correlation with floral aroma, were detected by GC-IMS, and the highly peak was exhibited in the flowering process of FH0 and FH4. Some floral and mushroom-like aroma compounds peaked in FH8 and GZ8 such as, 1-octen-3-ol (r = 0.58, ROAV value was 6.89 in FH8) and 2-methylpentanal (r = 0.86) were identified in GC-MS and GC-IMS, respectively. This was probably due to the oxidative degradation of linoleic and linolenic acids by the extracellular oxidoreductases, which were secreted by E. cristatum, resulting in the formation of 1-octen-3-ol and its related metabolite compounds, which appeared floral and mushroom-like flavor[13].
Table 2. Pearson correlation analysis between key volatile compounds (VOCs) with ROAV > 1 and the sensory aroma attributes of GFWT.
Compound name Sensory evaluation Green Floral Fruity Woody Mushroom-like GC-MS (2E,4E)-2,4-Decadienal 0.95* 0.12 −0.55 −0.41 −0.41 (2E,4E)-2,4-Nonadienal 0.95* 0.12 −0.55 −0.41 −0.41 (E)-2-Nonenal 0.98** 0.47 −0.85 −0.72 −0.71 Hexanal 0.88* −0.03 −0.39 −0.26 −0.26 β−Cyclocitral 0.93* 0.62 −0.83 −0.82 −0.83 Octanal 0.95* 0.12 −0.55 −0.41 −0.41 1-Octen-3-ol −0.41 −0.58 0.75 0.61 0.58 β−Ionone 0.89* 0.77 −0.94* −0.93* −0.93* Linalool 0.09 0.88 −0.55 −0.75 −0.76 Phenylethyl alcohol 0.29 0.99** −0.76 −0.90* −0.90* Geraniol −0.18 0.82 −0.41 −0.60 −0.60 Methyl salicylate −0.82 −0.44 0.81 0.63 0.61 Nonanal 0.99** 0.39 −0.79 −0.65 −0.64 α−Terpineol 0.30 0.93* −0.72 −0.87 −0.88 β−Myrcene −0.16 0.83 −0.42 −0.62 −0.62 α−Ionone 0.82 0.81 −0.94* −0.94* −0.95* γ−Dodecalactone −0.41 −0.58 0.42 0.61 0.64 GC-IMS Butanoic acid, 3-methyl-, ethyl ester −0.91* −0.01 0.46 0.31 0.31 3-Methyl butanal M 0.64 −0.25 −0.04 0.02 0.01 3-Methyl butanal D 0.56 0.84 −0.72 −0.84 −0.84 1-Octen-3-ol M −0.40 −0.40 0.63 0.45 0.42 n-Octanal 0.38 −0.58 0.17 0.37 0.38 n-Nonanal −0.08 −0.85 0.54 0.73 0.74 2-Methylpentanal −0.52 −0.82 0.69 0.84 0.86 2,3-Butanedione −0.68 −0.64 0.84 0.73 0.71 2(5H)-Furanone, 3-hydroxy-4,5-dimethyl- −0.64 0.20 0.34 0.06 0.05 2-phenylacetaldehyde M −0.91* −0.17 0.57 0.46 0.46 1-Octen-3-ol D −0.56 −0.66 0.84 0.72 0.69 Heptanal M 0.67 −0.38 −0.08 0.10 0.11 1-Hexanal 0.95* 0.34 −0.64 −0.57 −0.58 2-Octanol −0.48 −0.59 0.78 0.64 0.61 Heptanal D 0.90* 0.00 −0.45 −0.29 −0.29 1-Penten-3-one 0.80 0.46 −0.59 −0.60 −0.61 2-methyl Butanal 0.70 0.82 −0.79 −0.88 −0.88* (E)-2-Heptenal M −0.19 0.30 0.08 −0.13 −0.14 2-Octanone M −0.30 0.05 −0.02 0.00 0.00 2-Phenylacetaldehyde D −0.56 0.48 0.01 −0.19 −0.19 (E)-2-Octenal 0.87 −0.06 −0.36 −0.22 −0.22 2-Pentyl furan 0.97** 0.52 −0.77 −0.73 −0.74 2-Ethyl-6-methylpyrazine −0.13 −0.82 0.53 0.73 0.74 2-Hexenal M 0.51 −0.56 0.11 0.30 0.30 1,8 Cineole 0.85 −0.11 −0.34 −0.19 −0.19 2-Hexenal D 0.69 0.85 −0.84 −0.90* −0.90* Butanal 0.88* 0.75 −0.88* −0.89* −0.90* 2-Hexanone −0.44 −0.09 0.09 0.17 0.18 Butyl propanoate D 0.43 −0.64 0.18 0.37 0.37 (E)-2-Heptenal D 0.15 0.93* −0.71 −0.80 −0.79 1-Pentanal 1.00*** 0.40 −0.76 −0.66 −0.66 (E,E)-2,4-Heptadienal 0.79 −0.20 −0.22 −0.09 −0.09 Butyl propanoate M 0.96** 0.15 −0.59 −0.44 −0.44 (Z)-3-hexenol D 0.39 0.97** −0.77 −0.90* −0.90* The correlation coefficient was calculated using the Pearson method. The significance levels are marked as: * p < 0.05, ** p < 0.01, *** p < 0.001. -
These results showed that the VOCs of the white tea changed considerably during the traditional Fu brick tea manufacturing process. In this study, 59 VOCs were identified by GC-IMS, and 152 VOCs were detected by HS-SPME-GC-MS, which offered a synthetic evaluation on the dynamic changes of volatile compounds during the whole manufacturing process. Both methods showed that the steaming and the flowering process from the 4th to 8th days had the greatest influence on the aroma of GFWT. After the white tea was processed into GFWT, the VOCs content of certain aldehydes decreased or disappeared, but the one that was crucial to the unique flavor of GFWT increased or appeared. Correlation between sensory attributes and volatile compounds revealed that the formation of mushroom-like aroma and attenuation of green aroma were the hallmarks of GFWT's quality evolution. The results show that the traditional process of Fu brick tea generates new aromas for the white tea, which potentially establishes a theoretical basis for expanding the categories and enhancing the quality of the white tea products.
This study was supported by Key Research and Development Program of Shaanxi Provincial (2023-YBNY-145, 2025NC-YBXM-143), Scientific and Technological Innovation Support Plan of Xianyang City (L2023-CXNL-CXRC-008), Local Government Cooperation Project of Jingyang County (K4050122051).
-
The authors confirm their contributions to the paper as follows: writing original draft preparation: Zhan X, Meng Y; writing-review and editing: Zhan X, Meng Y, Gu B, Gao Y; investigation: Zhan X, Meng Y, Gu B, Liu F, Gao Y; validation: Liu F; Guo H; project administration: Gao Y; Xiao B; supervision: Gao Y; Xiao B. All authors reviewed the results and approved the final version of the manuscript.
-
All data generated or analyzed during this study are included in this published article and its supplementary information files.
-
The authors declare that they have no conflict of interest.
-
# Authors contributed equally: Xihua Zhan, Yang Meng
- Supplementary Table S1 The information of volatile compounds identified by GC-IMS.
- Supplementary Table S2 The specific ROAVs of volatile compounds identified by GC-IMS in GFWT during the whole process.
- Supplementary Table S3 The information of volatile compounds identified by GC-MS.
- Copyright: © 2026 by the author(s). Published by Maximum Academic Press, Fayetteville, GA. This article is an open access article distributed under Creative Commons Attribution License (CC BY 4.0), visit https://creativecommons.org/licenses/by/4.0/.
-
About this article
Cite this article
Zhan X, Meng Y, Gu B, Liu F, Guo H, et al. 2026. Dynamic aroma compounds in golden flower white tea based on the traditional flowering process. Beverage Plant Research 6: e007 doi: 10.48130/bpr-0025-0037 

Dynamic aroma compounds in golden flower white tea based on the traditional flowering process
- Received: 09 June 2025
- Revised: 12 September 2025
- Accepted: 05 October 2025
- Published online: 11 February 2026
Abstract: Golden Flower White Tea (GFWT) is a recently innovated tea type, for which few studies have been conducted, especially on its aroma. In this study, five processing stages of the GFWT, raw material (RM), after-steaming (FH0), 4-d flowering (FH4), 8-d flowering (FH8), and after-drying (GZ8), were investigated. After deep analysis, 59 and 152 volatile compounds were identified via GC-IMS and GC-MS, respectively, and the dynamic changes in volatile components during different stages were revealed, which significantly contributed to the study of the final aroma of the GFWT. Multivariate statistical analysis of PLS-DA revealed that steaming and mid-to-late flowering (4–8 d) stages significantly influenced volatile metabolite profiles. Key aroma compounds, including 2-octanol, 1-octen-3-ol, 2,3-butanedione, and 2-methylpentanal, were screened through relative odor activity value (ROAV) analysis, highlighting the critical role of microbial fermentation (Eurotium cristatum) in forming GFWT's characteristic creamy, mushroom-like, and floral flavor. Sensory evaluation confirmed the aroma evolution from green aroma to dominant mushroom-like flavor with fruity/woody, which strongly correlated with methyl salicylate, 1-octen-3-ol, and γ-butyrolactone. This study provides a theoretical foundation for flavor enhancement and process optimization in GFWT production.
-
Key words:
- Golden flower white tea /
- Aroma compounds /
- GC–IMS /
- HS-SPME-GC–MS