-
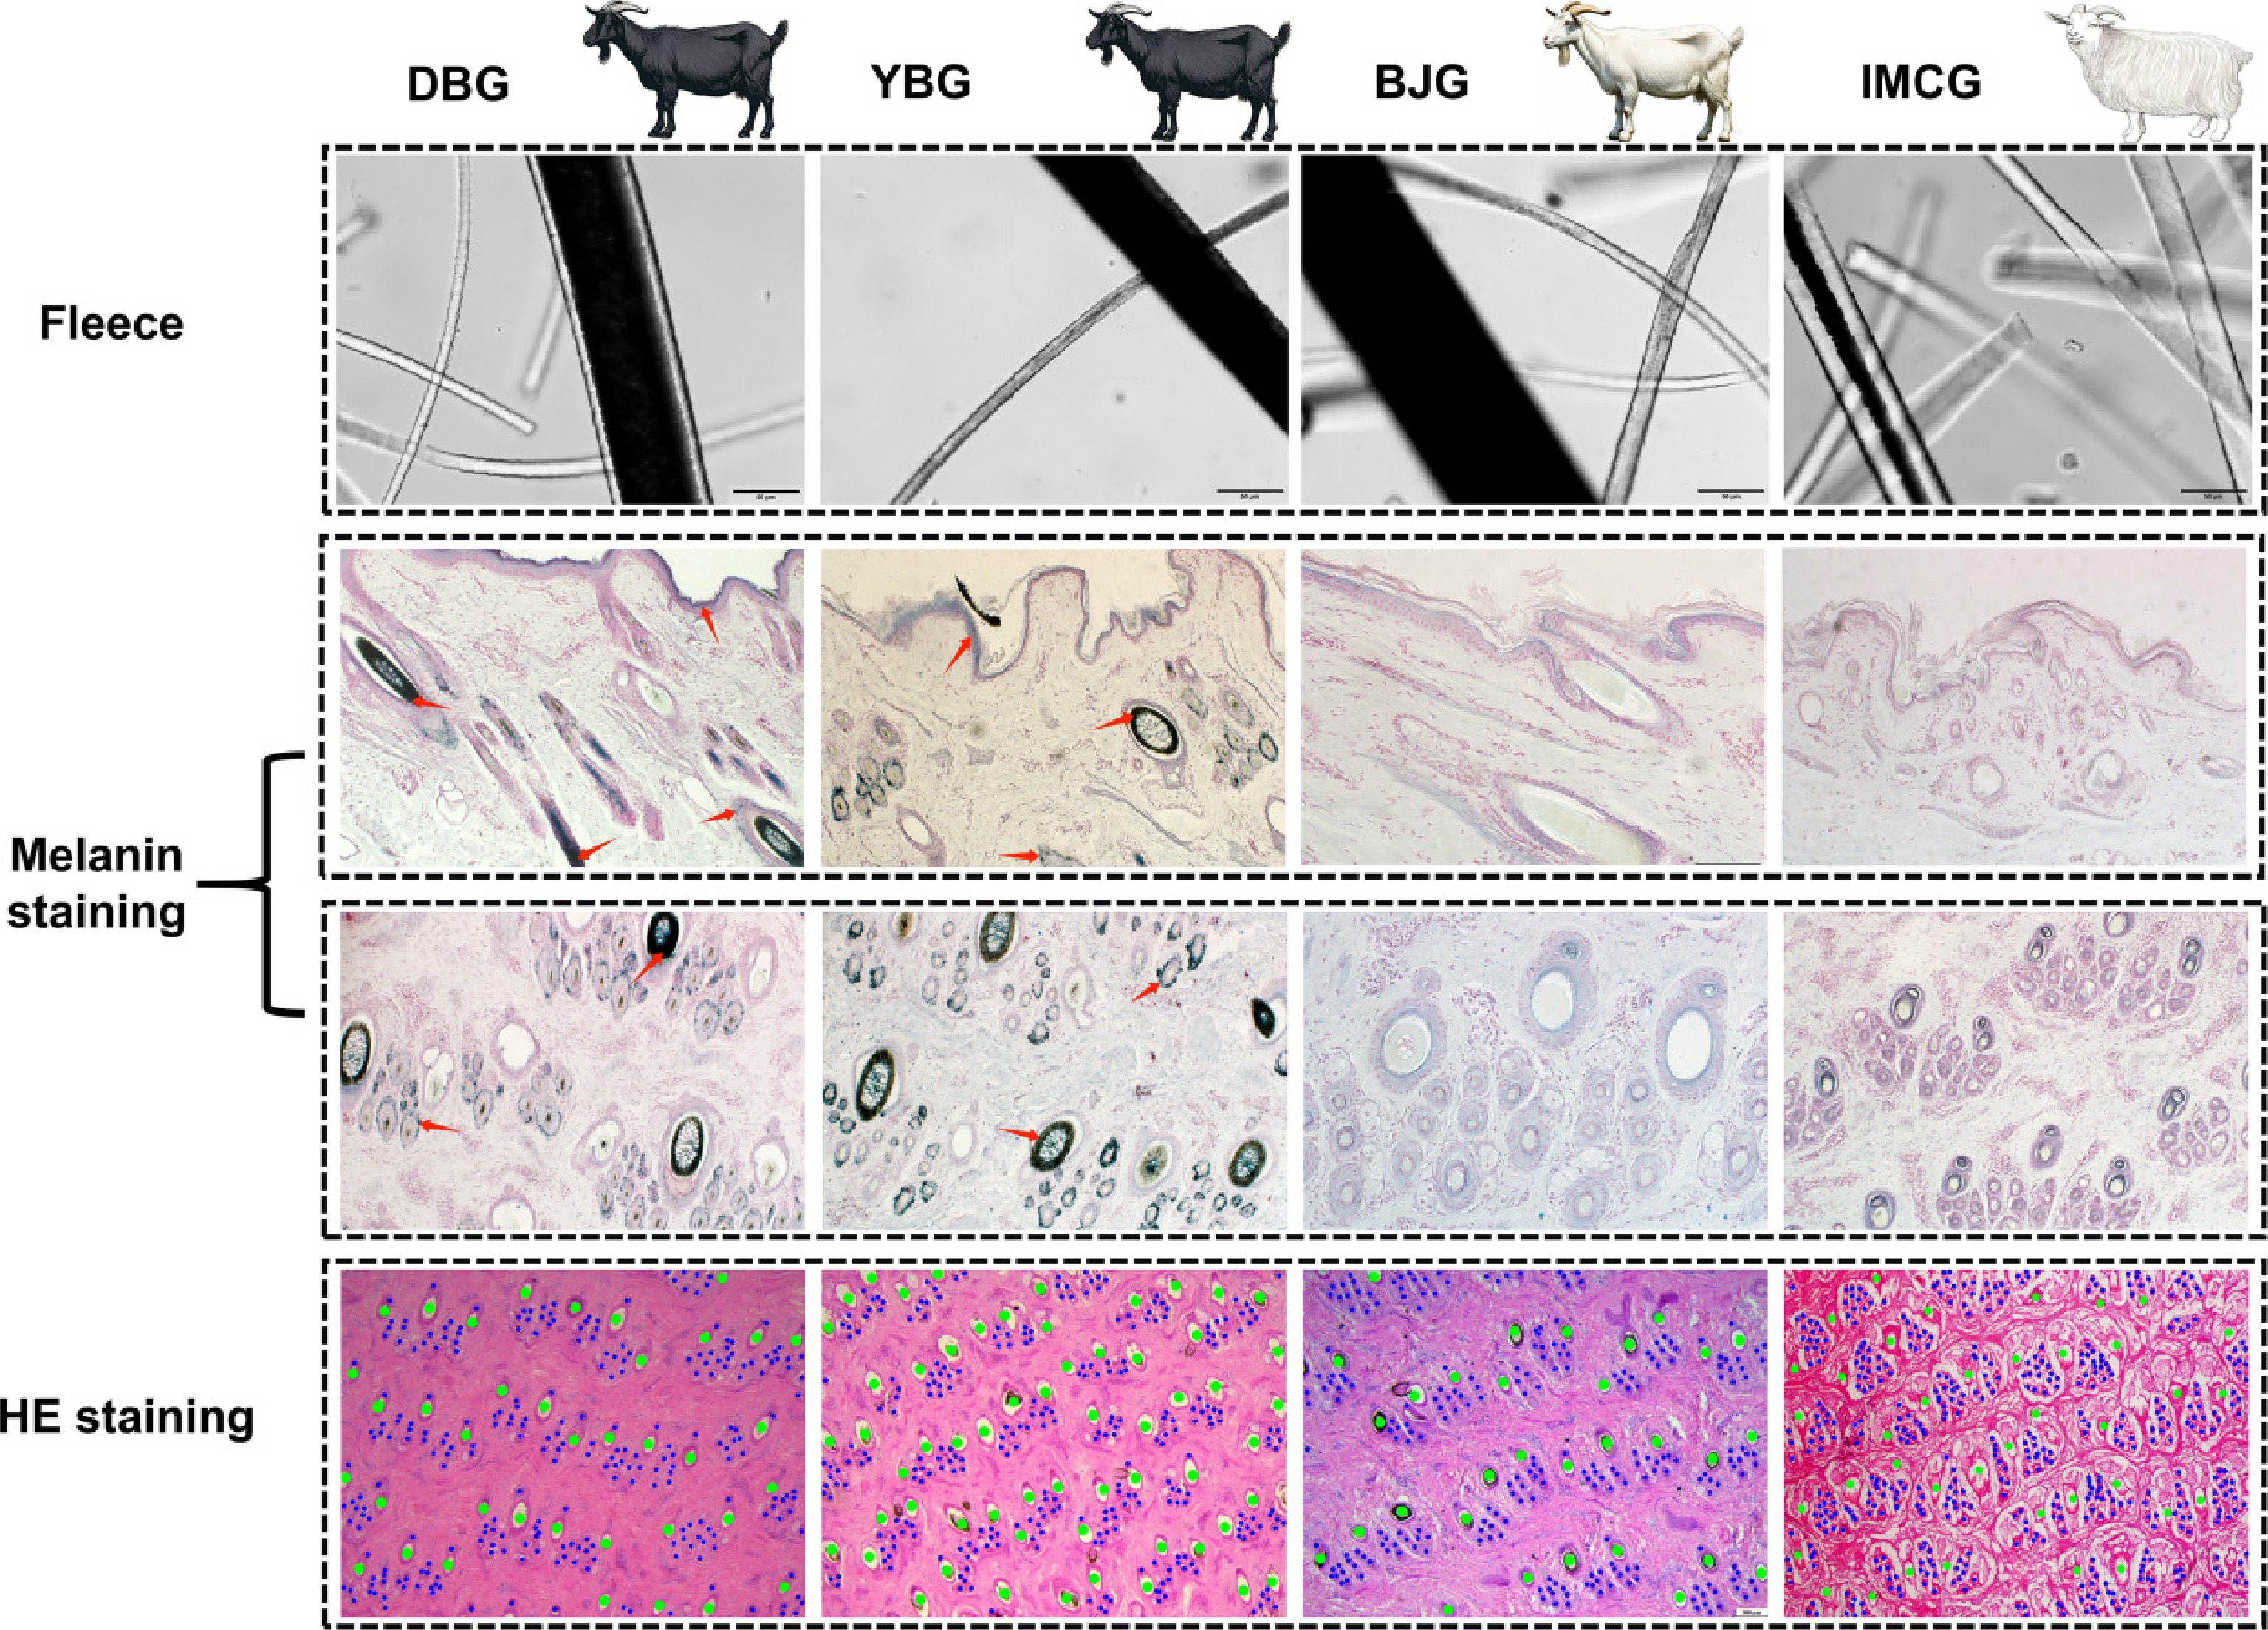
Figure 1.
Histological analysis of four native goat breeds in China. Breeds: Representative animals of DBG, YBG, BJG, and IMCG. Fleece: coarse hair and cashmere under an inverted microscope. Melanin staining: staining results from transverse and longitudinal skin slices of four breeds of goats. The red arrows point to the sites where melanin is deposited.
-
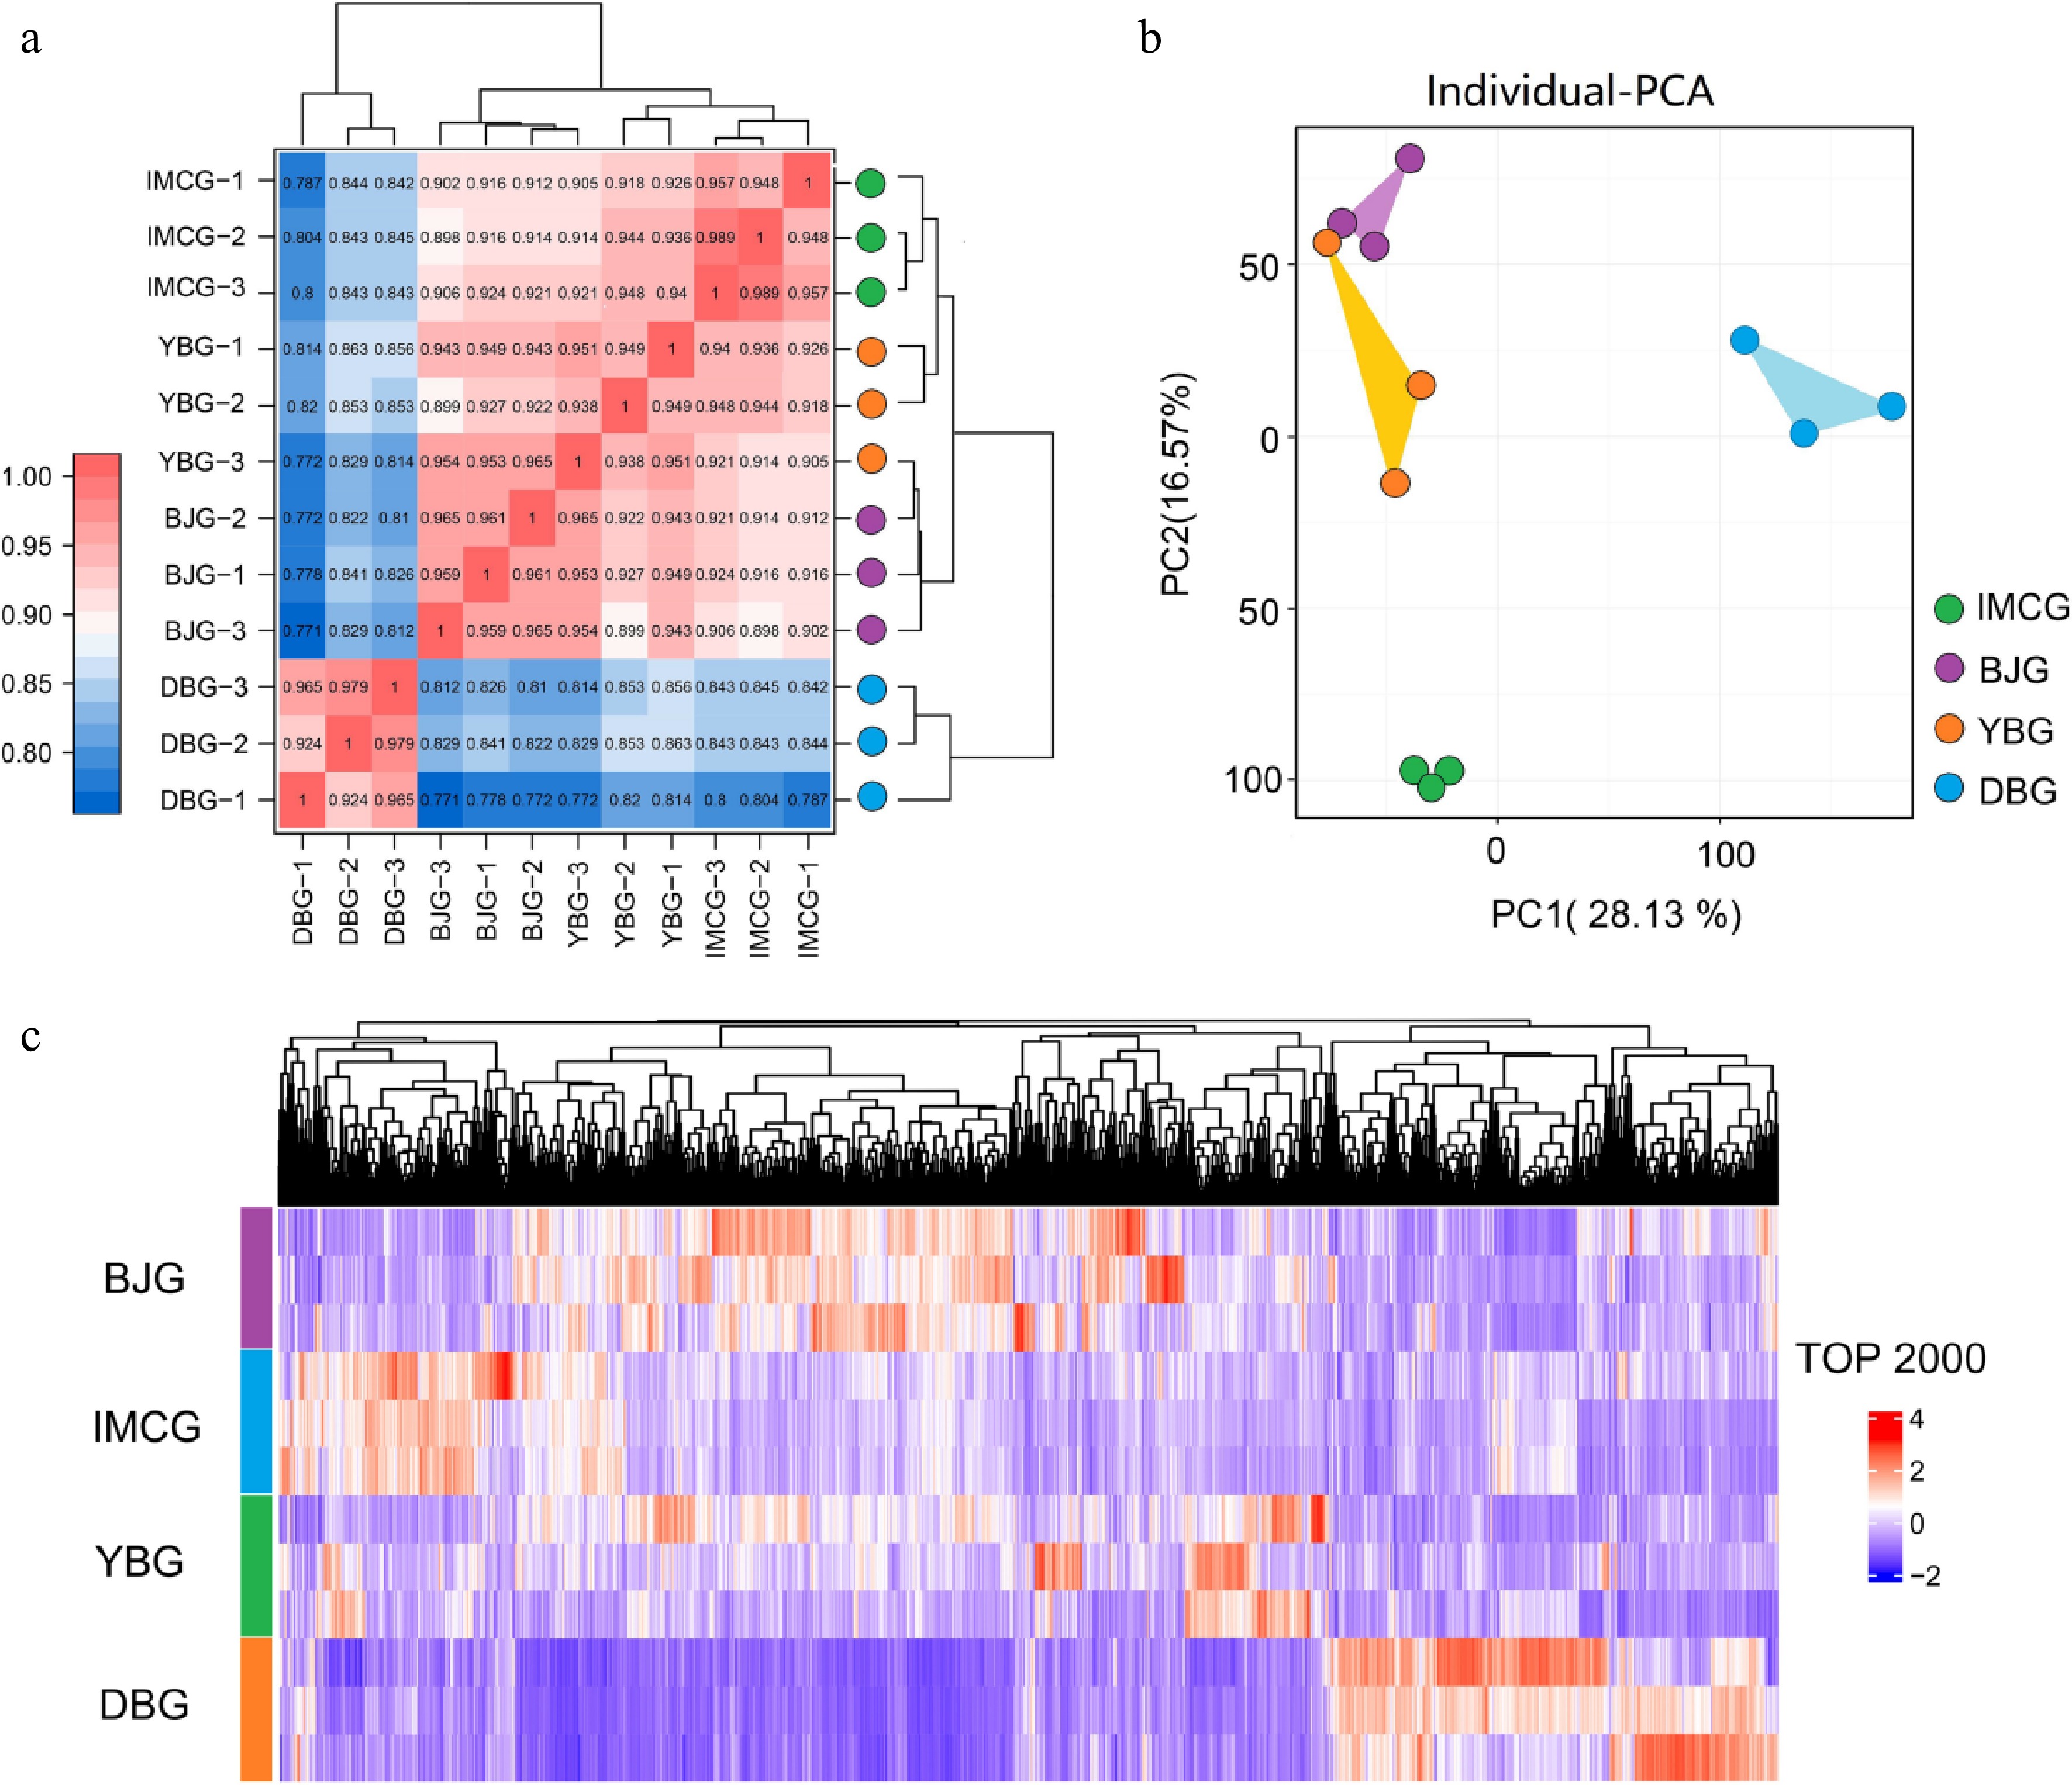
Figure 2.
Transcriptome analysis of skin tissues among four goat breeds.(a) Sample correlation heatmap; (b) PCA (principal component analysis) plot; (c) cluster heatmap of the top 2,000 genes.
-
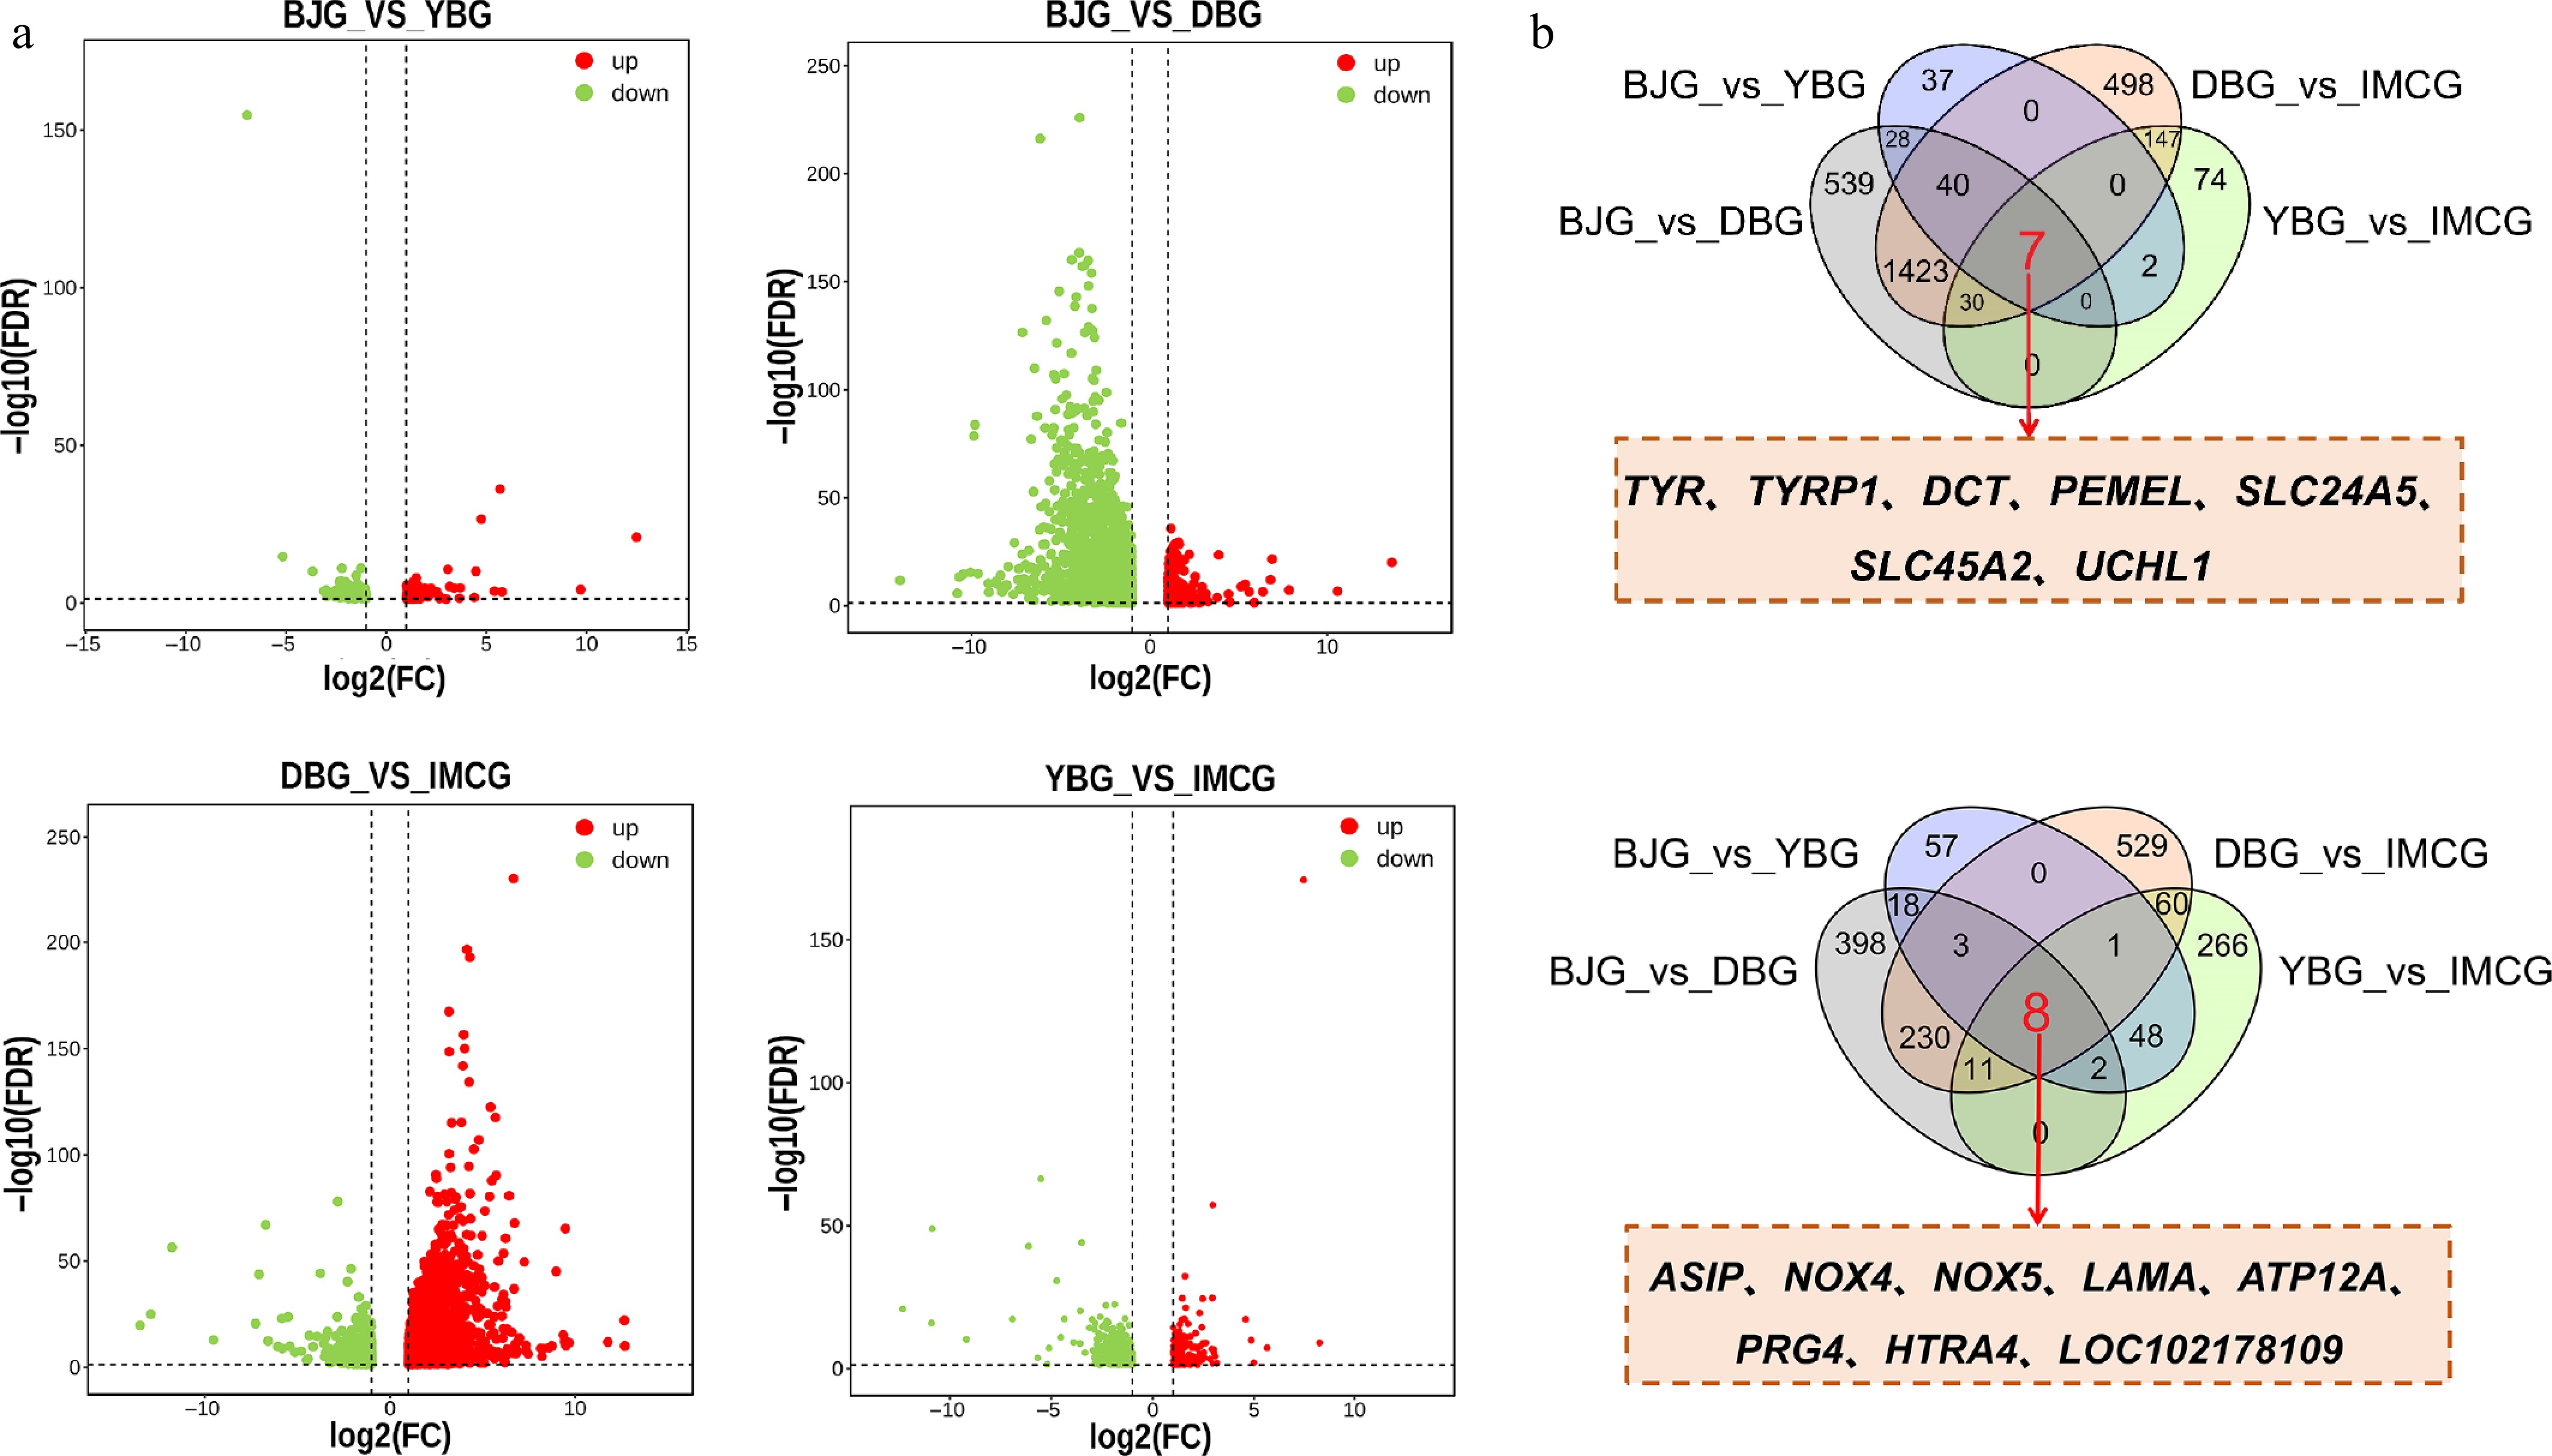
Figure 3.
Identification of core genes related to coat color.(a) Volcano plot of genes among black and white hair goats, including BJG vs YBG, BJG vs DBG, DBG vs IMCG, YBG vs IMCG; (b) overlapping genes among four comparisons.
-
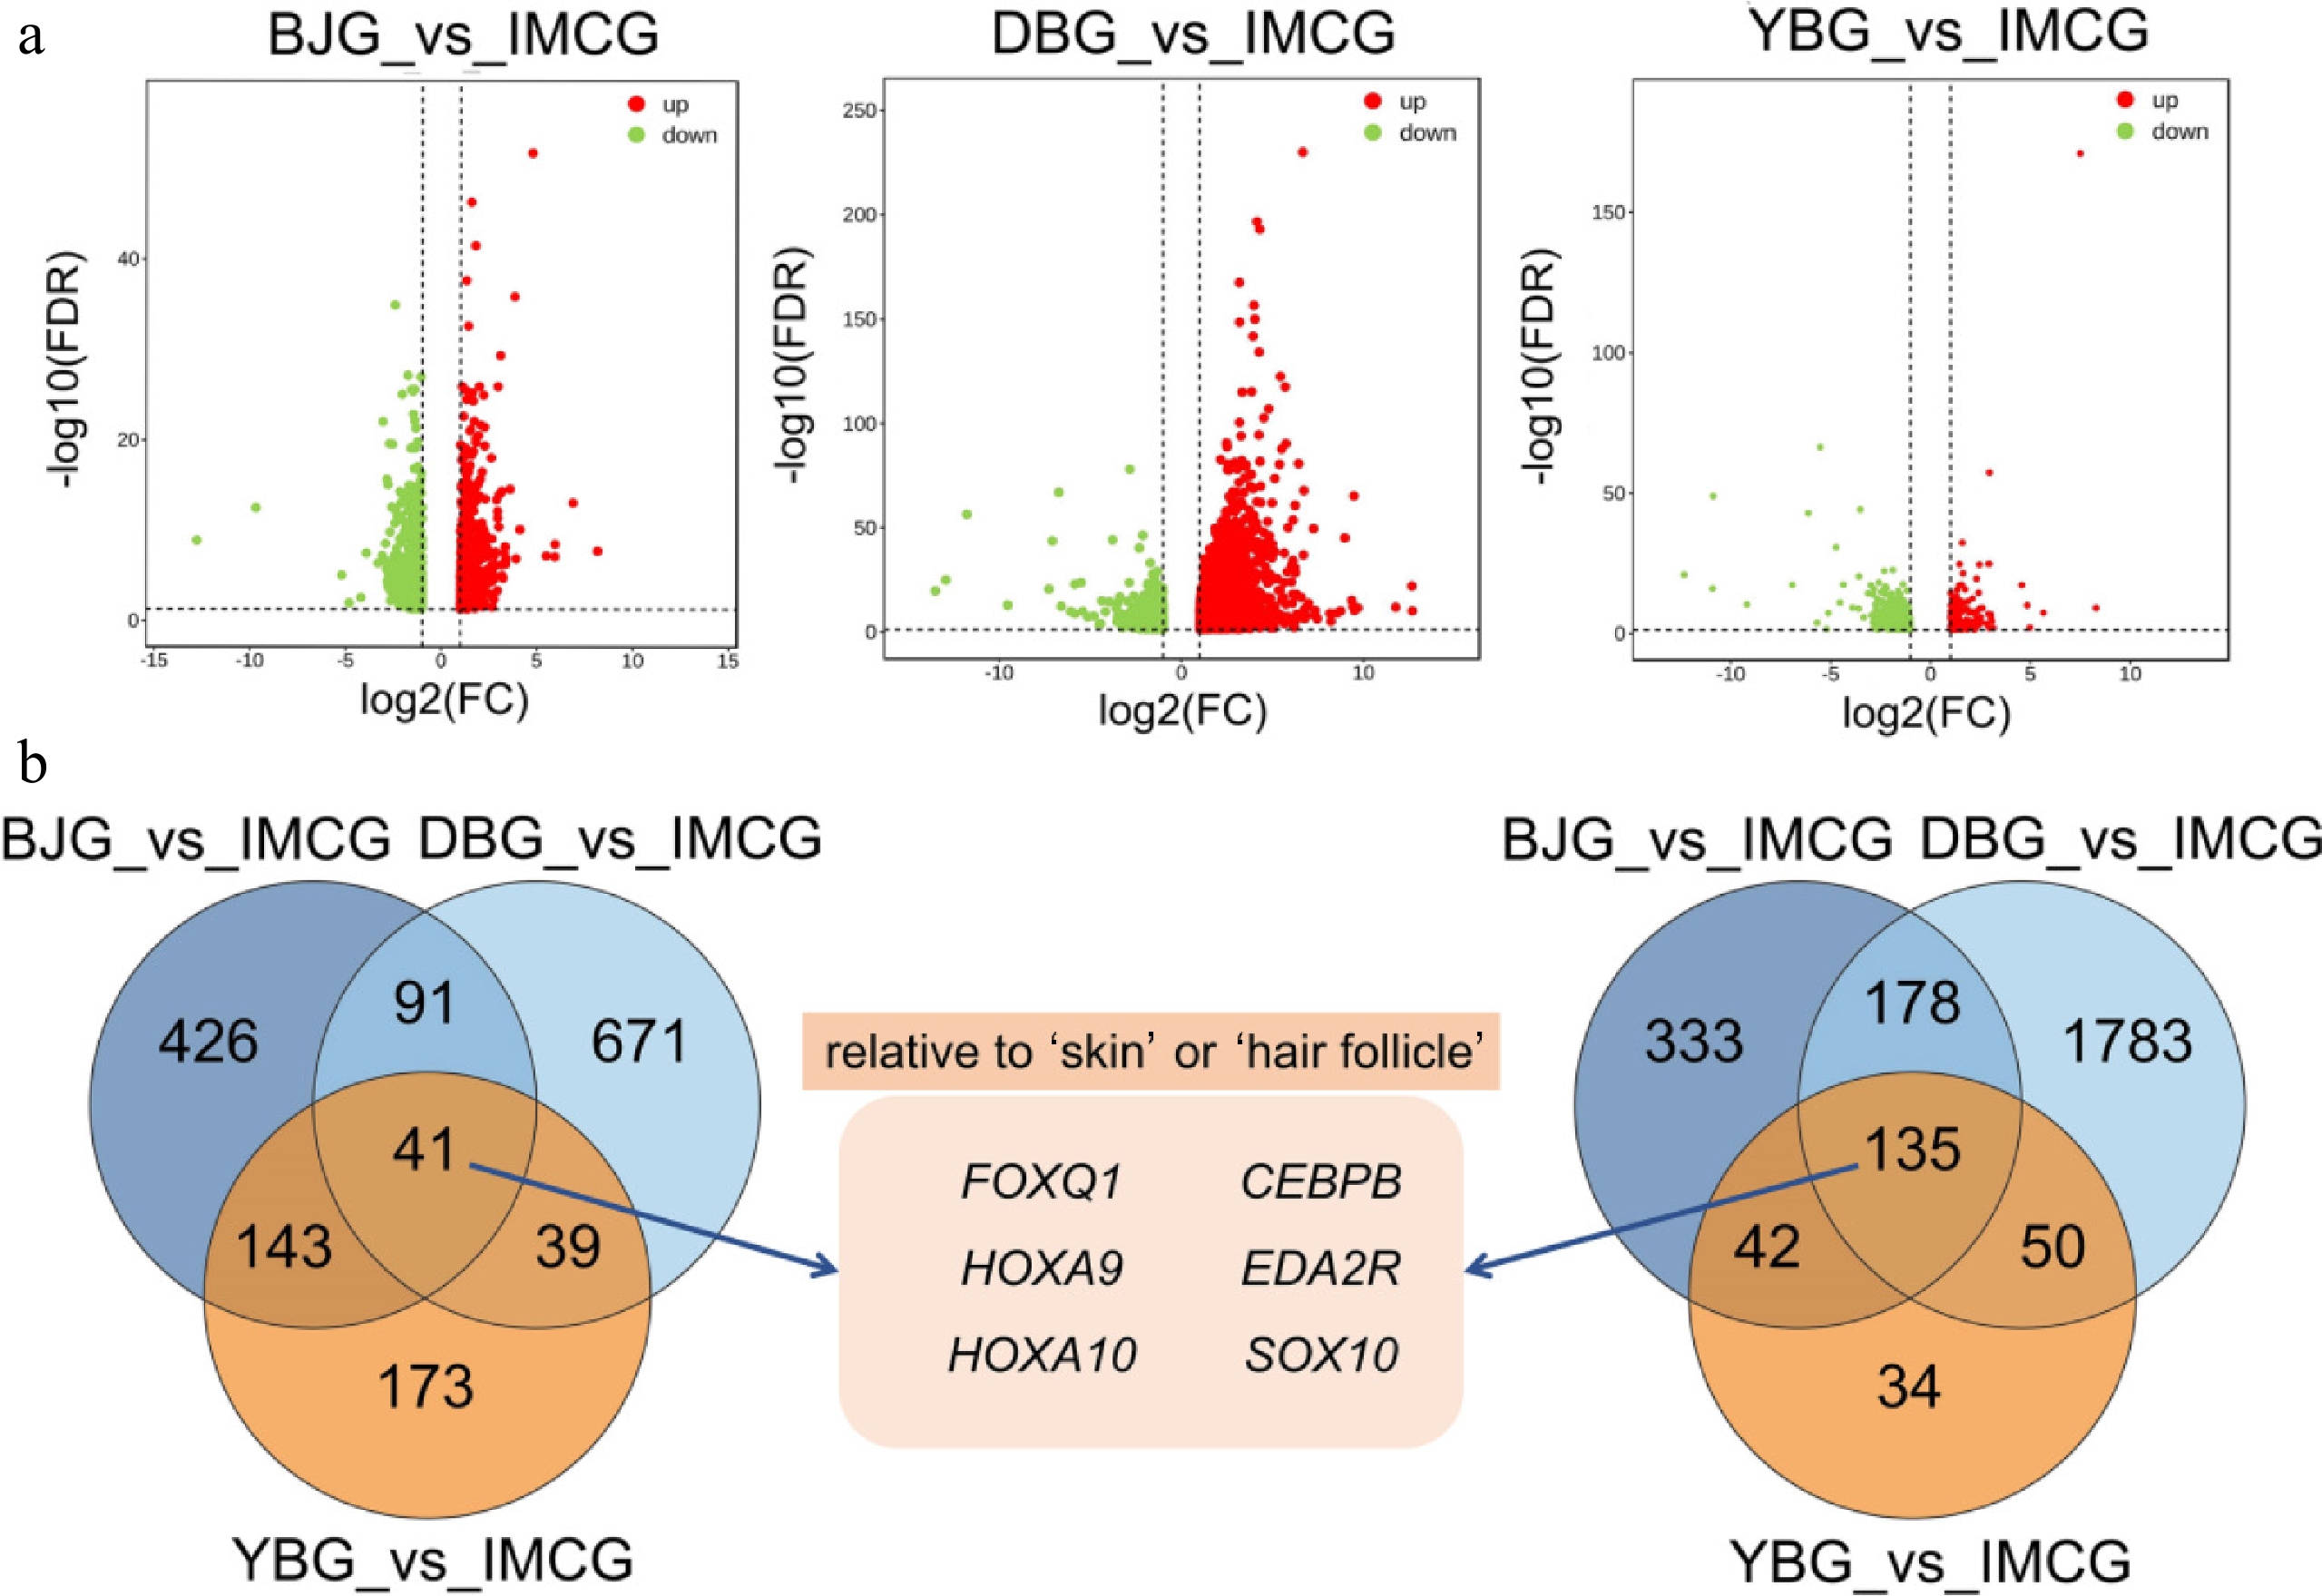
Figure 4.
Identification of core genes related to fiber length. (a) Serial volcano plot of comparisons including BJG vs IMCG, DBG vs IMCG, and YBG vs IMCG. (b) Overlapping genes among three comparisons.
-
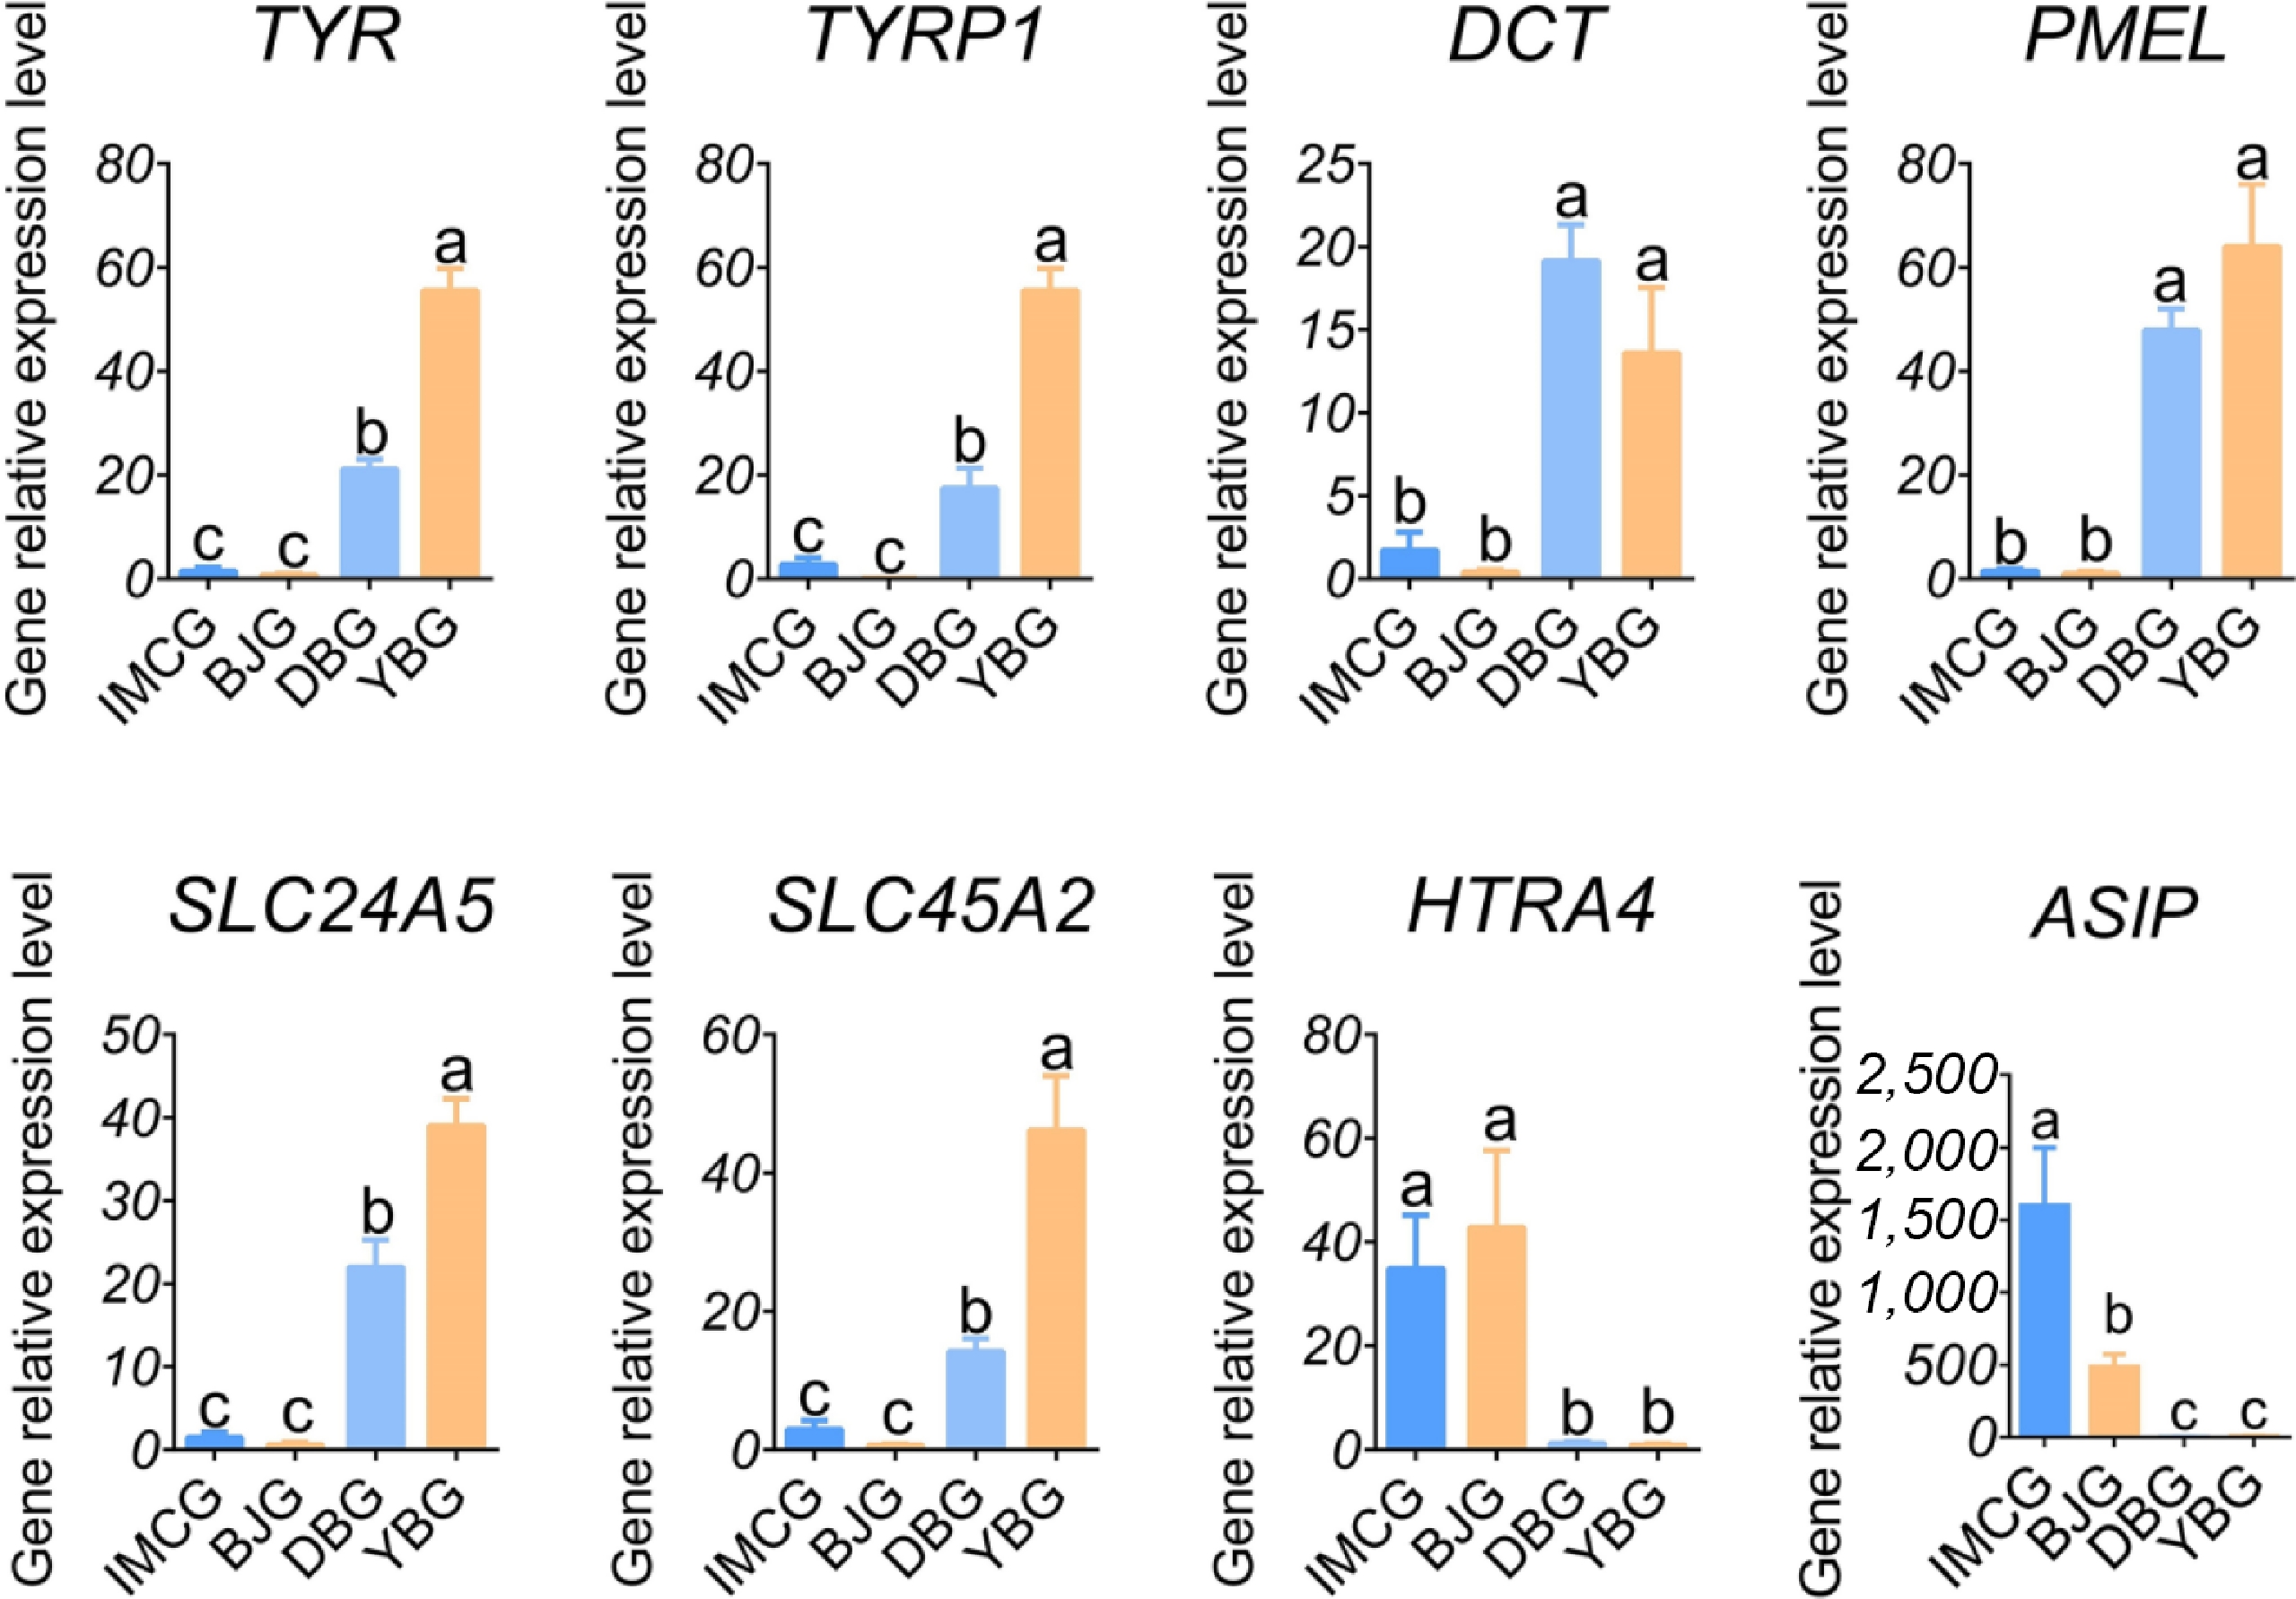
Figure 5.
Relative expression levels of coat color-related genes.
-
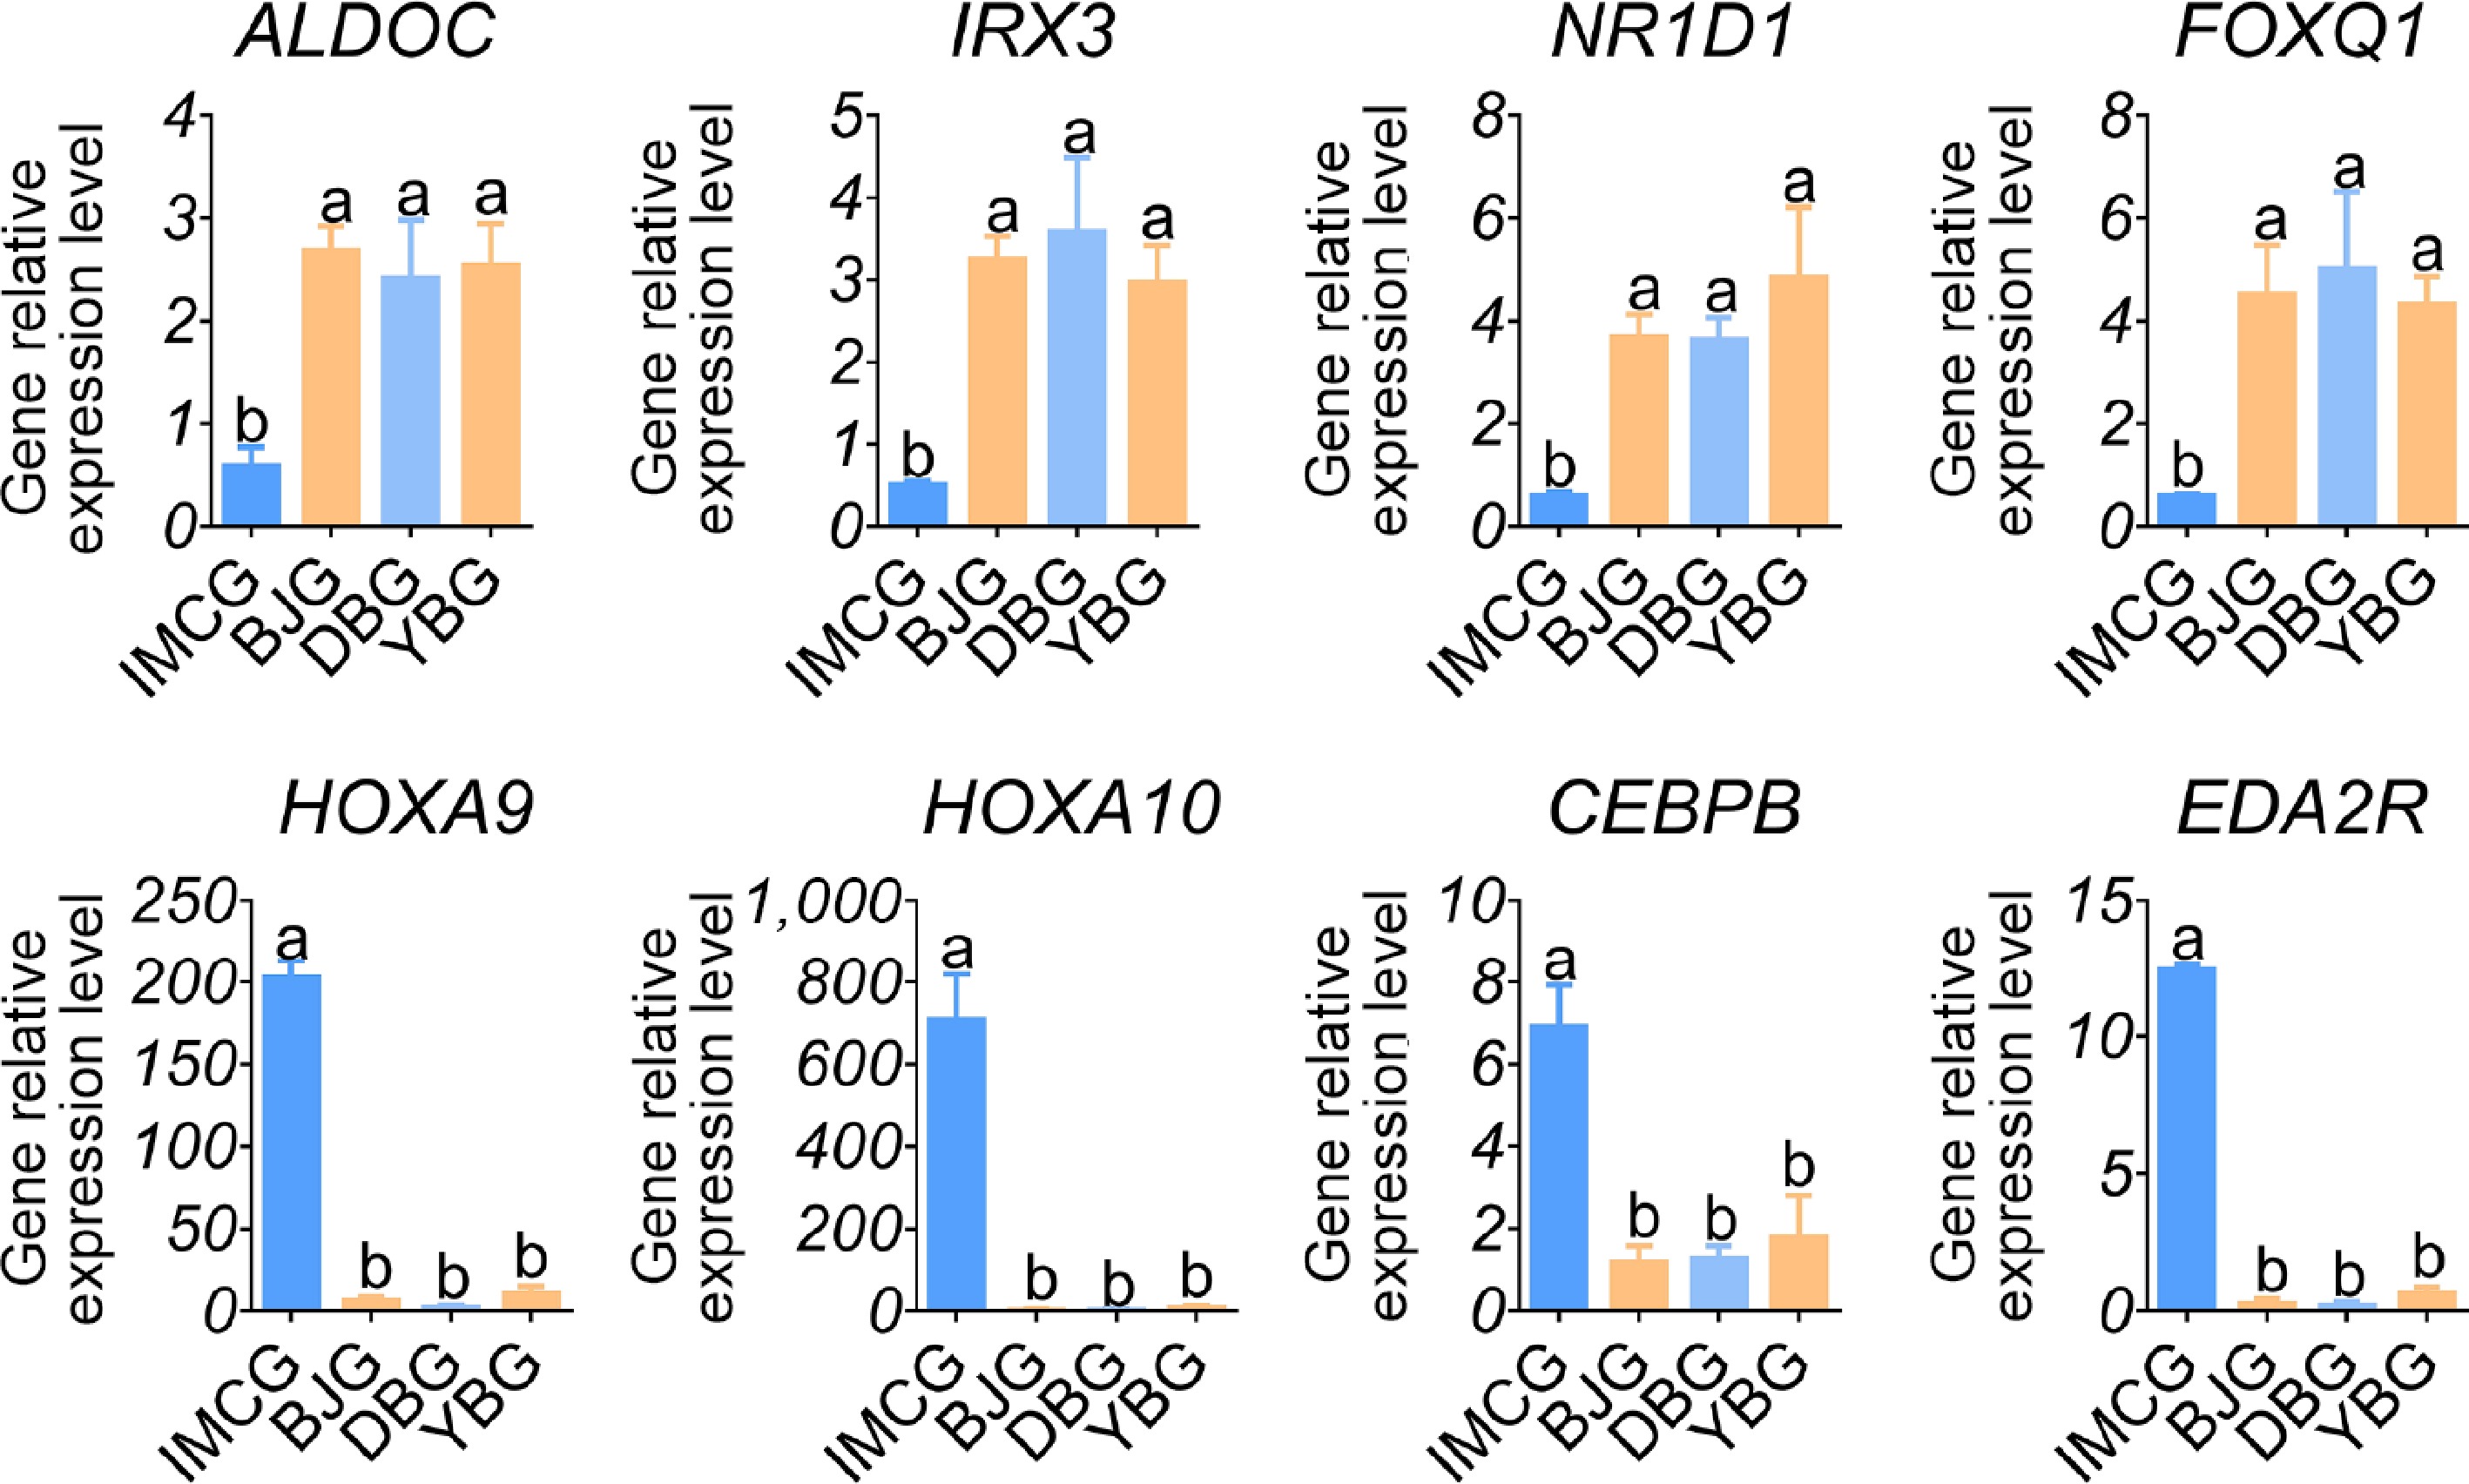
Figure 6.
Relative expression levels of fiber length-related genes.
-
Genes Primer sequence (5'–3') Annealing temperature (°C) Amplicon size (bp) ALDOC F: ATTCTGGCCGCAGATGAGTC 60 105 R: GAACAGAACCTGGCGGTACA IRX3 F: AGGGCGGAACAGATCGCT 60 122 R: GAGAGCCGATAAGACCAGAGC NR1D1 F: ACATCGCTGGGAAAGTCAGG 60 102 R: GAGGAAGCCTGGCGTAAACT FOXQ1 F: CGACGGTTGTGGCTTTACTG 60 129 R: TGCTTTCAGGTGGCAGTGAT HOXA9 F: GGAAGAAACGCTGCCCCTAT 60 135 R: TCTTGACCTGCCTCTCCGTA HOXA10 F: CTTCCAAAGGCGAAAACGCA 60 82 R: GTCTGGTGCTTGGTGTAGGG CEBPB F: CCCGCCCGTGGTGTTATT 60 76 R: GGCAGAATGAGAGGCAAGAGT EDA2R F: CTGCTCGTGGTGTTTACCCT 60 118 R: TCTTGCCAGCCTCATACTGC ASIP F: AGCCCAGAGATGAAAGGAACC 60 76 R: GCCACAATAGAGACAGAAGGGA TYR F: CCTCGGCTGATGTGGAGTTT 60 188 R: CTGGGACATCGTTCCGTTCA TYRP1 F: TCAGTTTGTCATCGCCACCA 60 192 R: AGAAATGCTGGTCCCTCGTG DCT F: TTCTCACACCAAGGACCTGC 60 148 R: TGCACACGTCACACTCGTTA PMEL F: GGGCTGACCTTTCCTACACC 60 184 R: ACATGCCTATCTGTGGTGCC SLC24A5 F: TGCACGCTGCAGAAAGATTG 60 103 R: CAAGTGTGCAGTAGCCCAGA SLC45A2 F: CAGATCCTGGTCGGAAGTGG 60 237 R: TGTCTGAGGTTAGGGACCGT HTRA4 F: CGTGGCTTCTGGGGTTTTTG 60 109 R: GGTGACAGGCAGTCCGTTTA NCBP3 F: AGGAACTCCATGAGGGCAGA 60 127 R: GACGTGTGTGCTGACGTTTT SDHA F: CGCTACGACACCAGCTACTT 60 103 R: TGGACCCGTCTTCTATGCAC PTPRA F: AATTCAACGCTCTCCCTGCT 60 131 R: AACTGGTGTCAGATGGACTCG Table 1.
Paired primer sequences in qPCR experiments.
-
Traits Breeds IMCG BJG DBG YBG Fiber traits Hair melanin content (mg) 0.0286 ± 0.0069b 0.0234 ± 0.0135b 0.5509 ± 0.0832a 0.5637 ± 0.0936a Hair length (cm) 11.3 ± 1.6a 4.1 ± 0.6b 3.7 ± 0.6b 4.2 ± 0.8b Cashmere length (cm) 7.4 ± 0.7a 1.3 ± 0.3b 0.4 ± 0.4c 1.2 ± 0.3b Different letters within the same row indicate p < 0.05. Table 2.
Descriptive statistics of the hair follicle and fiber traits.
-
Breed Sample Clean reads Mapping rate (%) Q30 (%) GC content (%) IMCG IMCG-1 21,132,218 96.86 94.34 51.12 IMCG-2 21,693,880 97.41 95.15 50.42 IMCG-3 20,226,767 97.28 94.78 50.21 BJG BJG-1 27,068,839 96.89 94.98 50.92 BJG-2 23,048,523 96.82 95.36 50.73 BJG-3 21,340,575 97.43 94.75 50.10 DBG DBG-1 22,755,384 97.60 95.20 49.35 DBG-2 24,074,908 97.21 94.73 50.36 DBG-3 24,040,968 97.10 95.66 49.97 YBG YBG-1 21,388,934 96.59 94.33 50.86 YBG-2 22,957,714 97.04 95.20 51.48 YBG-3 24,458,718 96.64 94.94 51.14 Table 3.
Transcriptome sequencing data of 12 skin tissues.
Figures
(6)
Tables
(3)