-
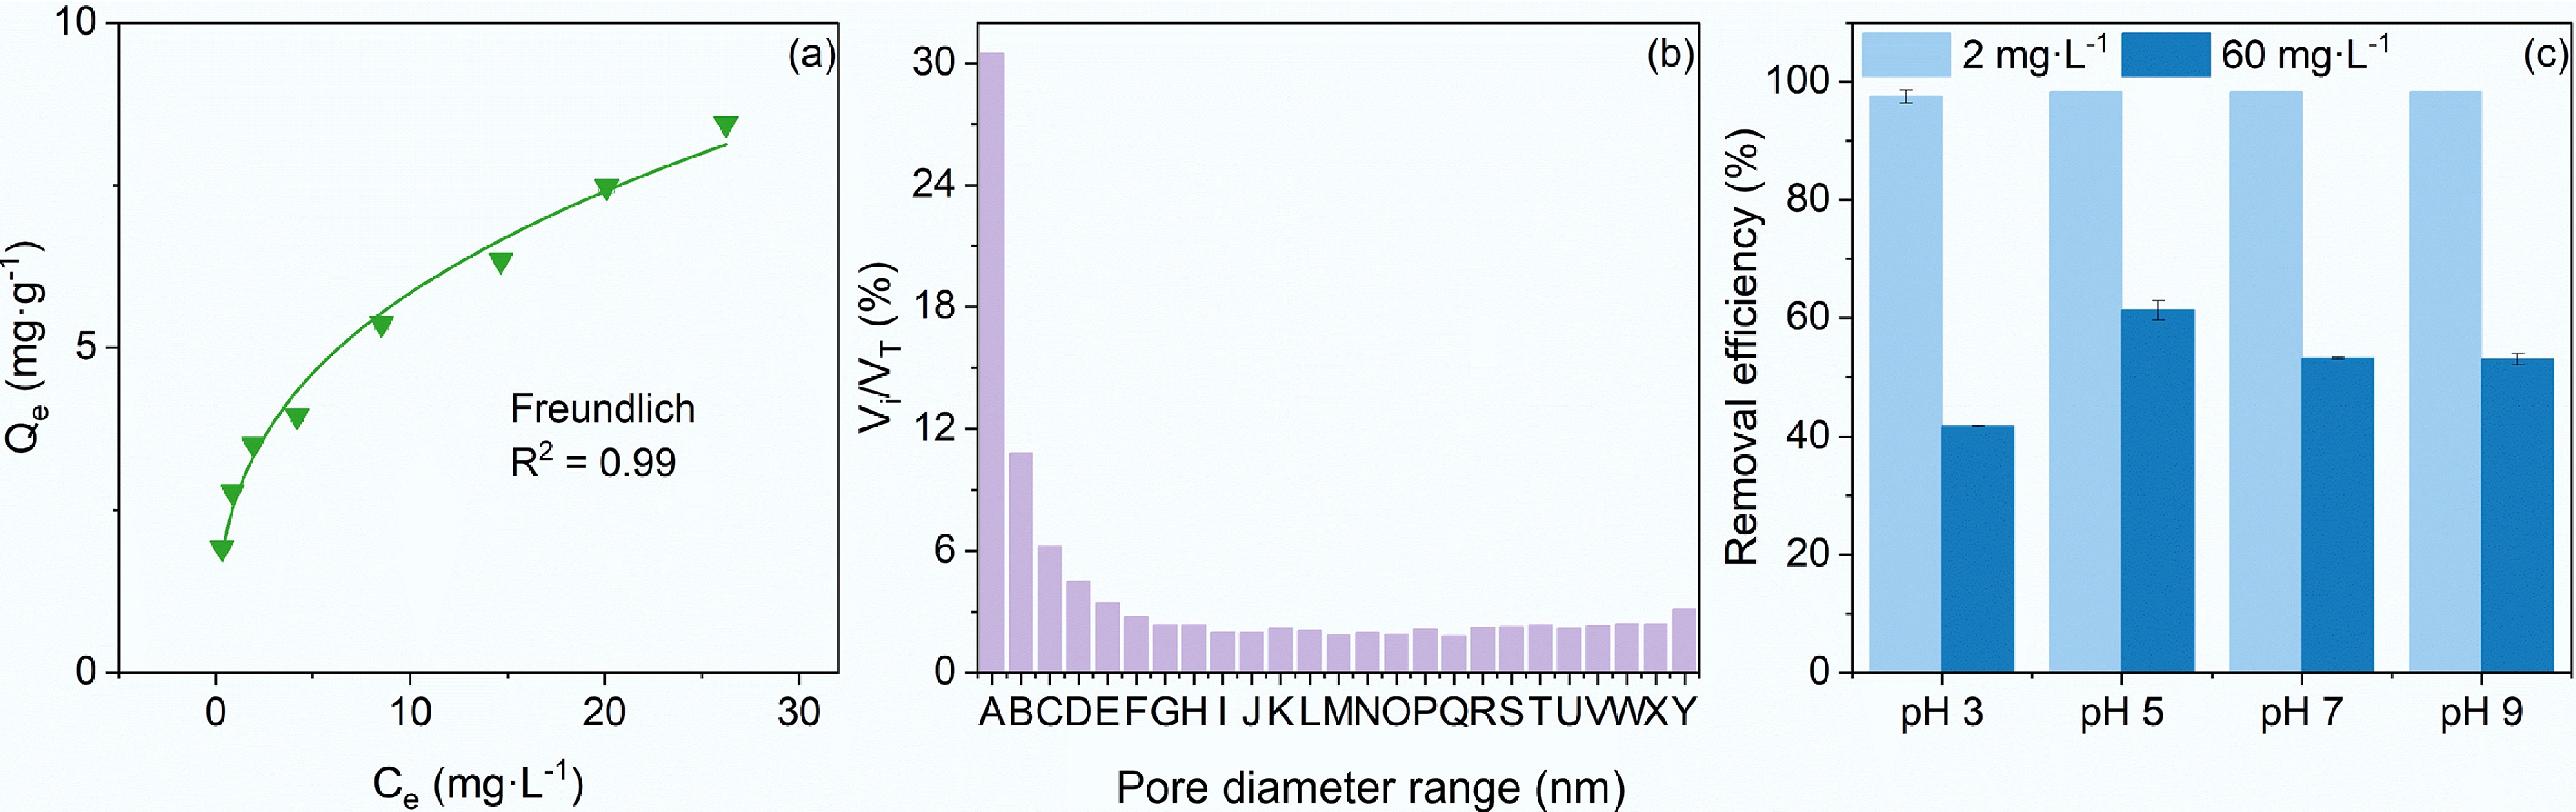
Figure 1.
The adsorption of TC on biochar and the physical characterization of biochar. (a) Adsorption isotherms of TC on 4 g·L−1 BC700. (b) The pore size distribution of BC700, and A−Y are specific pore diameter ranges (nm), respectively: 313.8–51.4, 51.4–27.8, 27.8–19.2, 19.2–14.7, 14.7–11.9, 11.9–9.9, 9.9–8.5, 8.5–7.5, 7.5–6.6, 6.6–5.9, 5.9–5.4, 5.4–4.9, 4.9–4.5, 4.5–4.1, 4.1–3.8, 3.8–3.5, 3.5–3.2, 3.2–3.0, 3.0–2.8, 2.8–2.6, 2.6–2.4, 2.4–2.2, 2.2–2.0, 2.0–1.8, 1.8–1.7. Vi is the incremental pore volume (cm3·g−1) for each pore with different diameter range, and VT is the total pore volume (cm3·g−1) for all pores. (c) Removal efficiency of TC with an initial concentration 2 and 60 mg·L−1 after its interaction with BC700 for 24 h at pH 3–9.
-
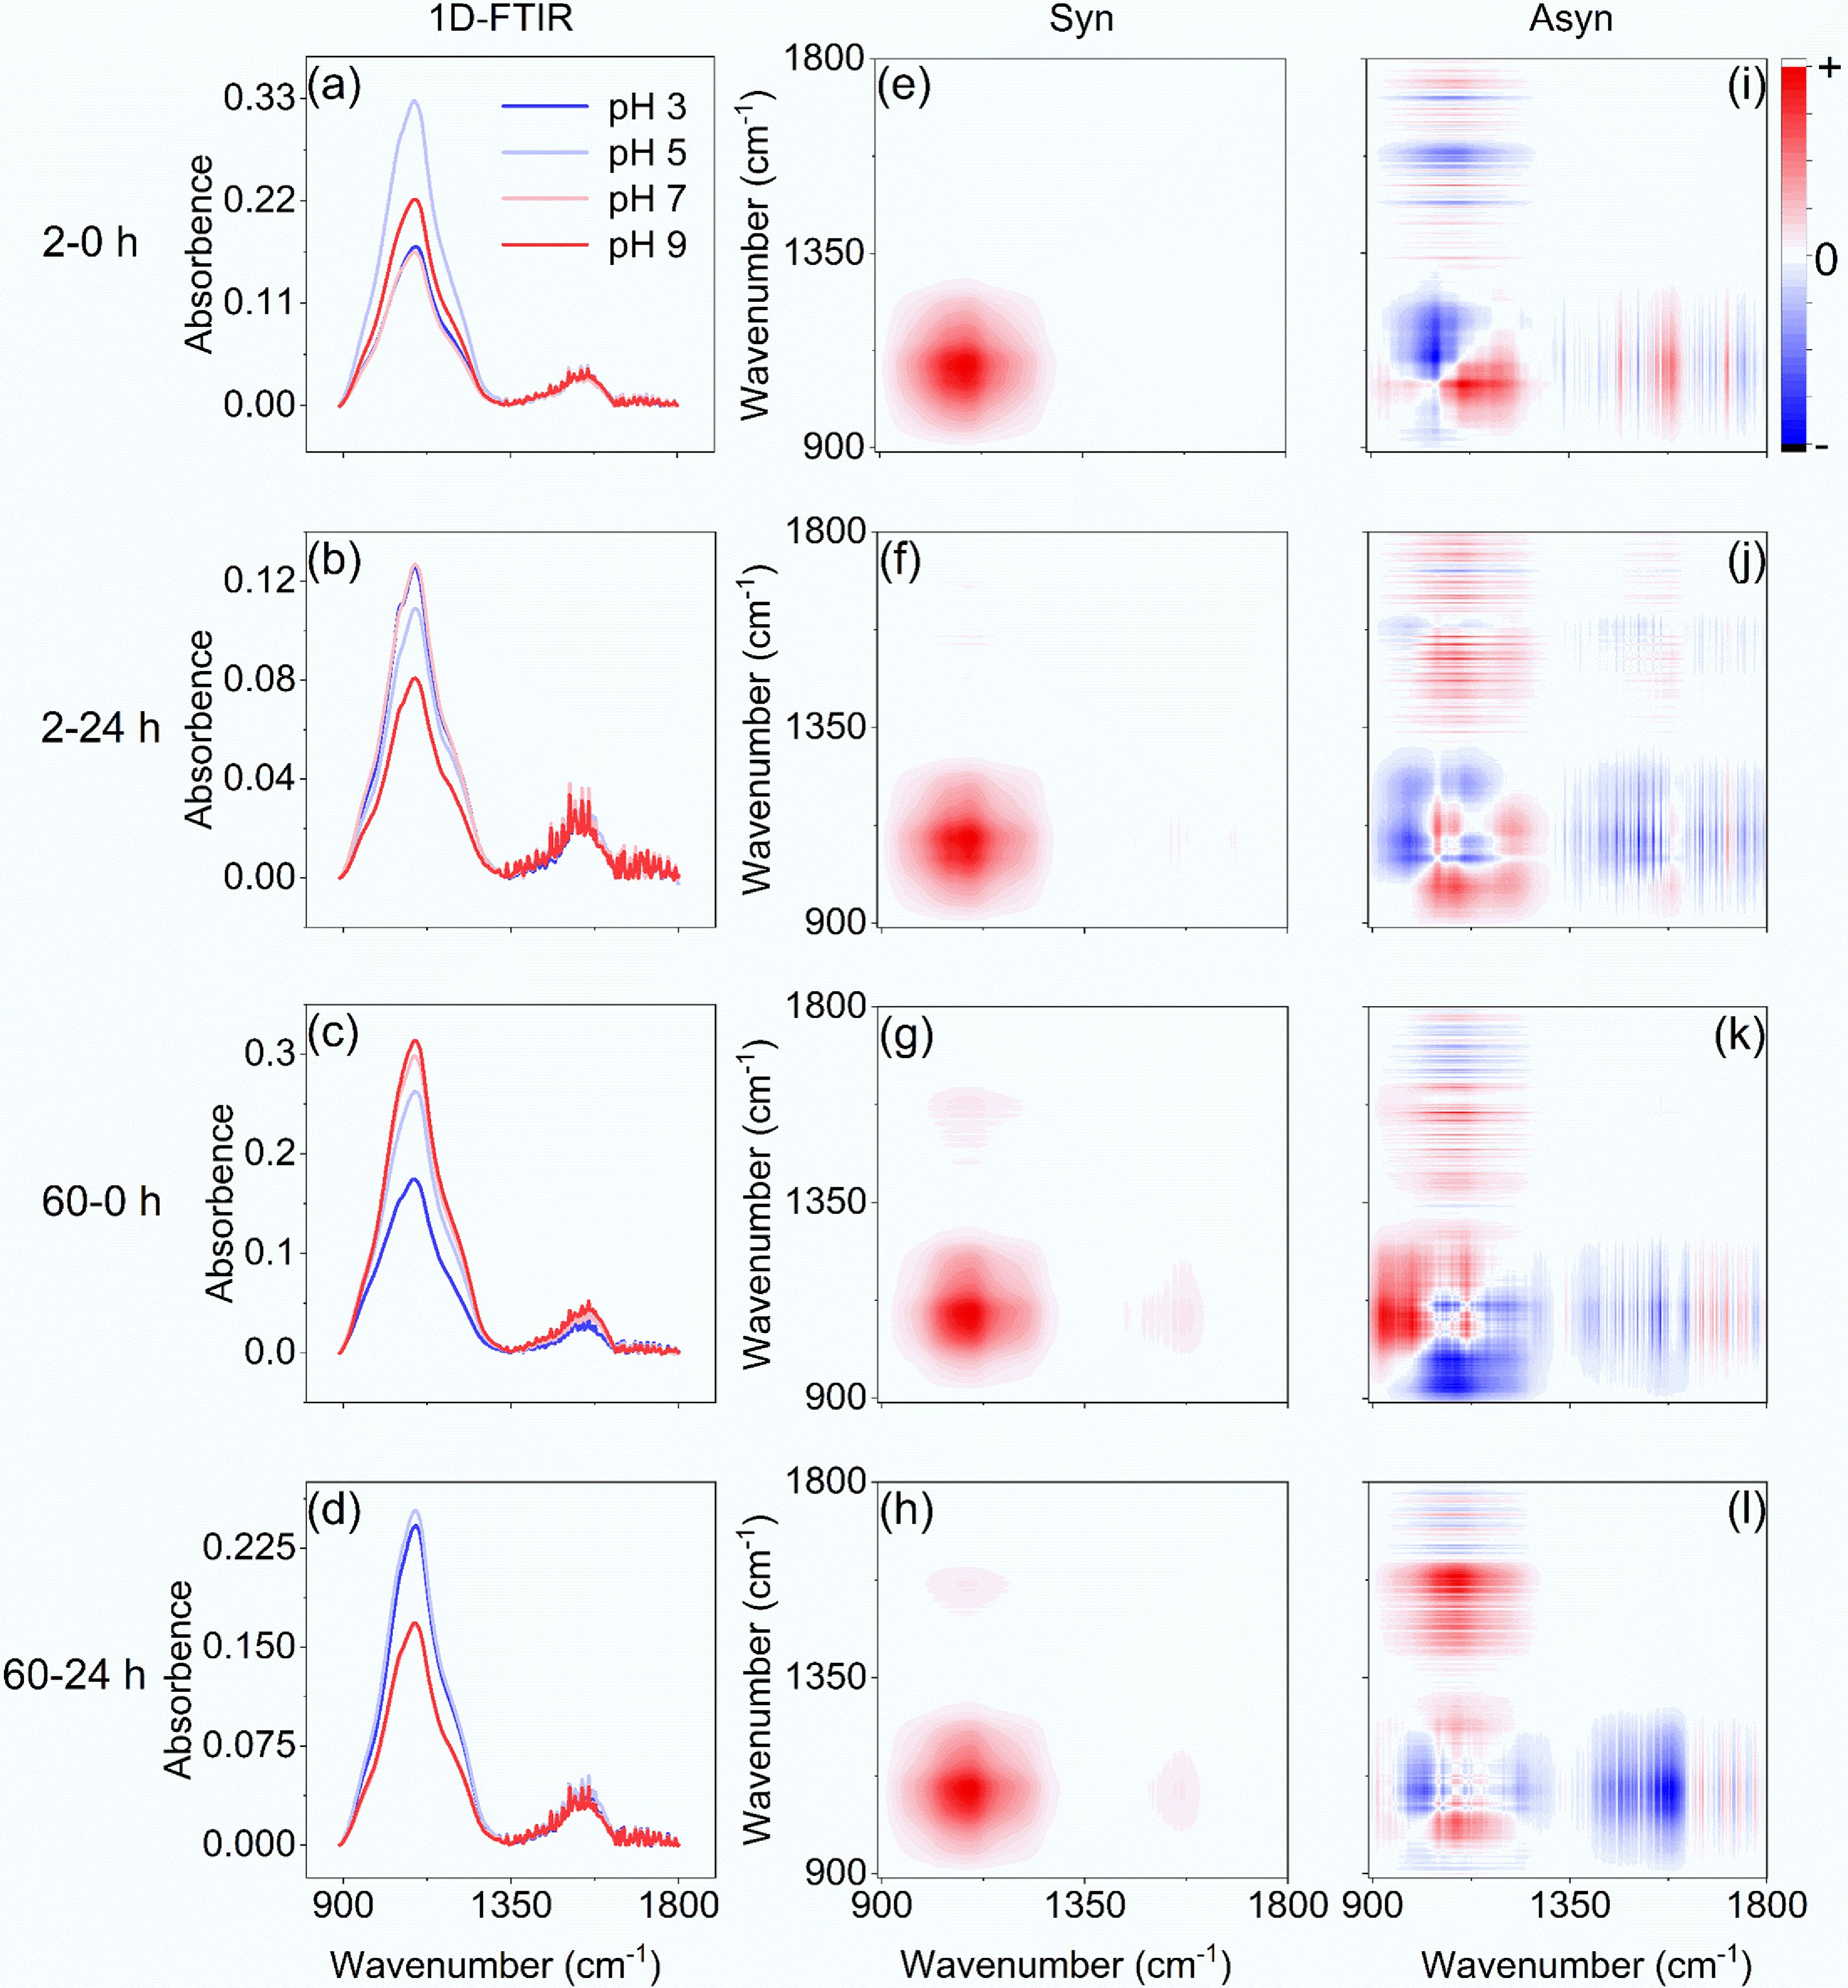
Figure 2.
FTIR spectra of BC700 before and after its interaction with TC. (a)–(d) 1D-FTIR spectra of BC700 after adsorption of 2 and 60 mg·L−1 TC at pH 3–9 for 0 and 24 h. (e)–(h) Synchronous, and (i)–(l) asynchronous 2DCoS maps of 1D-FTIR for TC adsorption on BC700.
-
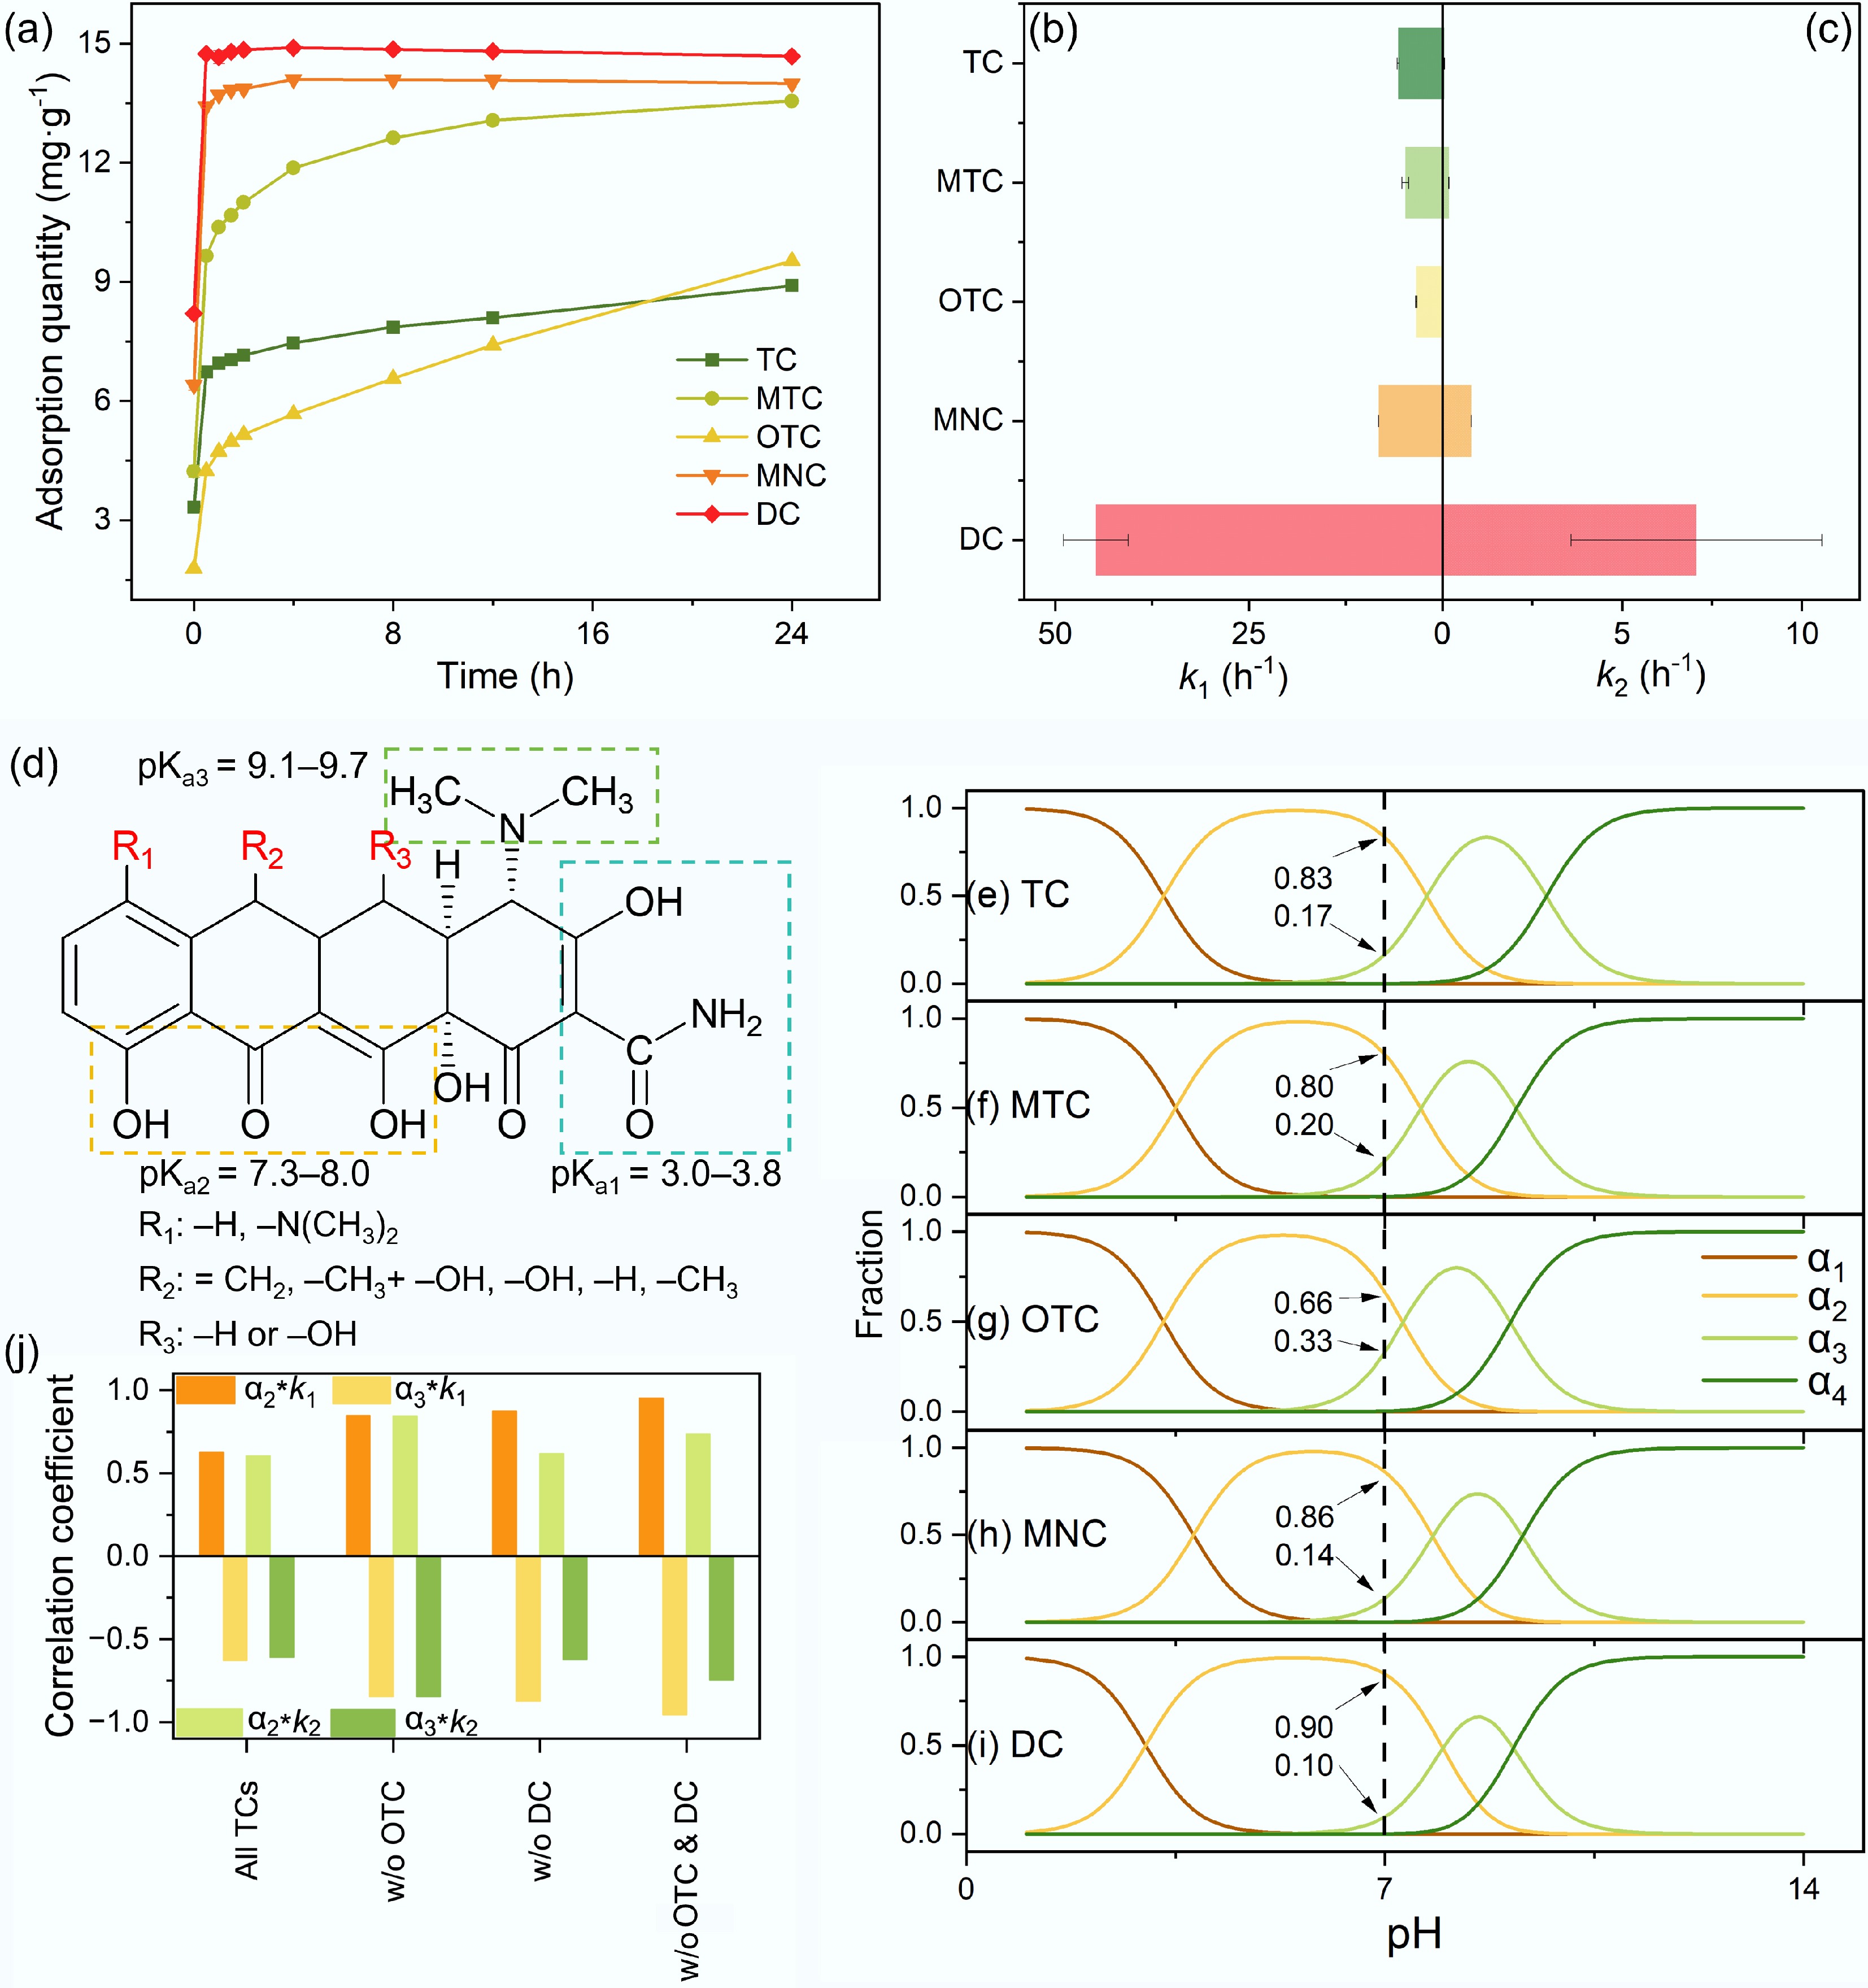
Figure 3.
Adsorption kinetics of TCs on BC700 and the impacts of TCs dissociation species. (a) Adsorption kinetic profiles of five TCs at 60 mg·L−1 onto 4 g·L−1 BC700 at pH 7. (b), (c) Fast-stage (k1), and slow-stage (k2) adsorption rate constants fitted by DEM. (d) Dissociation functional moieties of TCs and their corresponding pKa values. (e)–(i) pH-dependent speciation distributions of TC, MTC, OTC, MNC, and DC. (j) Pearson correlation coefficients between the relative abundances of TCs neutral (α2), and monoanionic (α3) species with k1 and k2.
-
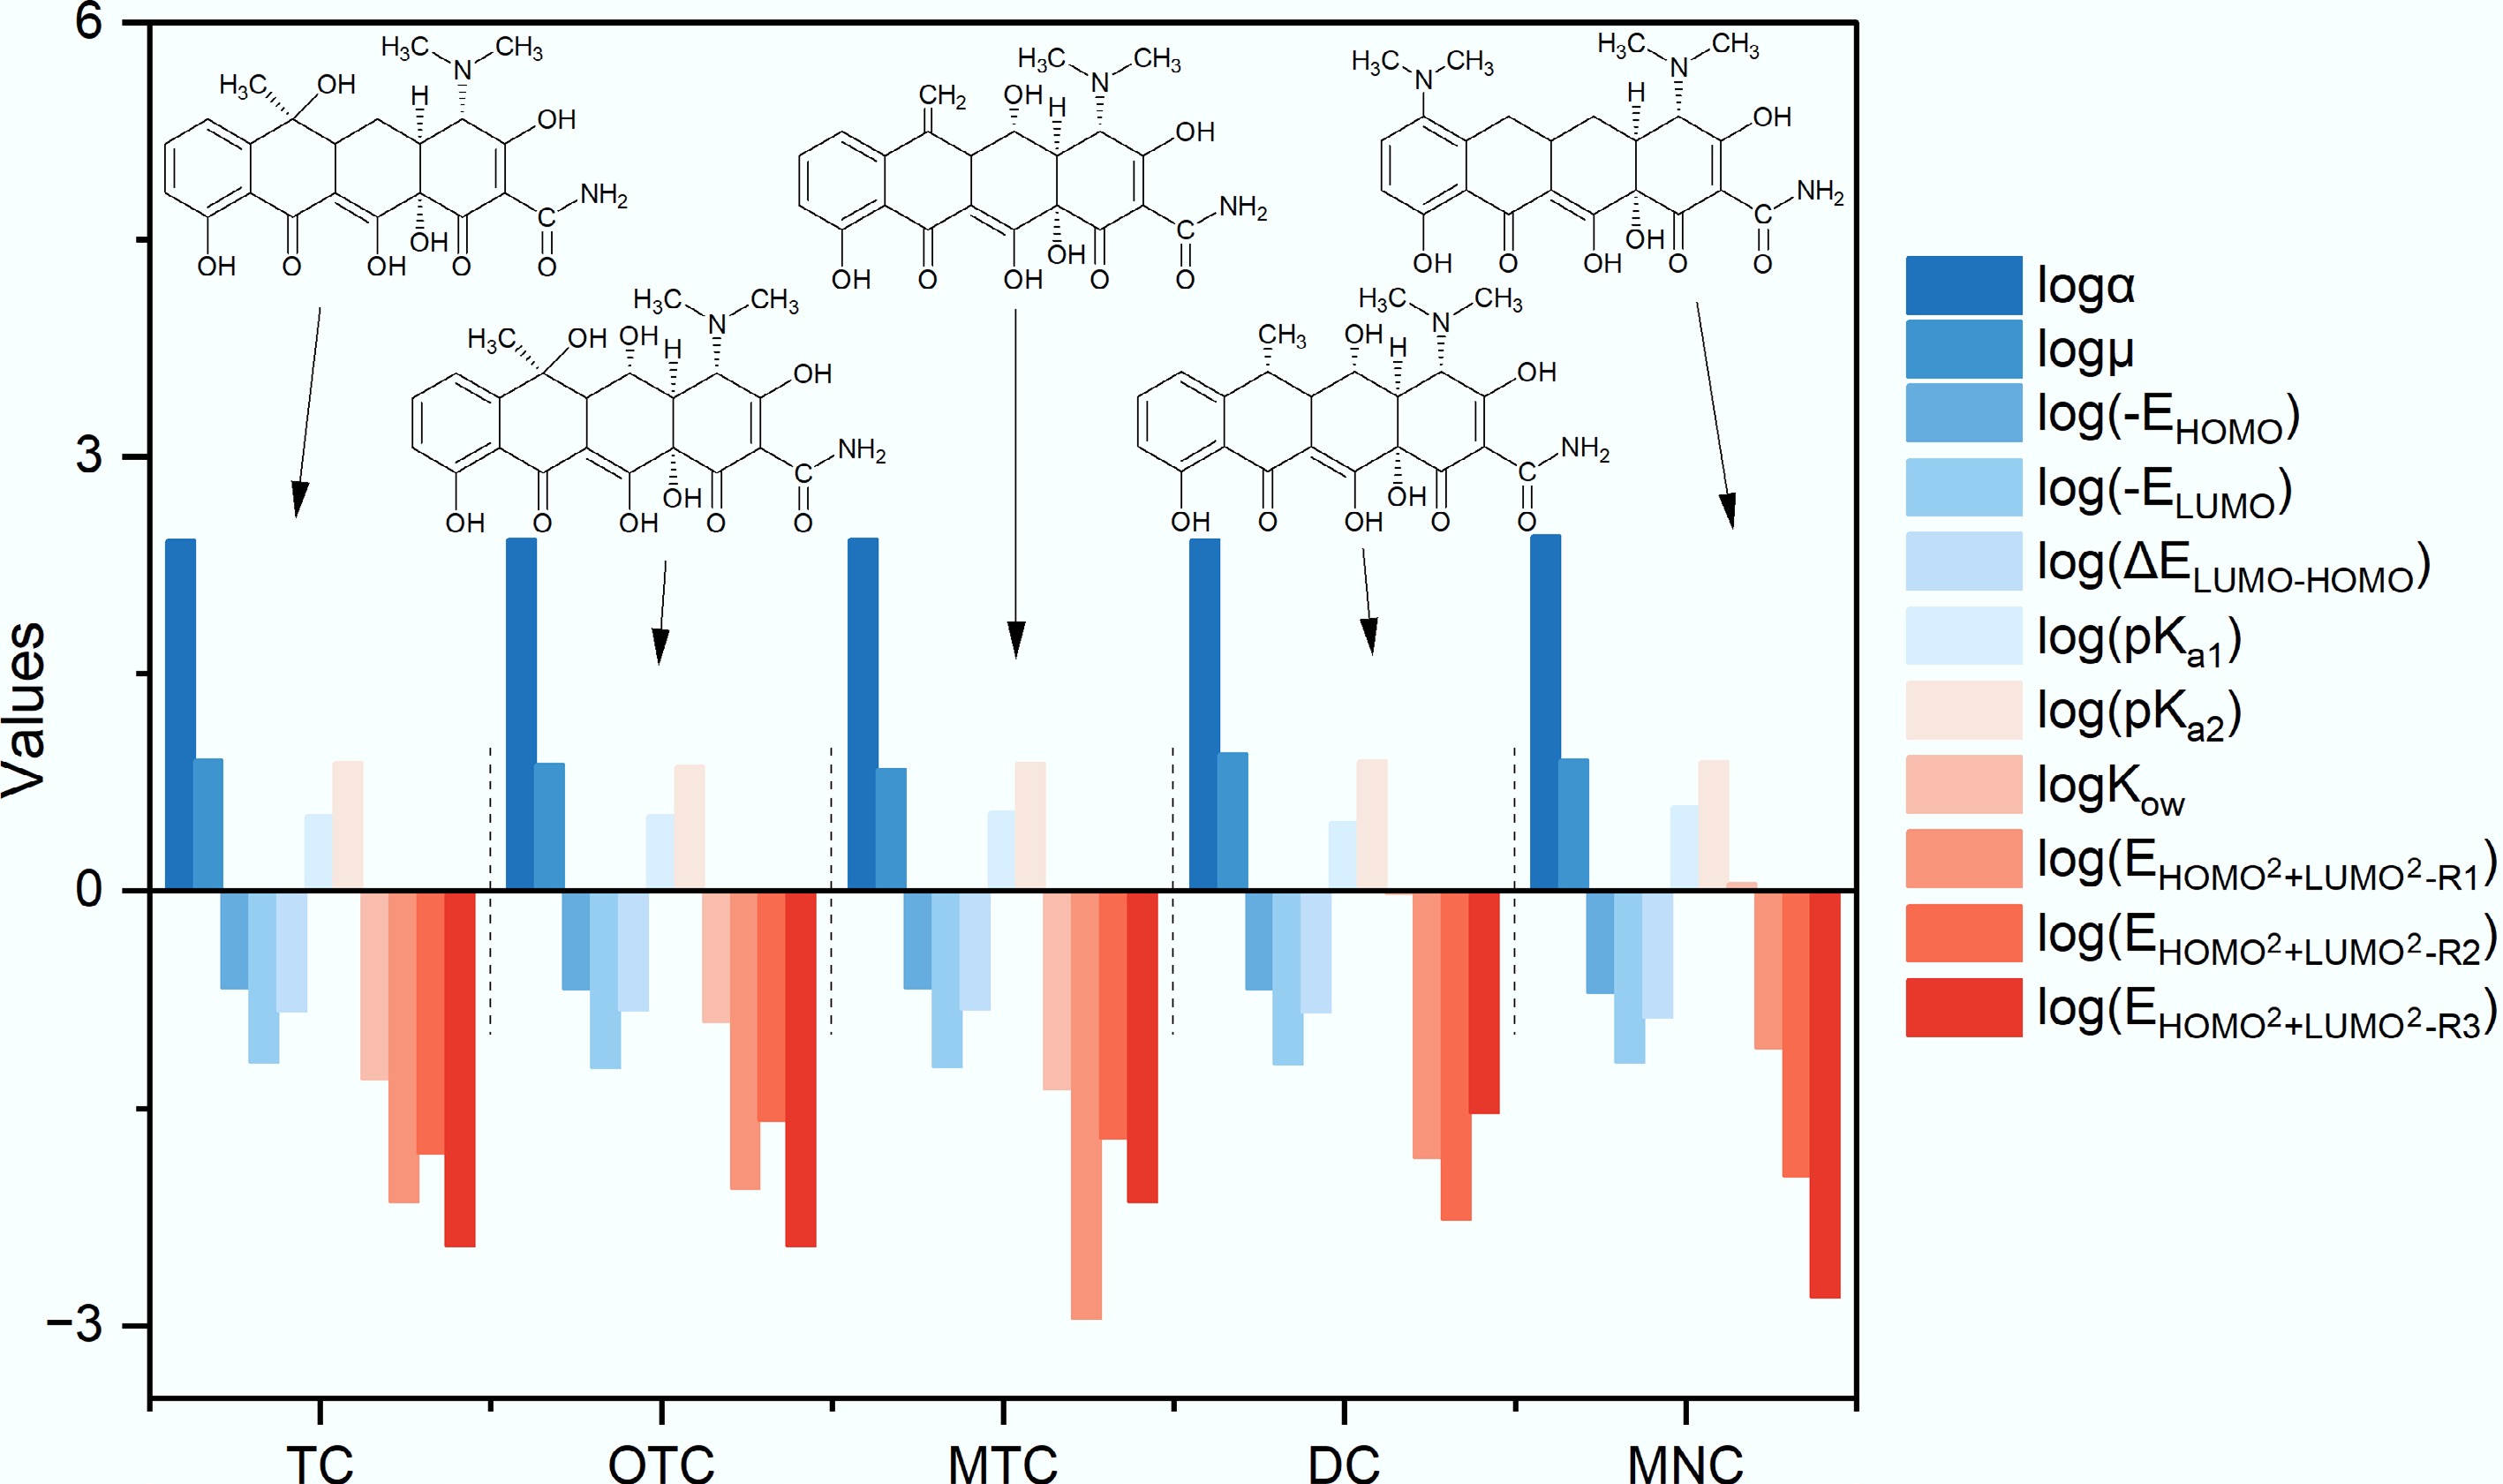
Figure 4.
Eleven structural descriptors of five TCs. All data were logarithmically transformed (base 10) for facilitation of plotting and comparative analysis.
-
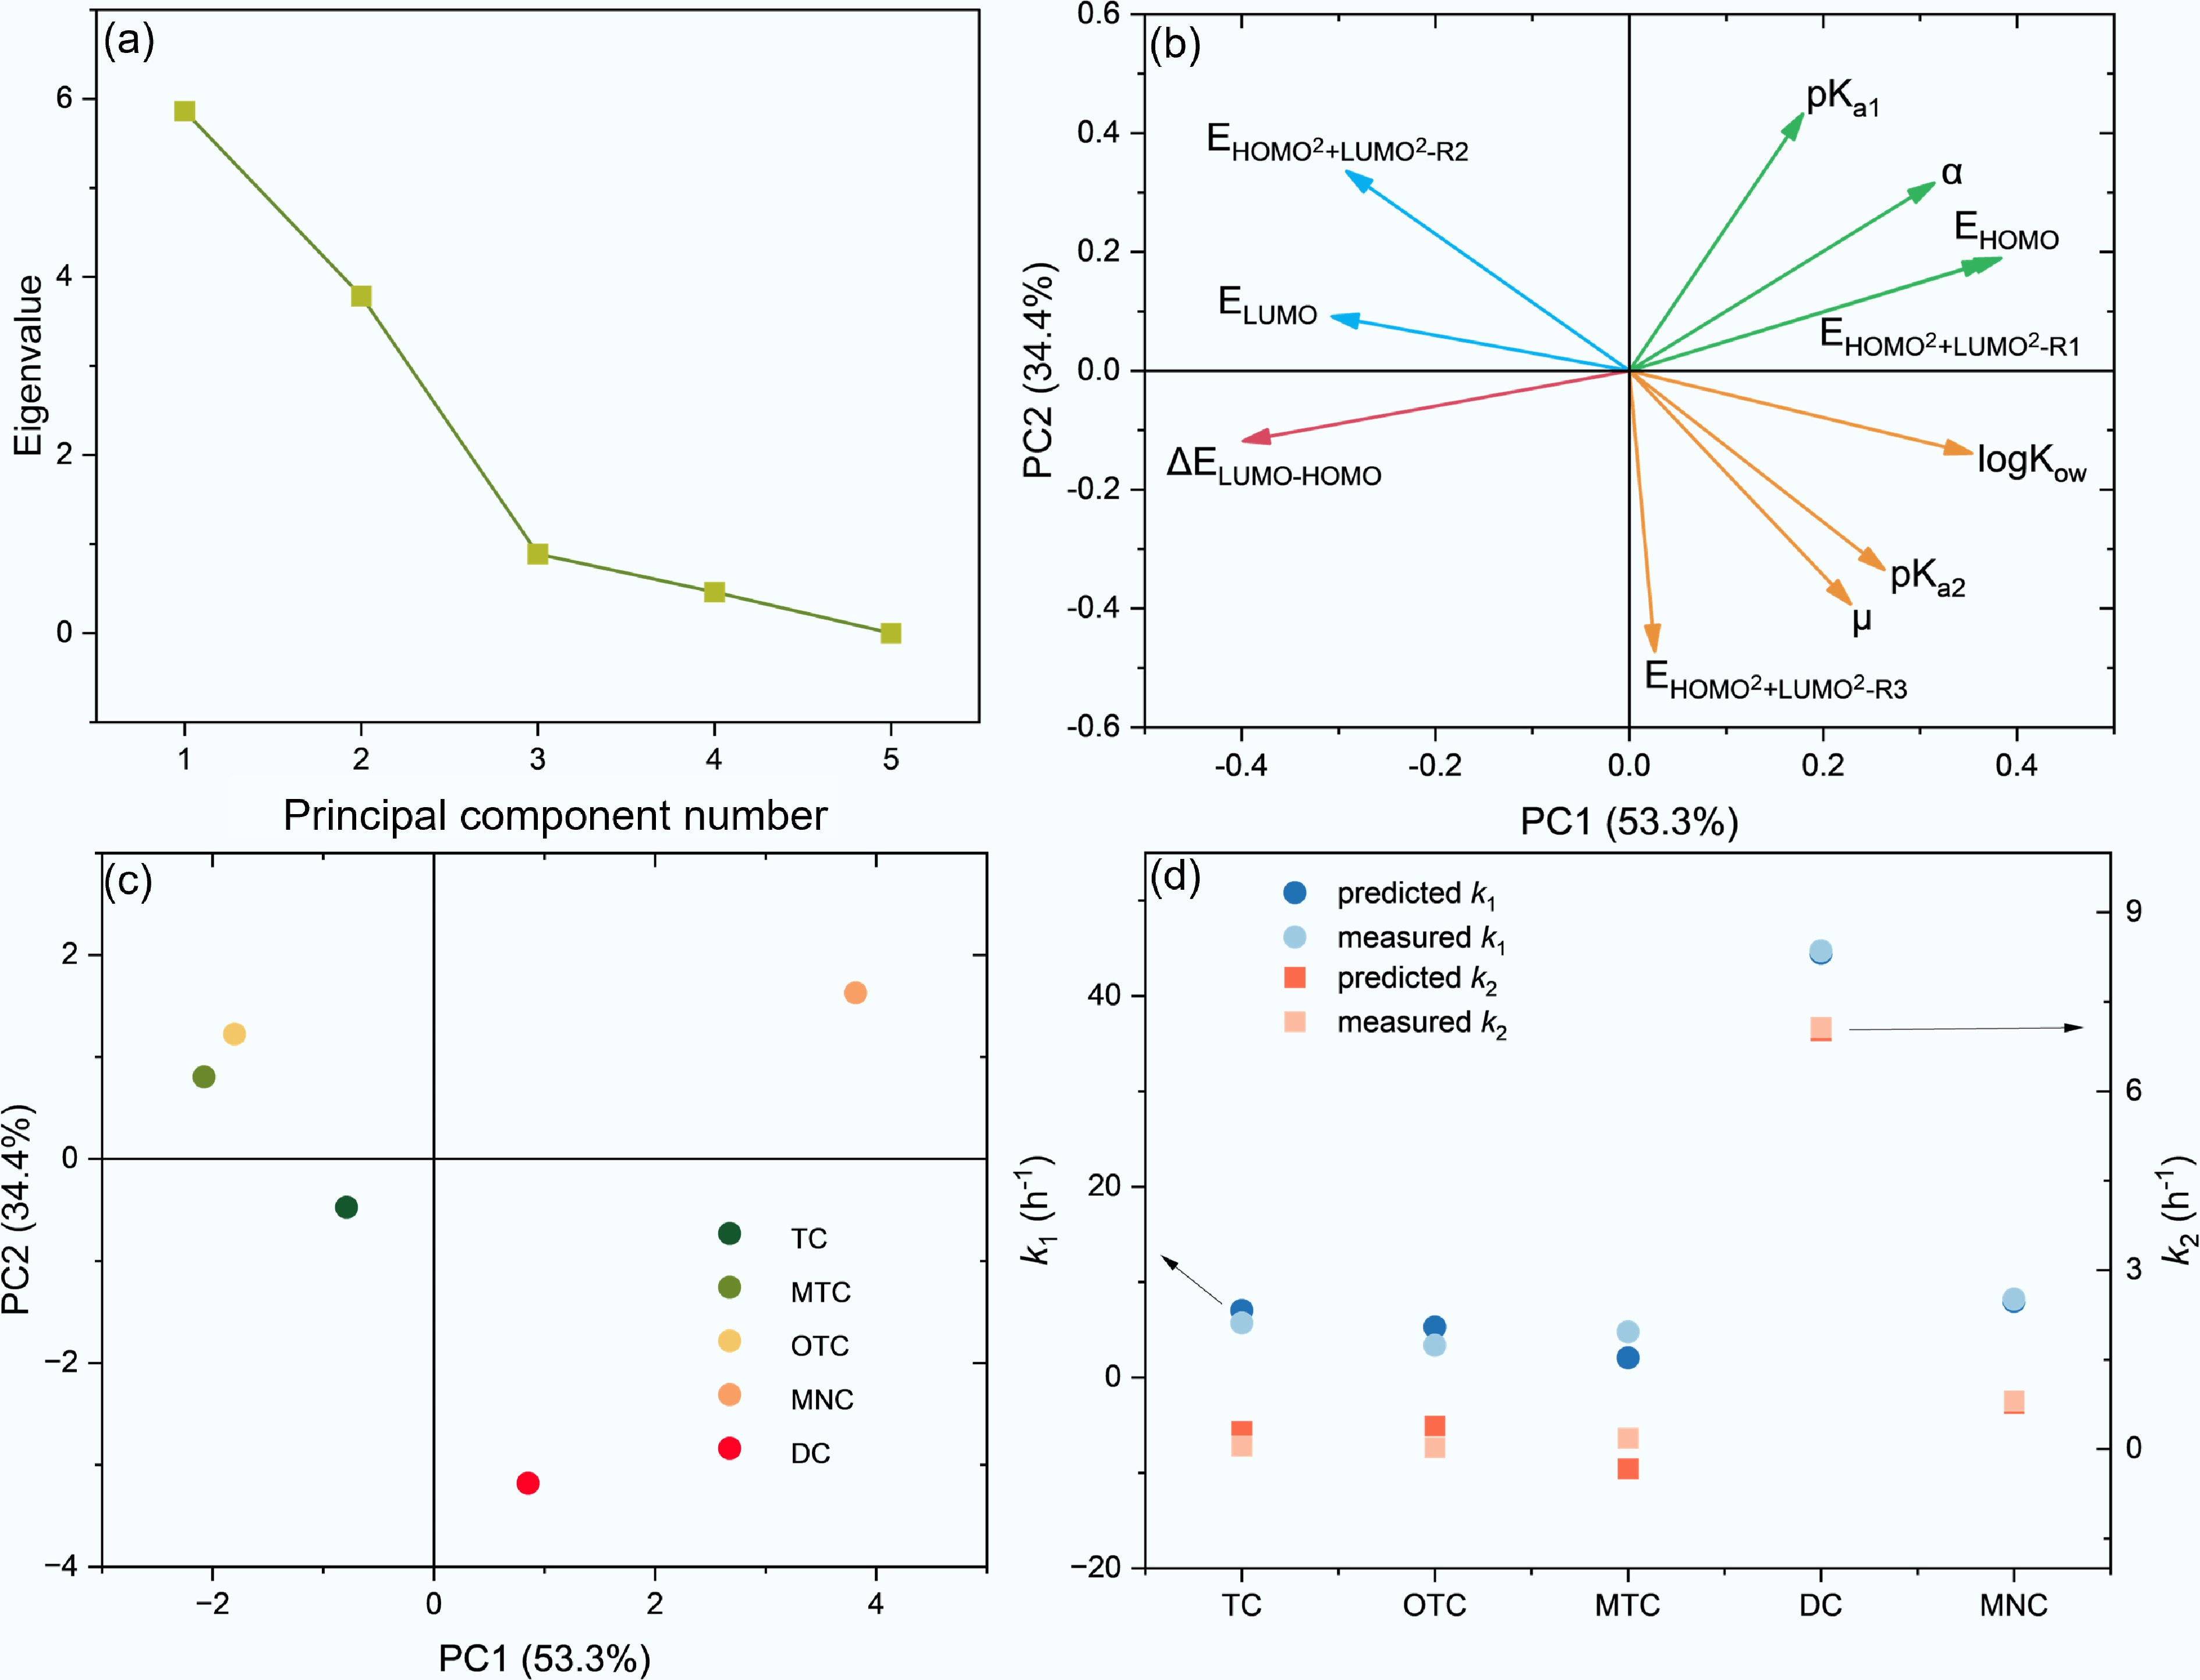
Figure 5.
Principal component analysis (PCA) of TCs structural descriptors and multiple linear regression (MLR) of structure-adsorption rate relationships. (a) Scree plot of PC eigenvalues. (b) Loadings plot of TCs structural descriptors. (c) PC scores plot of individual TCs. (d) Comparison between measured and predicted values of TCs adsorption rate constants (k1, k2) derived from MLR models incorporating PC1, PC2, and PC3.
-
TC OTC MTC DC MNC α (a.u.) 264.3747 269.8470 268.2860 265.5643 284.5270 μ (a.u.) 8.0224 7.4779 6.9306 8.8518 7.9863 EHOMO (a.u.) −0.2143 −0.2105 −0.2145 −0.2106 −0.1991 ELUMO (a.u.) −0.0659 −0.0608 −0.0610 −0.0639 −0.0661 ΔELUMO−HOMO (a.u.) 0.1484 0.1497 0.1535 0.1467 0.1330 pKa1 3.3000 3.3000 3.5000 3.0000 3.8000 pKa2 7.7000 7.3000 7.6000 7.9700 7.8000 logKow −1.3000 −0.9000 −1.3700 −0.0200 0.0500 ${\mathrm{E}}_{{\mathrm{HOMO}}^2+{\mathrm{LUMO}}^2-{\mathrm{R}}1} $ 0.0071 0.0087 0.0011 0.0144 0.0828 ${\mathrm{E}}_{{\mathrm{HOMO}}^2+{\mathrm{LUMO}}^2-{\mathrm{R}}2} $ 0.0155 0.0262 0.0197 0.0055 0.0107 ${\mathrm{E}}_{{\mathrm{HOMO}}^2+{\mathrm{LUMO}}^2-{\mathrm{R}}3} $ 0.0036 0.0036 0.0071 0.0294 0.0016 Table 1.
Detailed structural descriptors of five TCs
Figures
(5)
Tables
(1)