-
-
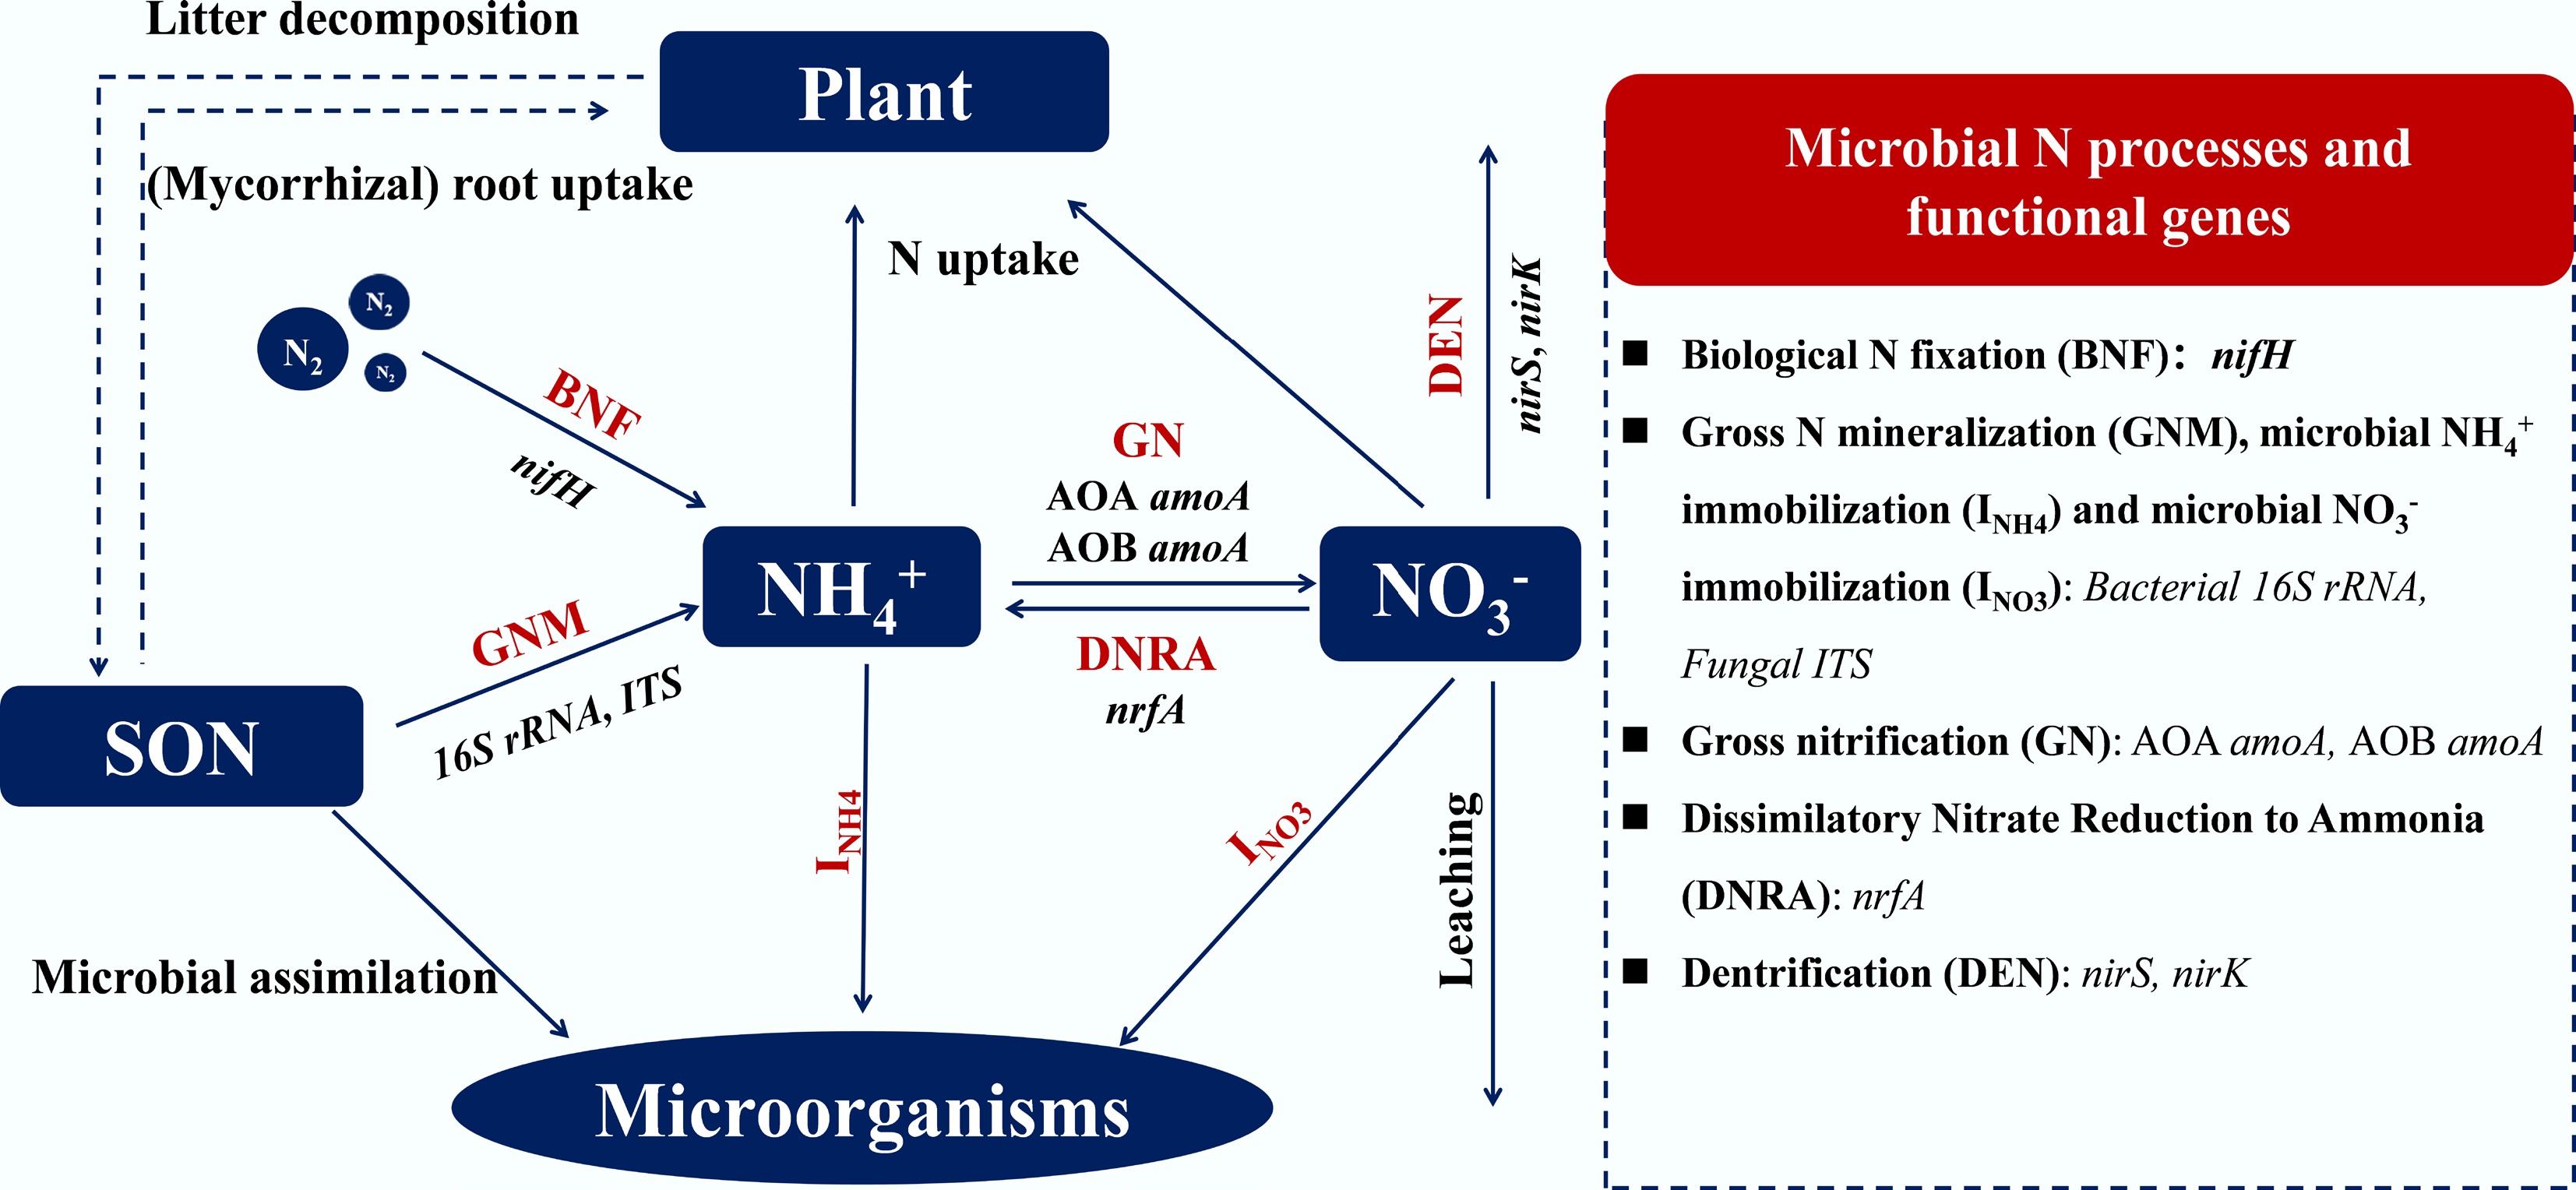
Figure 2.
Key soil gross N transformation and N cycle-associated microbial functional genes.
-
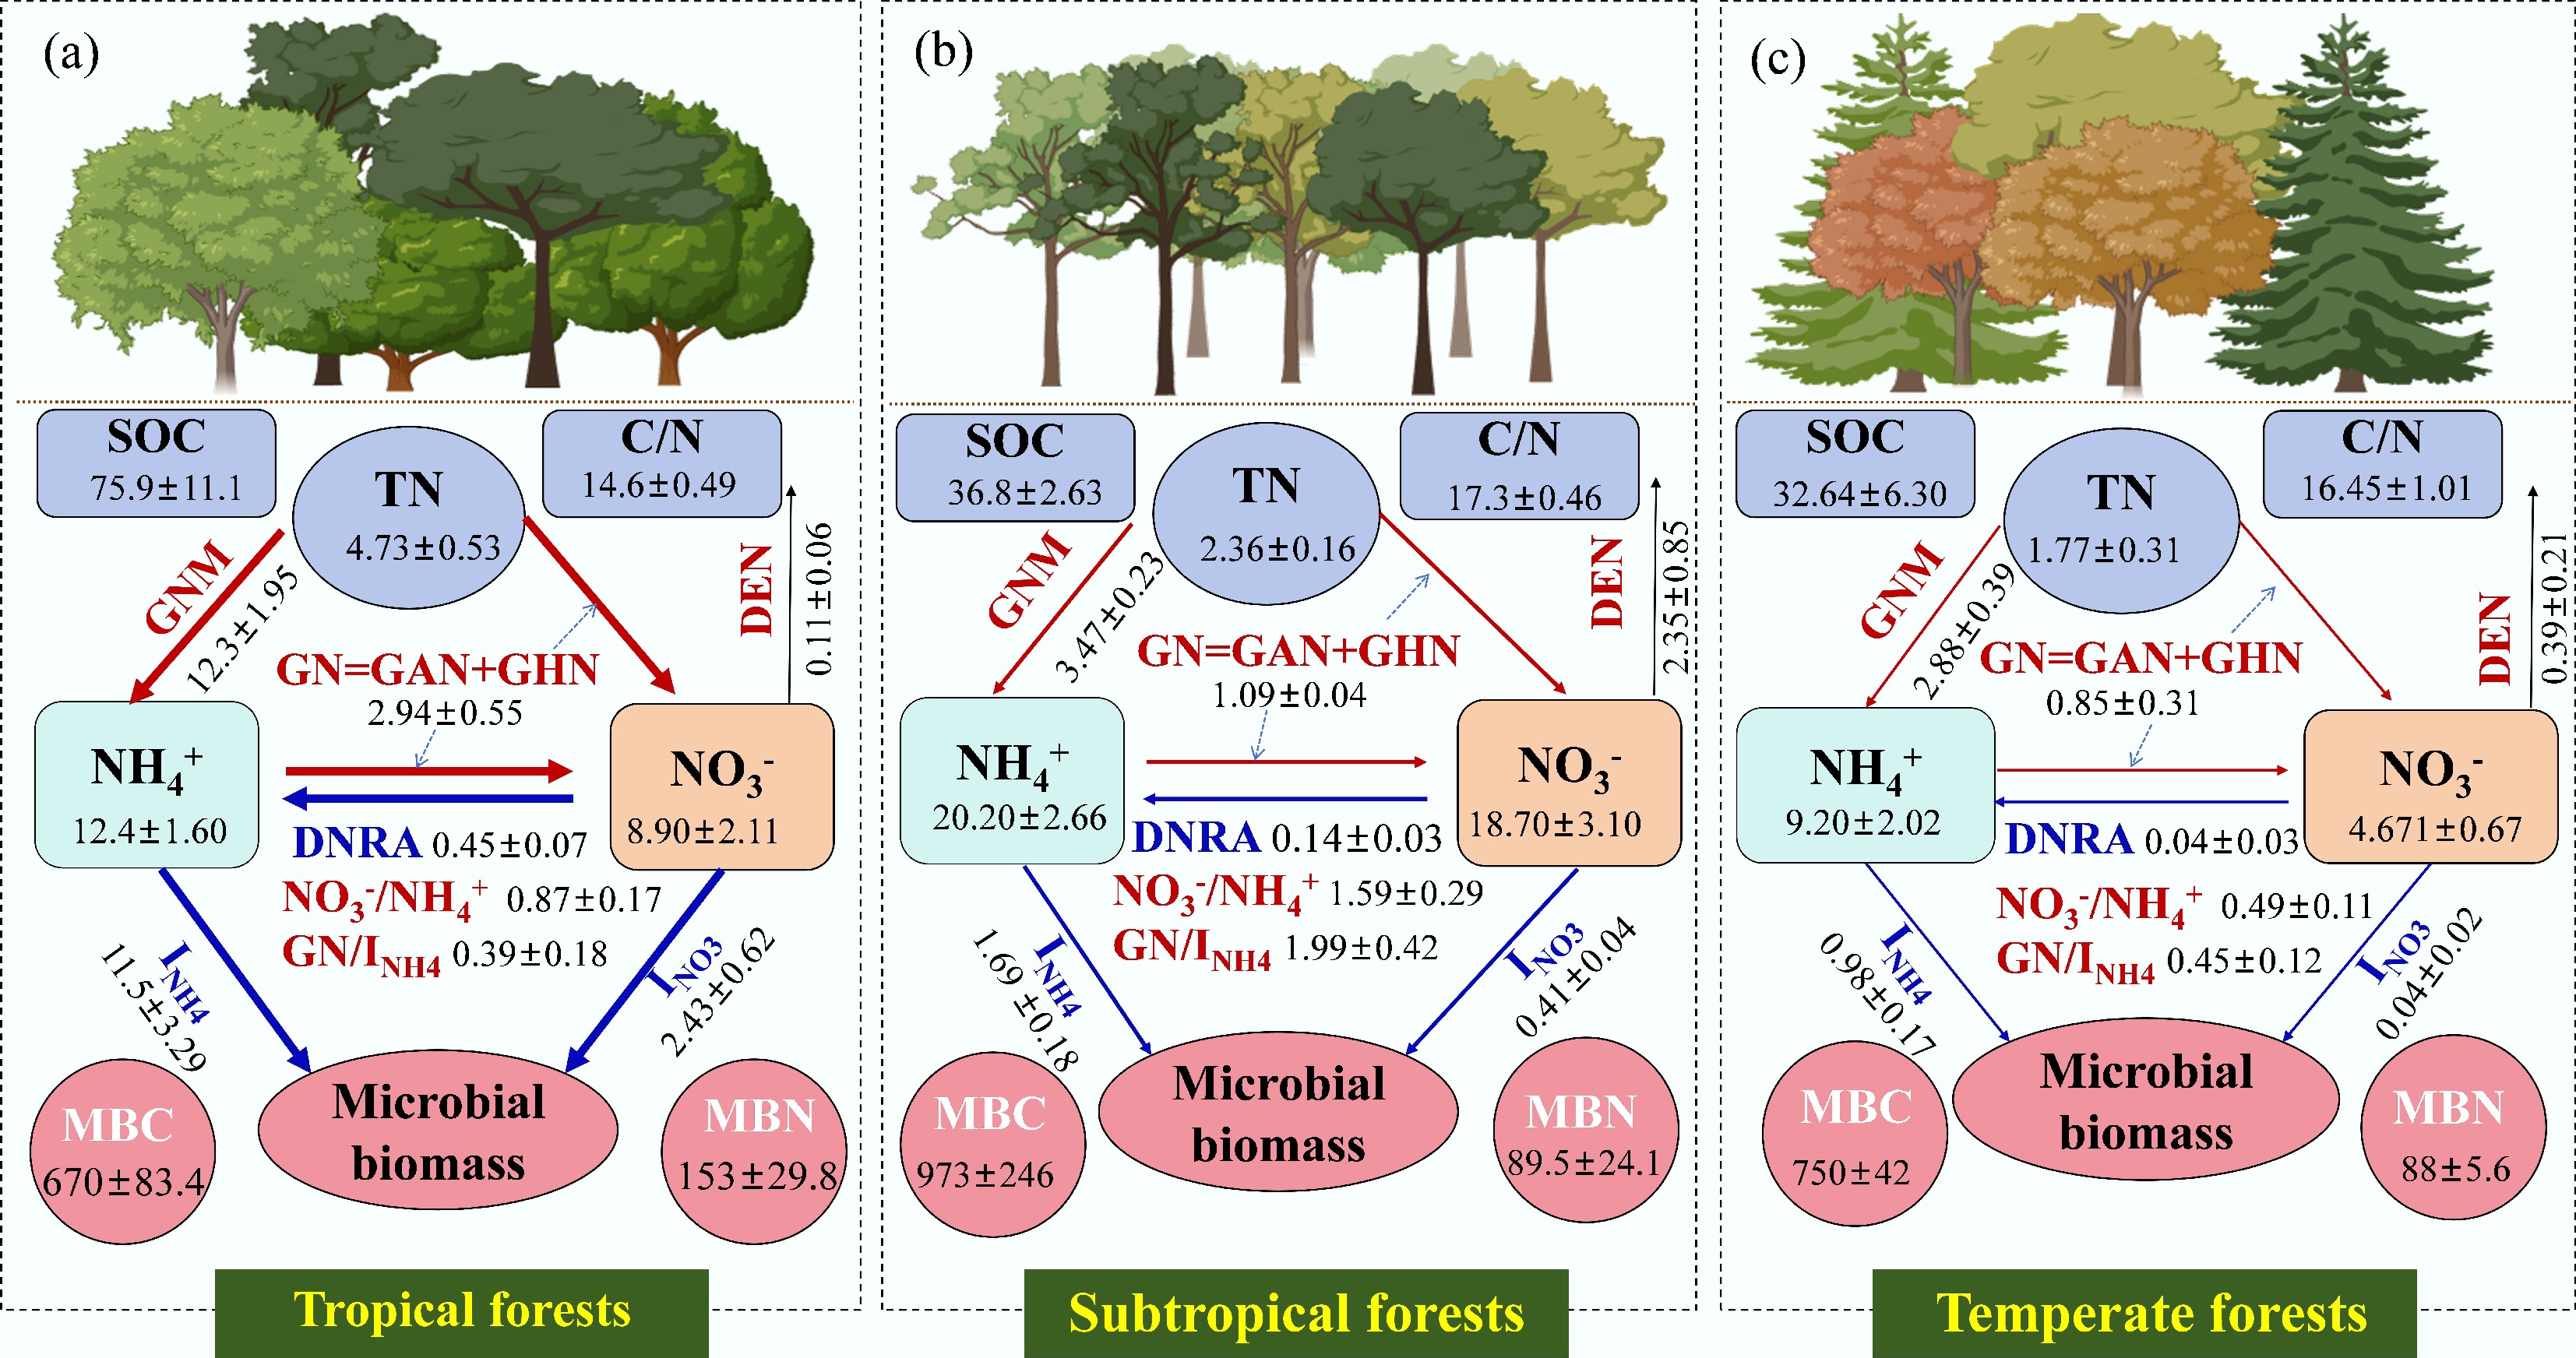
Figure 3.
Global patterns of SOC, TN, C/N ratio, available N, microbial biomass, and N transformation rates in (a) tropical, (b) subtropical, and (c) temperate forest soils. The red and blue line represents the processes of soil N production and retention, respectively. The thickness of line and arrows refers to the degree of each N transformation rate. GNM, gross N mineralization; GN, gross nitrification; GHN, gross heterotrophic nitrification; GAN, gross autotrophic nitrification; INH4, microbial NH4+ immobilization; INO3, microbial NO3− immobilization; DEN, denitrification; MBC, microbial biomass carbon; MBN, microbial biomass nitrogen. SOC, soil organic carbon; NH4+, extractable ammonium; NO3−, extractable nitrate. SOC: g kg−1, TN: g kg−1, NH4+: mg kg−1, NO3−: mg kg−1, MBC and MBN: mg kg−1; GNM, INH4, GN (GAN+GHN), INO3, DNRA and DEN: mg kg−1day−1. Data are cited from [54,126−133].
-
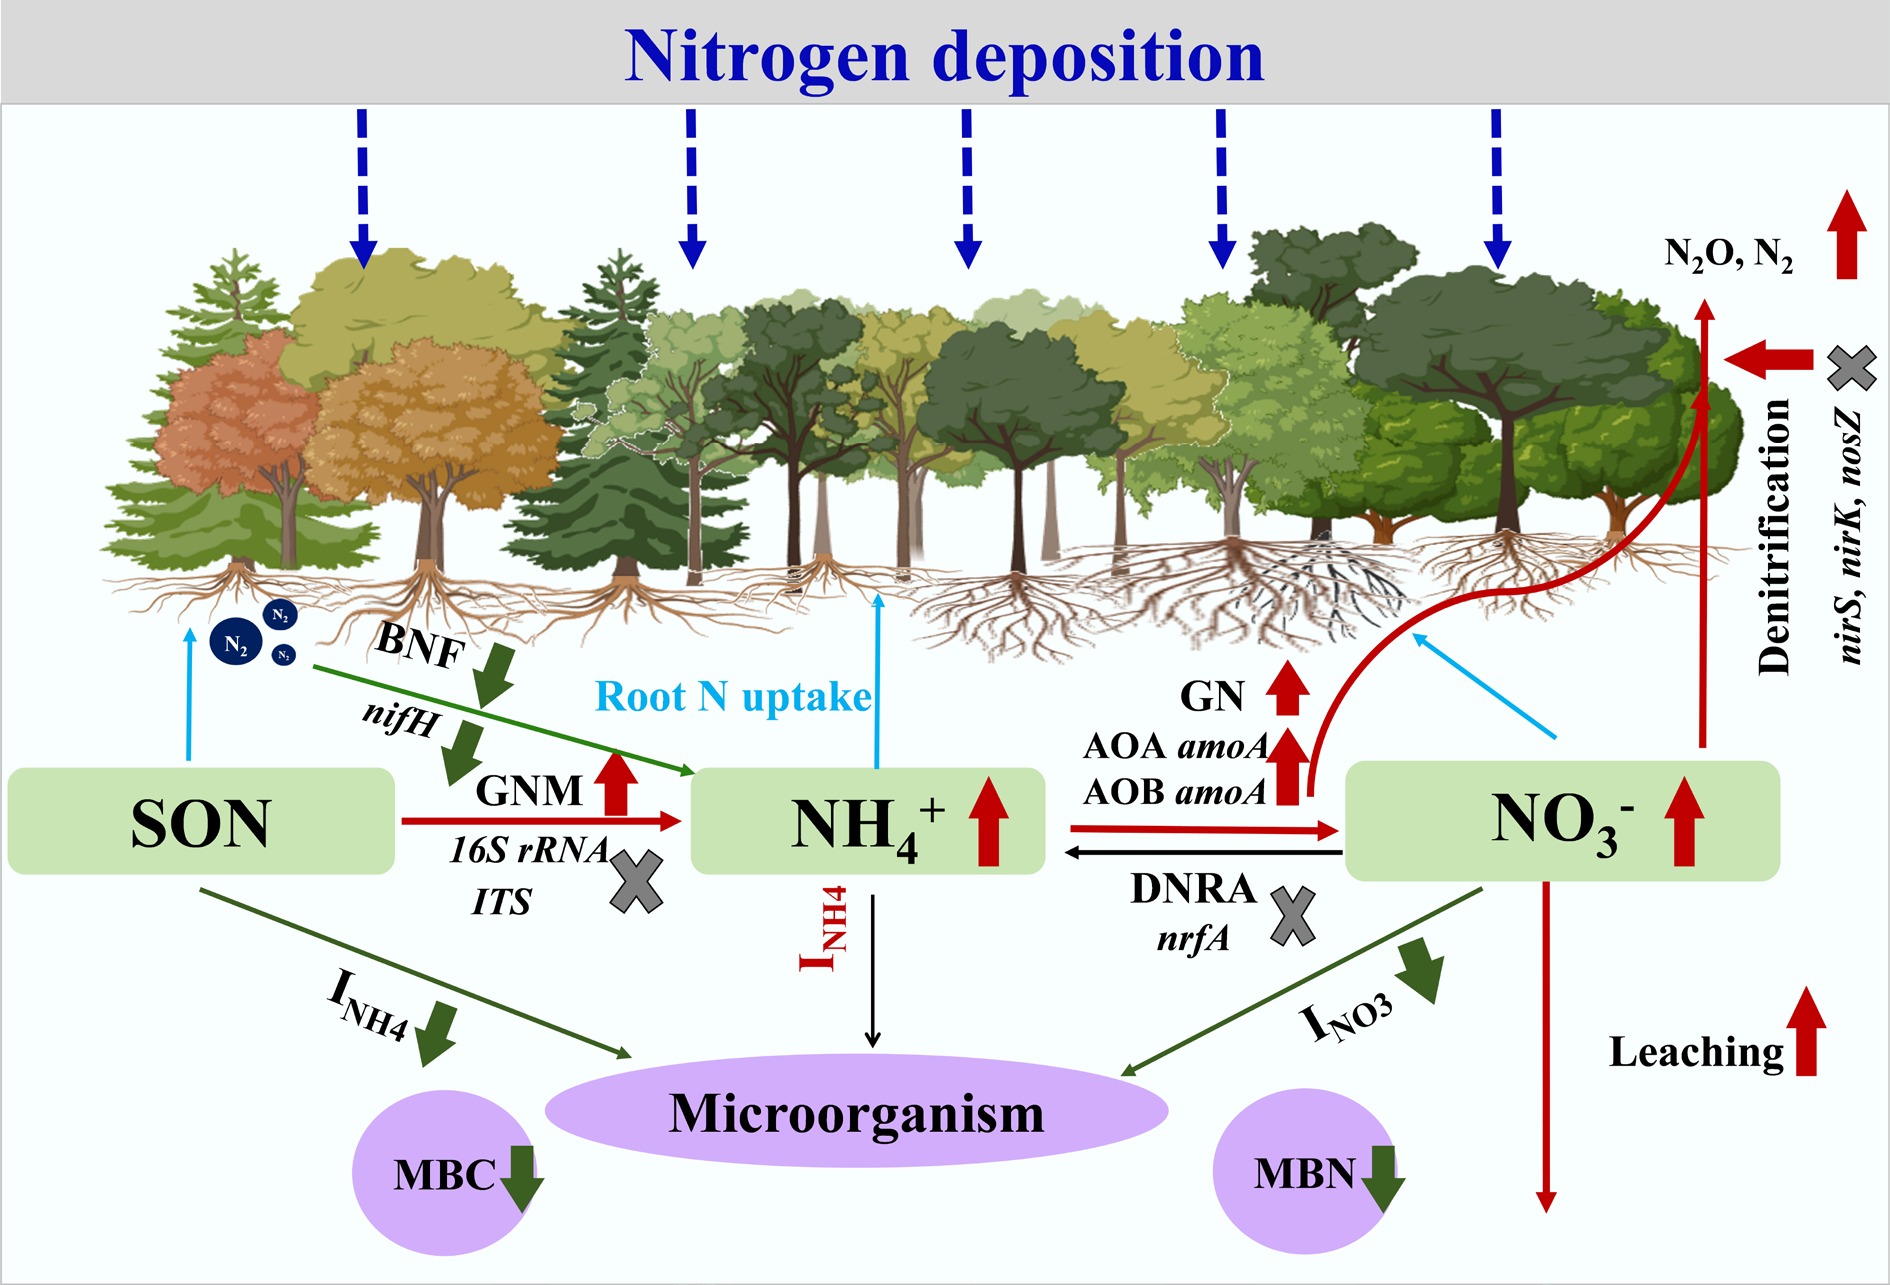
Figure 4.
The general pattern on the responses of soil microbes-driven gross N transformation to elevated N deposition in forest ecosystems. Red arrows indicate that N deposition exerts stimulatory effects on N pool size, N transformation processes, and associated fluxes, whereas gray arrows represent inhibitory effects of N deposition on these aspects. 'x' symbols denote uncertain effects under N addition.
-
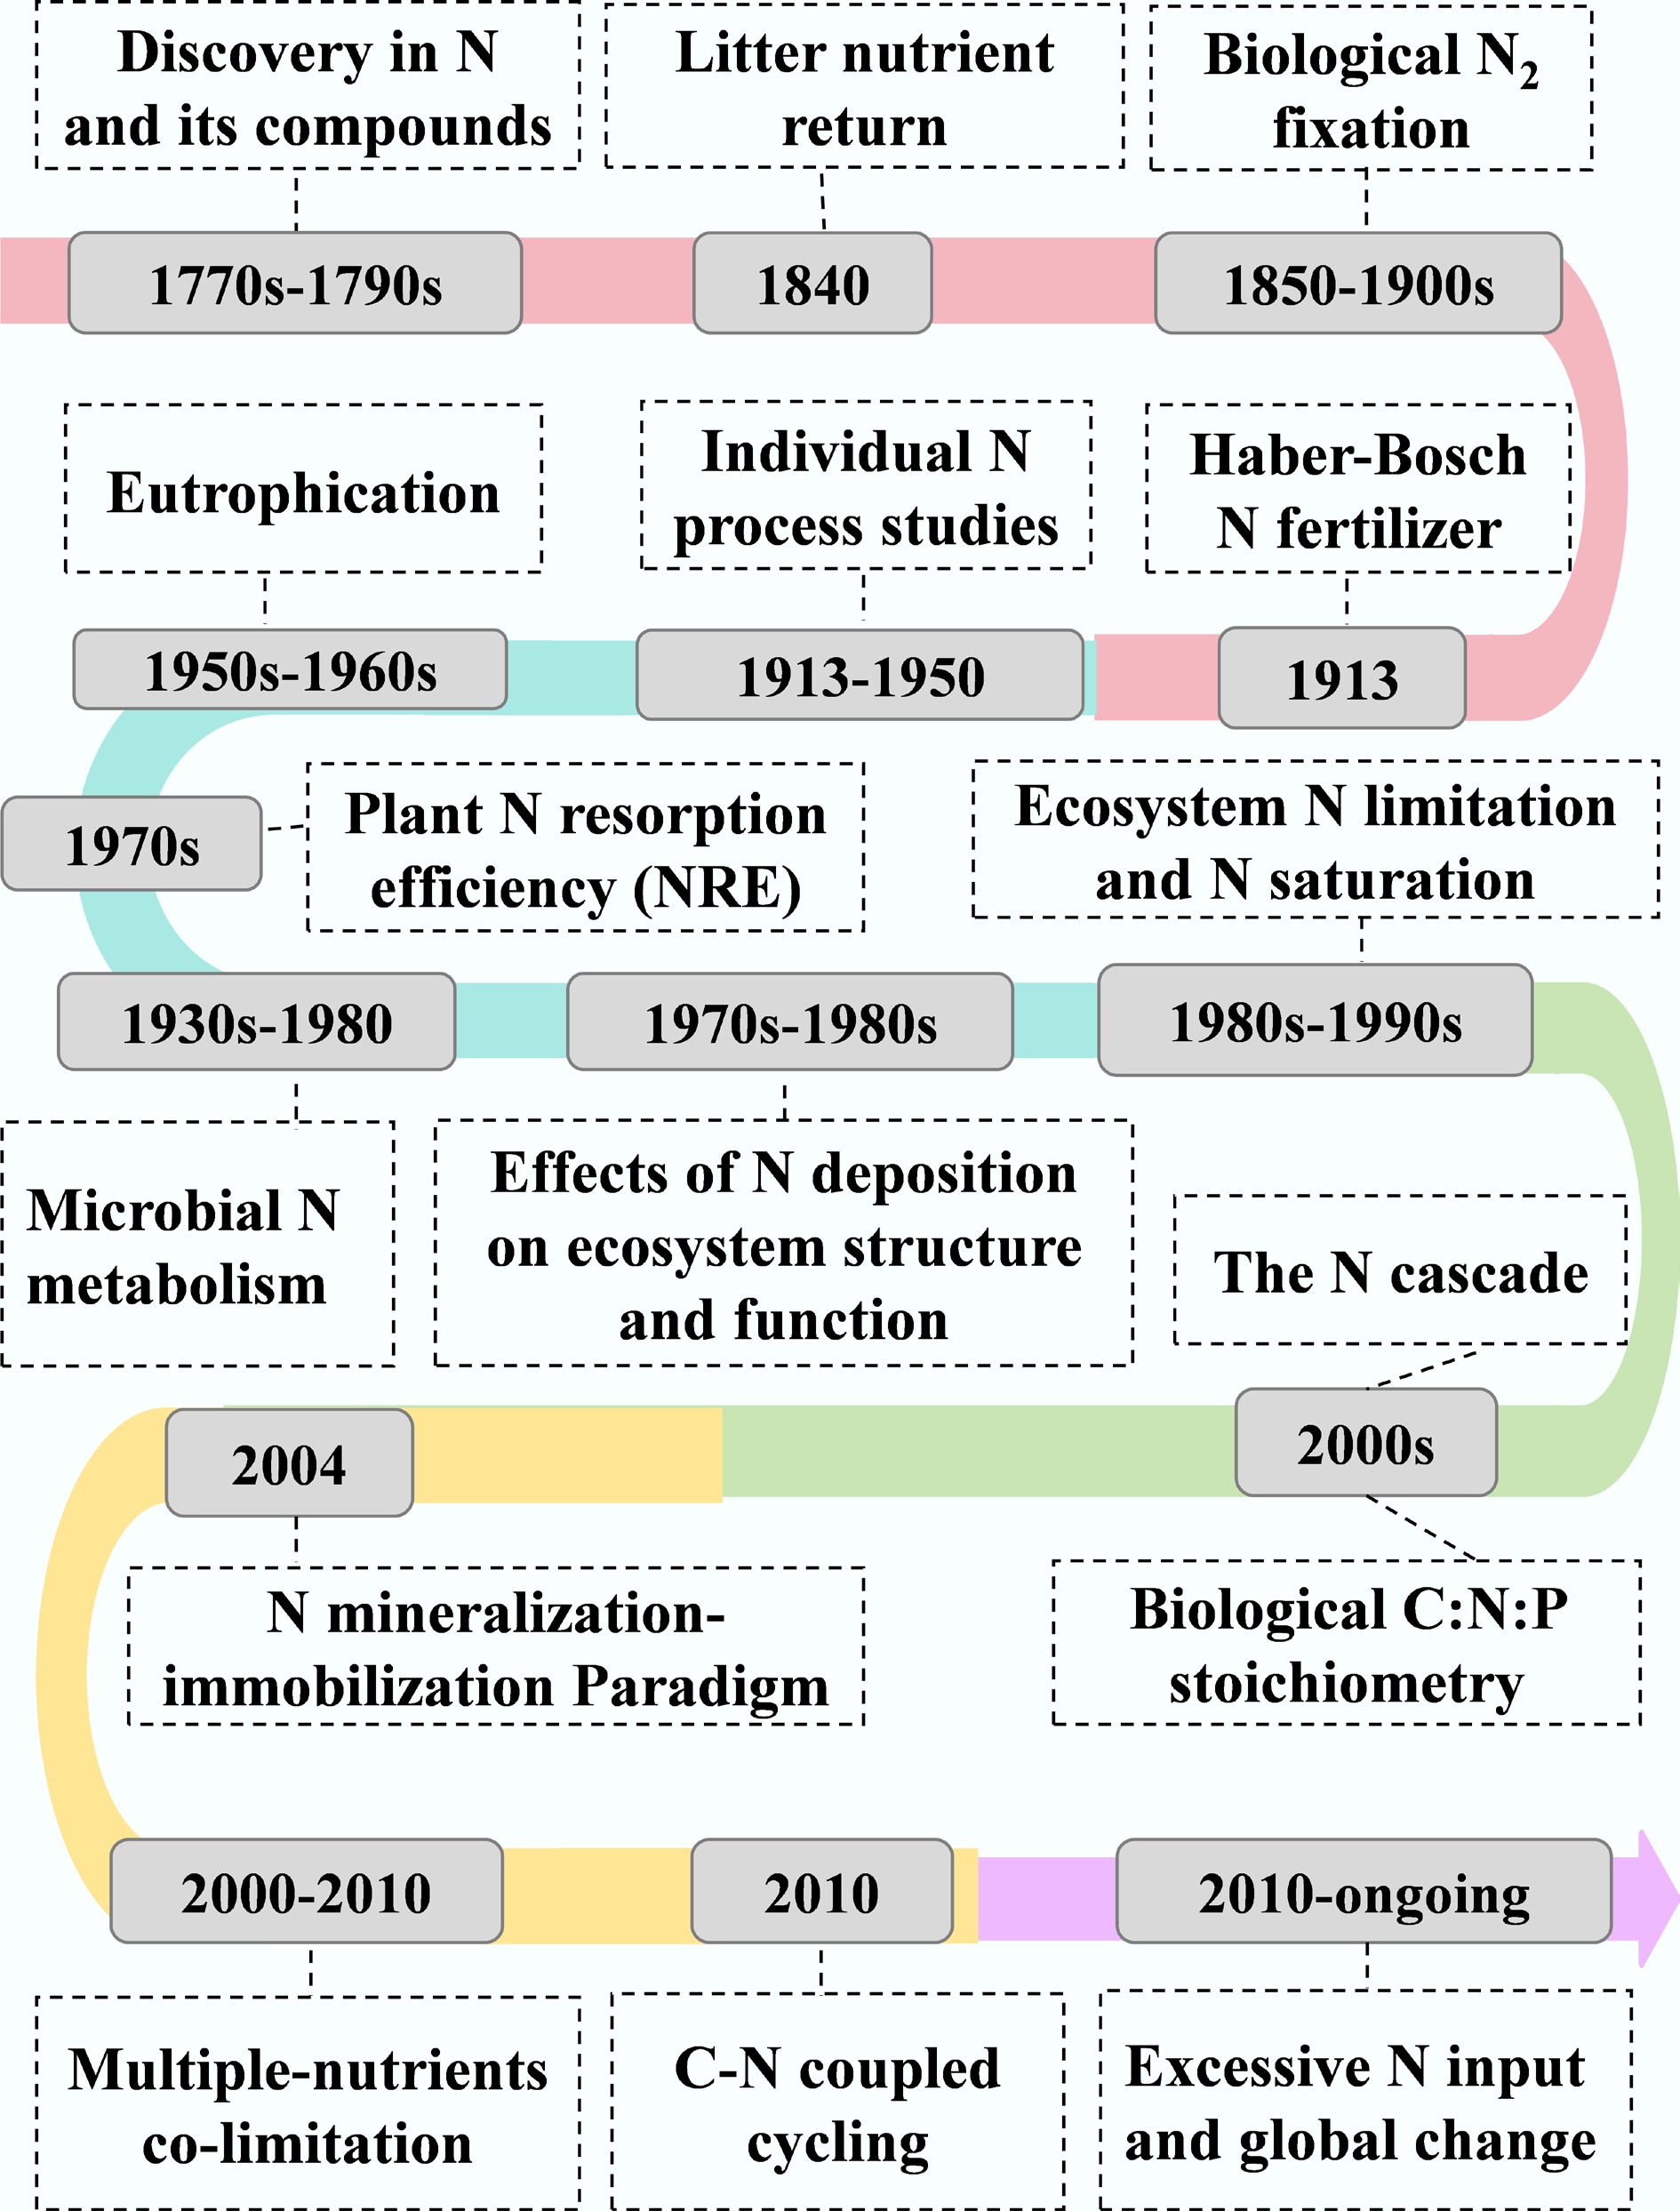
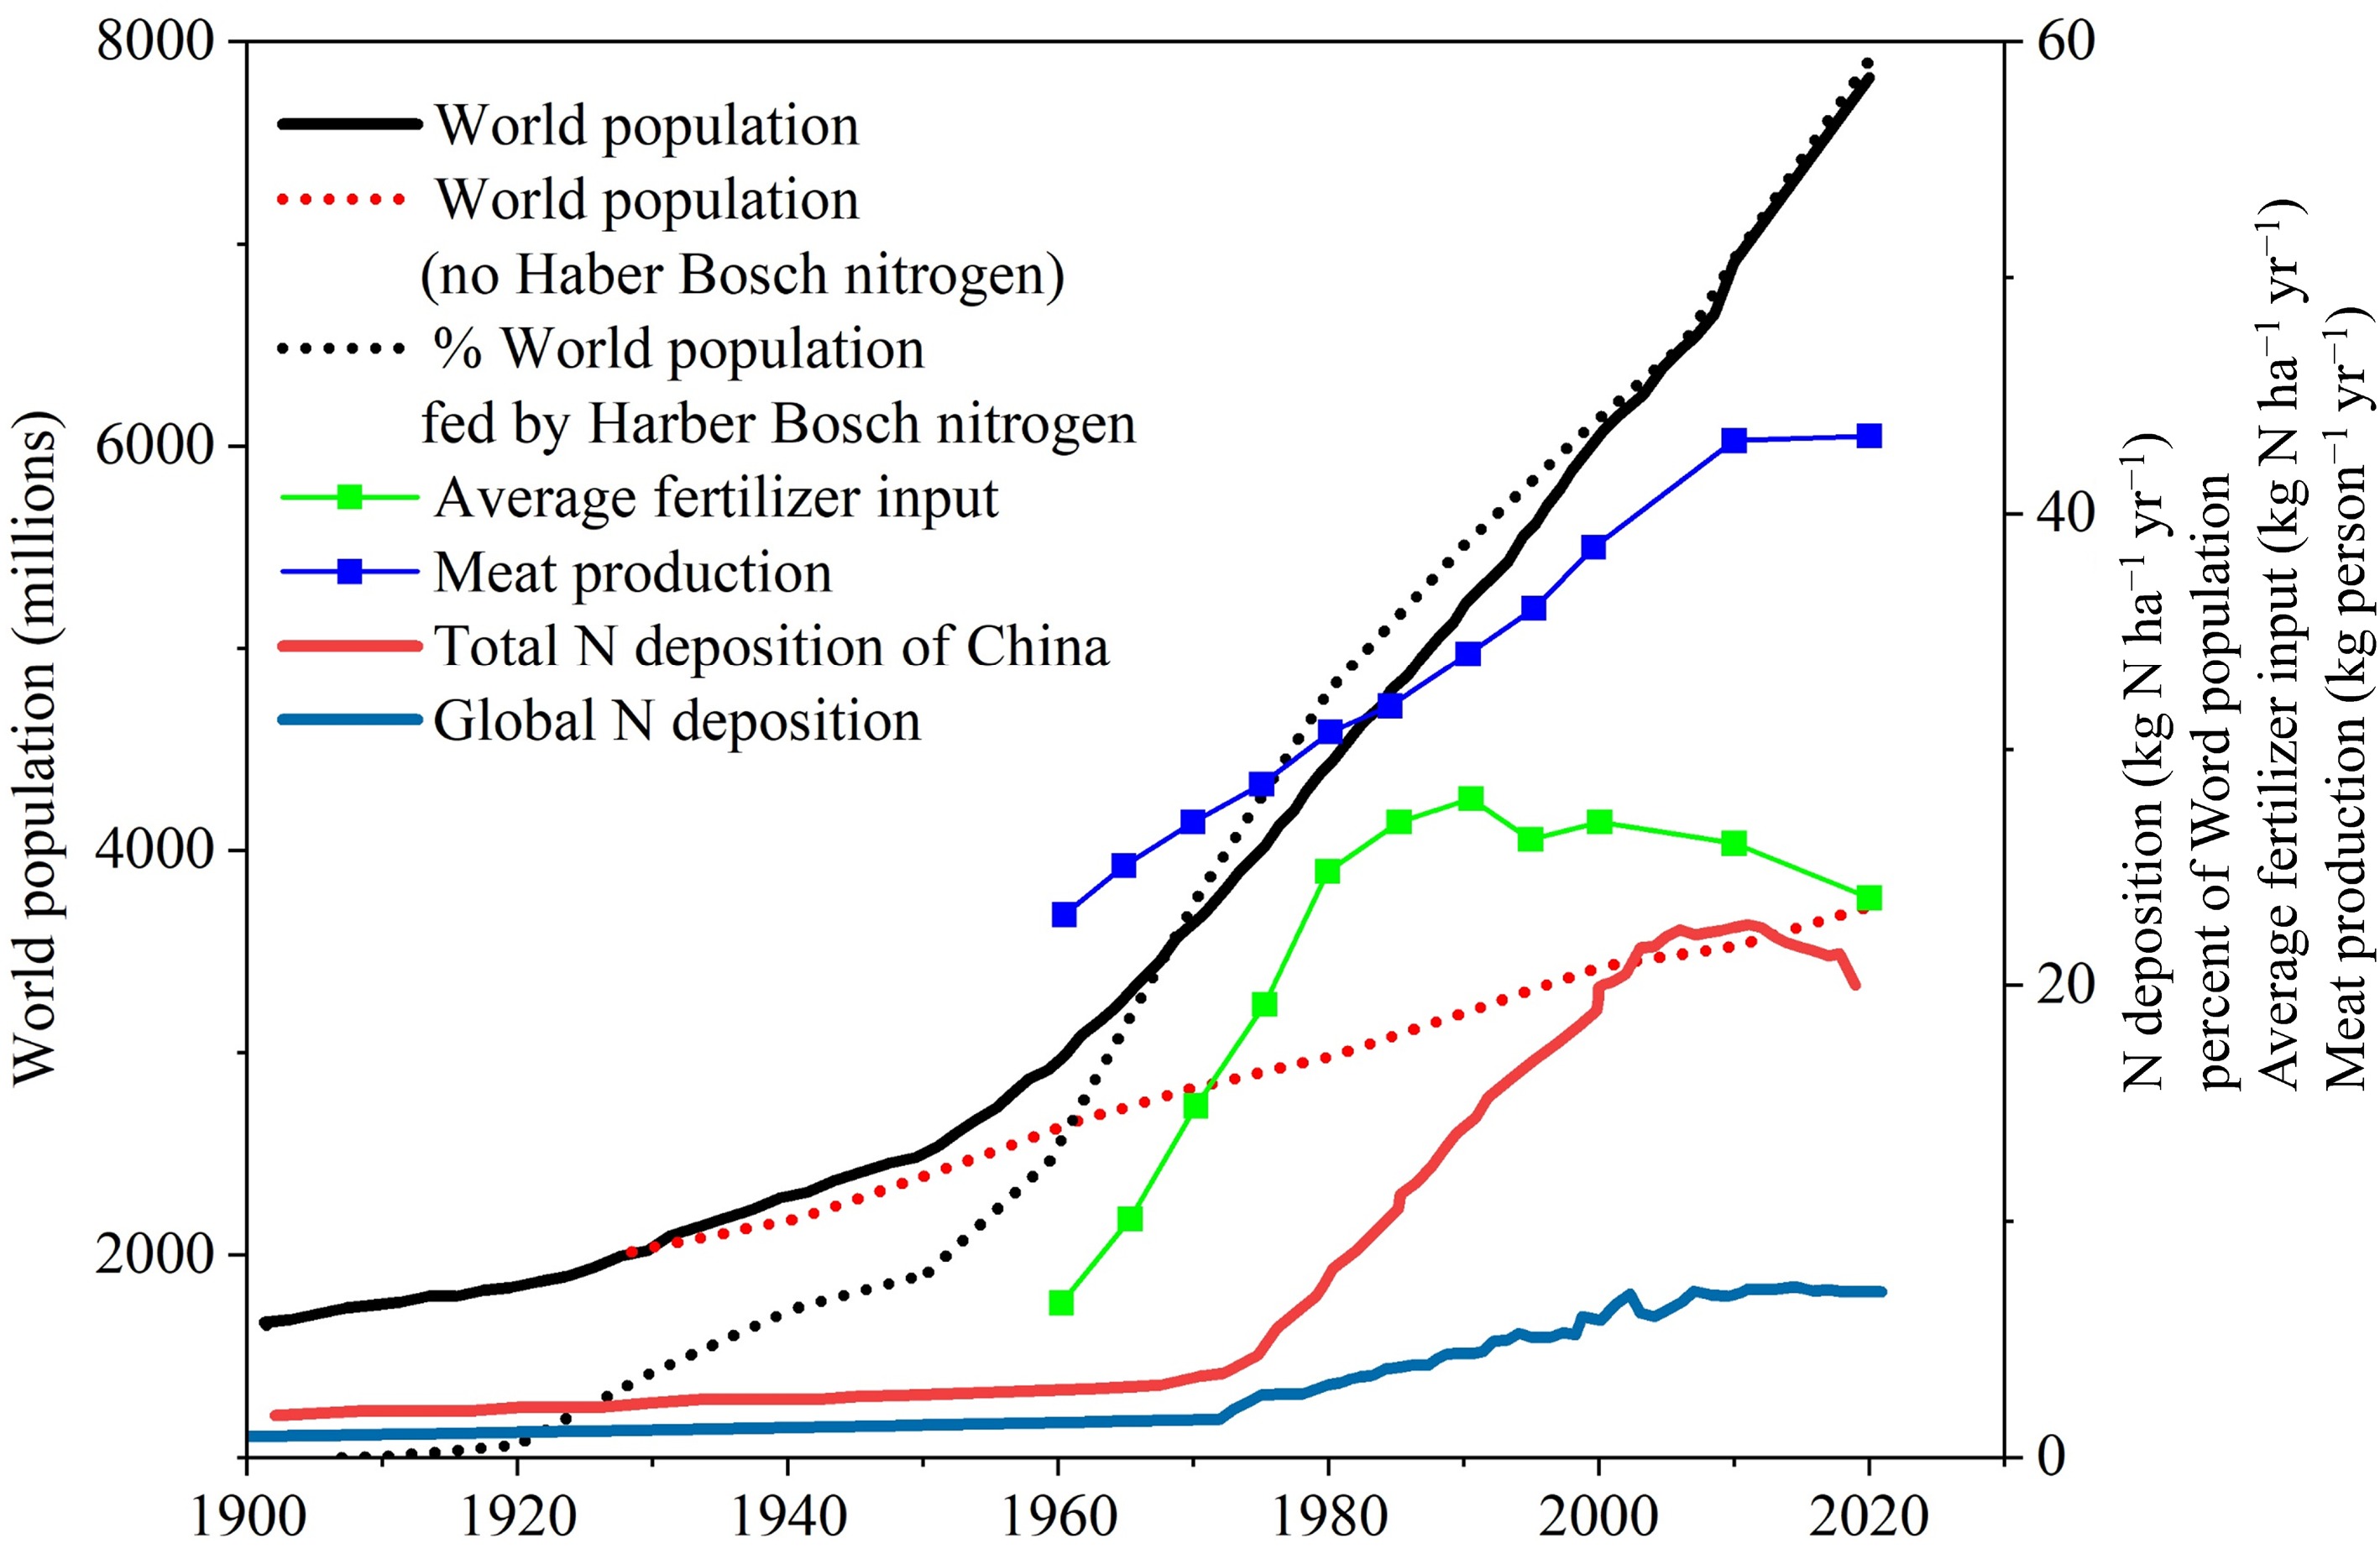
Figure 5.
Historical perspective on nitrogen biogeochemical cycling.
-
Region Estimated total deposition (kg N ha−1 yr−1) Main forms (NHx/NOγ) Critical load exceedance (% of area) Ref. Europe ~10–20 (temperate) ~60% NH4+/40% NO3− ~40% of the forest area [134] North America ~5–15 (variable) Increasing NHx fraction ~25% of the forest area [135] East and South Asia ~15–40 (hotspots > 30) NHx dominated in some sites ~60%–70% in hotspot zones [14] Sub-Saharan Africa ~2–8 (less measured) NHx emerging Unknown/limited data [14] Global average ~8 NHx:NOy = 1.5:1 Limited data [14] Data compiled from recent monitoring and modelling syntheses. Table 1.
Selected continental-scale nitrogen deposition fluxes and exceedance of critical loads
-
Process Description/transformation Key controlling factors Representative indicators/measurements Biological N2
fixation (BNF)Conversion of atmospheric N2 → NH3 by diazotrophs or symbiotic bacteria Soil P and Mo availability, temperature, moisture, and vegetation type Acetylene-reduction, 15N2 tracer,
δ15N natural abundanceMineralization (ammonification) Organic N → NH4+ C : N ratio, microbial biomass, temperature NH4+ flux, gross mineralization
(15N pool dilution)Nitrification NH4+ → NO2− → NO3− (by AOB/AOA) O2 availability, pH, temperature NO3− production, nitrifier gene abundance (amoA) Denitrification NO3− → NO → N2O → N2 under anoxia Soil moisture, C availability, redox potential N2O/N2 flux ratios (15N gas tracing) DNRA/Anammox NO3− → NH4+ (retention)/NH4+ + NO2− → N2 (loss) Organic C : NO3− ratio, anaerobiosis Isotope pairing, 15N mass balance Plant uptake and resorption Root/fungal uptake of NH4+, NO3−, or DON; N resorption from senescent leaves Root traits, mycorrhizae, soil N form availability Leaf/root N content, resorption efficiency Leaching and gaseous losses Export of NO3−/DON; emission of NO, N2O, N2 Rainfall, texture, drainage, and land use Stream NO3−, N2O flux, NO emission Table 2.
Major nitrogen cycling processes in terrestrial ecosystems, their controlling factors, and representative indicators
-
N deposition/experiment N form studied Findings from studies Future implications Ref. Atmospheric N deposition NH4+, NO3− Elevated N deposition increased both NH4+ and NO3− concentrations in forest soils in the Netherlands forest Prolonged N loading may lead to N saturation and enhanced nitrate leaching [30,136] Atmospheric N deposition (linked to urban/industrial regions) NH4+, NO3− Increased soil available nitrogen (mainly NH4+ and NO3−), especially in areas with higher population density and industrialization Continued emissions may accelerate soil N enrichment and N loss in urban ecosystems [8,30,31,38] Atmospheric N deposition NH4+, NO3− Chronic high N inputs lead to N saturation and elevated nitrate leaching Long-term high N deposition disrupts nutrient cycling and soil carbon stability [32] Atmospheric N deposition TN, NH4+, NO3− Enrichment of total and available inorganic N, accelerating nitrogen cycling and altering soil chemistry even at low deposition rates Alters ecosystem structure and functioning, e.g., species composition and productivity [33] Long-term N deposition TN, NH4+, NO3− Significantly higher total and available inorganic N in monsoon evergreen broadleaved forest than in
younger successional forestsIndicates older forests accumulate more inorganic N, reflecting stage-dependent N retention [137] Atmospheric N deposition NH4+, NO3− Enhanced inorganic N quantity and mobility through stimulated mineralization and transformation; older stands showed higher inorganic N fluxes Ecosystems are still efficient in N retention, but may reach N saturation with continued inputs [138] Atmospheric N deposition in Central African tropical forests DON, NH4+, NO3− Lowland forests lost N mainly as DON, others as inorganic N; tight N cycling but growing input-output imbalance Potential for future N saturation or shifts in dominant N forms [2,35] Meta-analysis of N deposition studies NH4+, NO3− Enhanced mineralization and nitrification increased inorganic N availability and possible N losses Broad-scale acceleration of N cycling and potential for increased N leaching [9] Long-term ammonium nitrate deposition NH4+, NO3− Despite long-term deposition, NH4+ and NO3− remained stable, indicating strong N limitation and ecosystem resilience Boreal forests remain resistant to N saturation, unlike temperate/tropical systems [36] Table 3.
Effects of elevated nitrogen deposition on ecosystem nitrogen forms in forests
-
Controlling factor Mechanism of action Main affected systems Adaptive responses Iron deficiency Limited synthesis of nitrogenase cofactors Marine systems, calcareous soils Increased secretion of iron chelators Phosphorus deficiency Inadequate ATP supply, constrained energy metabolism Tropical soils, lateritic soils Enhanced phosphatase activity, increased
phosphorus uptakeMolybdenum limitation Impaired function of iron-molybdenum cofactors Acidic soils, marine environments Alternative pathways (e.g., using iron-vanadium
nitrogenase)Oxygen sensitivity Nitrogenase deactivation Aerobic environments Formation of heterocysts, increased respiration,
spatial-temporal separationCarbon limitation Insufficient energy supply Barren soils, deep-sea environments Symbiosis with photosynthetic organisms, utilization of organic carbon Table 4.
Limiting factors of biological nitrogen fixation
Figures
(5)
Tables
(4)