-
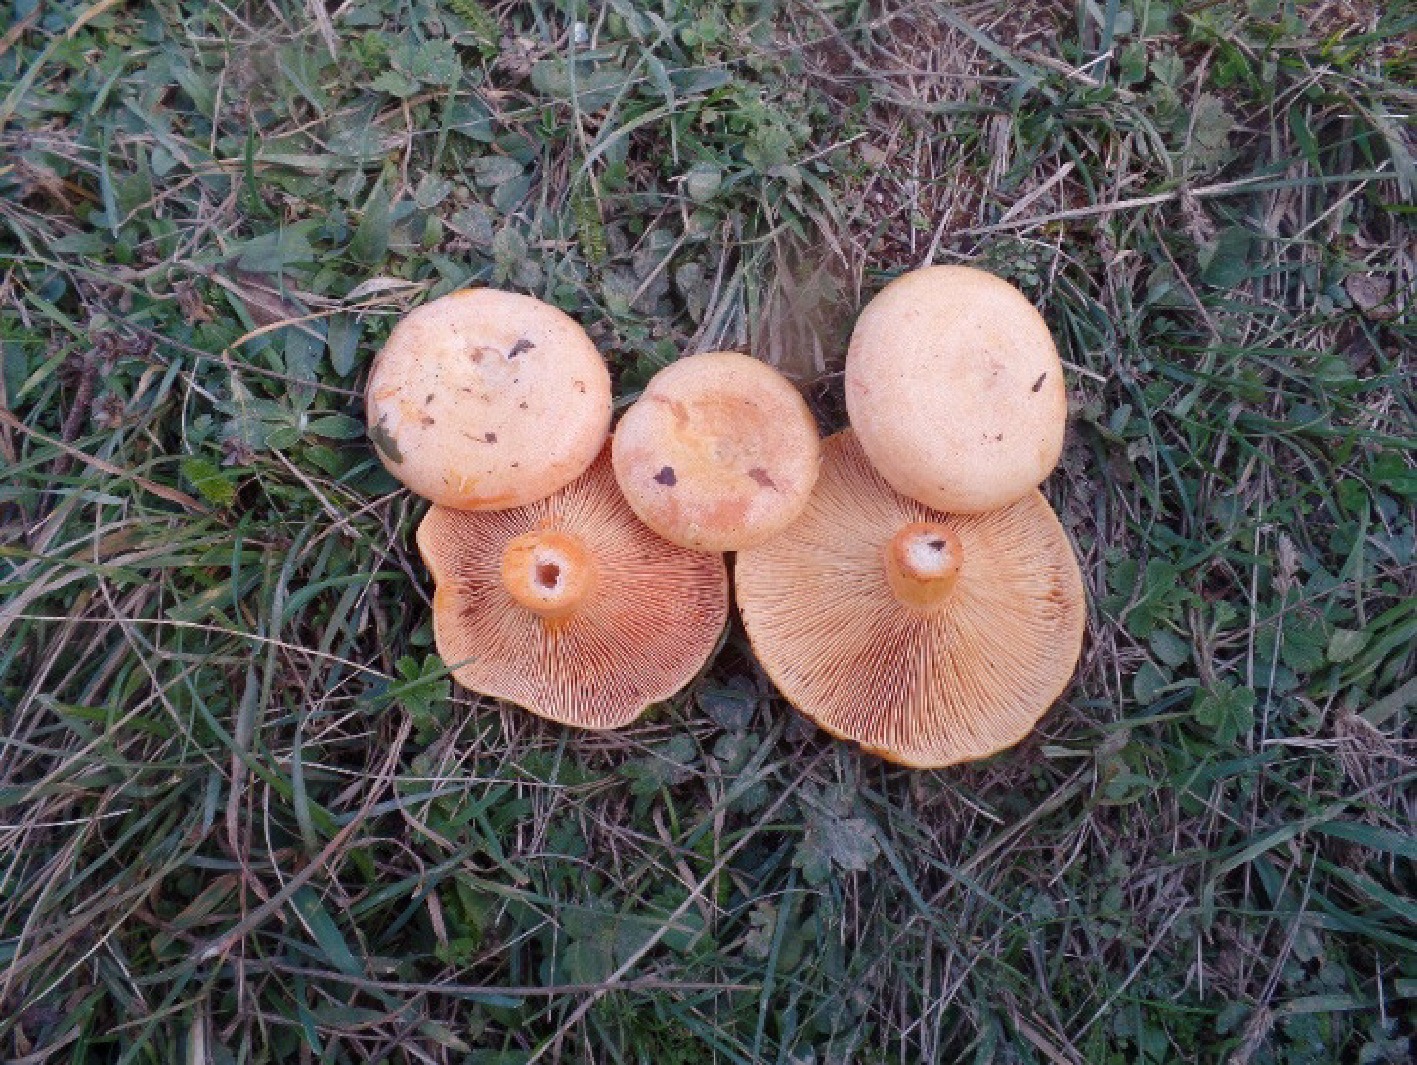
Figure 1.
Wild basidiomata Lactarius salmonicolor in situ.
-
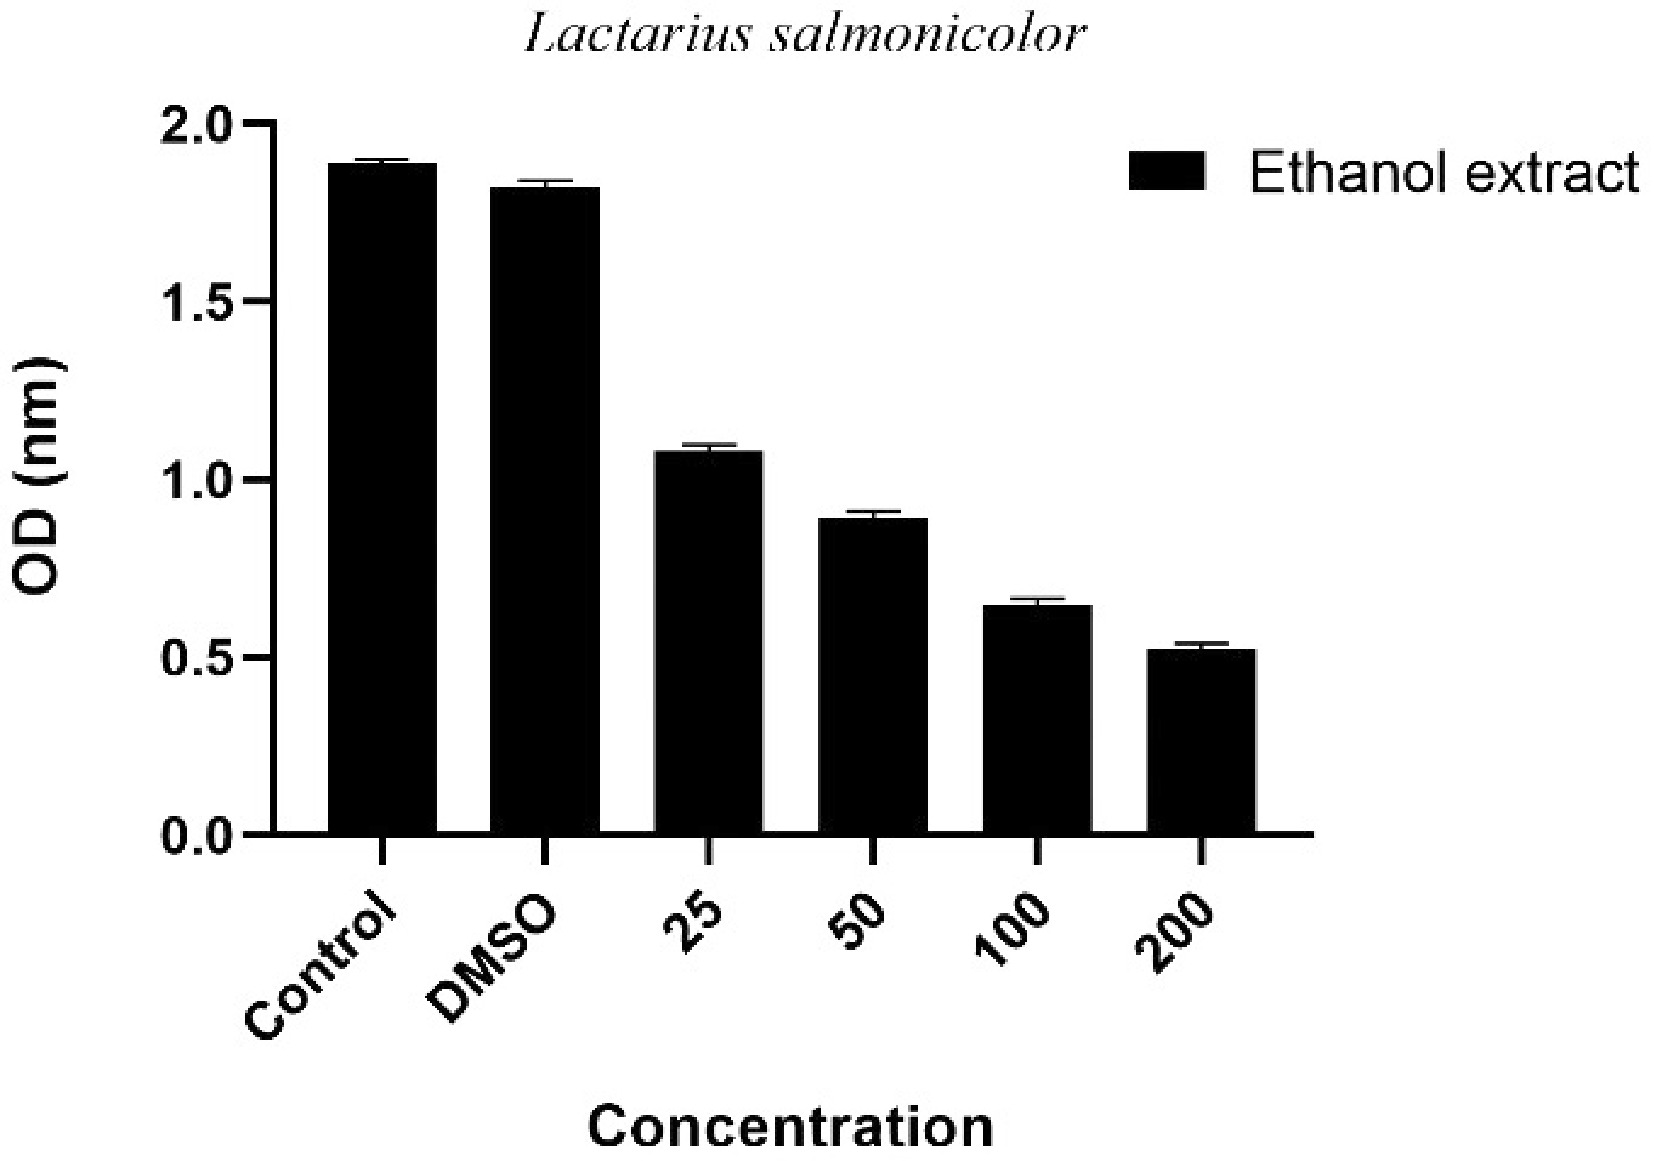
Figure 2.
Dose-dependent antiproliferative effect of Lactarius salmonicolor ethanol extract on A549 lung cancer cells. Control: Group kept only in the medium without any chemical substance applied; DMSO: Control group applied only to DMSO together with the medium; Extract applied groups: Experimental groups given mushroom extract at concentrations of 25, 50, 100, and 200 µg/mL; Values represent mean ± standard deviation (Std).
-
Sample TAS (mmol/L) TOS (µmol/L) OSI (TOS/[TAS x 10]) Lactarius salmonicolor 3.844 ± 0.049 10.452 ± 0.126 0.272 ± 0.001 * Values were analysed with three repetitions and standard deviation values are given; TAS: Total Antioxidant Status (mmol/L), TOS: Total Oxidant Status (μmol/L); OSI: Oxidative Stress Index (calculated as (TOS/[TASx10]). Table 1.
Total antioxidant and oxidant status and oxidative stress index of Lactarius salmonicolor.
-
Sample AChE (μg/mL) BChE (μg/mL) Lactarius salmonicolor 58.43 ± 1.58 88.45 ± 1.57 Galantamine 7.61 ± 0.21 15.67 ± 0.18 * Values were studied with three repetitions and standard deviation values are given; AChE: Acetylcholinesterase (μg/mL), BChE: Butyrylcholinesterase (μg/mL). Table 2.
Anticholinesterase activity of Lactarius salmonicolor.
-
A B C D E F G H J Lactarius salmonicolor extract 100 100 200 400 400 400 100 50 50 50, 100, 200, 400 µg/mL represents the lowest concentration that stops the growth of microorganisms. A: Staphylococcus aureus ATCC 29213, B: methicillin-resistant S. aureus (MRSA) ATCC 43300, C: Enterococcus faecalis ATCC 29212, D: Escherichia coli ATCC 25922, E: Pseudomonas aeruginosa ATCC 27853, F: Acinetobacter baumannii ATCC 19606, G: Candida albicans ATCC 10231, H: C. krusei ATCC 34135, J: C. glabrata ATCC 90030 Table 3.
Minimum inhibitory concentration values of Lactarius salmonicolor.
Figures
(2)
Tables
(3)