-
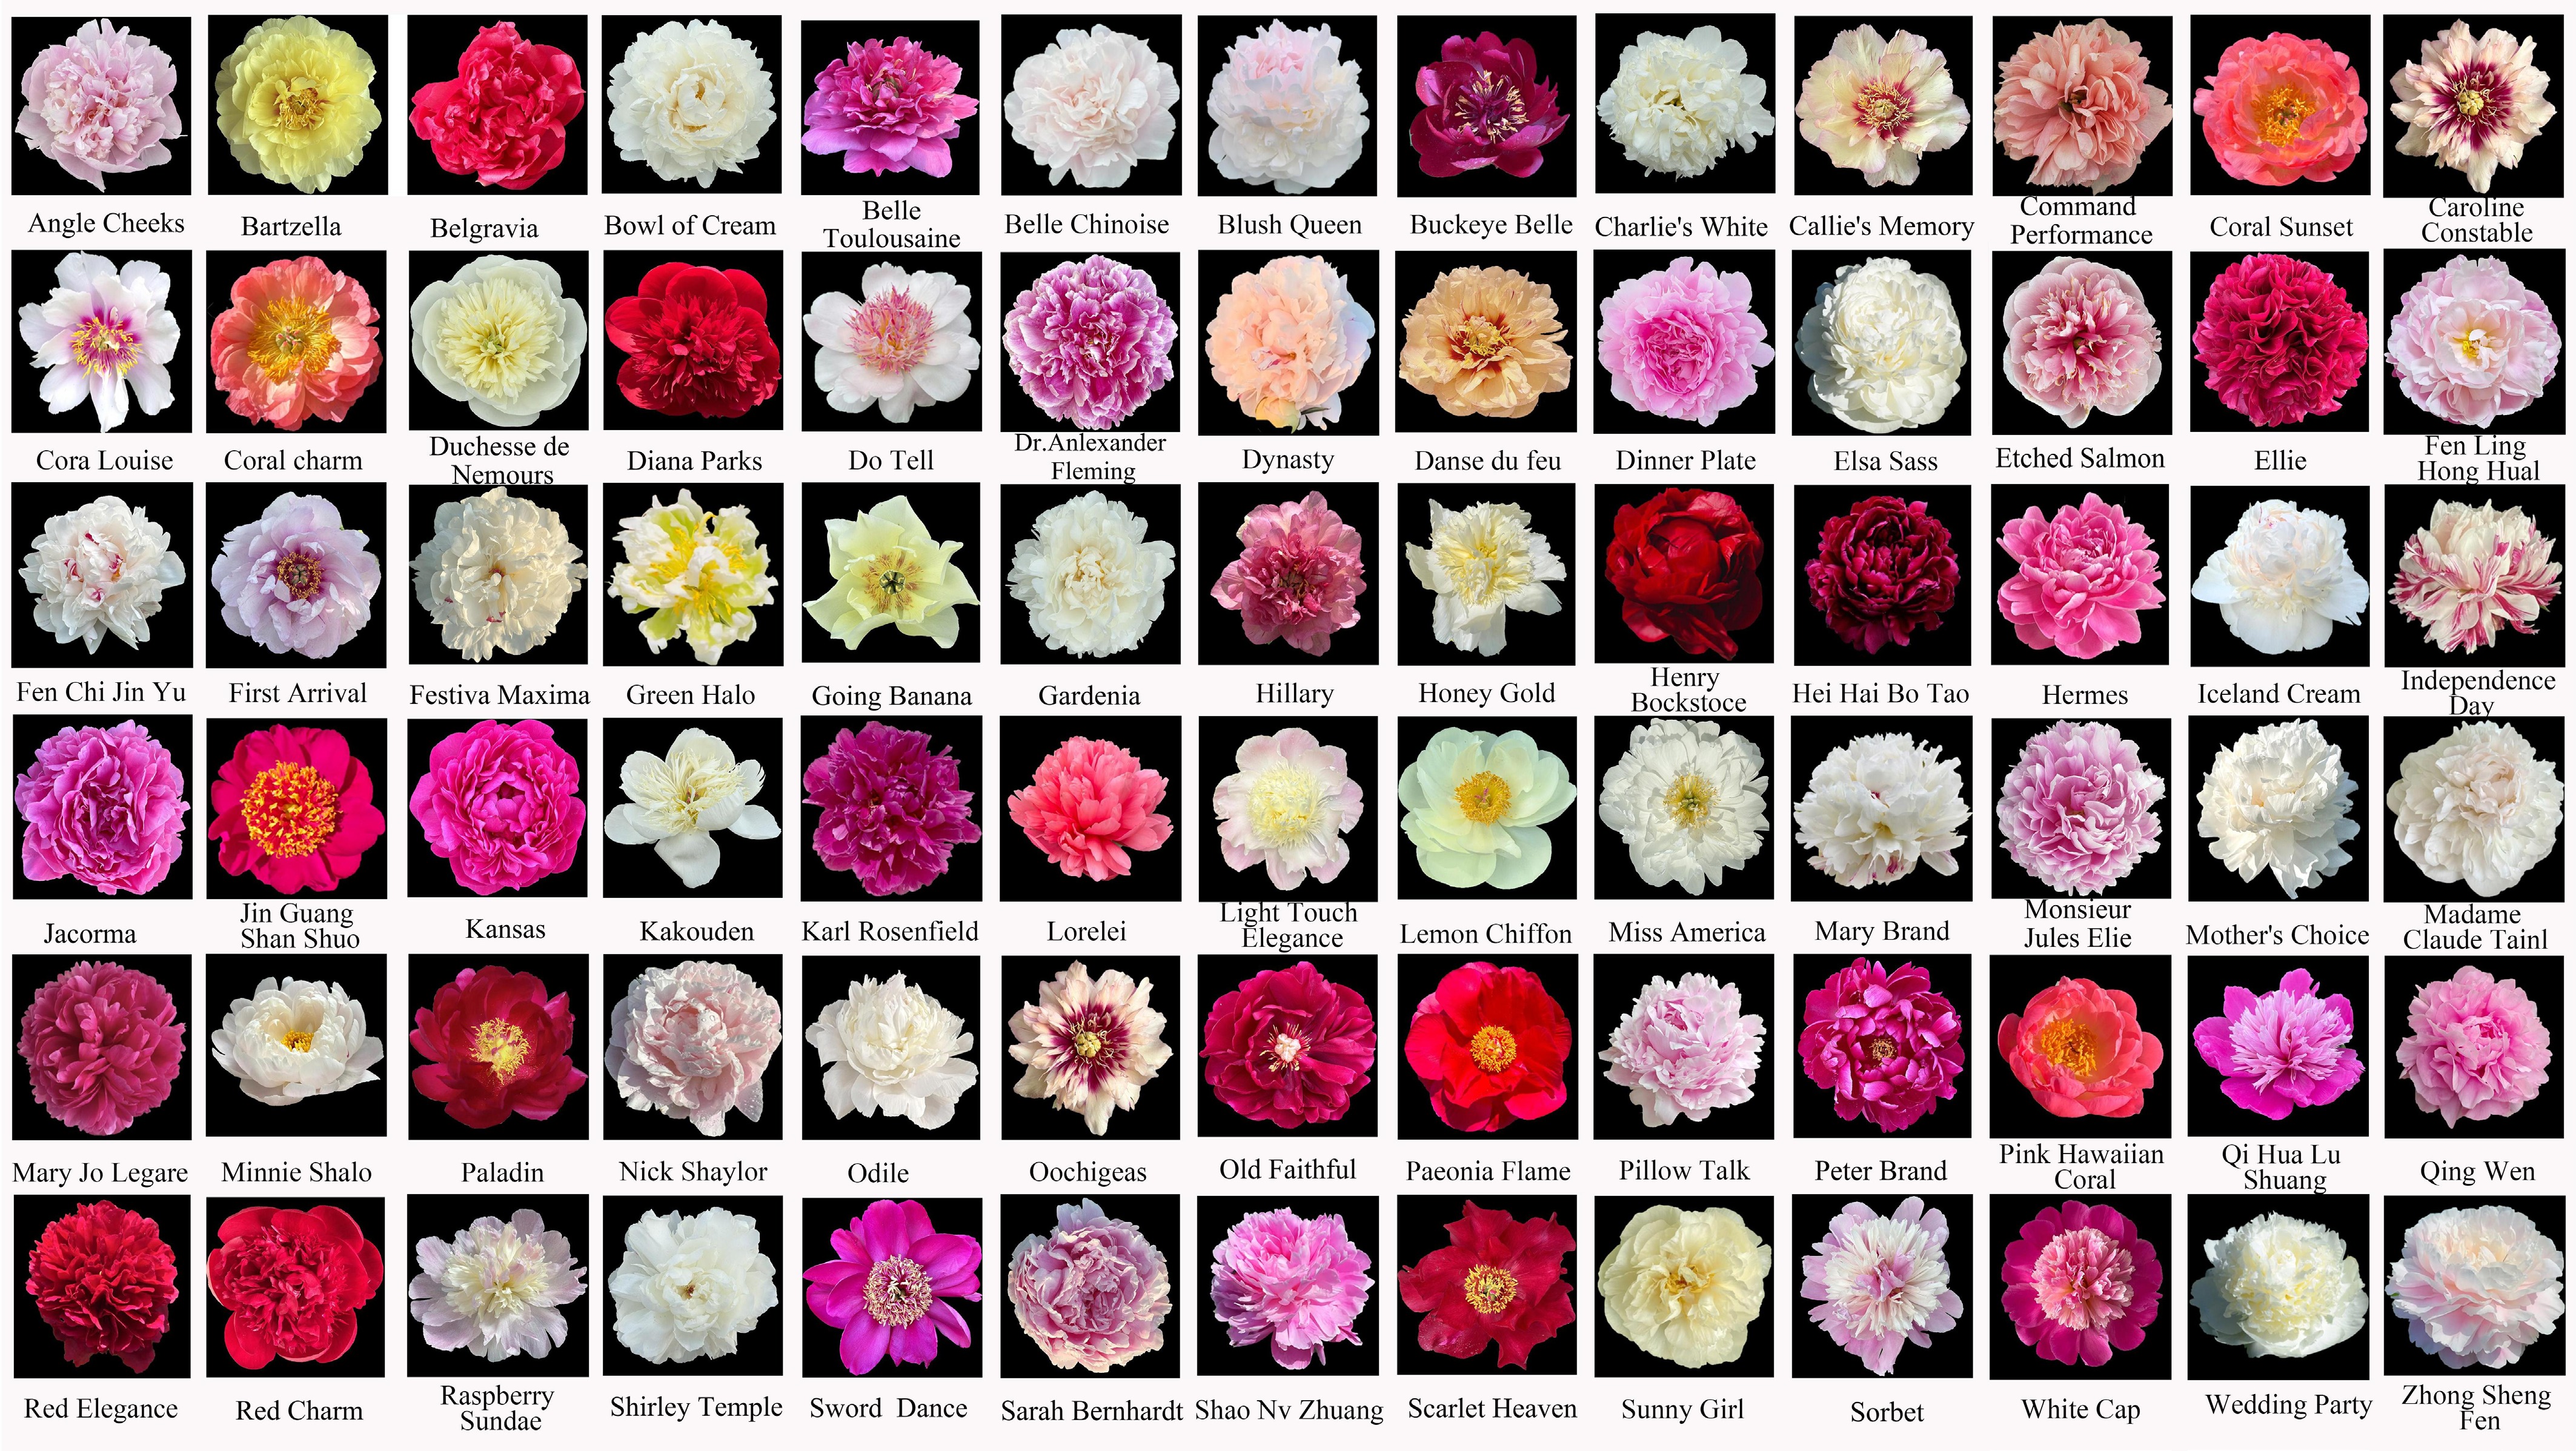
Figure 1.
Floral diversity among the 78 herbaceous peony cultivars evaluated. Images show representative flowers at full bloom, with cultivar names labeled.
-
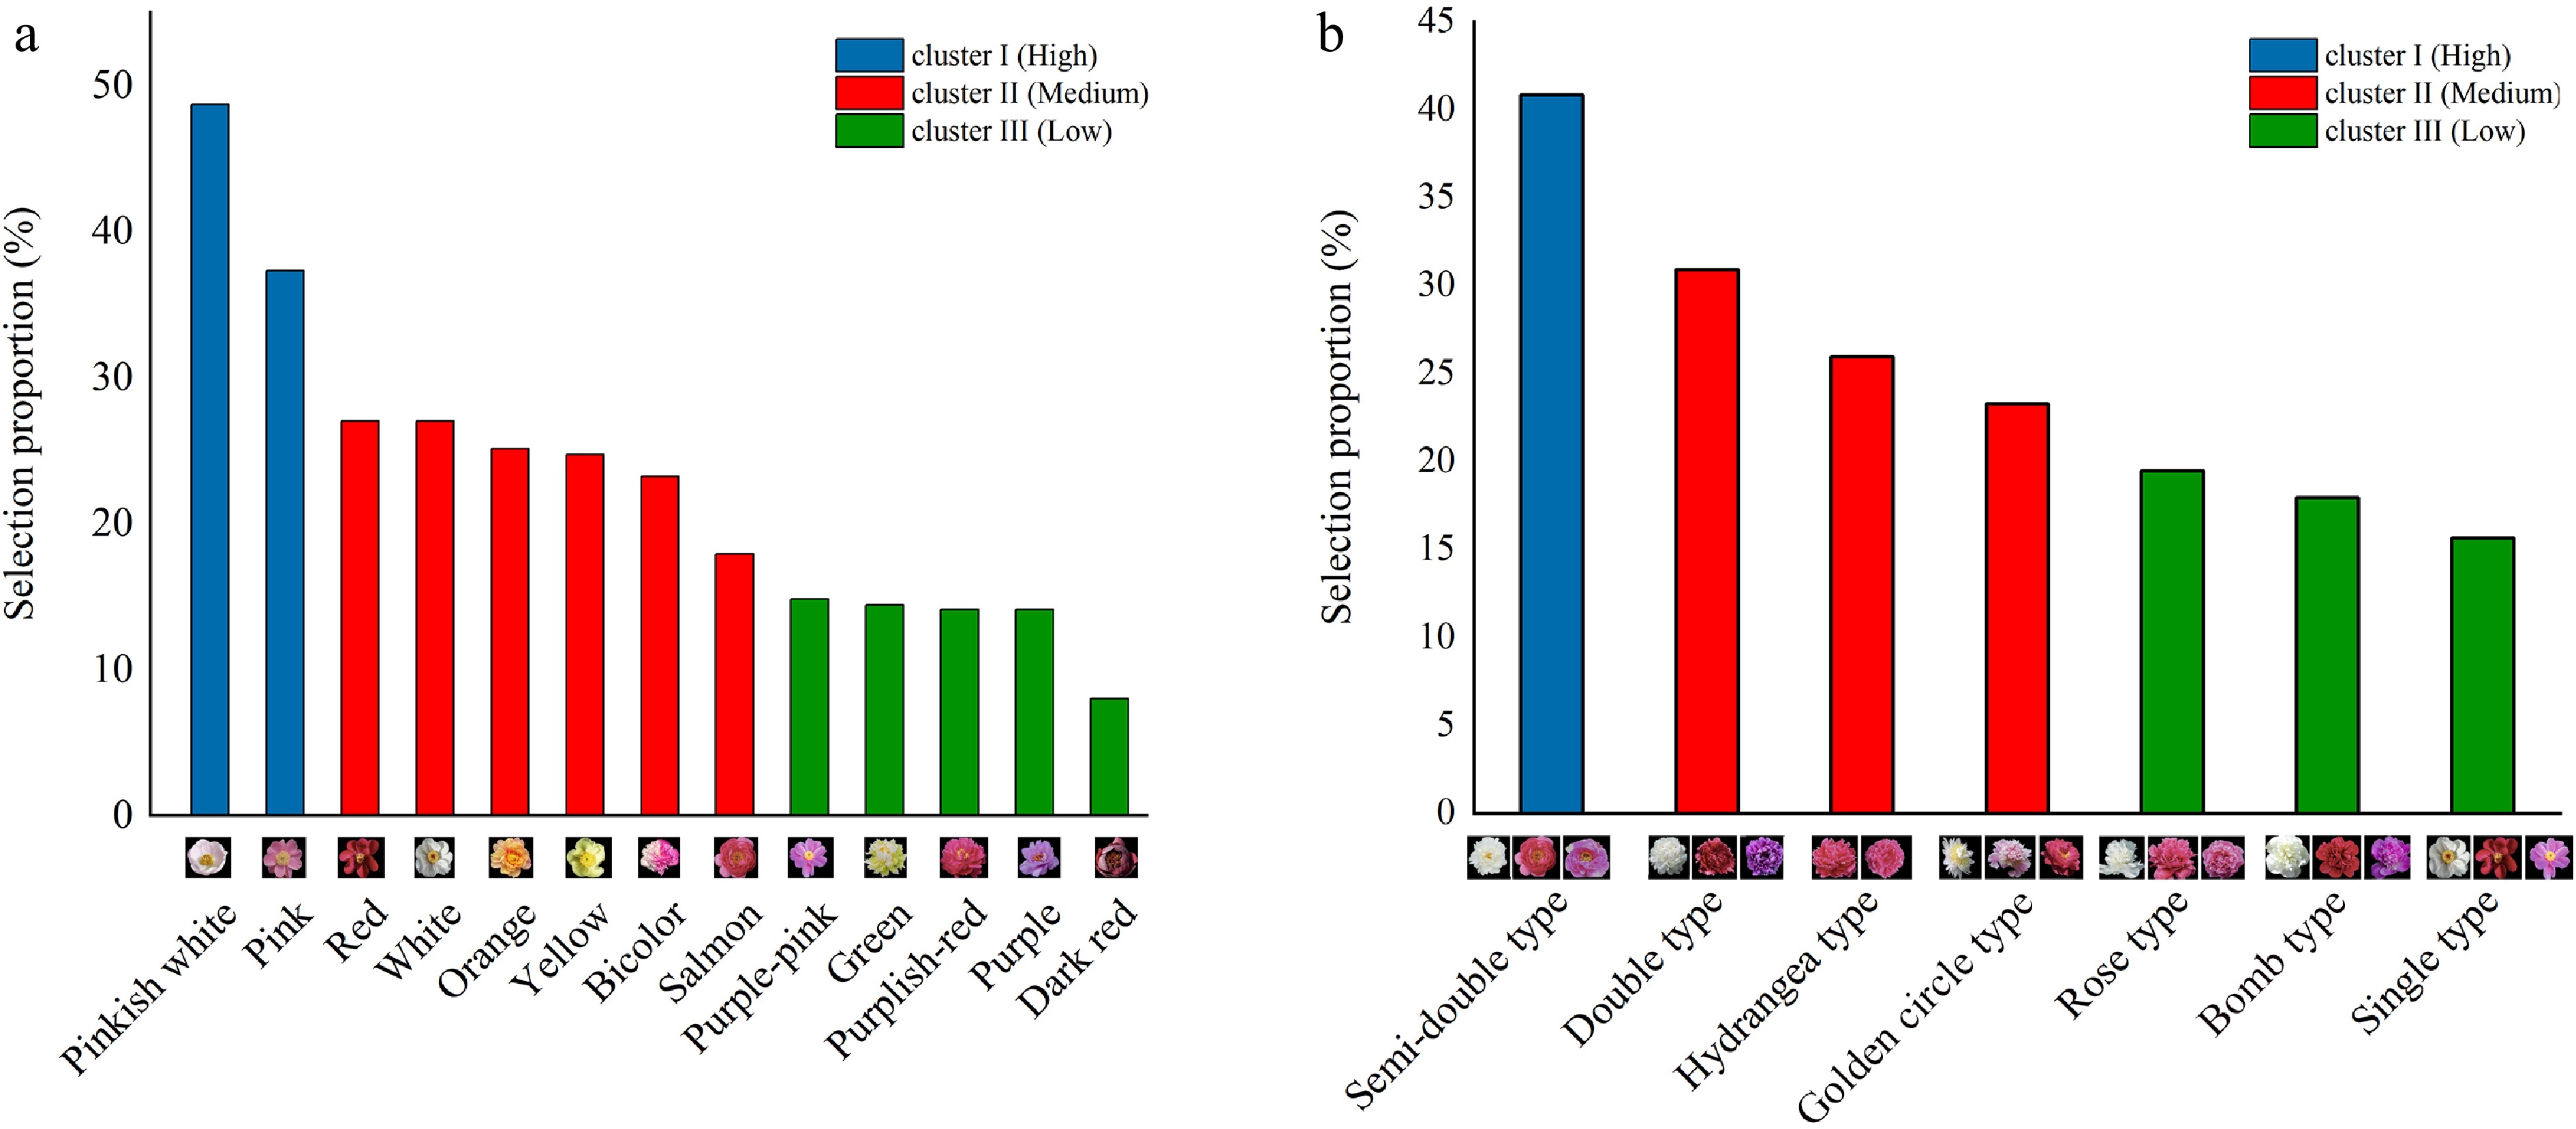
Figure 2.
Consumer preference survey results and K-means clustering analysis of (a) flower color, and (b) type. Bar chart showing the selection proportions (%) of 13 peony flower colors. Bars in different colors represent three preference levels identified by K-means clustering: blue (cluster I, high preference), red (cluster II, medium preference), and green (cluster III, low preference).
-
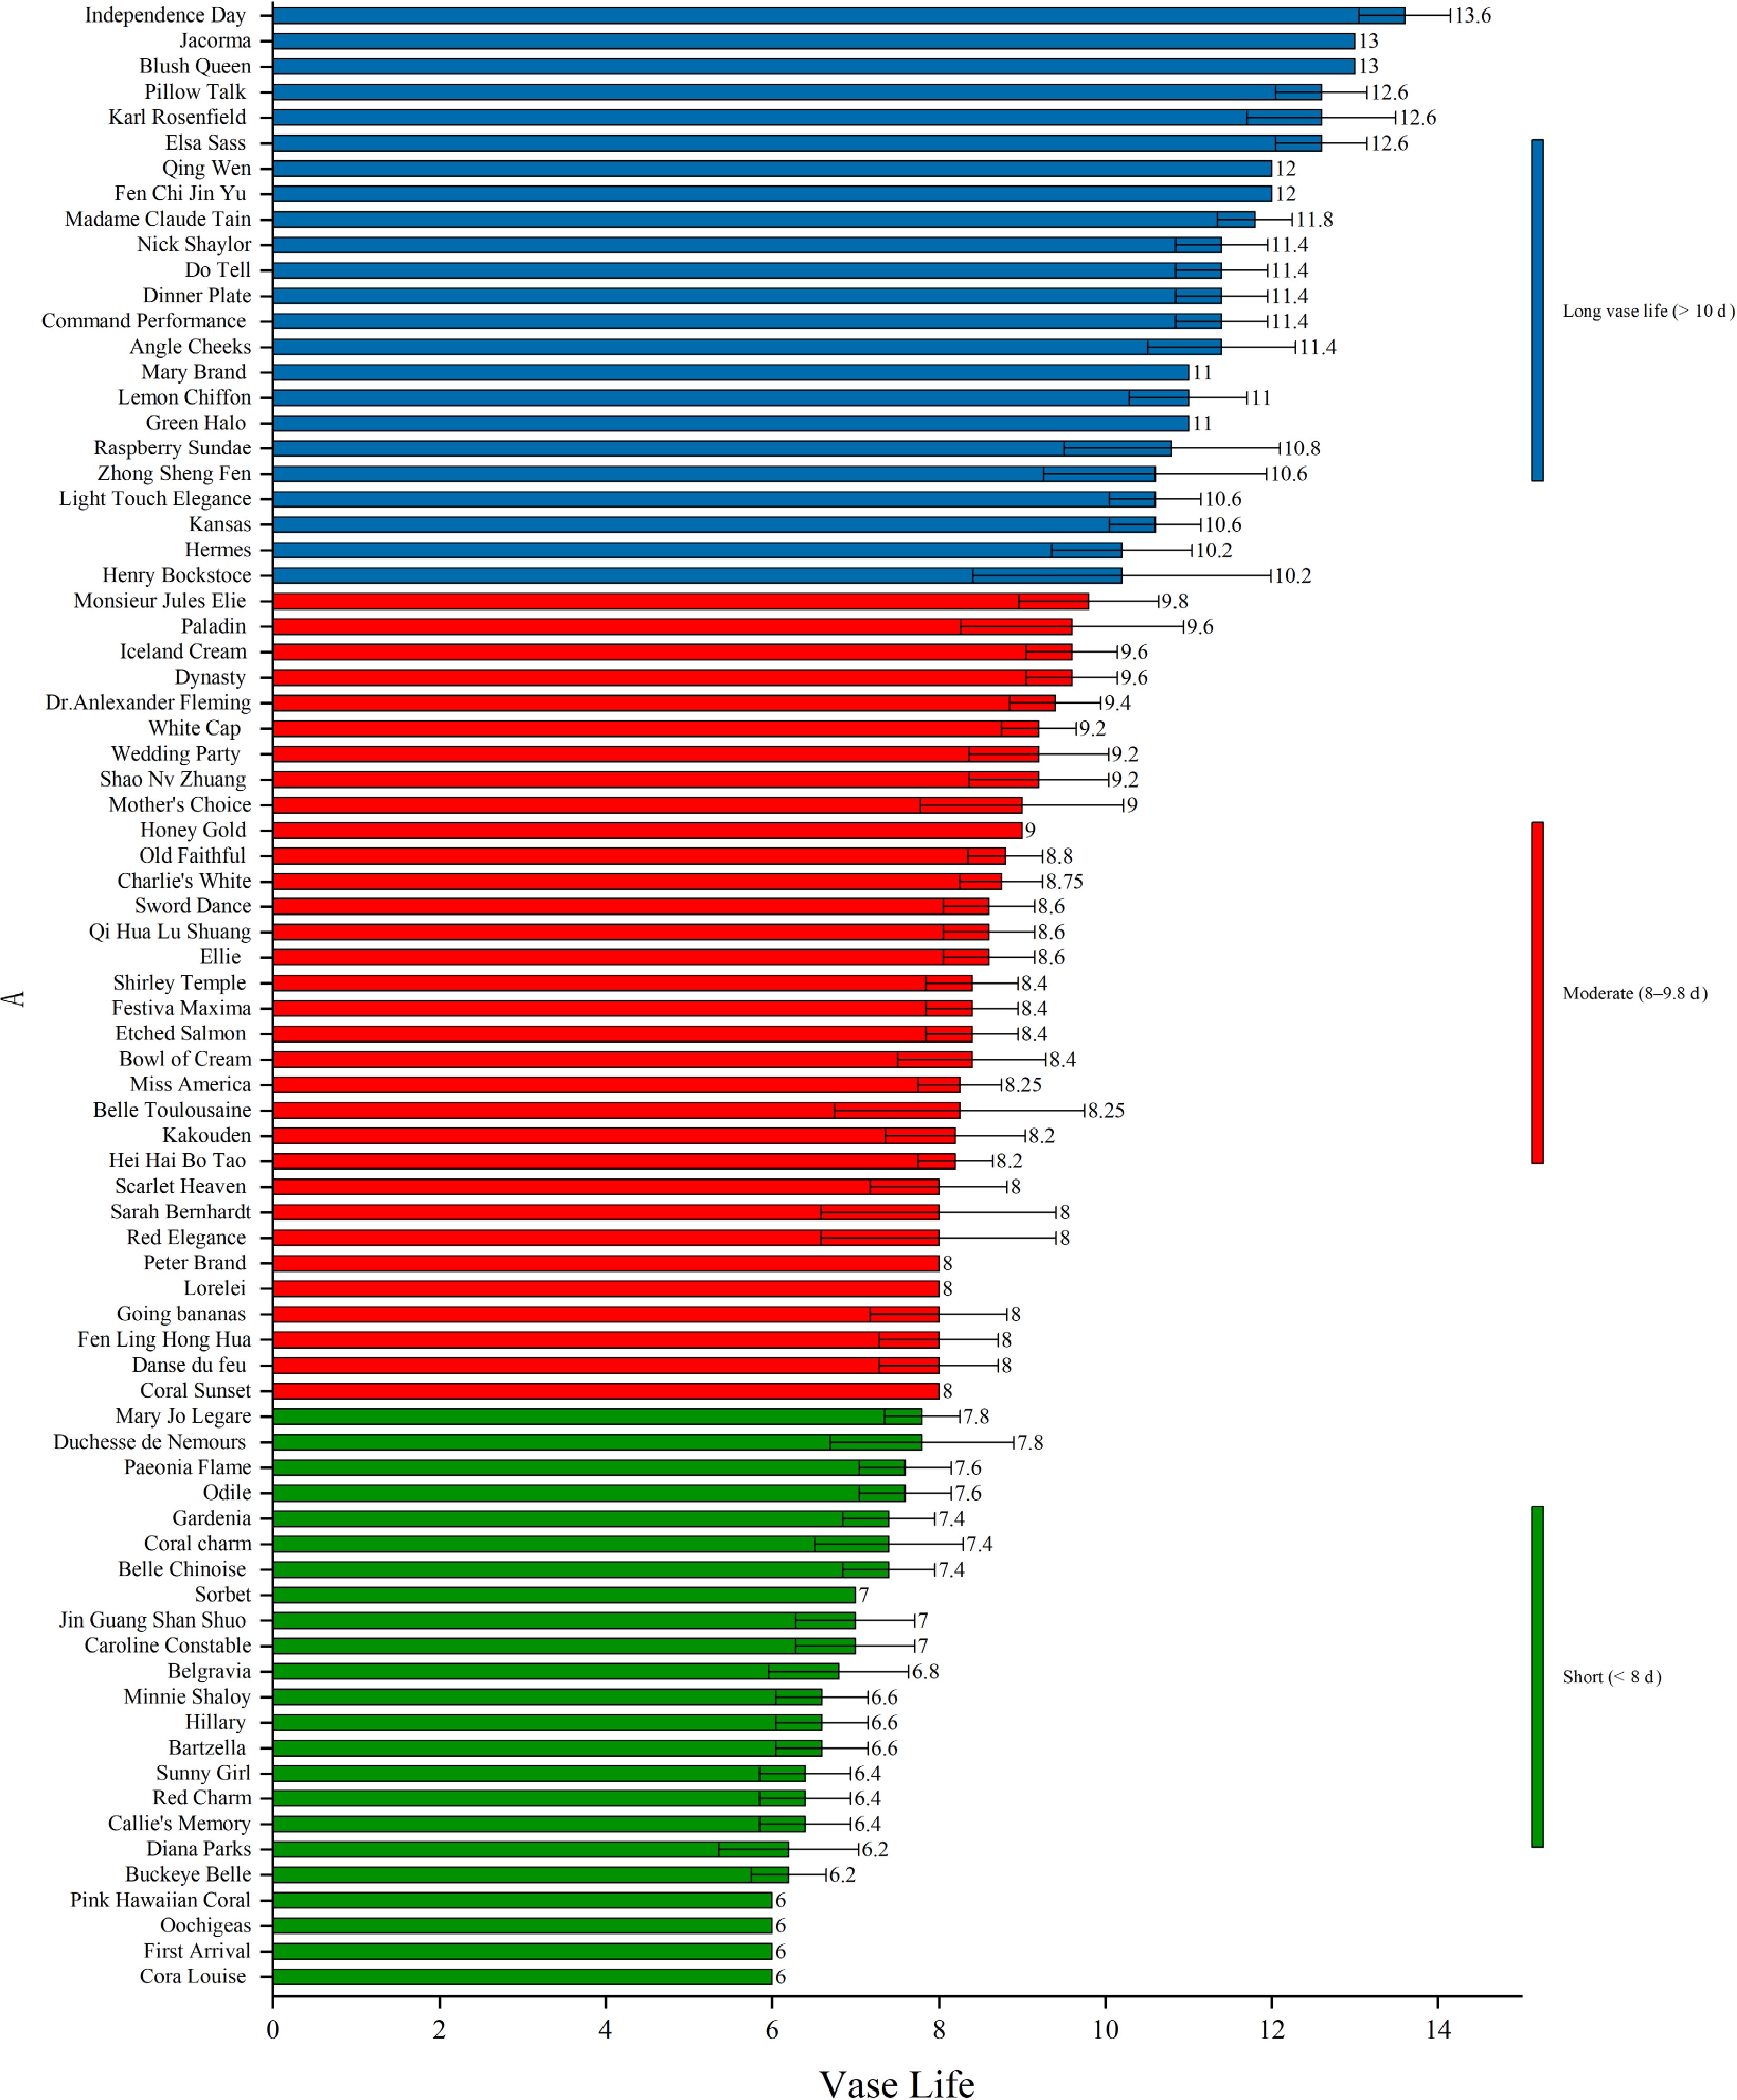
Figure 3.
Vase life performance of 78 herbaceous peony cultivars. The average vase life ranged from 6 to 13.6 d. K-means clustering (K = 3) divided the cultivars into three groups: long (≥ 10.2 d, blue), moderate (7.8–10.2 d, red), and short (< 7.8 d, green). Bars indicate individual cultivar means.
-
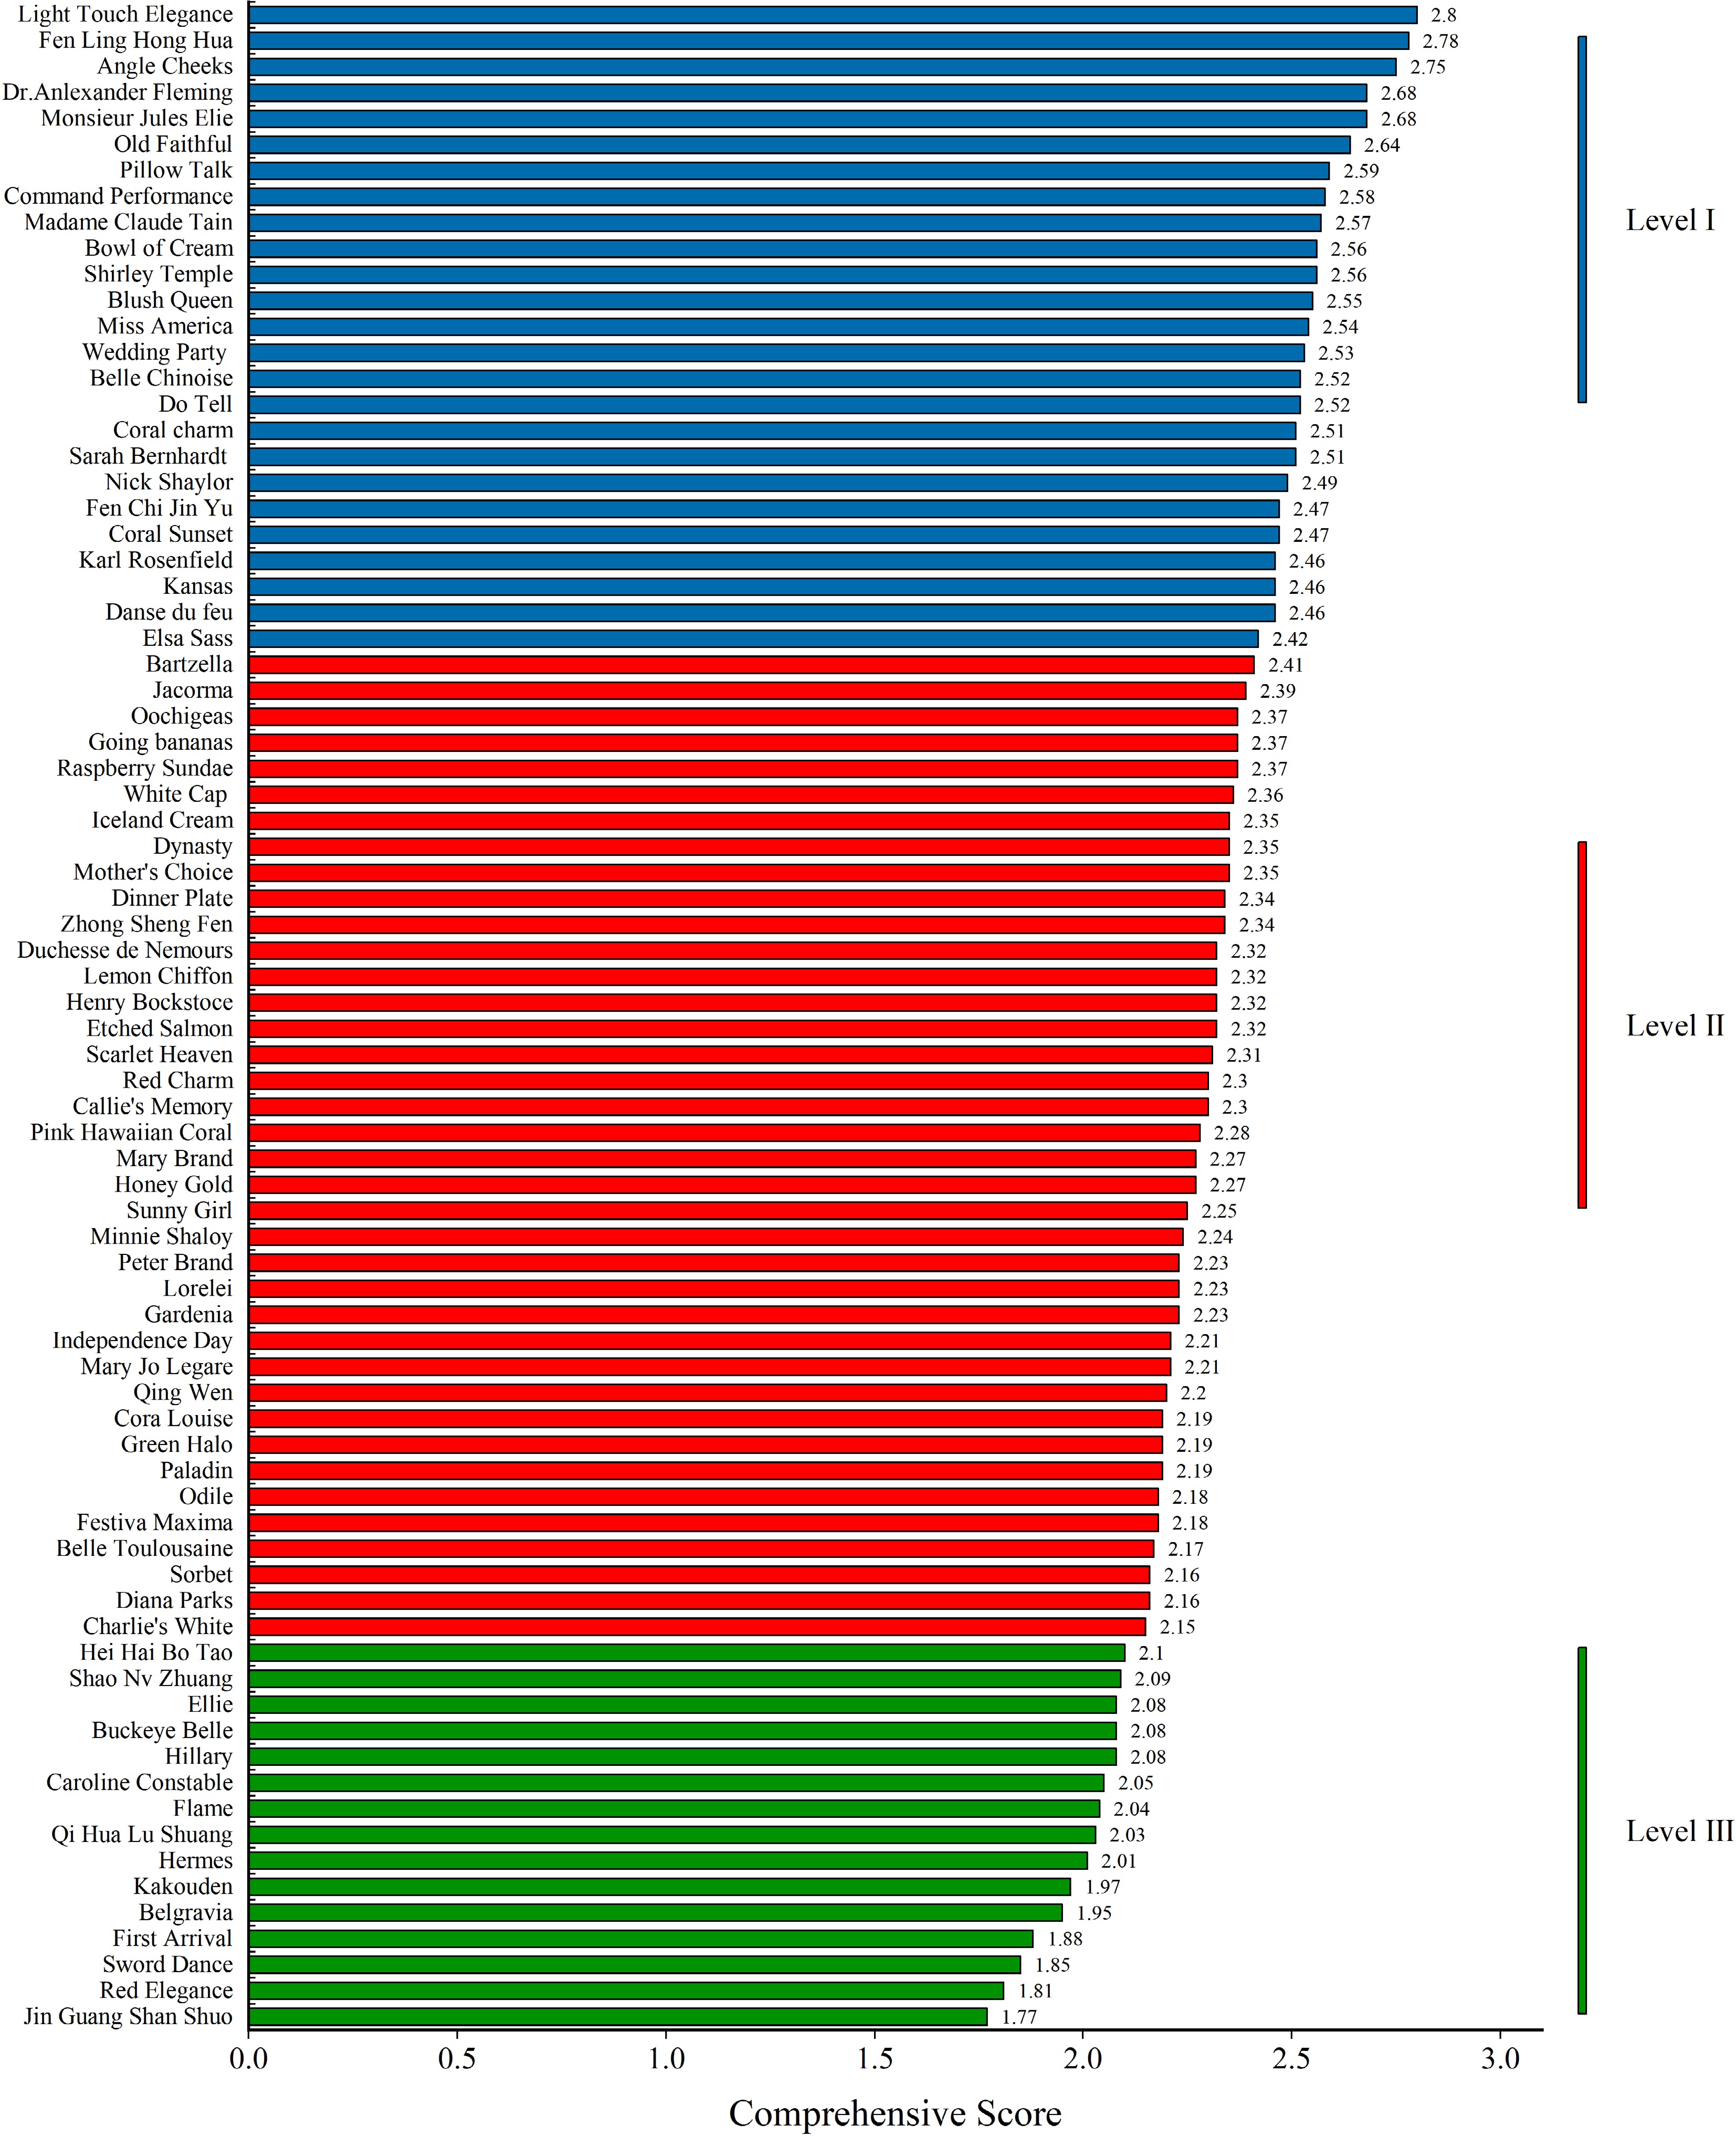
Figure 4.
Comprehensive performance classification of 78 herbaceous peony cut flower cultivars based on AHP-weighted scores and K-means clustering (K = 3). Cultivars were divided into three performance levels: Level I (blue, high-performing), Level II (red, moderate-performing), and Level III (green, low-performing).
-
Indicator Score and corresponding evaluation criteria 3 points (excellent) 2 points (medium) 1 point (low) Primary branch count ≥ 10 8 ≤ branch count < 10 < 8 Stem diameter (cm) ≥ 0.8 0.6 ≤ stem diameter < 0.8 < 0.6 Stem length (cm) ≥ 50 40 ≤ stem length < 50 < 40 Stem erectness < 30° 30° ≤ stem erectness ≤ 45° > 45° Lateral bud count 4 < 4 ≤ lateral bud count < 8 ≥ 8 Flower type Classified based on K-means analysis of consumer preference Flower diameter (cm) ≥ 13 10 ≤ diameter < 13 < 10 Harvesting time early-middle period Middle period Late period Flower color Classified based on K-means analysis of consumer preference Yield per plant ≥ 8 4 ≤ yield < 8 < 4 Flower posture flower upright Flower lateral pendulous Flower pendulous Pest resistance 20% ≤ 20% < damage rate ≤ 40% > 40% Disease resistance 20% ≤ 20% < infection rate ≤ 40% > 40% Vase life Classified based on K-means analysis of experimental vase performance Vase opening rate Classified based on K-means analysis of experimental vase performance Table 1.
Indexes and evaluation criteria for herbaceous peony cut flower varieties.
-
Target layer
(A)Constraint
layer (B)Indicator layer
(C)Bottom layer
(D)Screening and evaluation of peony cut flower varieties (A) Ornamental quality (B1) Flower type (C1) Peony cut flower varieties to
be evaluated (D1−D78)Flower color (C2) Flower posture (C3) Flower diameter (C4) Stem commercial traits (B2) Stem length (C5) Stem diameter (C6) Stem erectness (C7) Yield potential (B3) Primary branch count (C8) Yield per plant (C9) Vase Life Performance (B4) Vase life (C10) Vase opening rate (C11) Management Ease (B5) Pest resistance (C12) Disease resistance (C13) Lateral bud count (C14) Harvesting time (C15) Table 2.
Evaluation index system for screening and evaluating superior varieties of herbaceous peony cut flowers.
-
Target layer (A) Constraint layer (B) Constraint weight Indicator Indicator weight Comprehensive weight A B1 31.90% C1 21.96% 7.38% C2 42.38% 14.24% C3 9.35% 3.14% C4 26.31% 8.84% B2 25.95% C5 20.00% 5.19% C6 40.00% 10.38% C7 40.00% 10.38% B3 9.87% C8 75.00% 7.40% C9 25.00% 2.47% B4 18.31% C10 66.67% 12.21% C11 33.33% 6.10% B5 13.97% C12 36.1% 5.04% C13 38.37% 5.36% C14 8.95% 1.25% C15 16.58% 2.32% A refers to the overall target layer (screening and evaluation of herbaceous peony cut flower varieties); B1–B5 represent five constraint categories: ornamental quality (B1), stem commercial traits (B2), yield potential (B3), vase life performance (B4), and management ease (B5). C1–C15 are indicator traits under each category: flower type (C1), flower color (C2), flower posture (C3), flower diameter (C4), stem length (C5), stem diameter (C6), stem erectness (C7), primary branch count (C8), yield per plant (C9), vase life (C10), vase opening rate (C11), pest resistance (C12), disease resistance (C13), lateral bud count (C14), and harvesting time (C15). Table 3.
Comprehensive weights of evaluation indicators for herbaceous peony cut flower selection based on the AHP model.
Figures
(4)
Tables
(3)