-
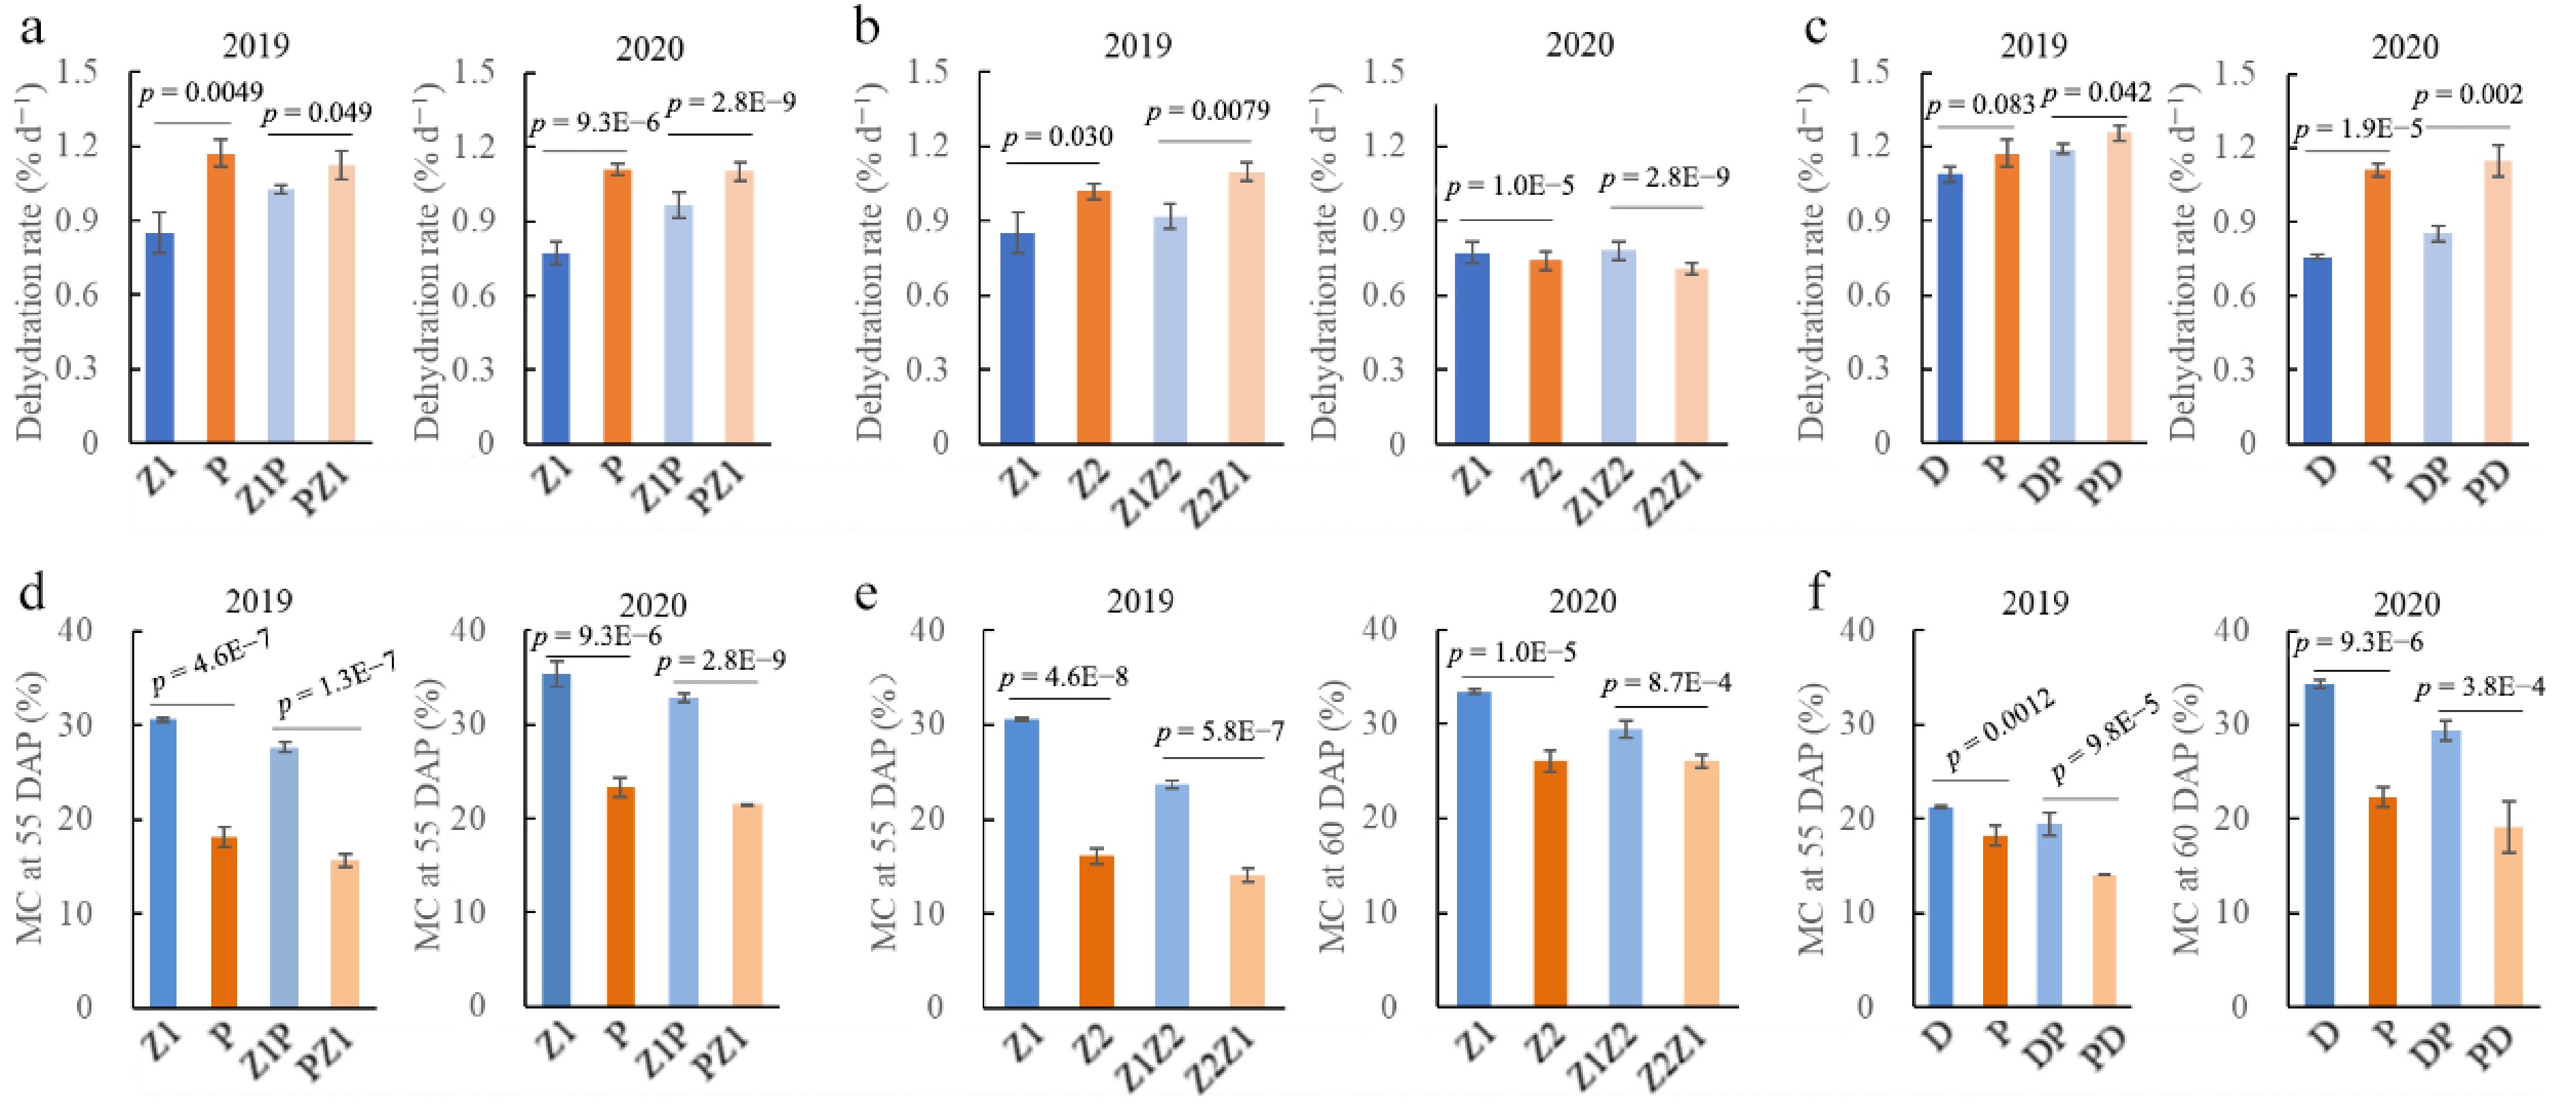
Figure 1.
Seed dehydration rate and moisture content (MC) of maize inbred line and their reciprocal hybrids in 2019 and 2020 years. Seed dehydration rate from 30 to 70 days after pollination (DAP) for maize inbred line Z1, P, Z2, and D, and their reciprocal hybrid pairs (a) Z1P and PZ1, (b) Z1Z2 and Z2Z1, and (c) DP and PD. Seed MC at 55 DAP for inbred line Z1, P, Z2, and D, and their reciprocal hybrid pairs (d) Z1P and PZ1, (e) Z1Z2 and Z2Z1, and (f) DP and PD. Z1 (Zheng58), P (PH4CV), Z2 (Zheng30), and D (Dan360) are parental inbred lines. Z1P and PZ1, Z1Z2 and Z2Z1, and DP and PD represent reciprocal hybrids between Z1 and P, Z1 and Z2, and D and P, respectively. In the hybrid nomenclature, the first listed inbred was used as the female parent, and the second as the male parent.
-
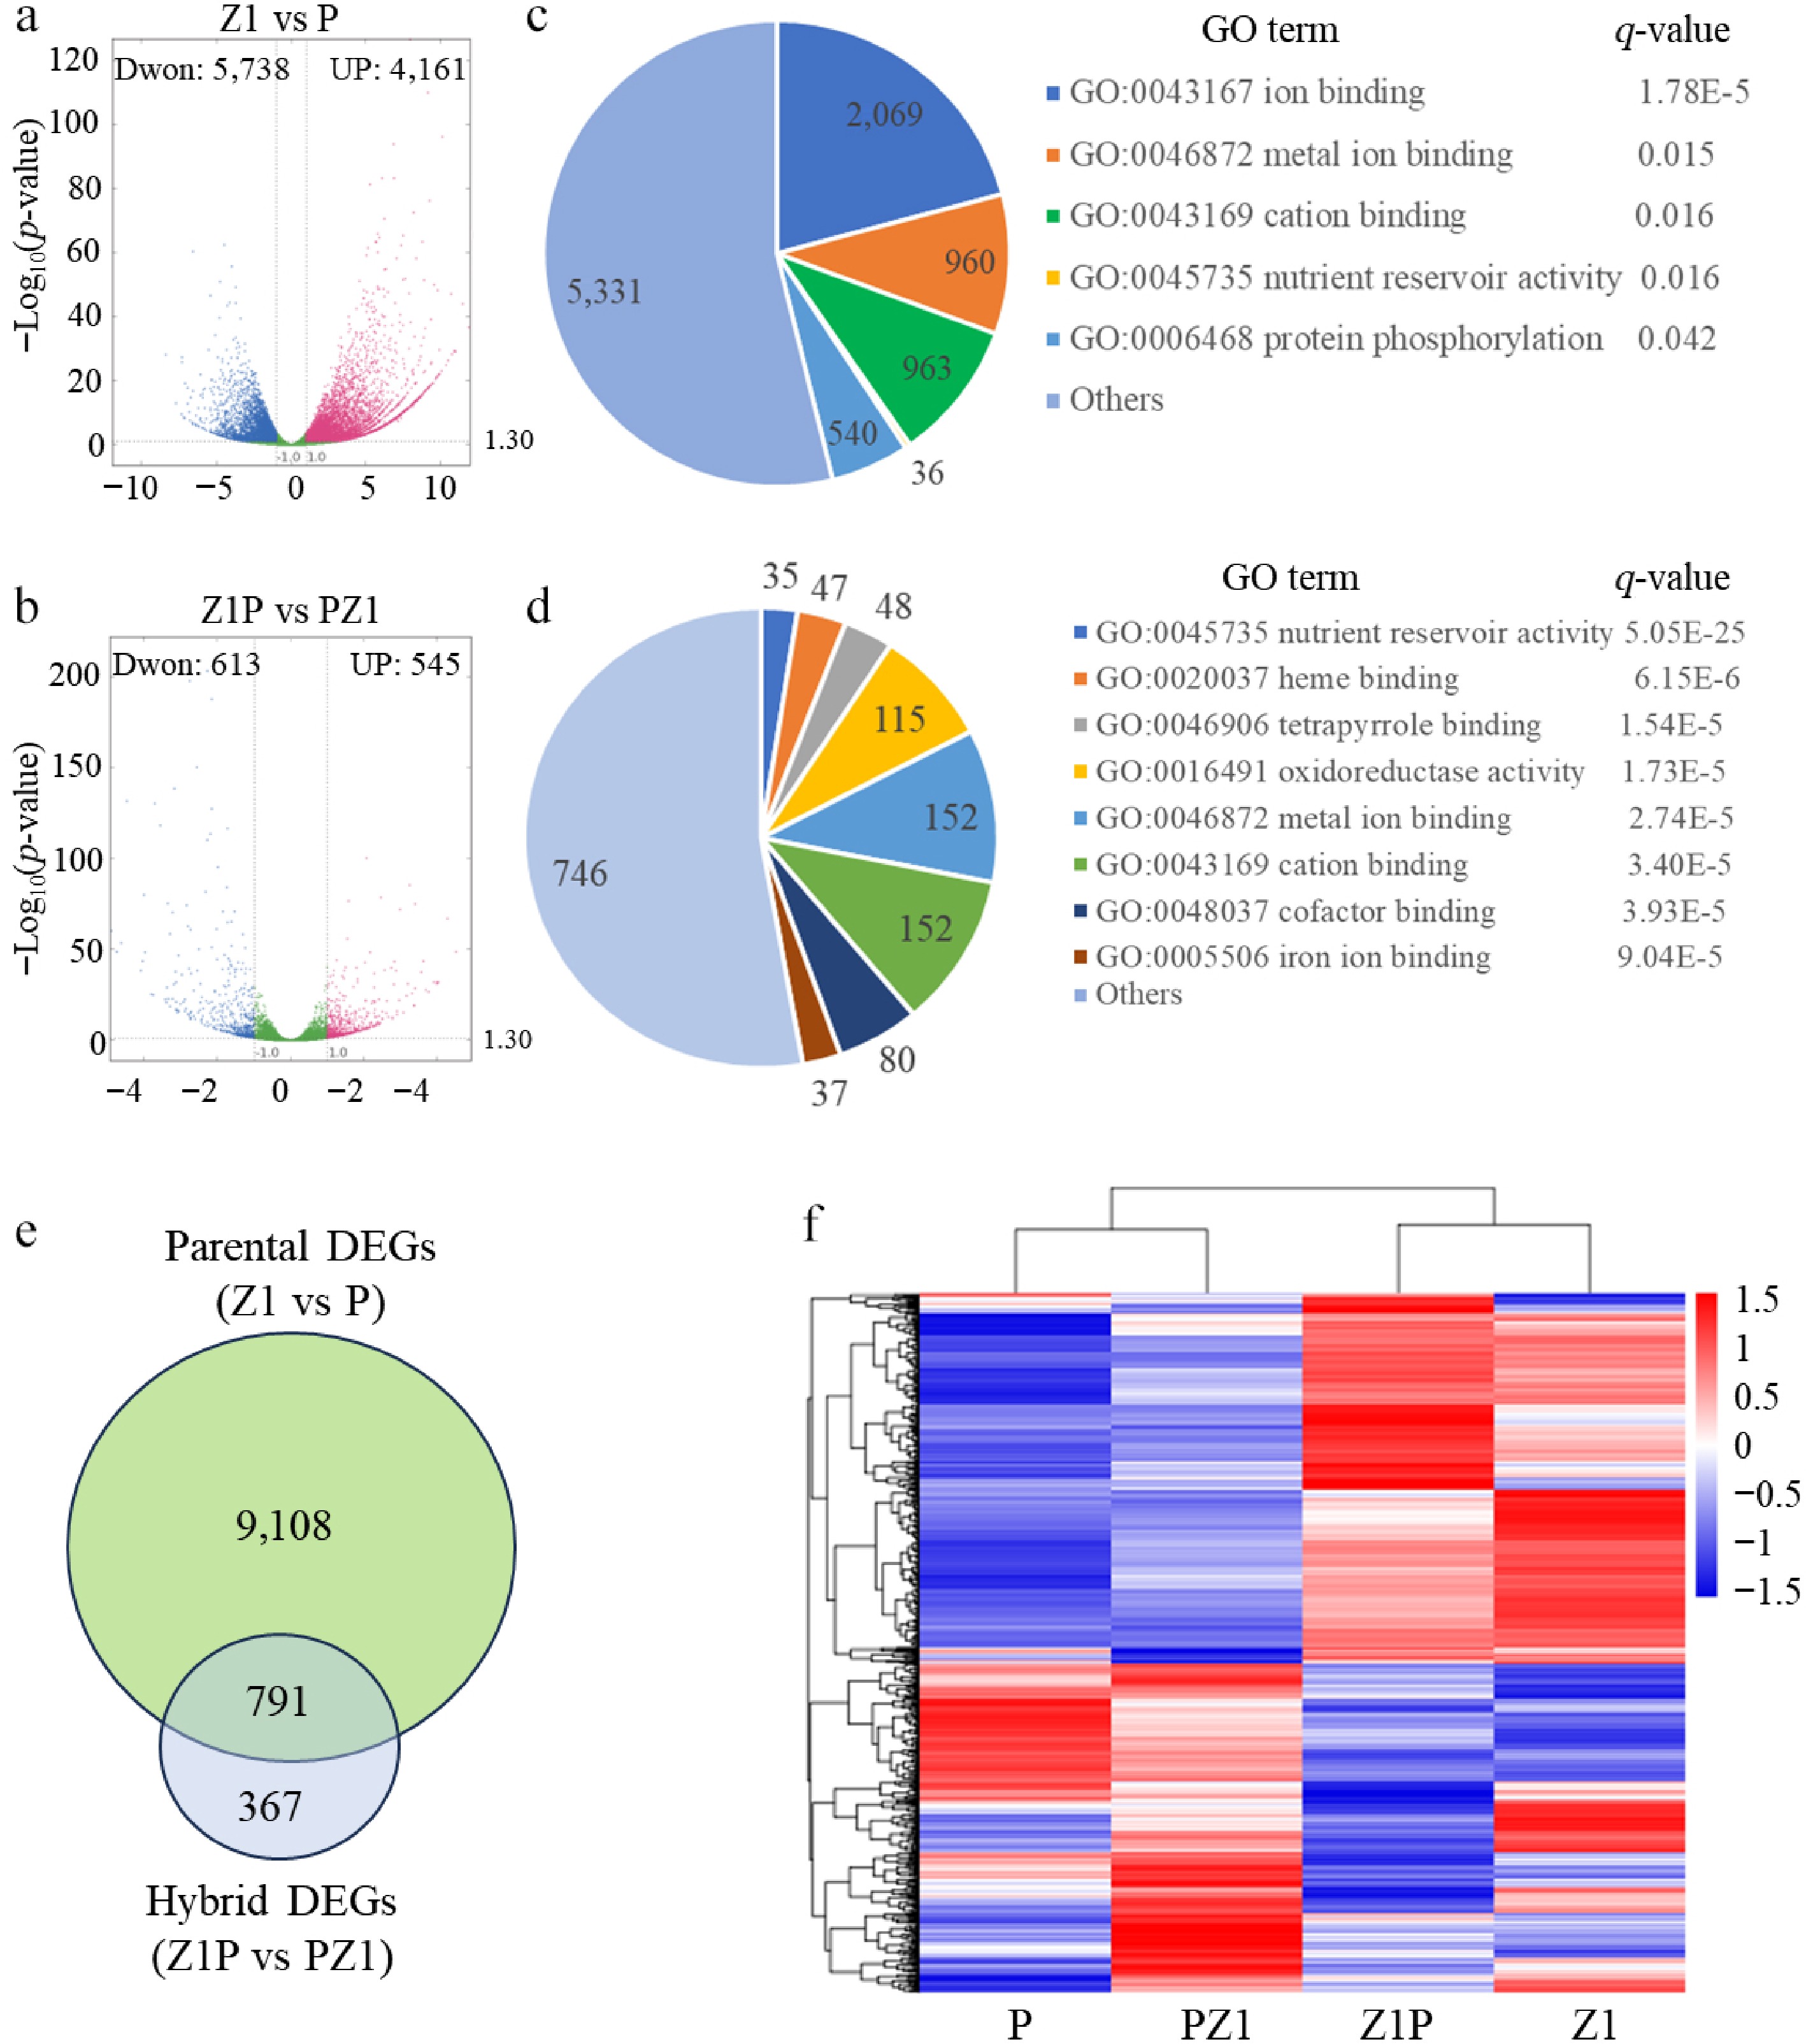
Figure 2.
Identification of different expression genes (DEGs) between parents Z1 and P (parent DEGs), and between reciprocal hybrids Z1P and PZ1 (hybrid DEGs). Volcano plots representing the (a) parent DEGs and the (b) hybrid DEGs. Blue and red points represent significantly down-regulated and up-regulated genes, respectively. The most significantly enriched GO terms for the (c) parent DEGs and the (d) hybrid DEGs. For each GO term, the number of genes is displayed within the chart. The q-value, calculated using a hypergeometric distribution test followed by the Benjamini-Hochberg correction, is listed to the right of the term. (e) Venn diagram showing the overlap between parent DEGs and hybrid DEGs. (f) Heatmap showing the expressions profiles of the DEGs overlapping between parent DEGs and hybrid datasets.
-
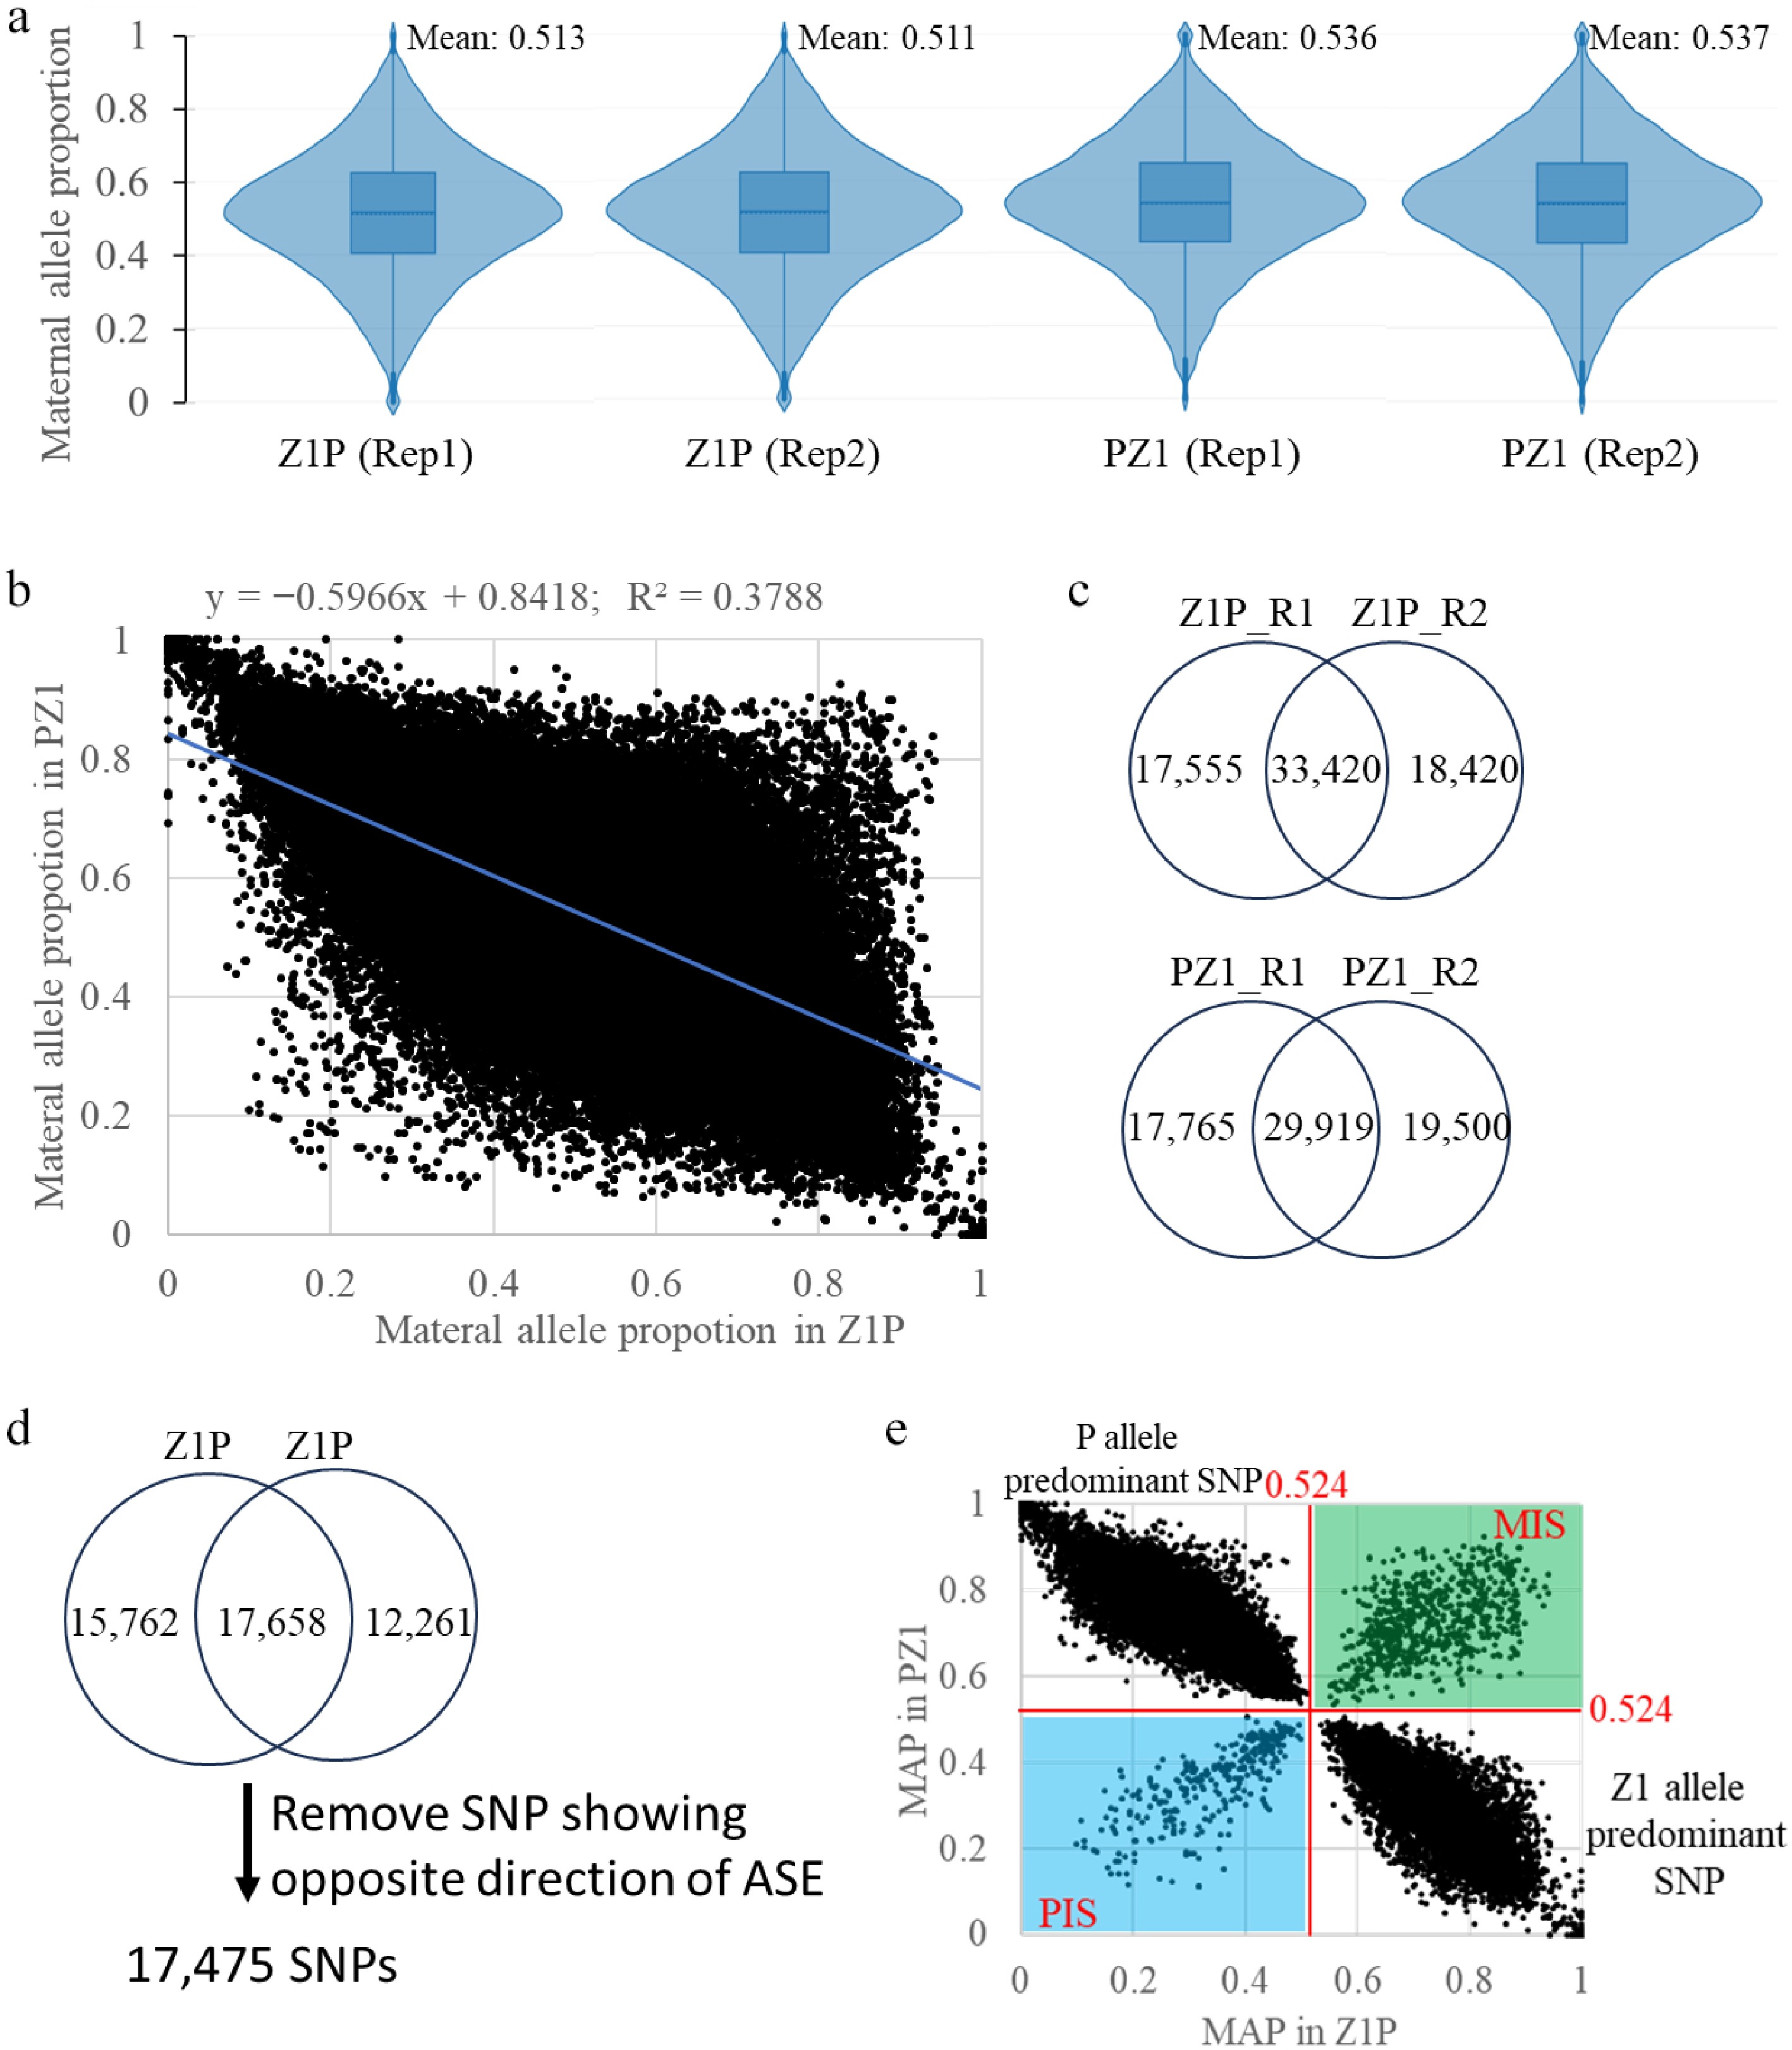
Figure 3.
Identification of maternally expressed SNP (MES) and paternally expressed SNP (PES). (a) Distributions of maternal allele proportions (MAP) in four samples derived from two reciprocal hybrids (Z1P and PZ1) with two replicates (Rep1 and Rep2). (b) Correlation of MAP values between the reciprocal crosses (Z1P and PZ1). (c) Venn diagram depicting imprinted SNPs identified from the two replicates (R1 and R2) within each hybrid cross (Z1P and PZ1). (d) Venn diagram showing the overlap of imprinted SNPs identified from the two reciprocal hybrids (Z1P and PZ1). (e) Scatter plot of allele-specific expression for identified SNPs. The green and blue areas represent SNPs exhibiting consistent maternally or paternally expression bias, respectively, in both reciprocal crosses. The other two areas correspond to SNPs showing expression bias specific to one of the parental lines (P or Z1).
-
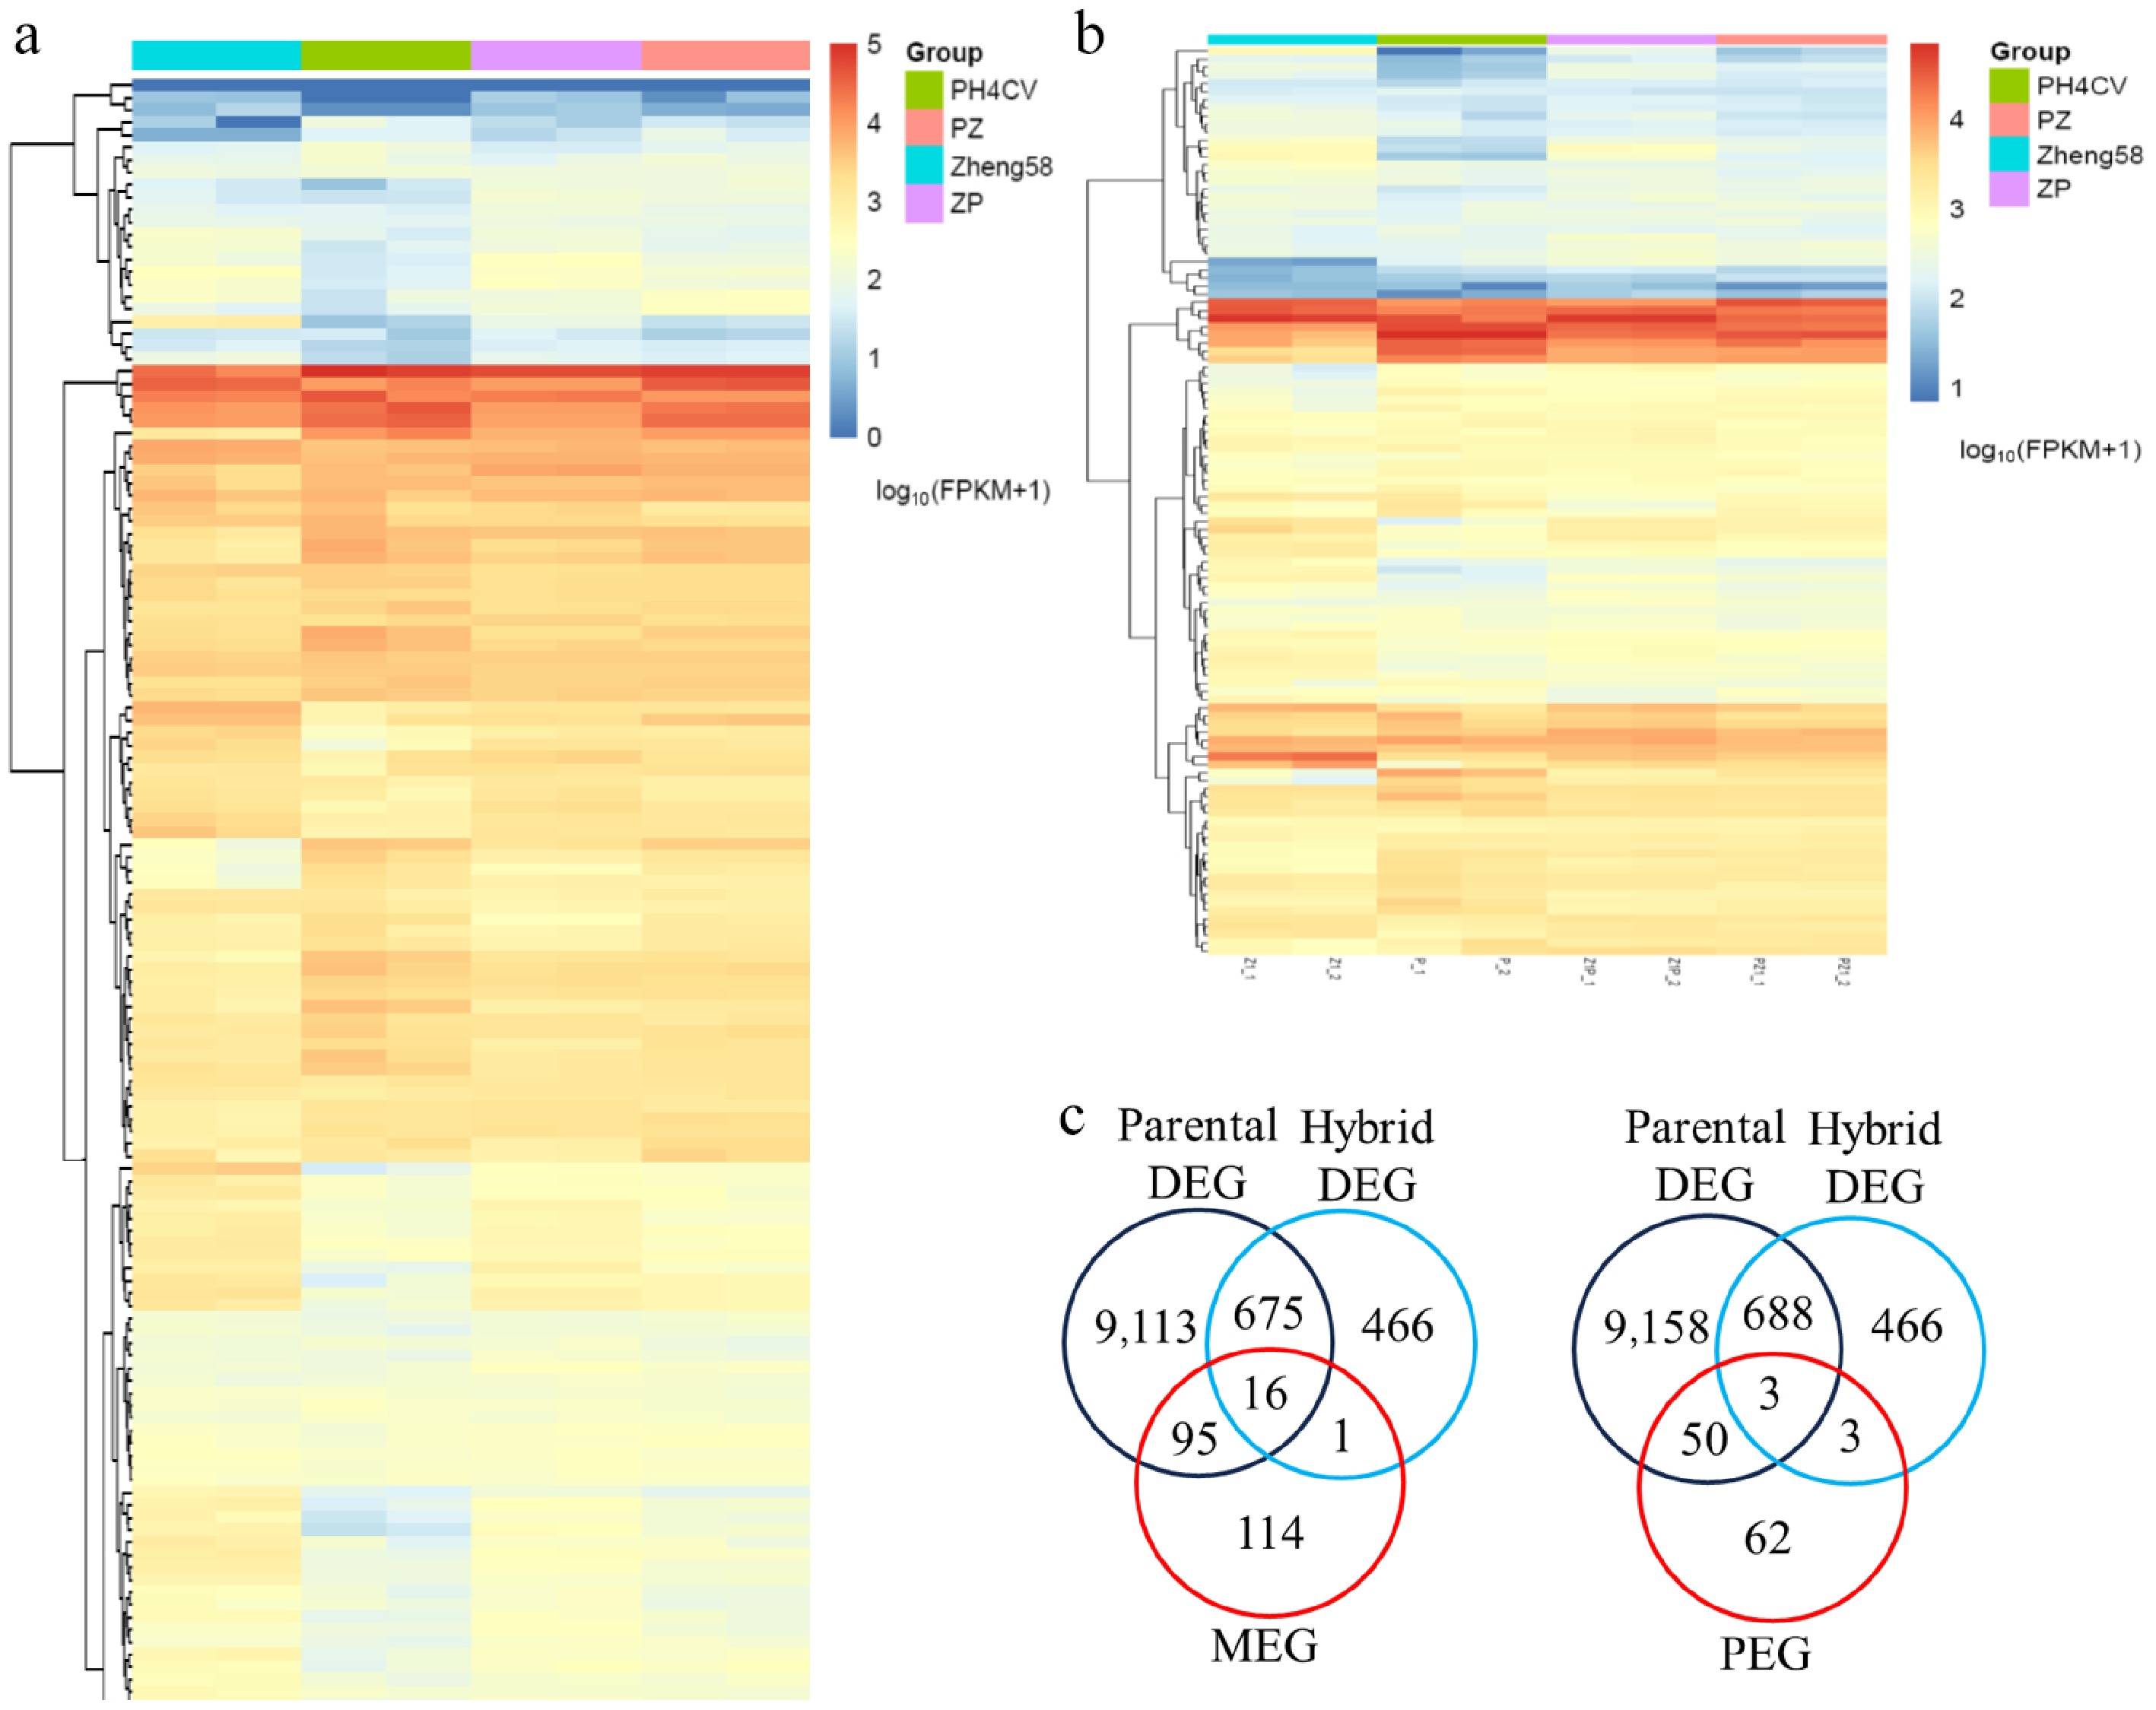
Figure 4.
Characteristics of the maternally expressed genes (MEGs) and paternal expressed genes (PEGs). Heatmap illustrating the total expression levels of the identified (a) MEGs and (b) PEGs across the parental lines (Z1, P), and the reciprocal hybrids (Z1P, PZ1). (c) Venn diagram showing the limited overlap of the MEGs and PEGs with the parental DEGs and the hybrid DEGs.
-
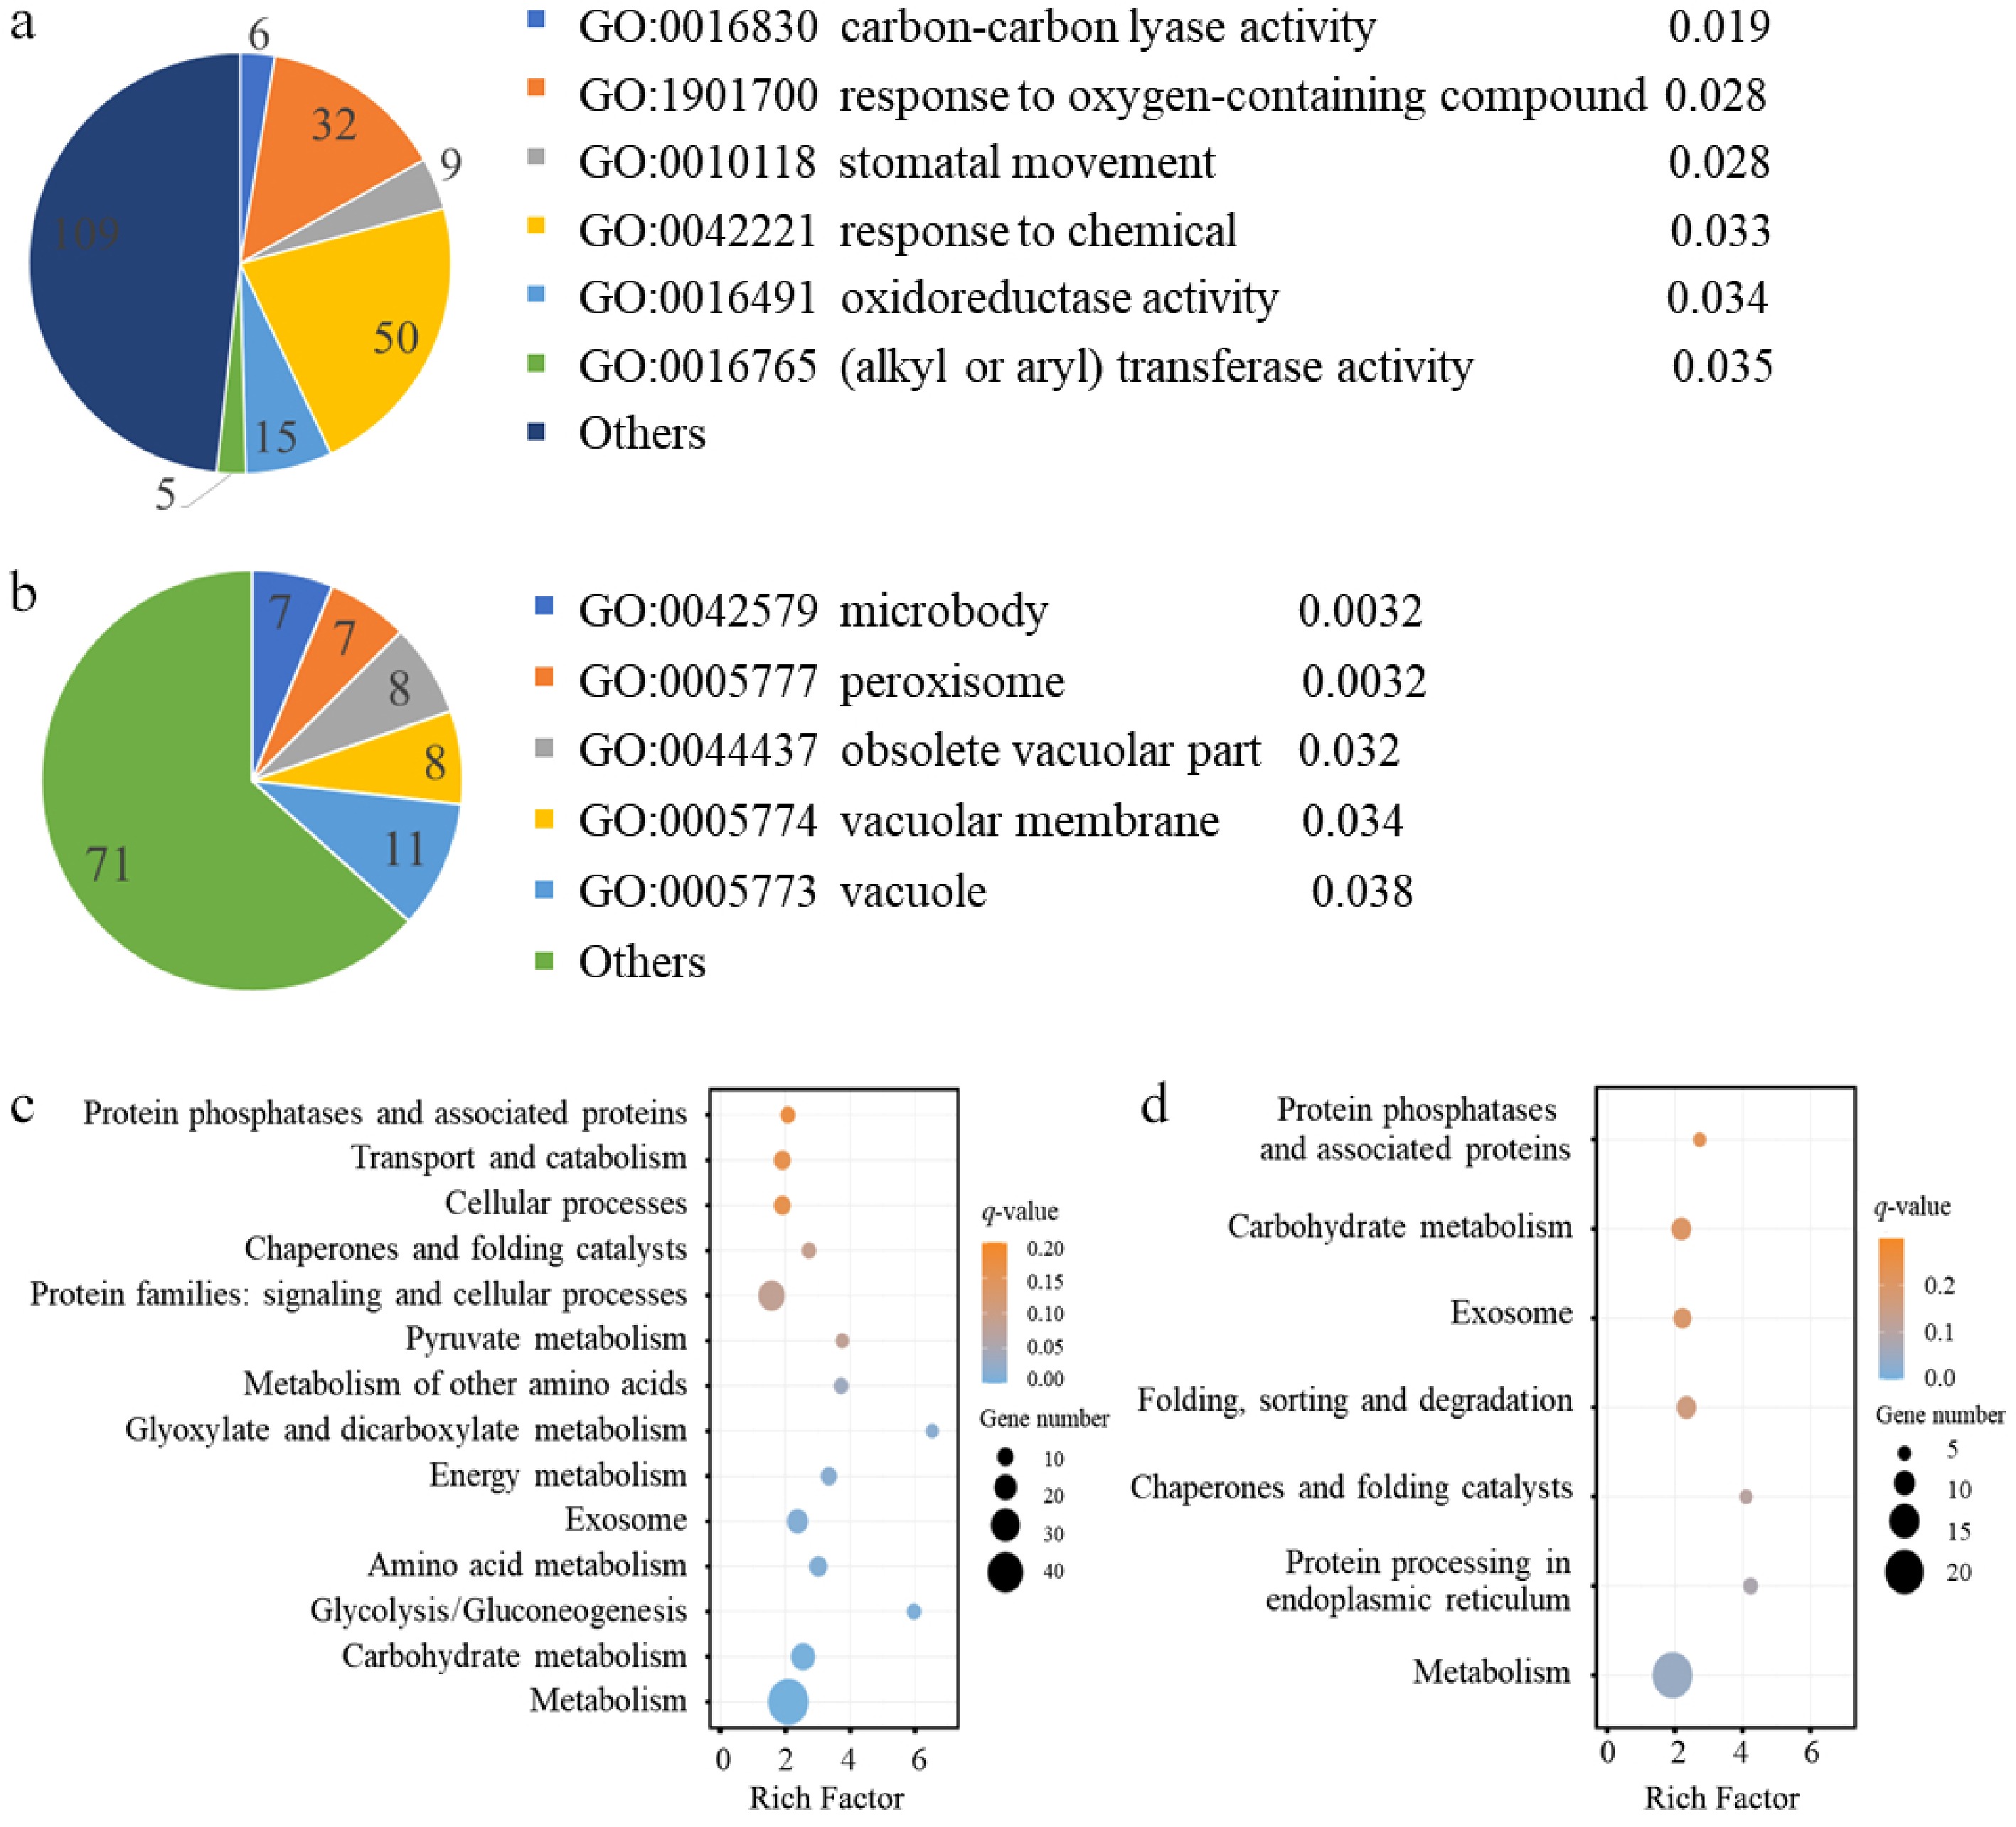
Figure 5.
GO and KEGG analyses of the identified maternally (MEGs) and paternally expressed genes (PEGs). The most significantly enriched GO terms for the (a) MEGs, and the (b) PEGs. For each GO term, the number of genes is displayed in the chart, and the q-value (calculated using the hypergeometric distribution test followed by the Benjamini-Hochberg method) is listed on the right side of the term. KEGG enrichment analysis for the (c) maternally expressed genes and (d) paternally expressed genes.
-
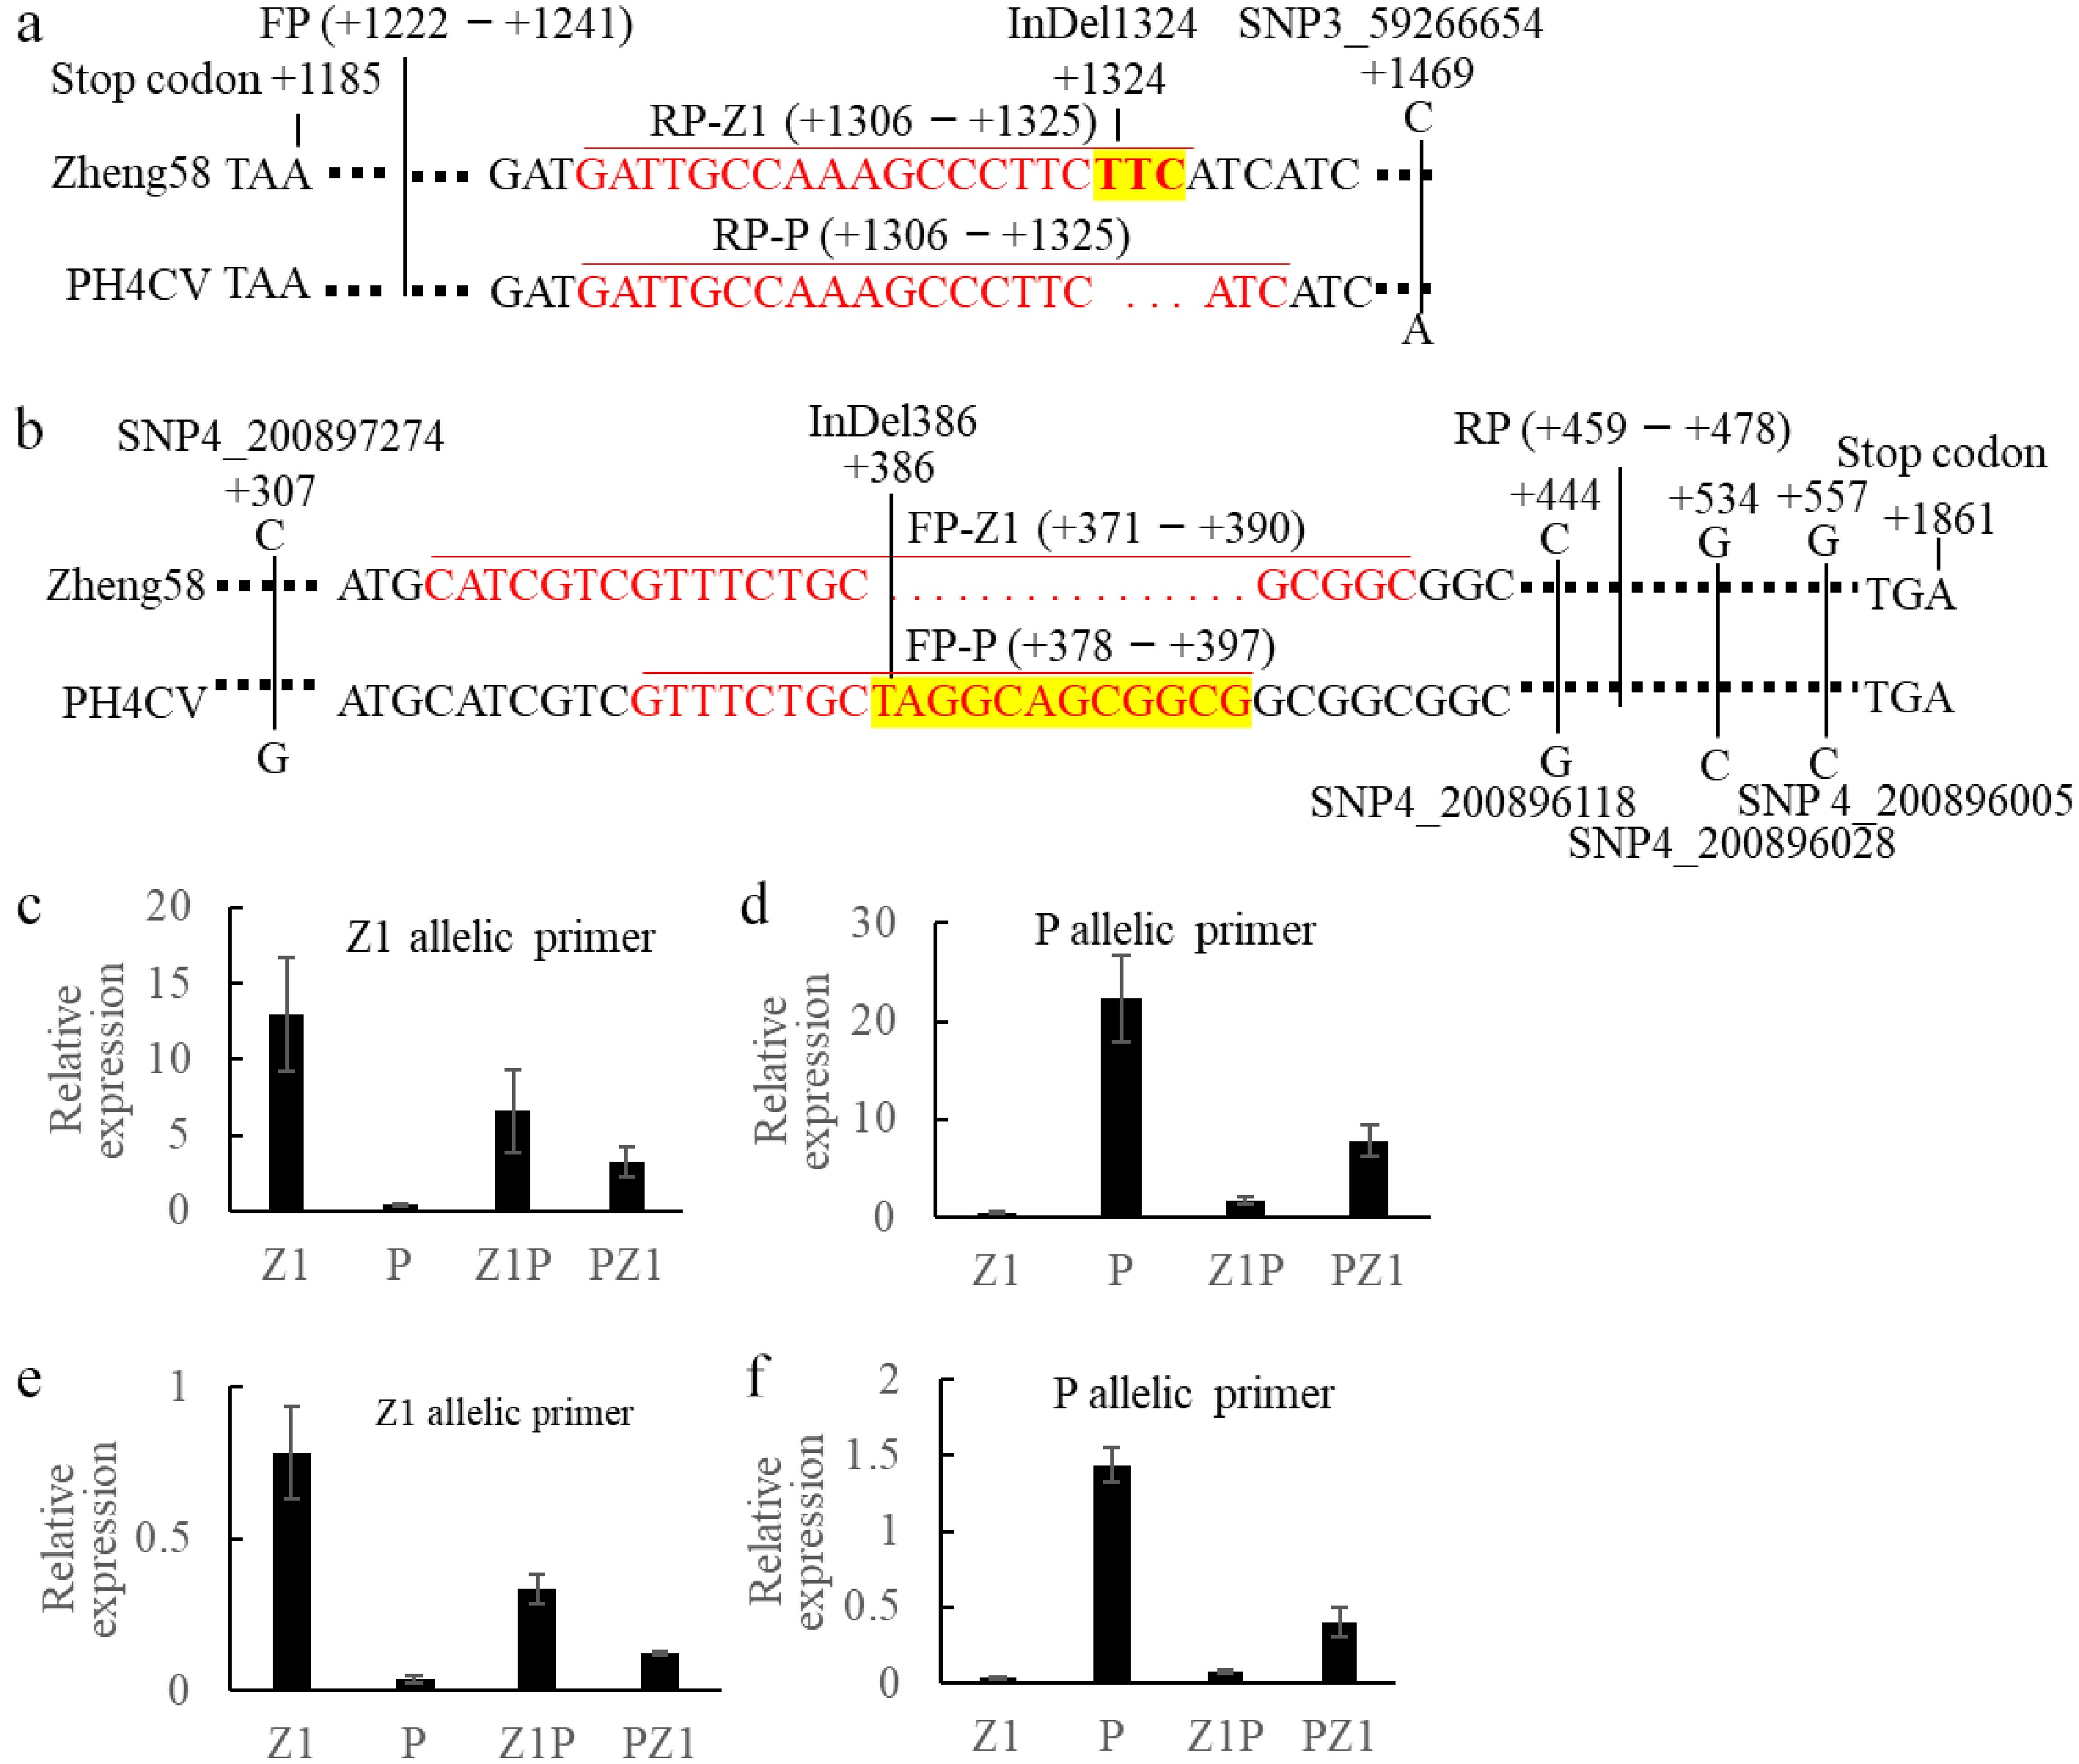
Figure 6.
Verification of imprinted expression for candidate genes in seeds of Z1P and PZ1 reciprocal crosses. (a) Haplotype-specific primer design strategy for Zm00001d040697 gene; (b) Haplotype-specific primer design strategy for Zm00001d052744 gene. Relative expression levels of Zm00001d040697 in the four genotypes (Z1, P, Z1P, and PZ1) using (c) Z1-specific and (d) P-specific primers. Relative expression levels of Zm00001d052744 in the four genotypes (Z1, P, Z1P, and PZ1) using (e) Z1-specific, and (f) P-specific primers.
Figures
(6)
Tables
(0)