-
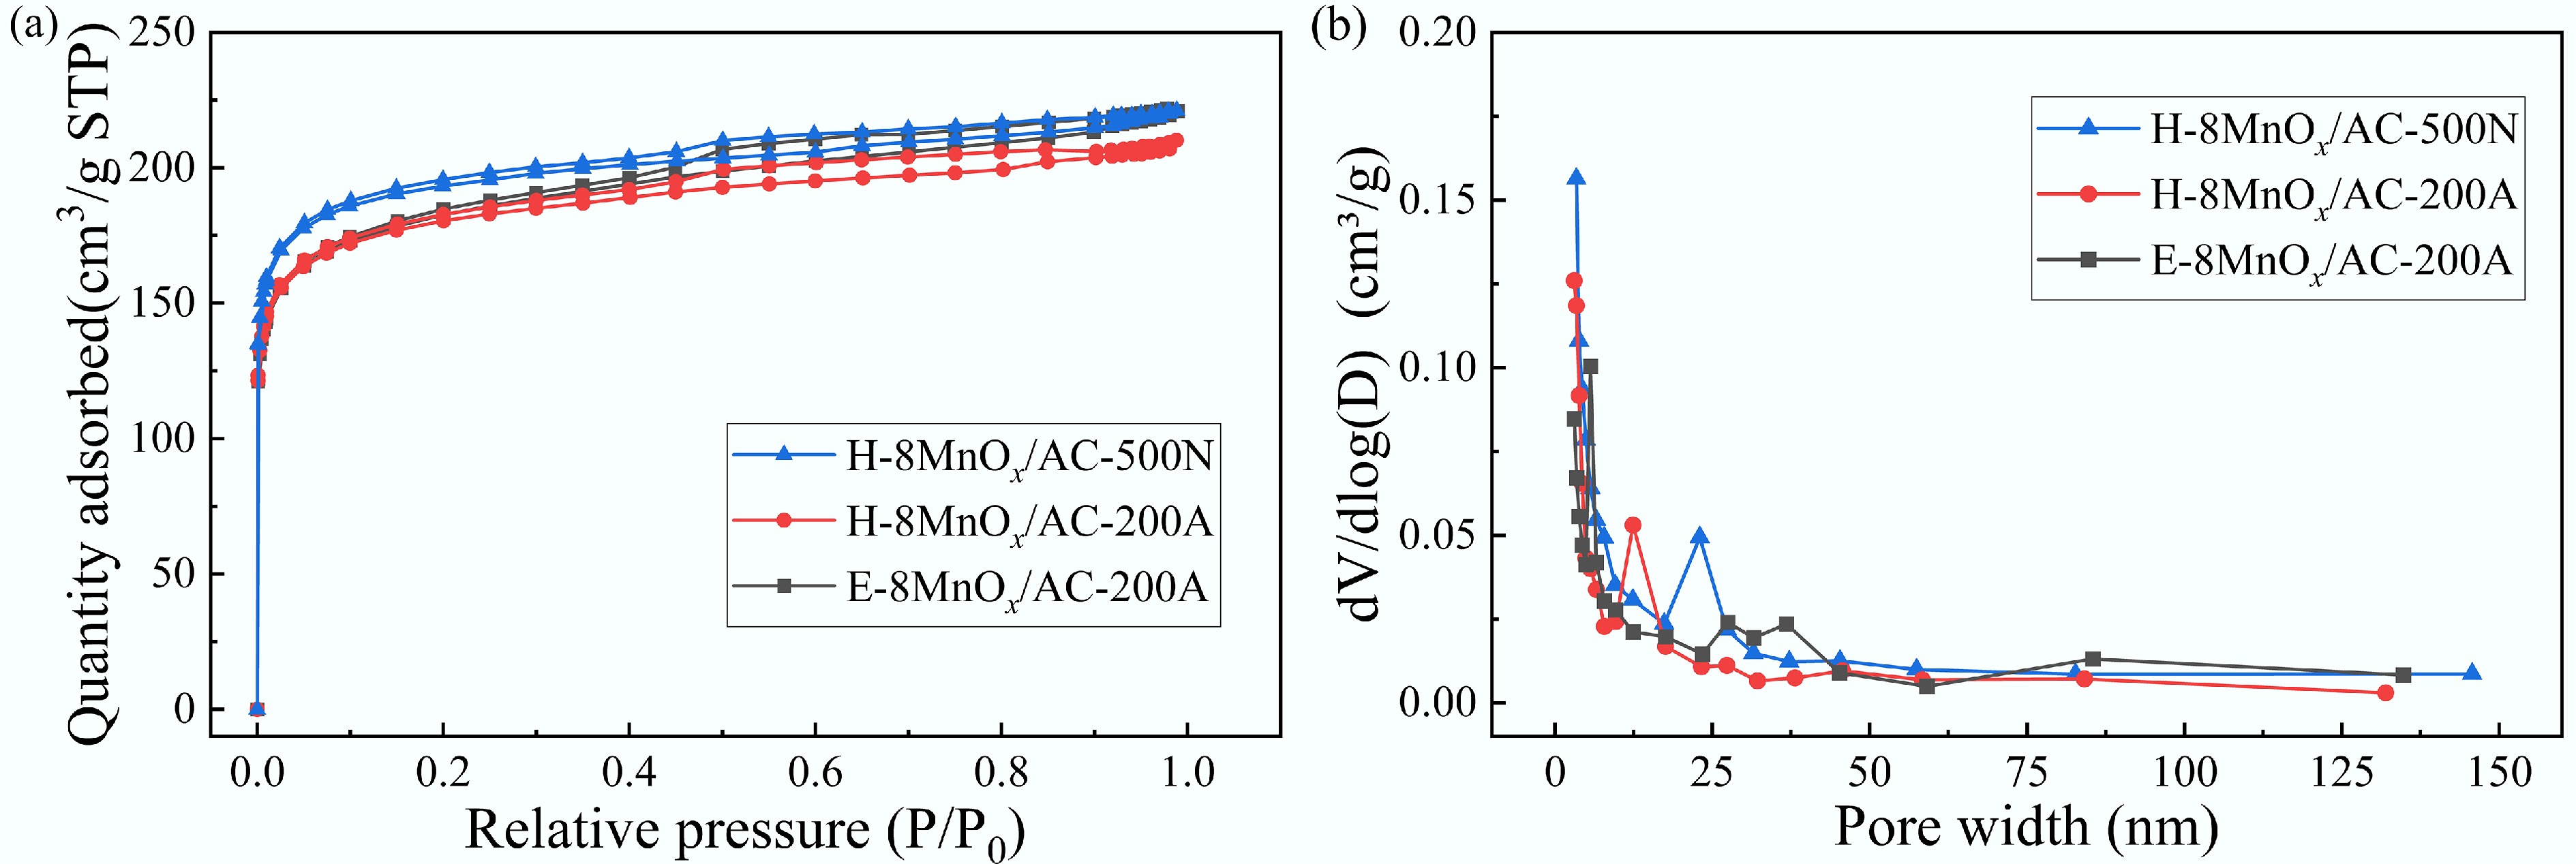
Figure 1.
(a) N2 adsorption–desorption isotherms and (b) corresponding pore size distribution of the catalysts.
-
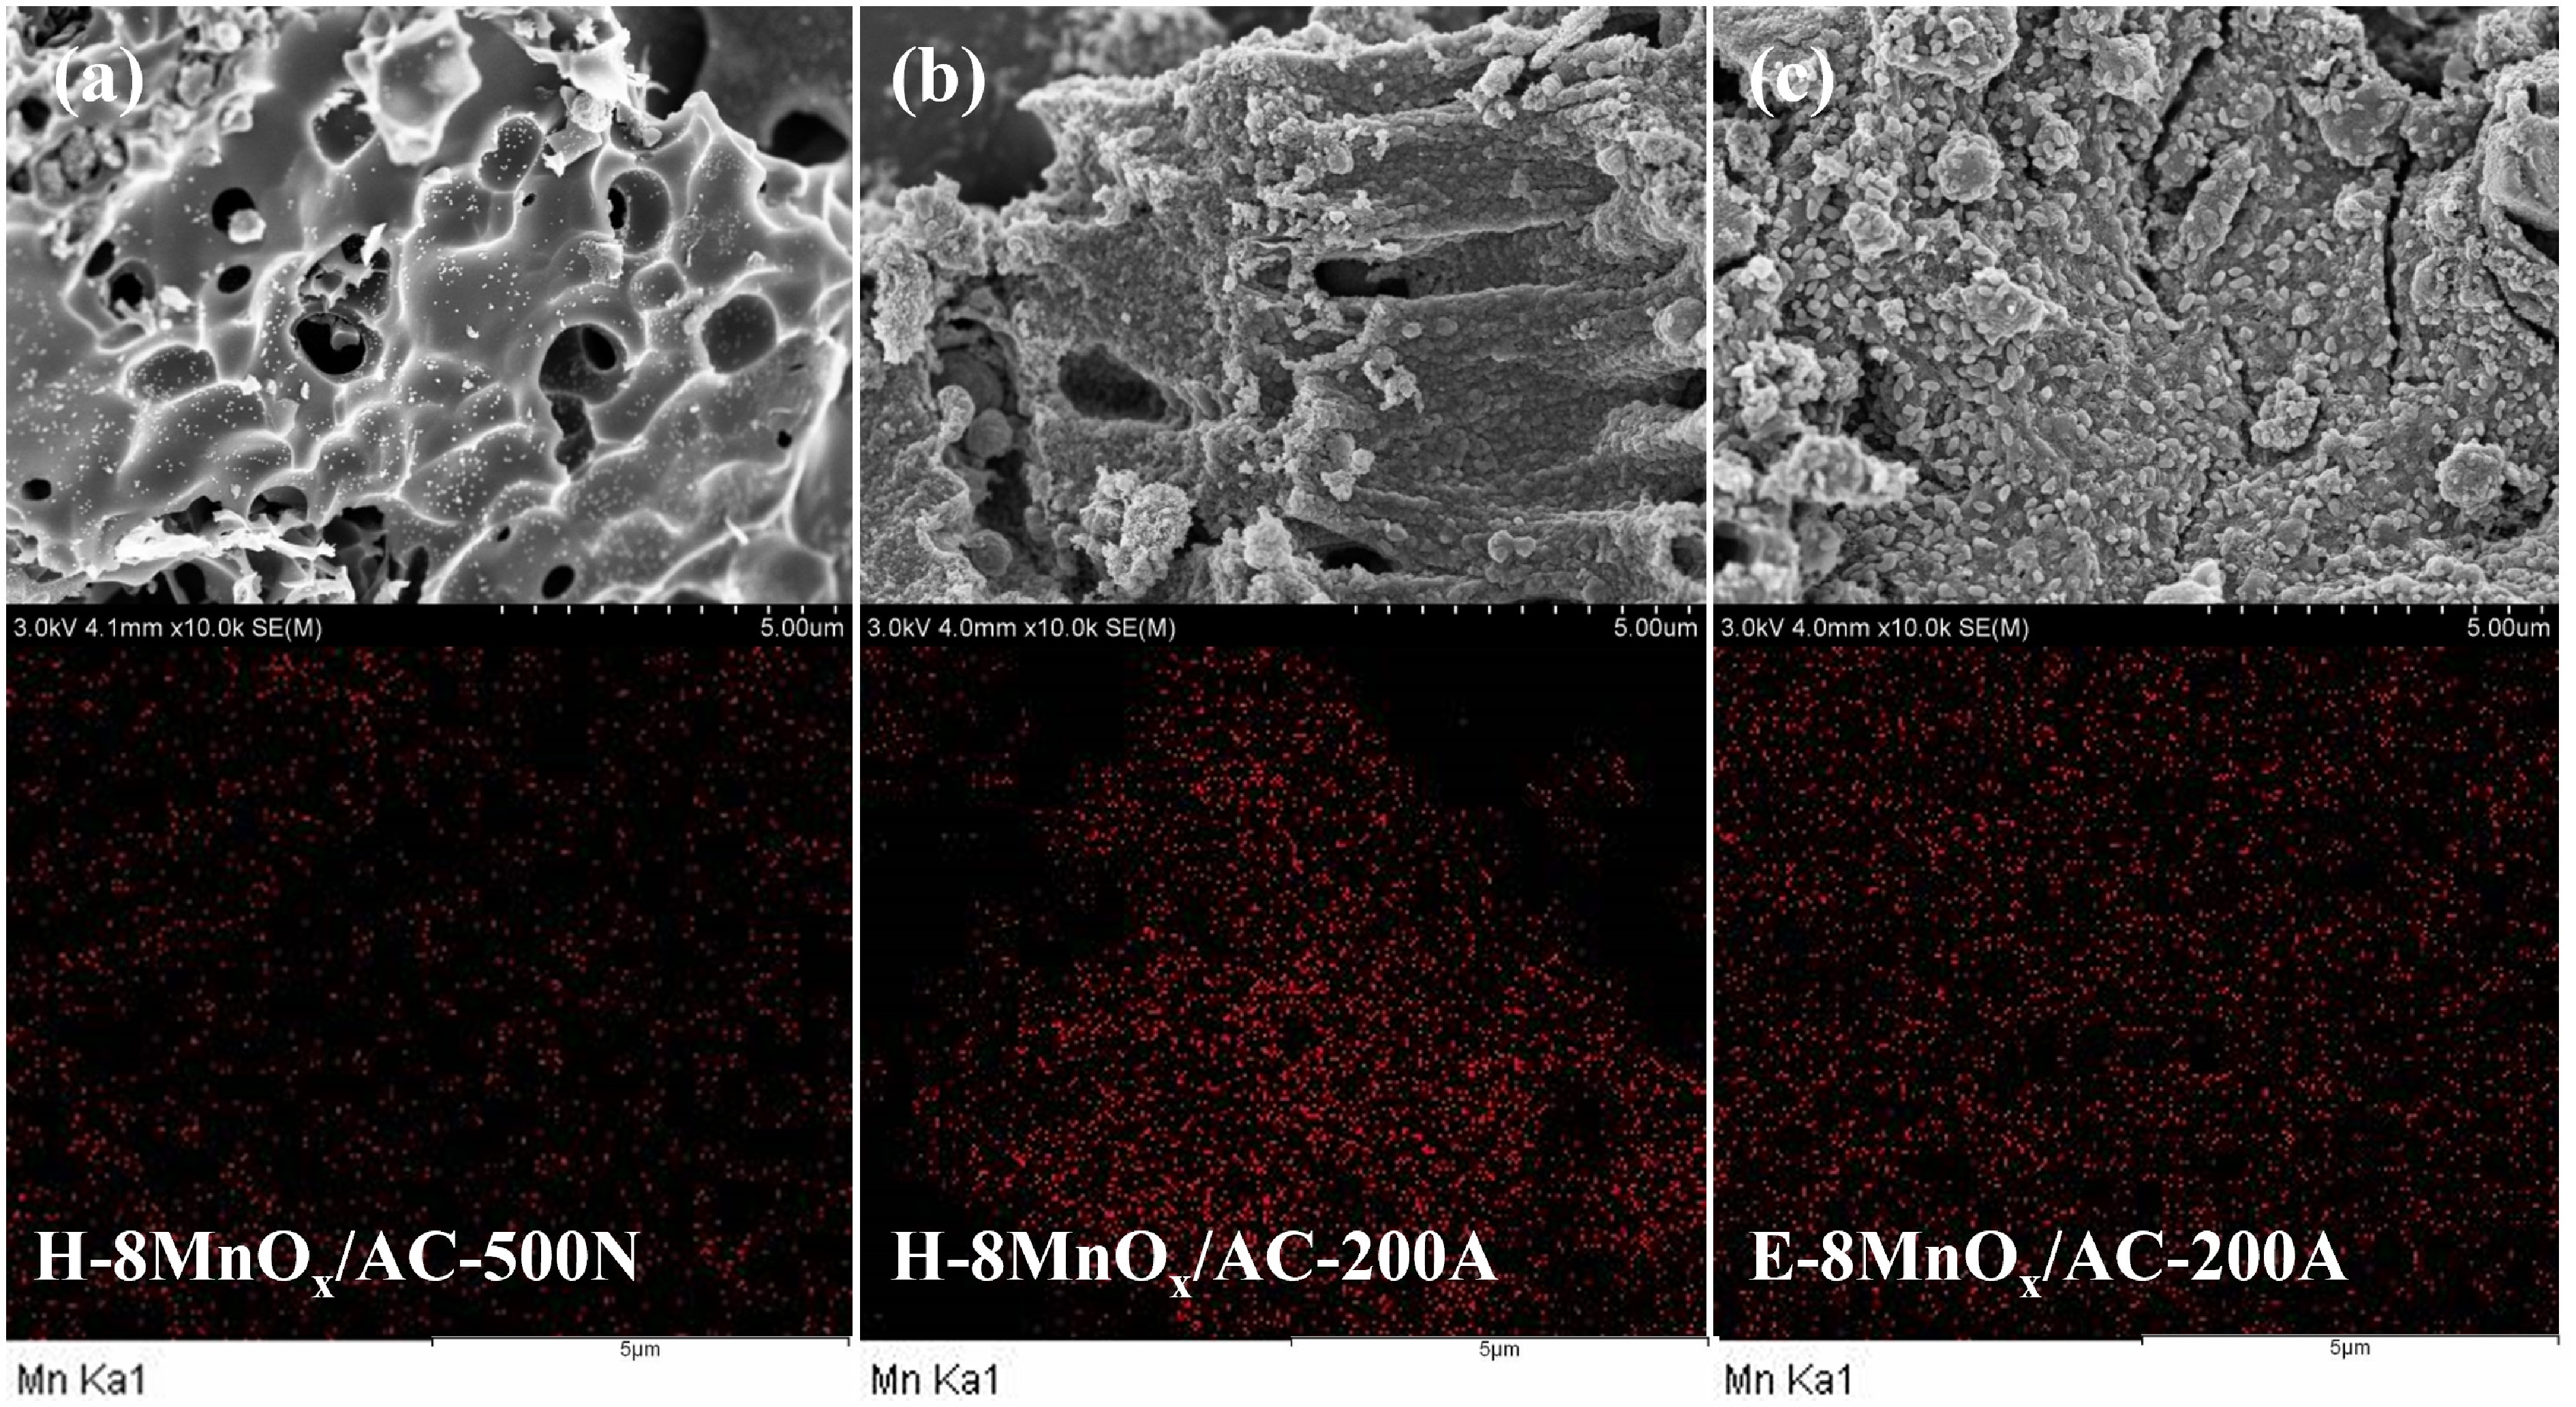
Figure 2.
SEM-EDS images of the catalysts: (a) H-8MnOx/AC-500N, (b) H-8MnOx/AC-200A, and (c) E-8MnOx/AC-200A.
-
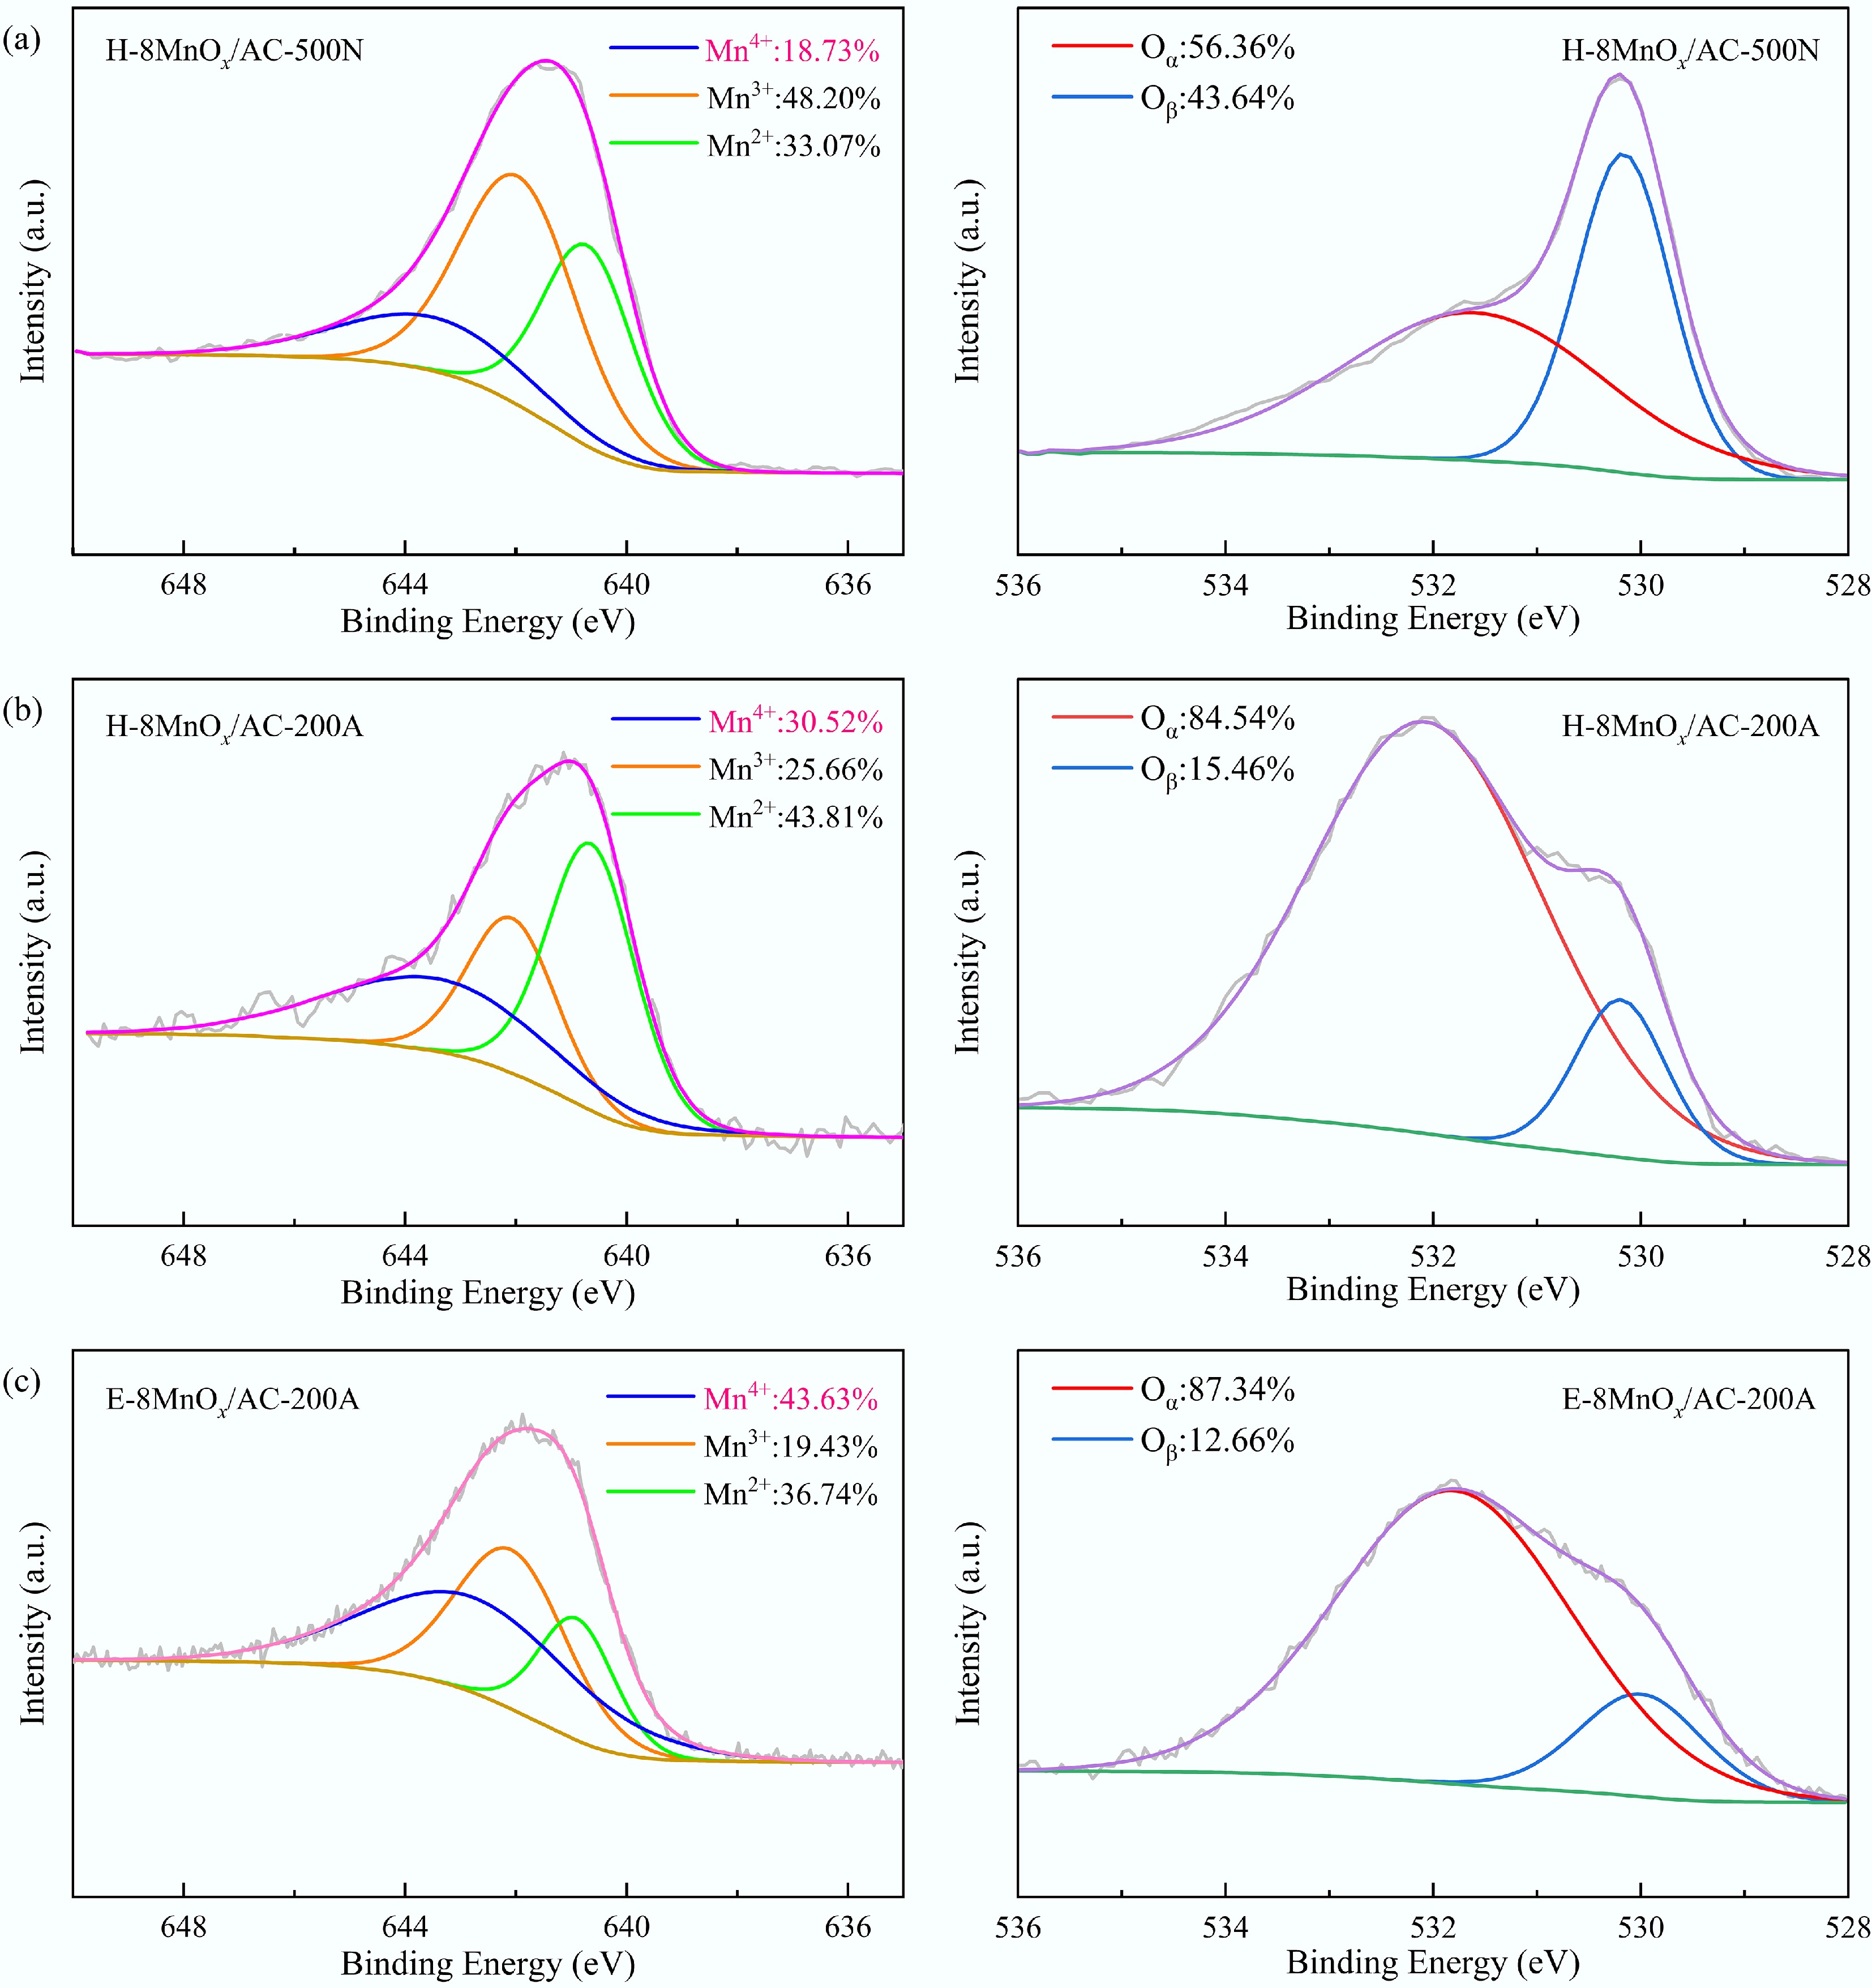
Figure 3.
Mn 2p3/2 and O 1s spectra: (a) H-8MnOx/AC-500N, (b) H-8MnOx/AC-200A, and (c) E-8MnOx/AC-200A.
-
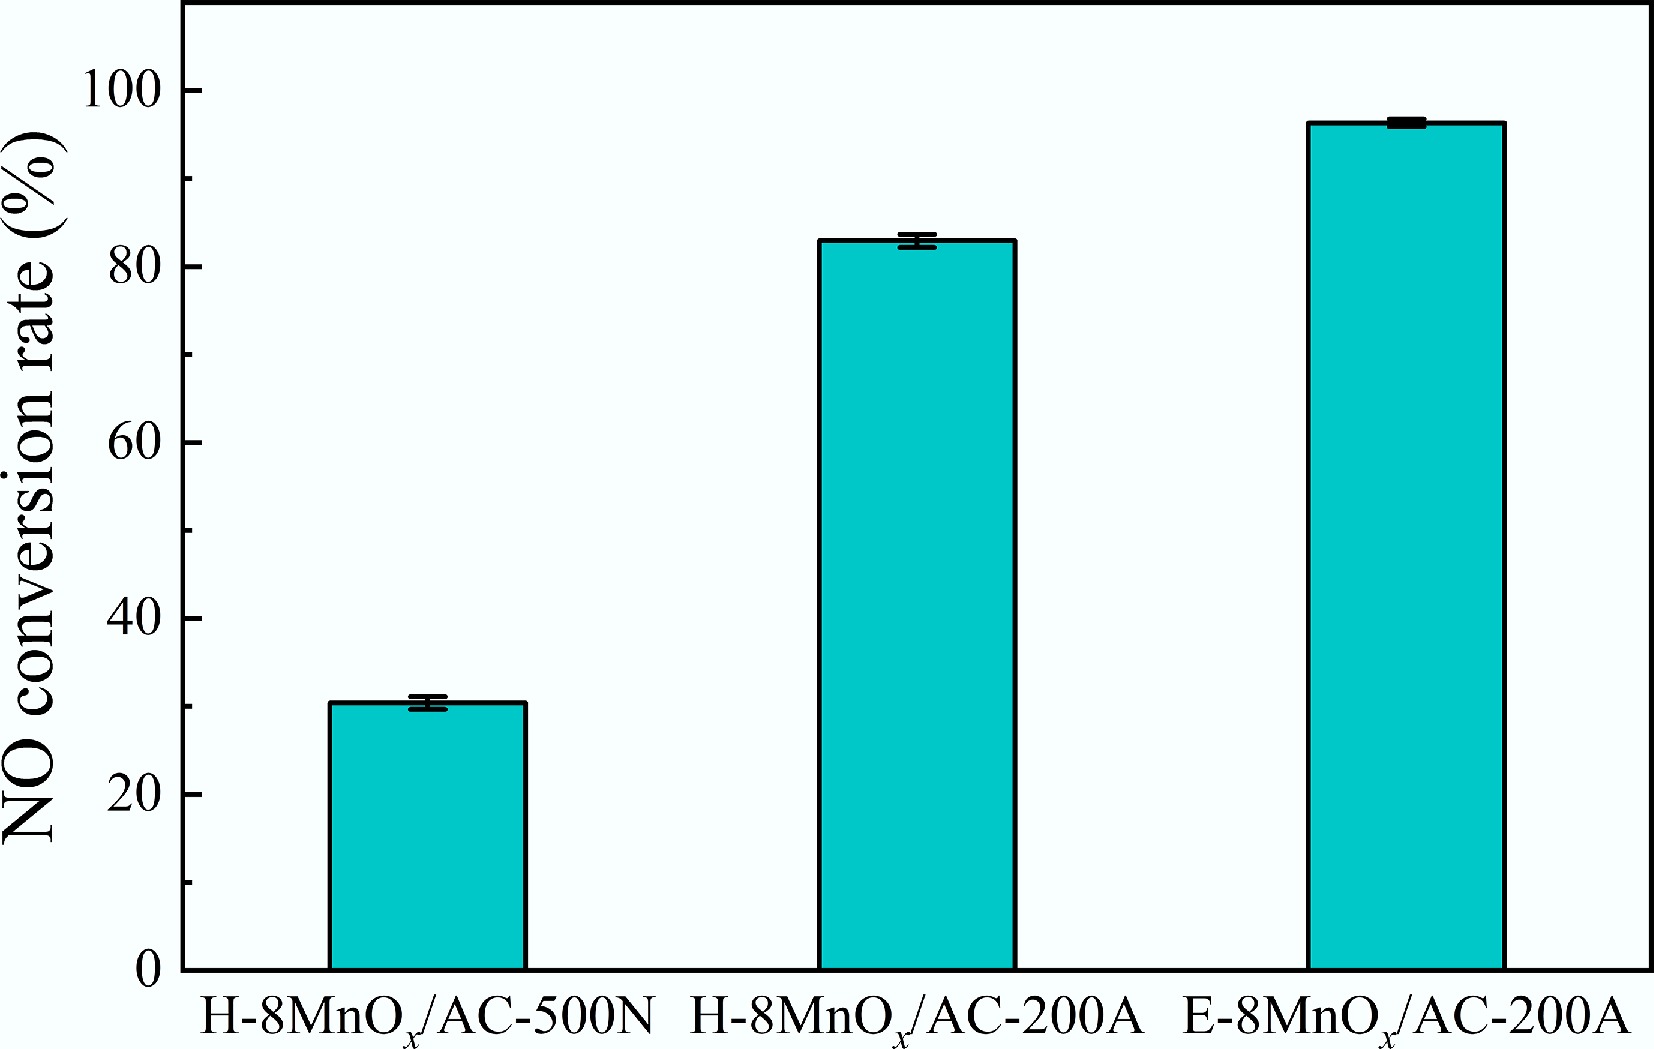
Figure 4.
Influence of preparation method on the catalysts' deNOx efficiency (GHSV of 20,000 h−1).
-
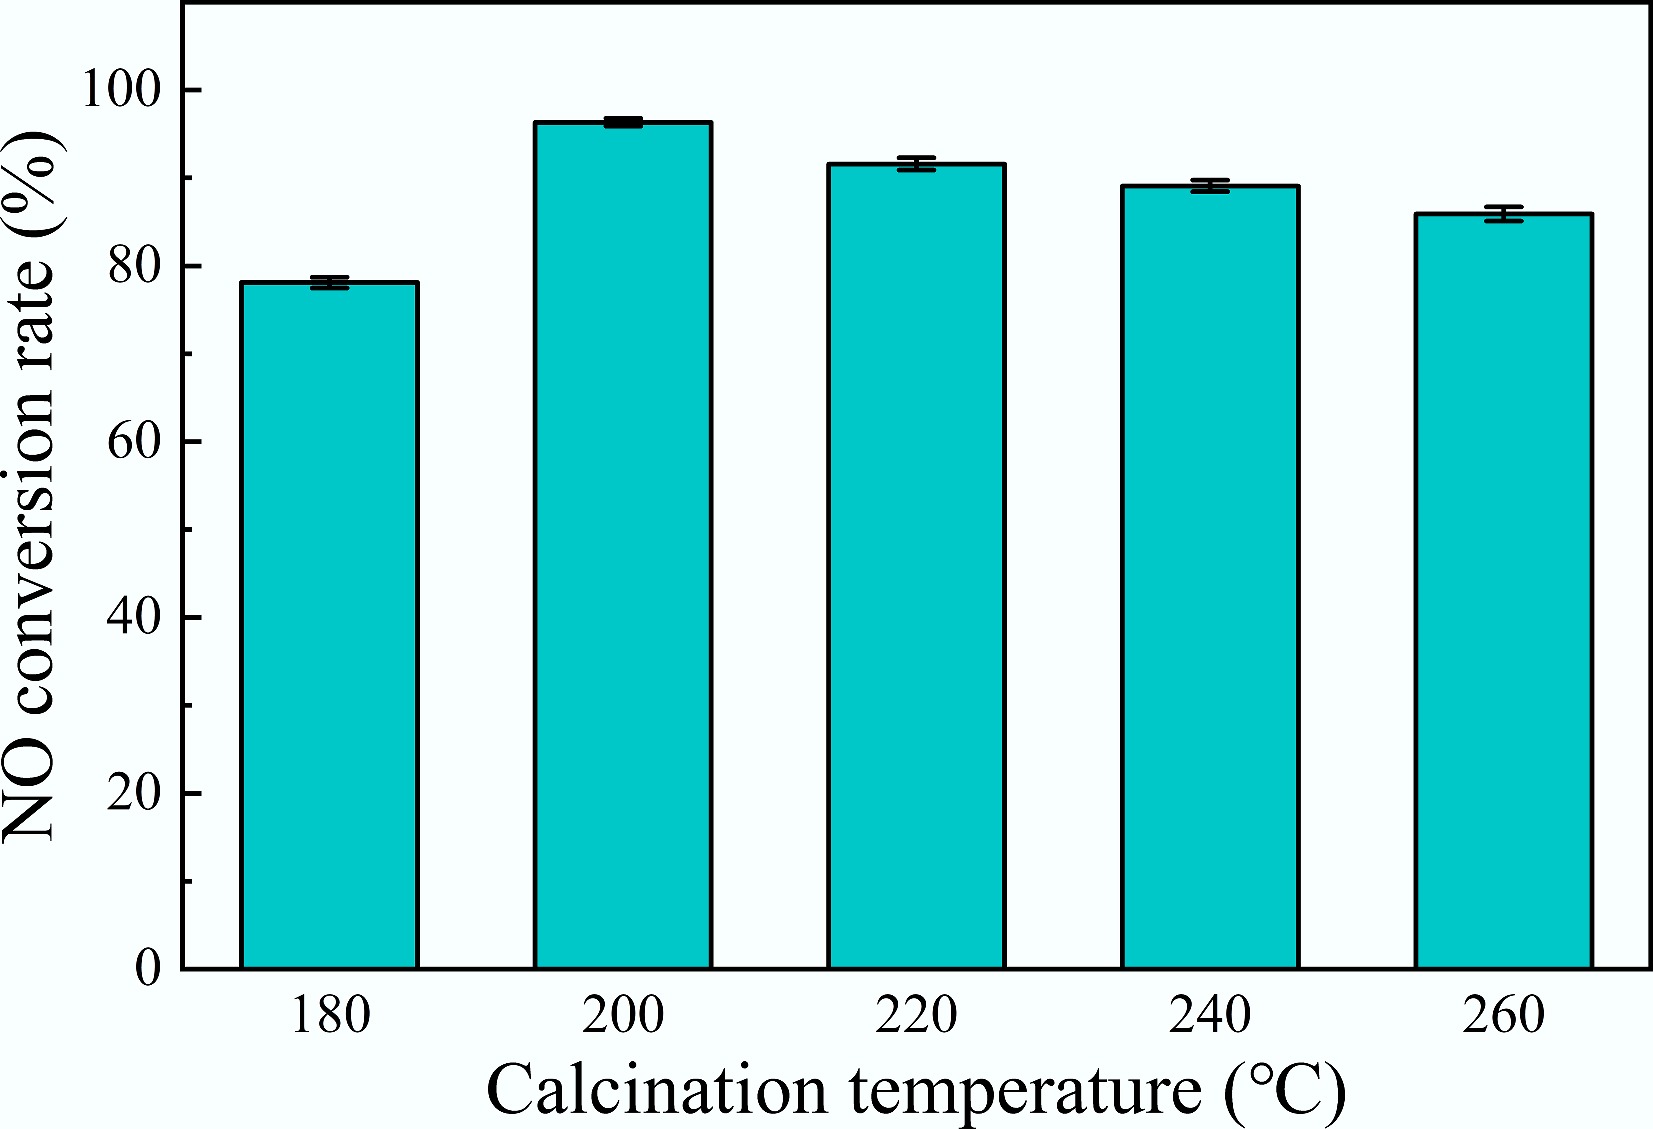
Figure 5.
Influence of calcination temperature on the catalysts' deNOx efficiency (GHSV of 20,000 h−1).
-
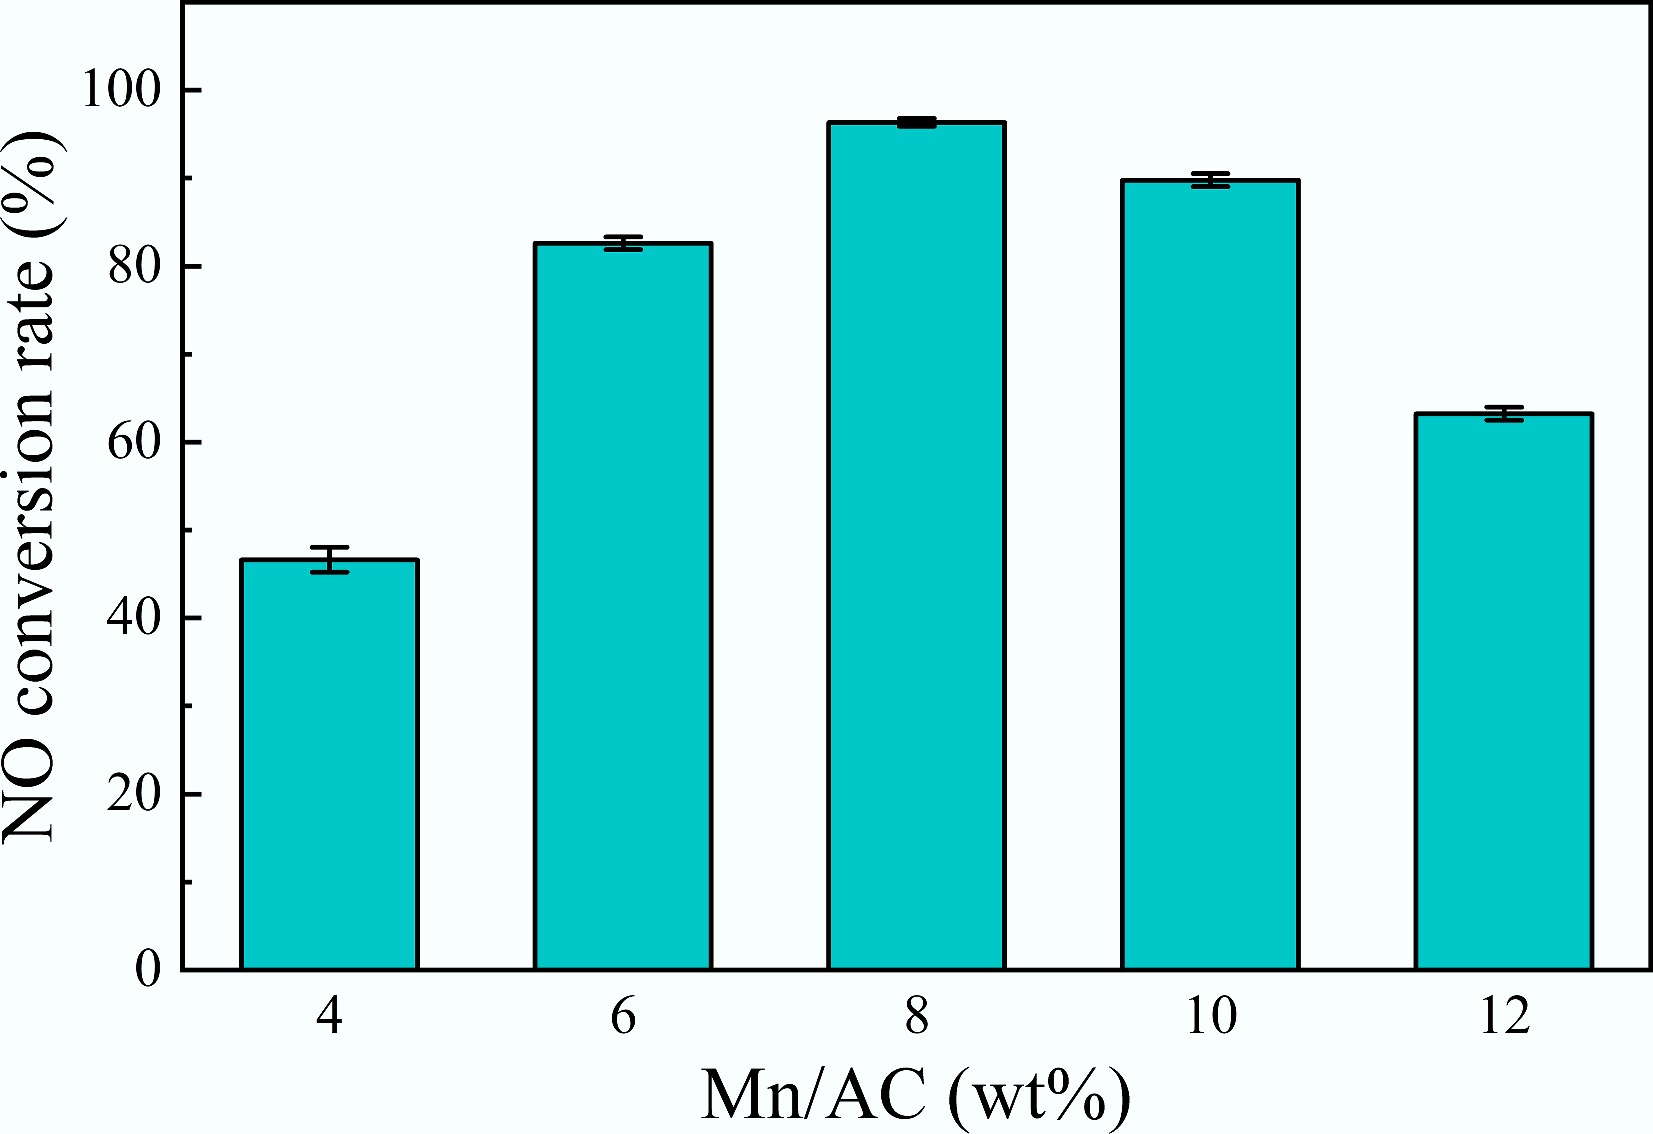
Figure 6.
Influence of Mn loading on the catalysts' deNOx efficiency (GHSV of 20,000 h−1).
-
Catalyst Preparation conditions Solvent Loading (wt%) Calcination temperature (°C) Calcination atmosphere E-8MnOx/AC-200A Ethanol 8 200 Air H-8MnOx/AC-200A Water 8 200 Air H-8MnOx/AC-500N Water 8 500 N2 E-8MnOx/AC-180A Ethanol 8 180 Air E-8MnOx/AC-220A Ethanol 8 220 Air E-8MnOx/AC-240A Ethanol 8 240 Air E-8MnOx/AC-260A Ethanol 1 260 Air E-4MnOx/AC-200A Ethanol 4 200 Air E-6MnOx/AC-200A Ethanol 6 200 Air E-10MnOx/AC-200A Ethanol 10 200 Air E-12MnOx/AC-200A Ethanol 12 200 Air Table 1.
Catalysts' preparation conditions
-
Catalyst SBET
(m2/g)Vmic
(cm3/g)Vtot
(cm3/g)Vmic/Vtot
(%)Dp
(nm)H-8MnOx/AC-500N 743.6 0.306 0.343 89.2 1.845 H-8MnOx/AC-200A 686.2 0.297 0.326 91.1 1.900 E-8MnOx/AC-200A 689.3 0.315 0.342 92.1 1.988 Table 2.
Pore structure parameters of the catalysts
Figures
(6)
Tables
(2)