-
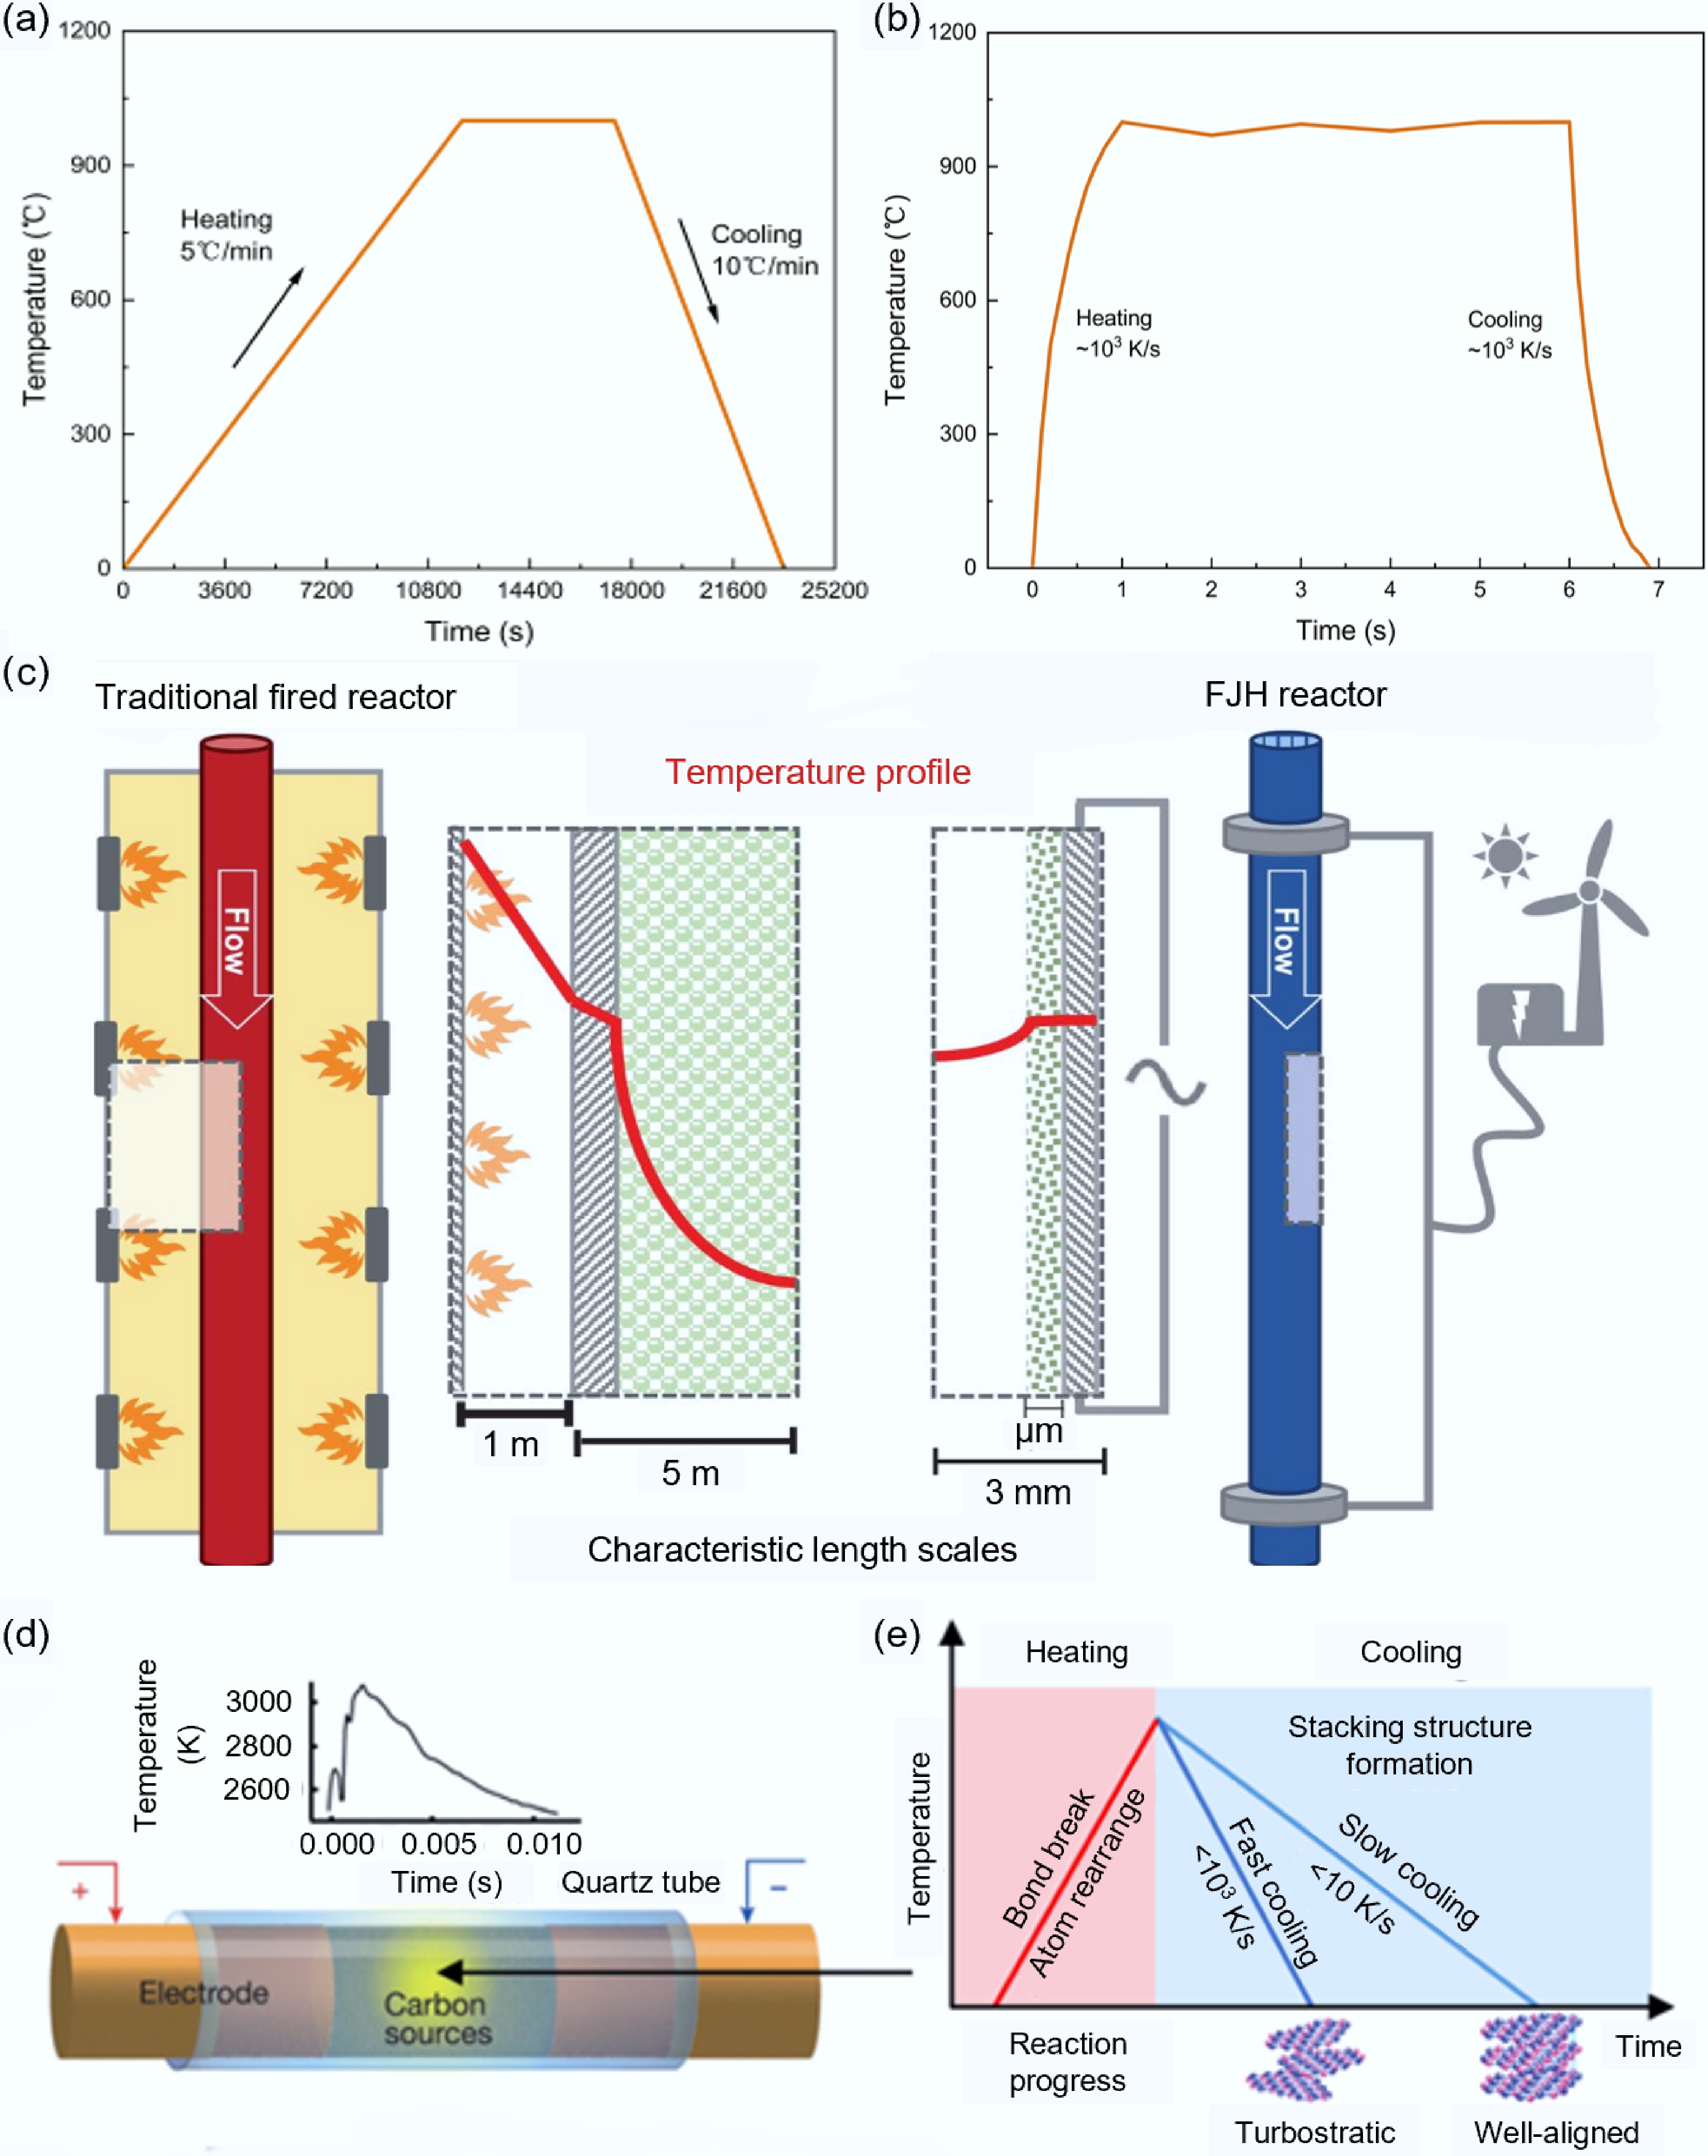
Figure 1.
Temperature characteristics comparison between FJH and traditional heating processes. (a) Heating/cooling rates of traditional heating method[27]. (b) Heating/cooling rates of FJH[24]. (c) Comparison of temperature distributions between traditional combustion devices and FJH reaction devices[28]. (d) Schematic diagram of FJH reaction[14]. (e) Effects of FJH heating/cooling rates on the structure of carbon products[32].
-
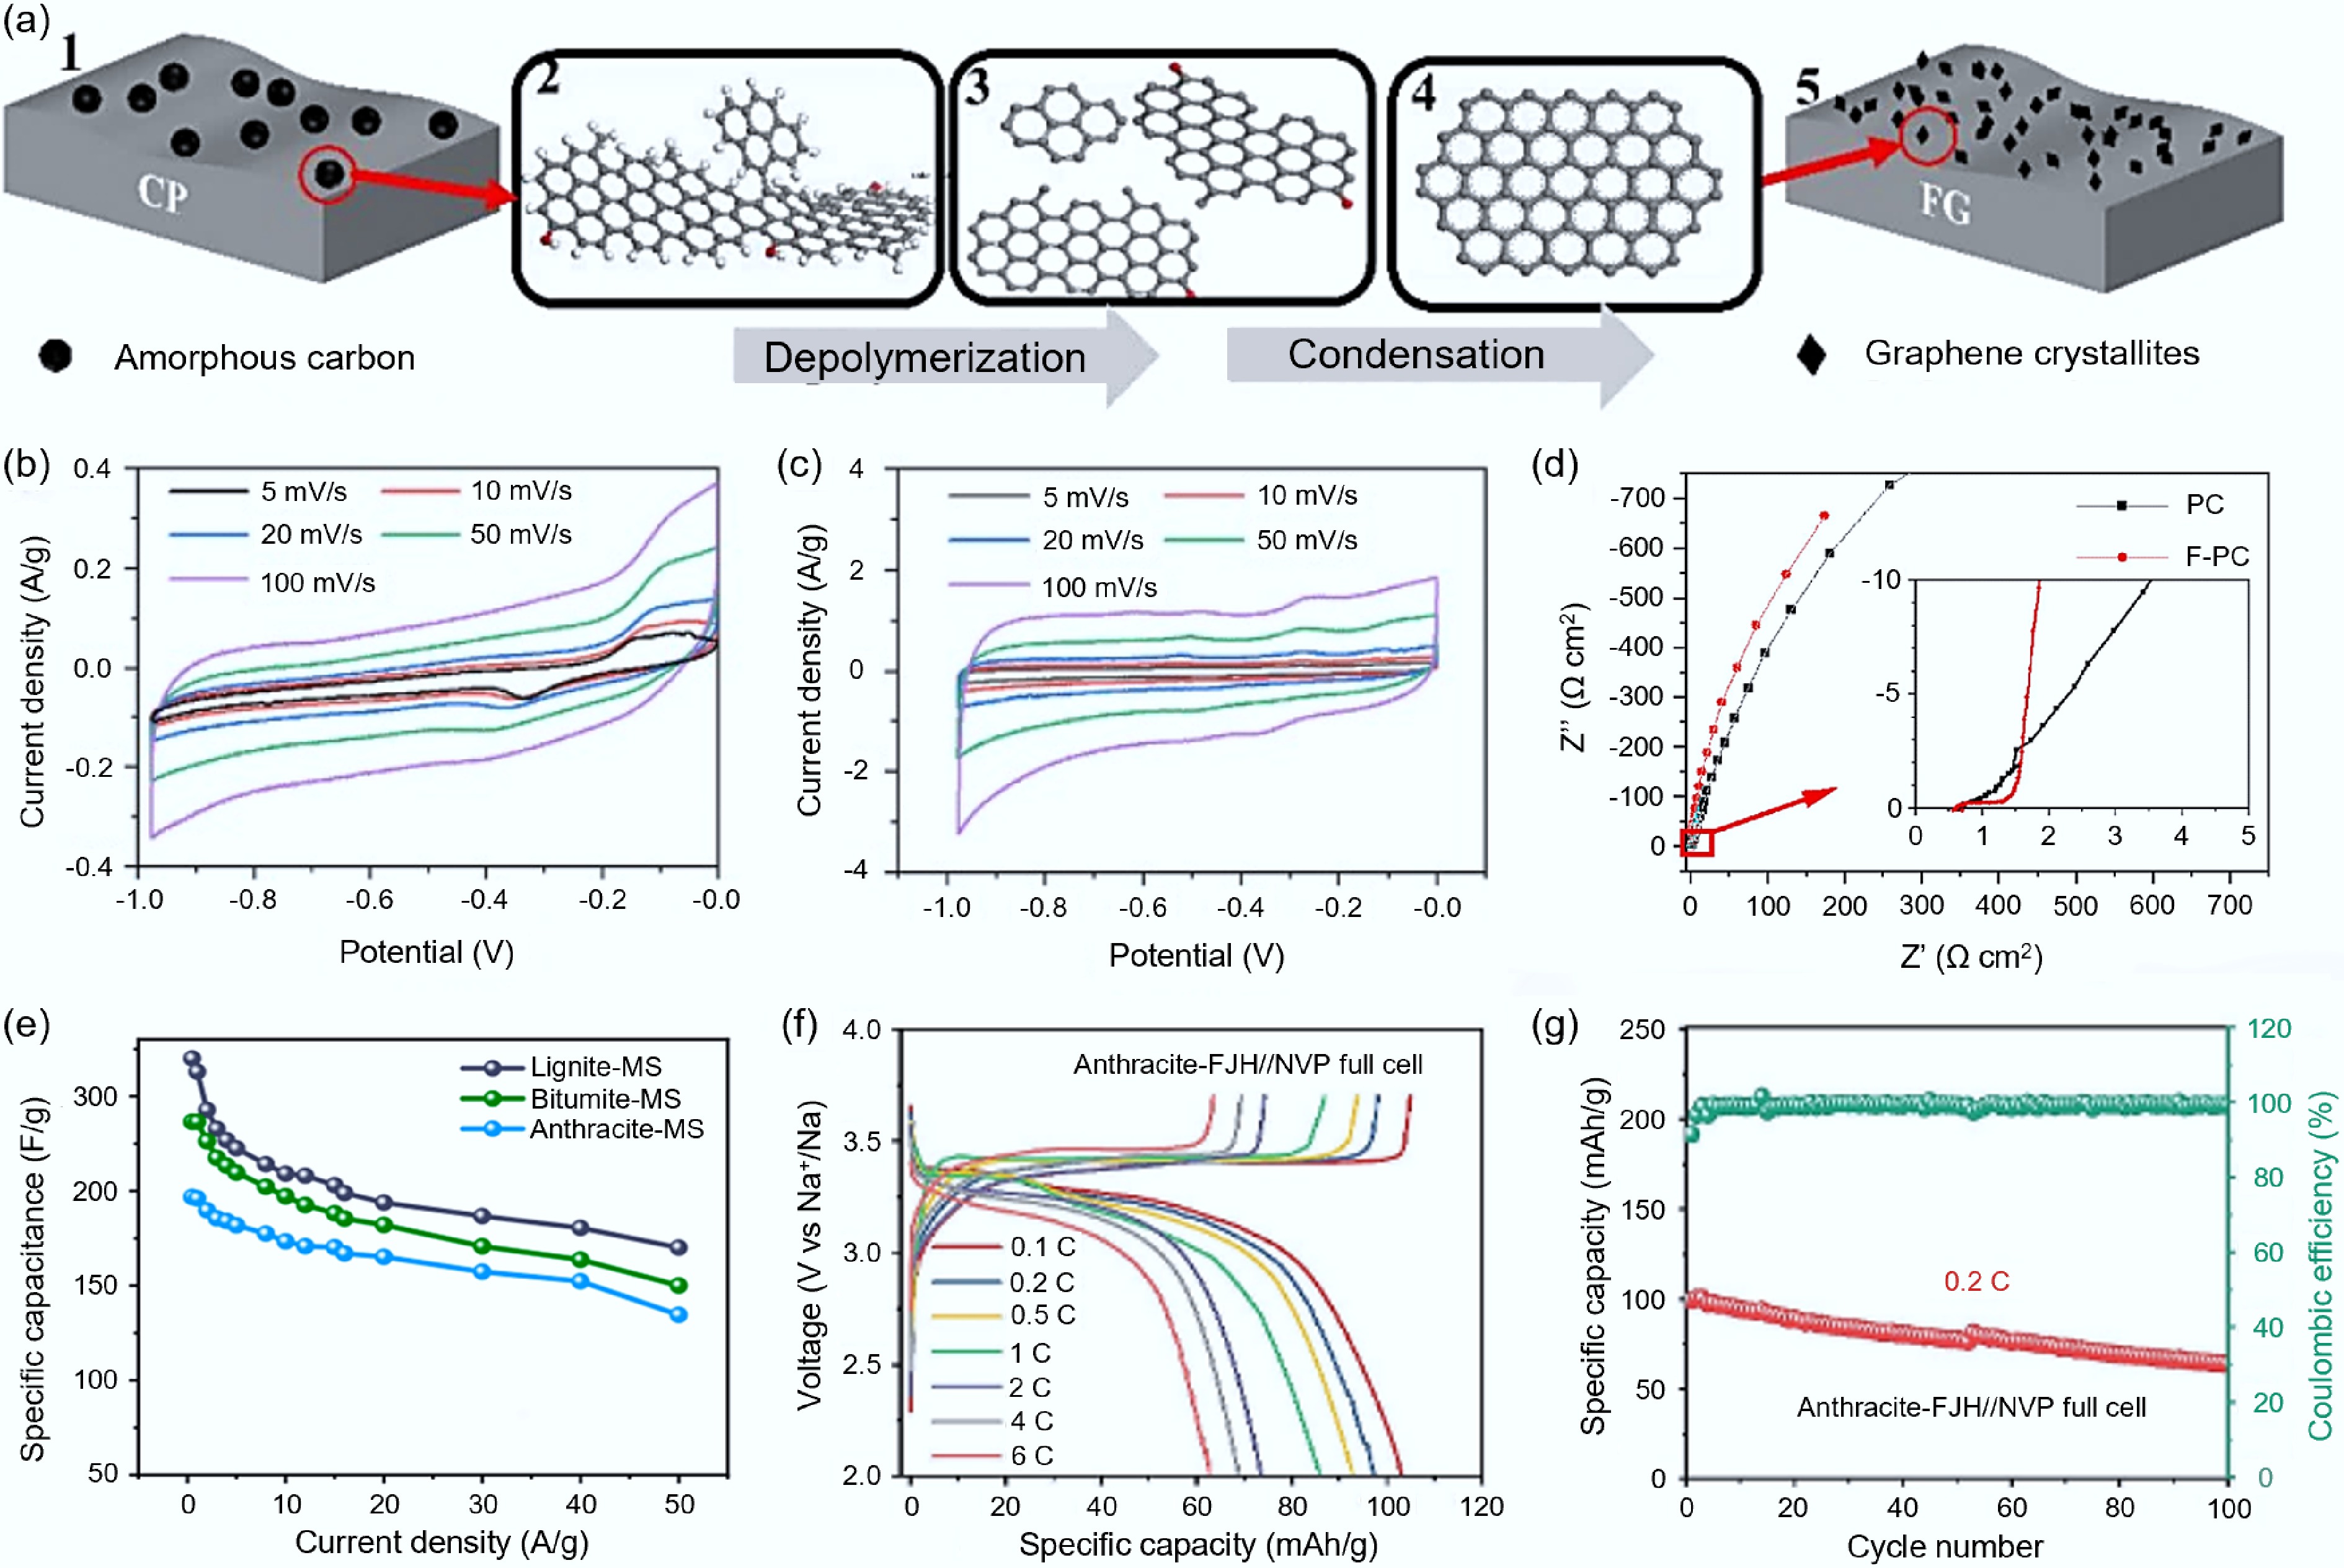
Figure 2.
Synthesis of carbon-based electrode materials from fossil fuels via FJH. (a) Schematic diagram of the formation mechanism of coal-based-FG[41]. (b) CV curve of the supercapacitor battery assembled with PC[41]. (c) CV curve of the supercapacitor battery assembled with F-PC[41]. (d) Nyquist plots of PC and F-PC[41]. (e) Specific capacitance of carbon materials synthesized from lignite, bituminous coal, and anthracite at different current densities[44]. (f) CD spectrum of all batteries assembled with Na3V2(PO4)3 positive electrode and graphite from anthracite at different rates[45]. (g) Cycling performance of all batteries assembled with Na3V2(PO4)3 positive electrode and graphite from anthracite at 0.2 C[45].
-
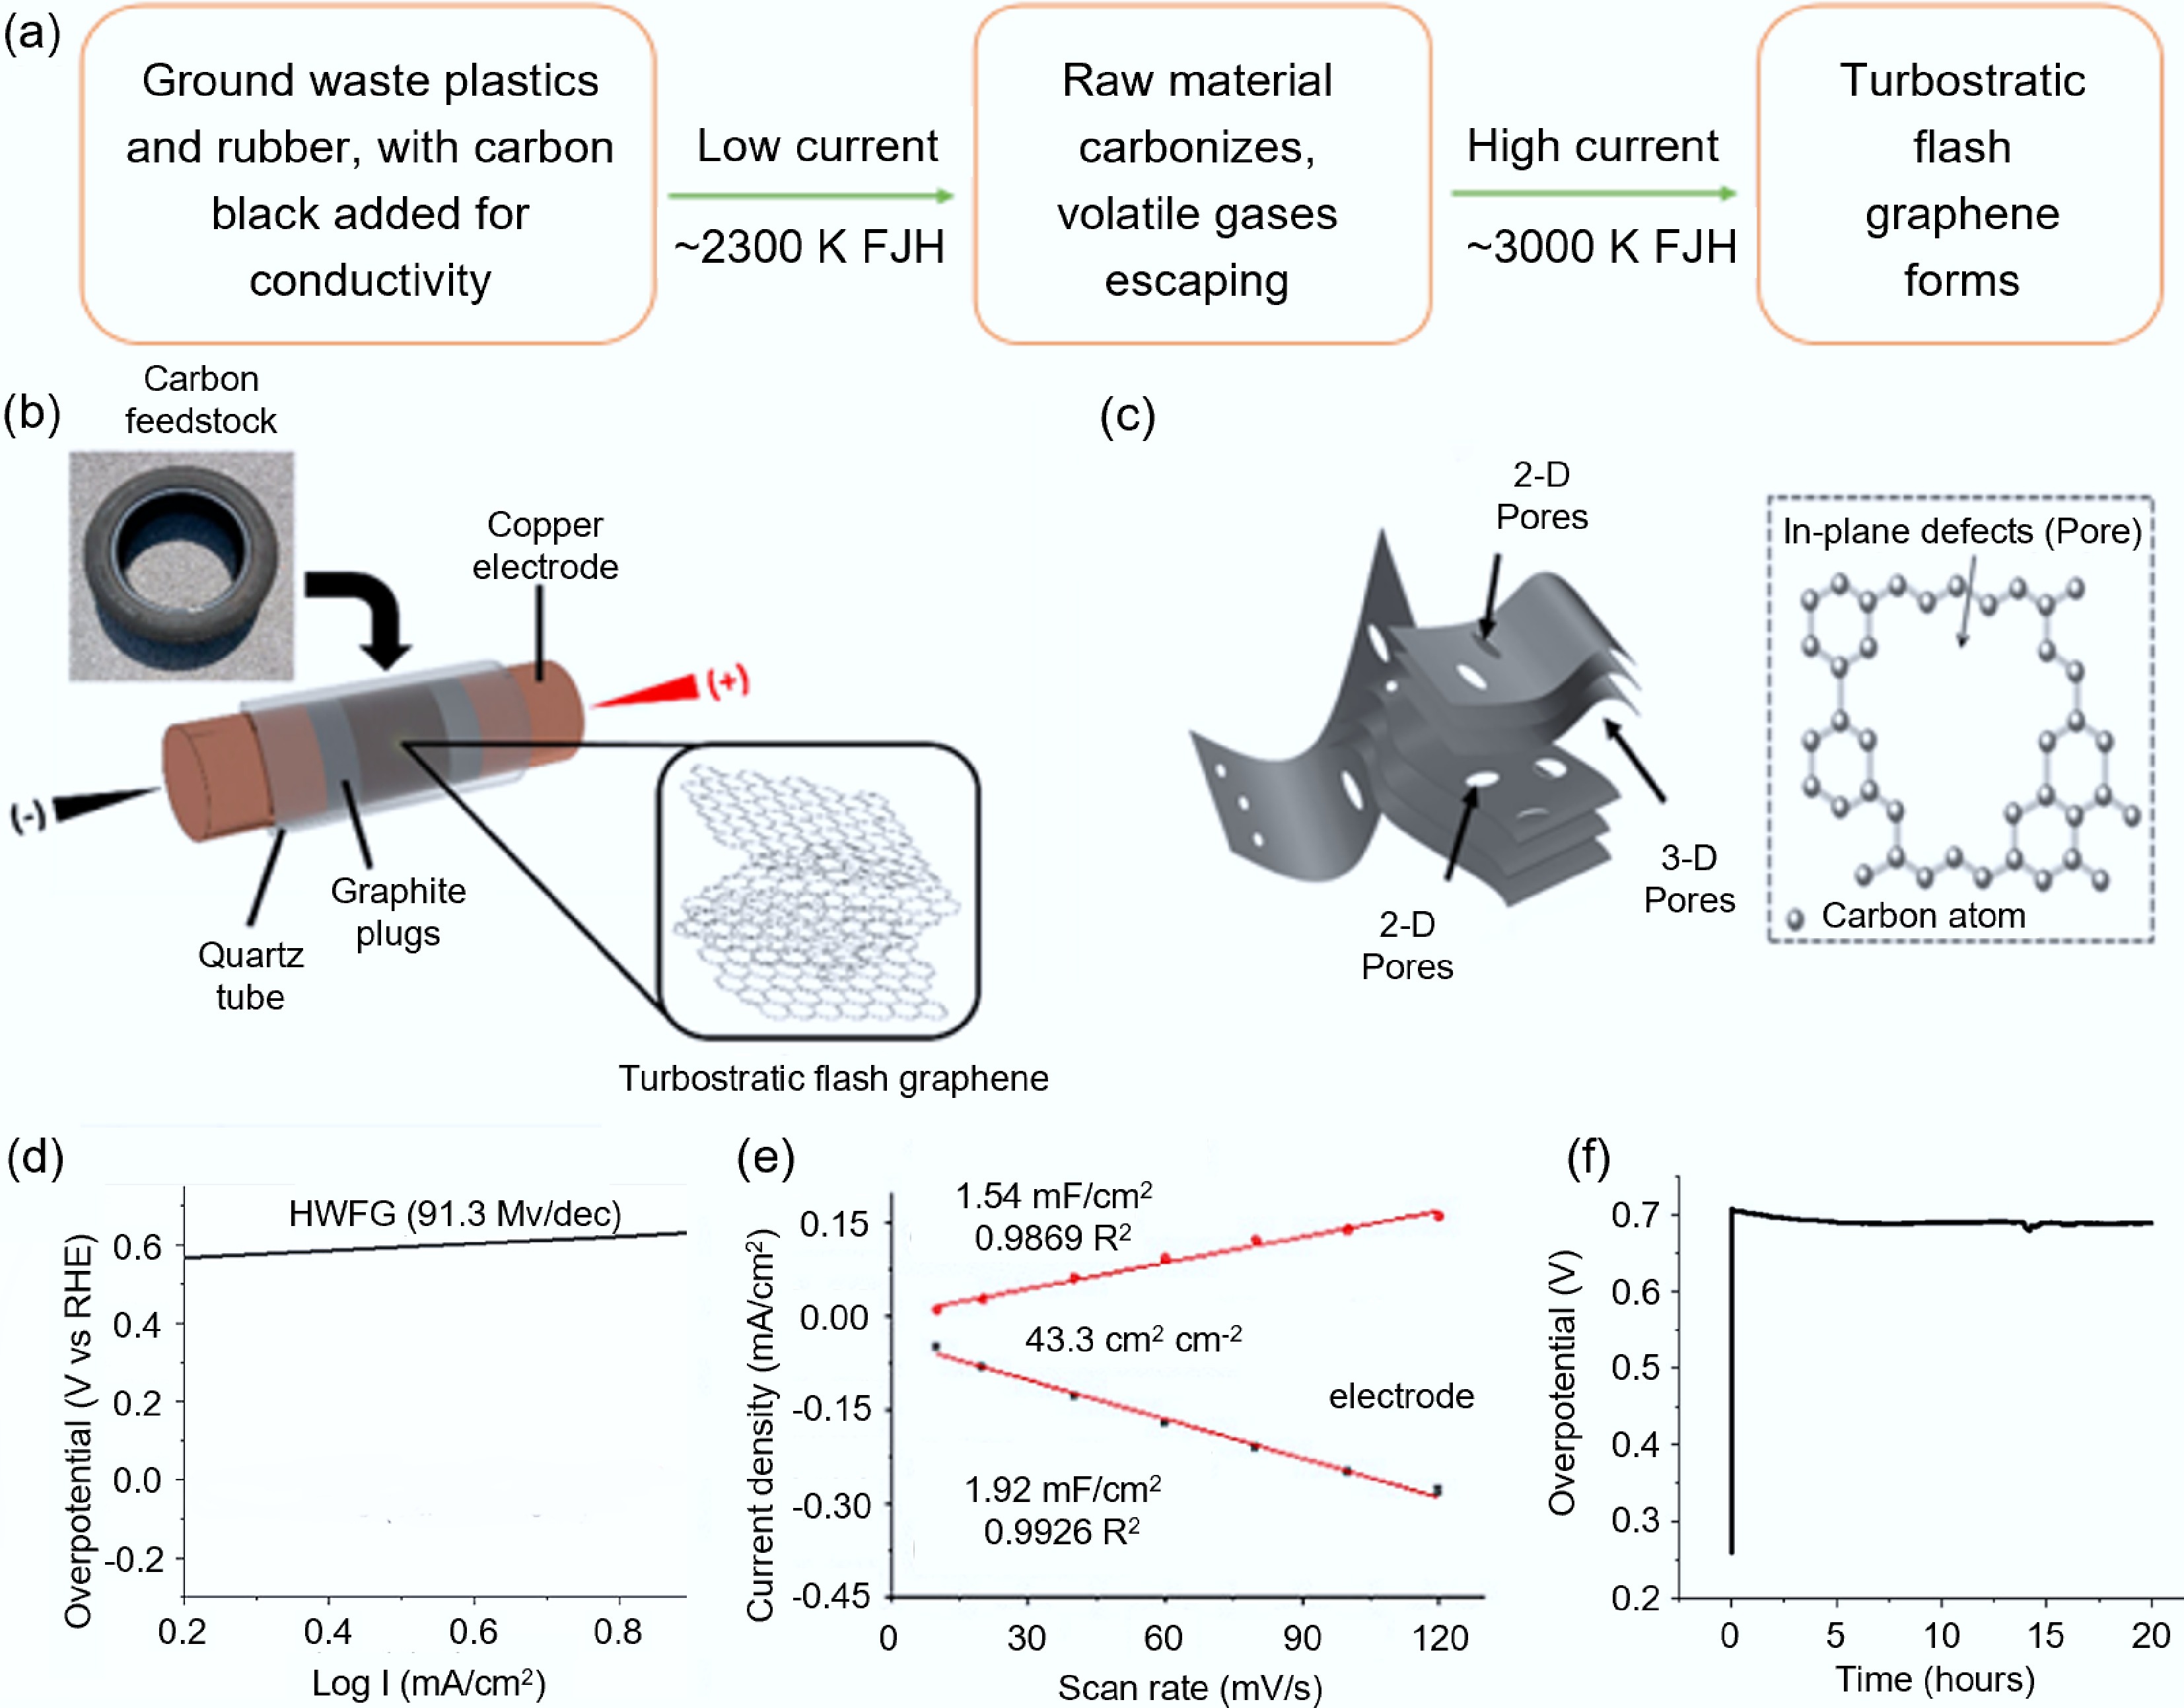
Figure 3.
Synthesis of carbon-based electrode materials from plastics and rubber waste via FJH. (a) Flowchart of the two-step FJH method[18]. (b) Schematic diagram of tFG synthesis[18]. (c) Structural diagram of HWFG[55]. (d) Tafel slope. (e) Capacitance measurement (the inset shows the current density at different scan rates)[55]. (f) Stability test of HWFG at 20 mA/cm2[55].
-
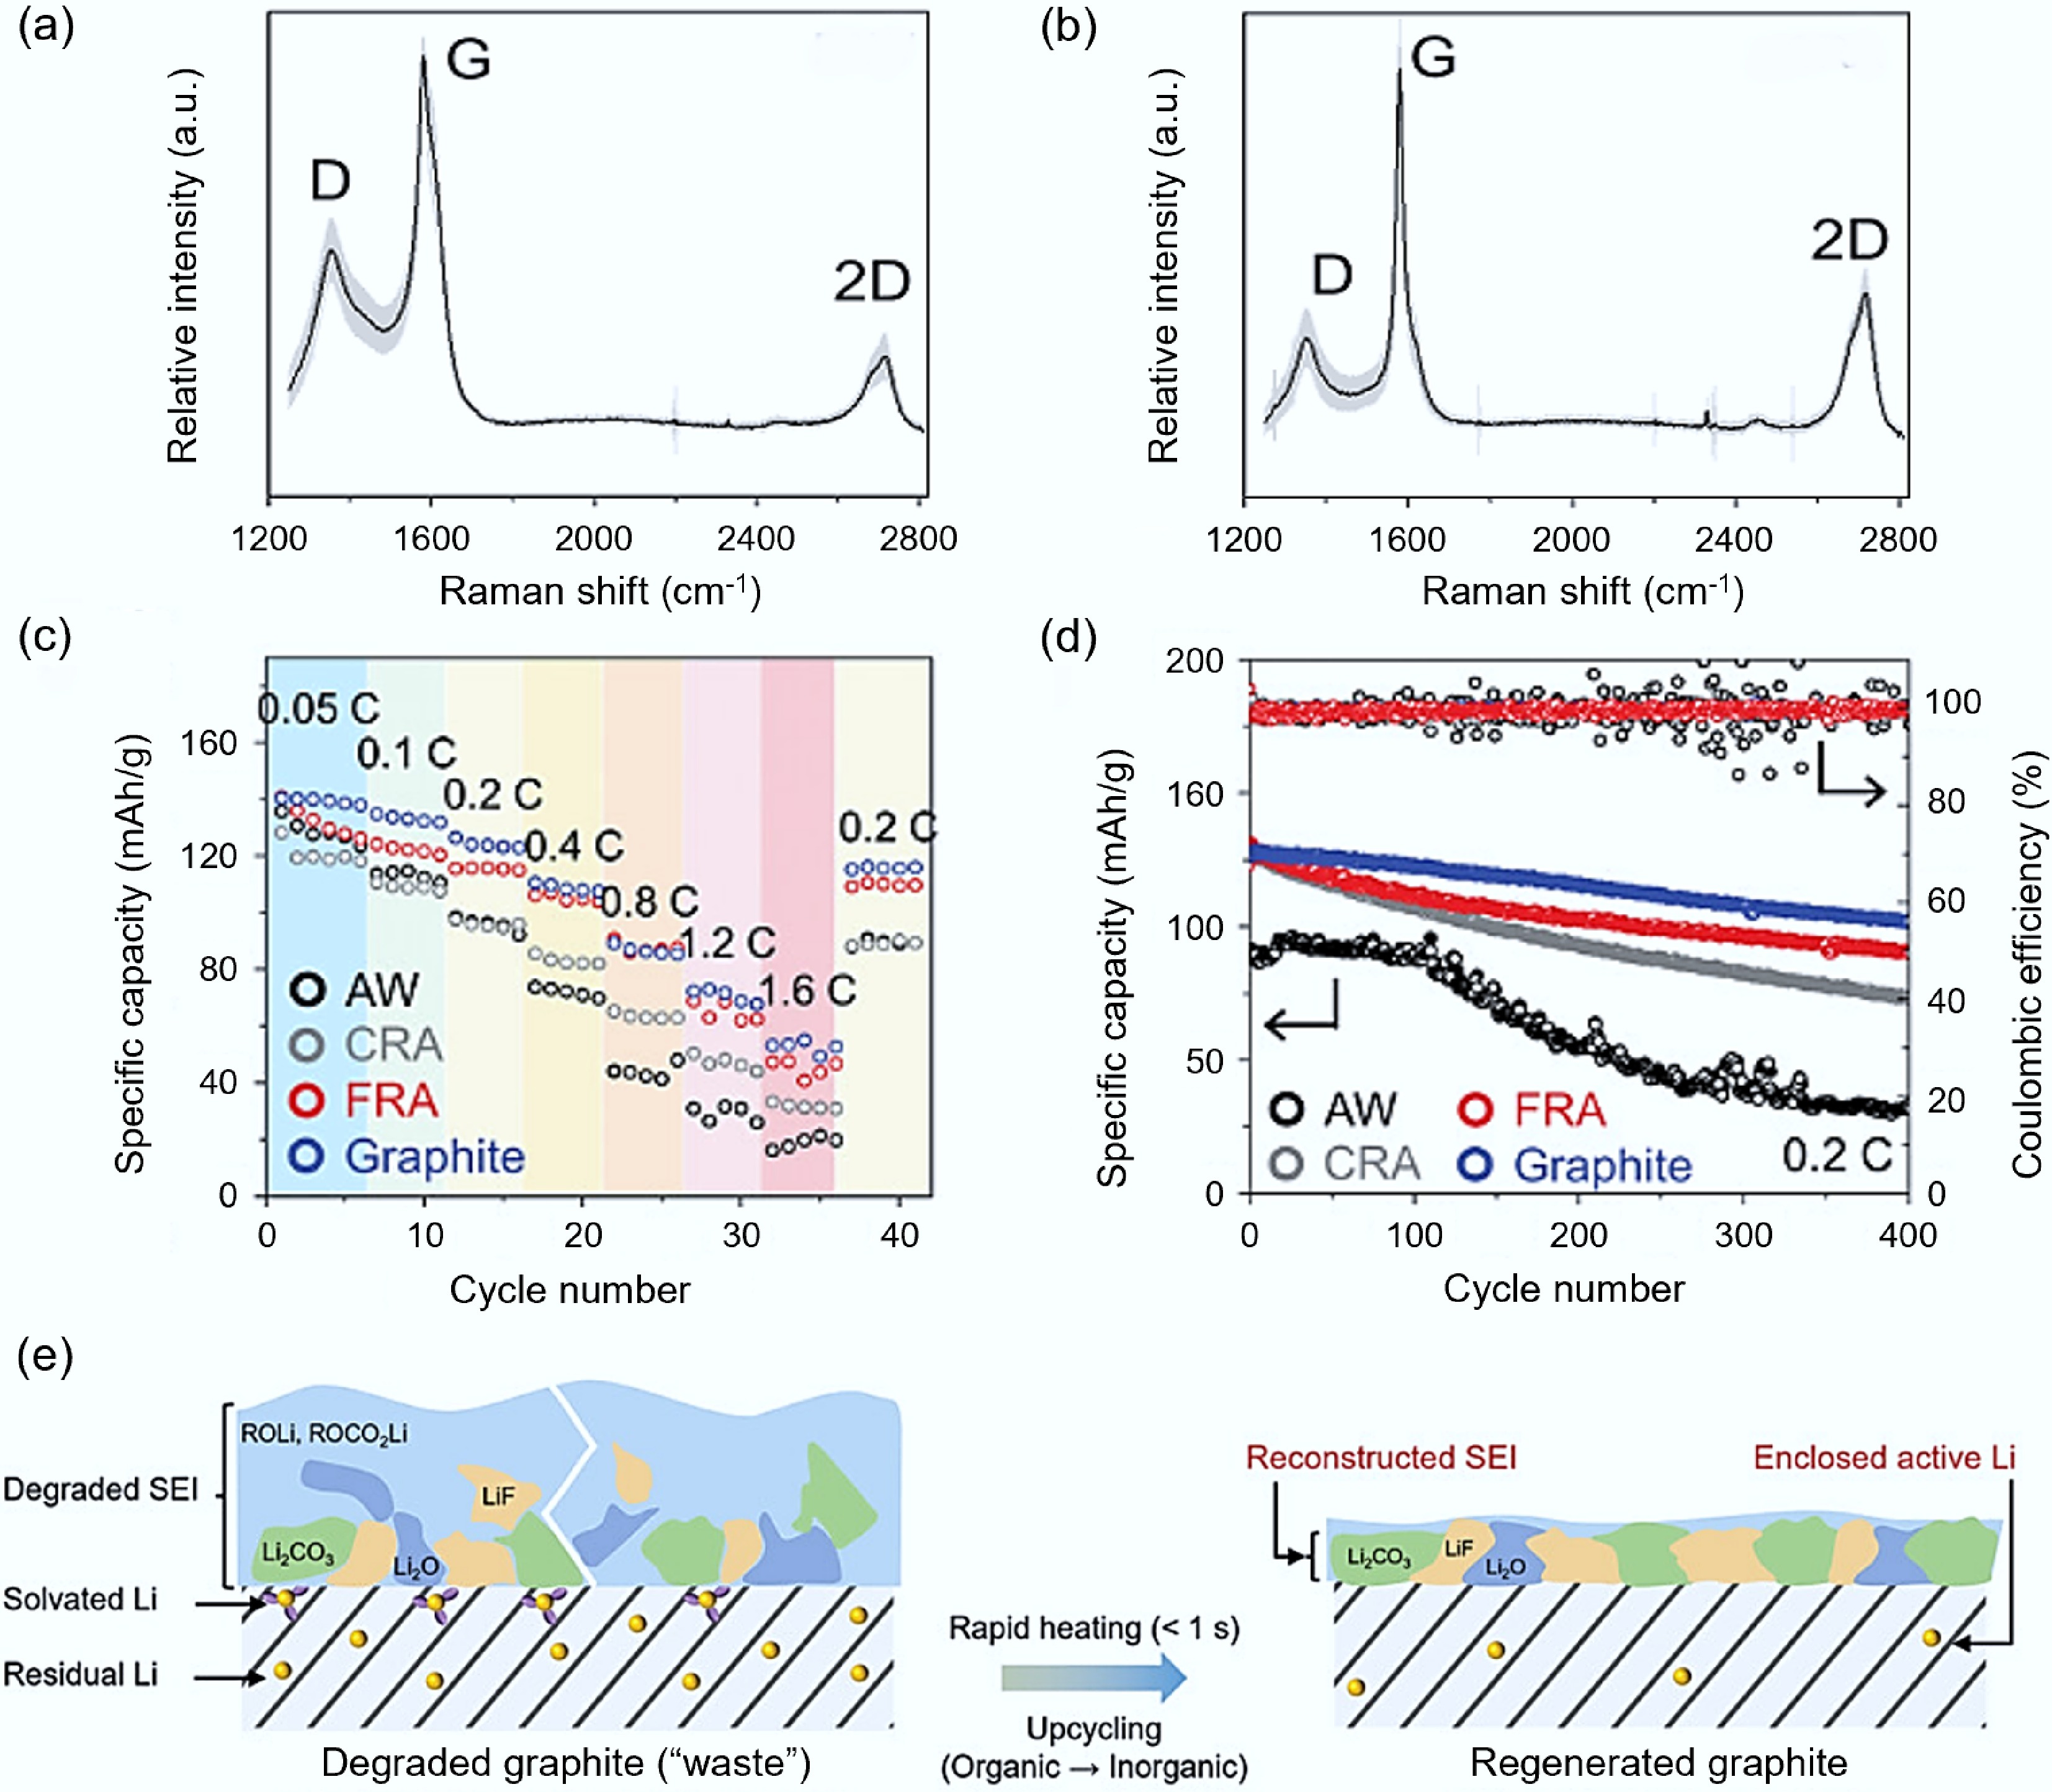
Figure 4.
Regeneration of waste anode graphite via FJH. (a) CRA Raman spectrogram[60]. (b) FRA Raman spectrogram[60]. (c) Comparison of electrode performance among AW (black), CRA (gray), FRA (red), and commercial graphite (blue)[60]. (d) Comparison of cycling performance of AW (black), CRA (gray), FRA (red), and commercial graphite (blue) at 0.2 C current[60]. (e) TEM process diagram of the transformation from thick and loose SEI layer to thin and dense SEI layer[63].
-
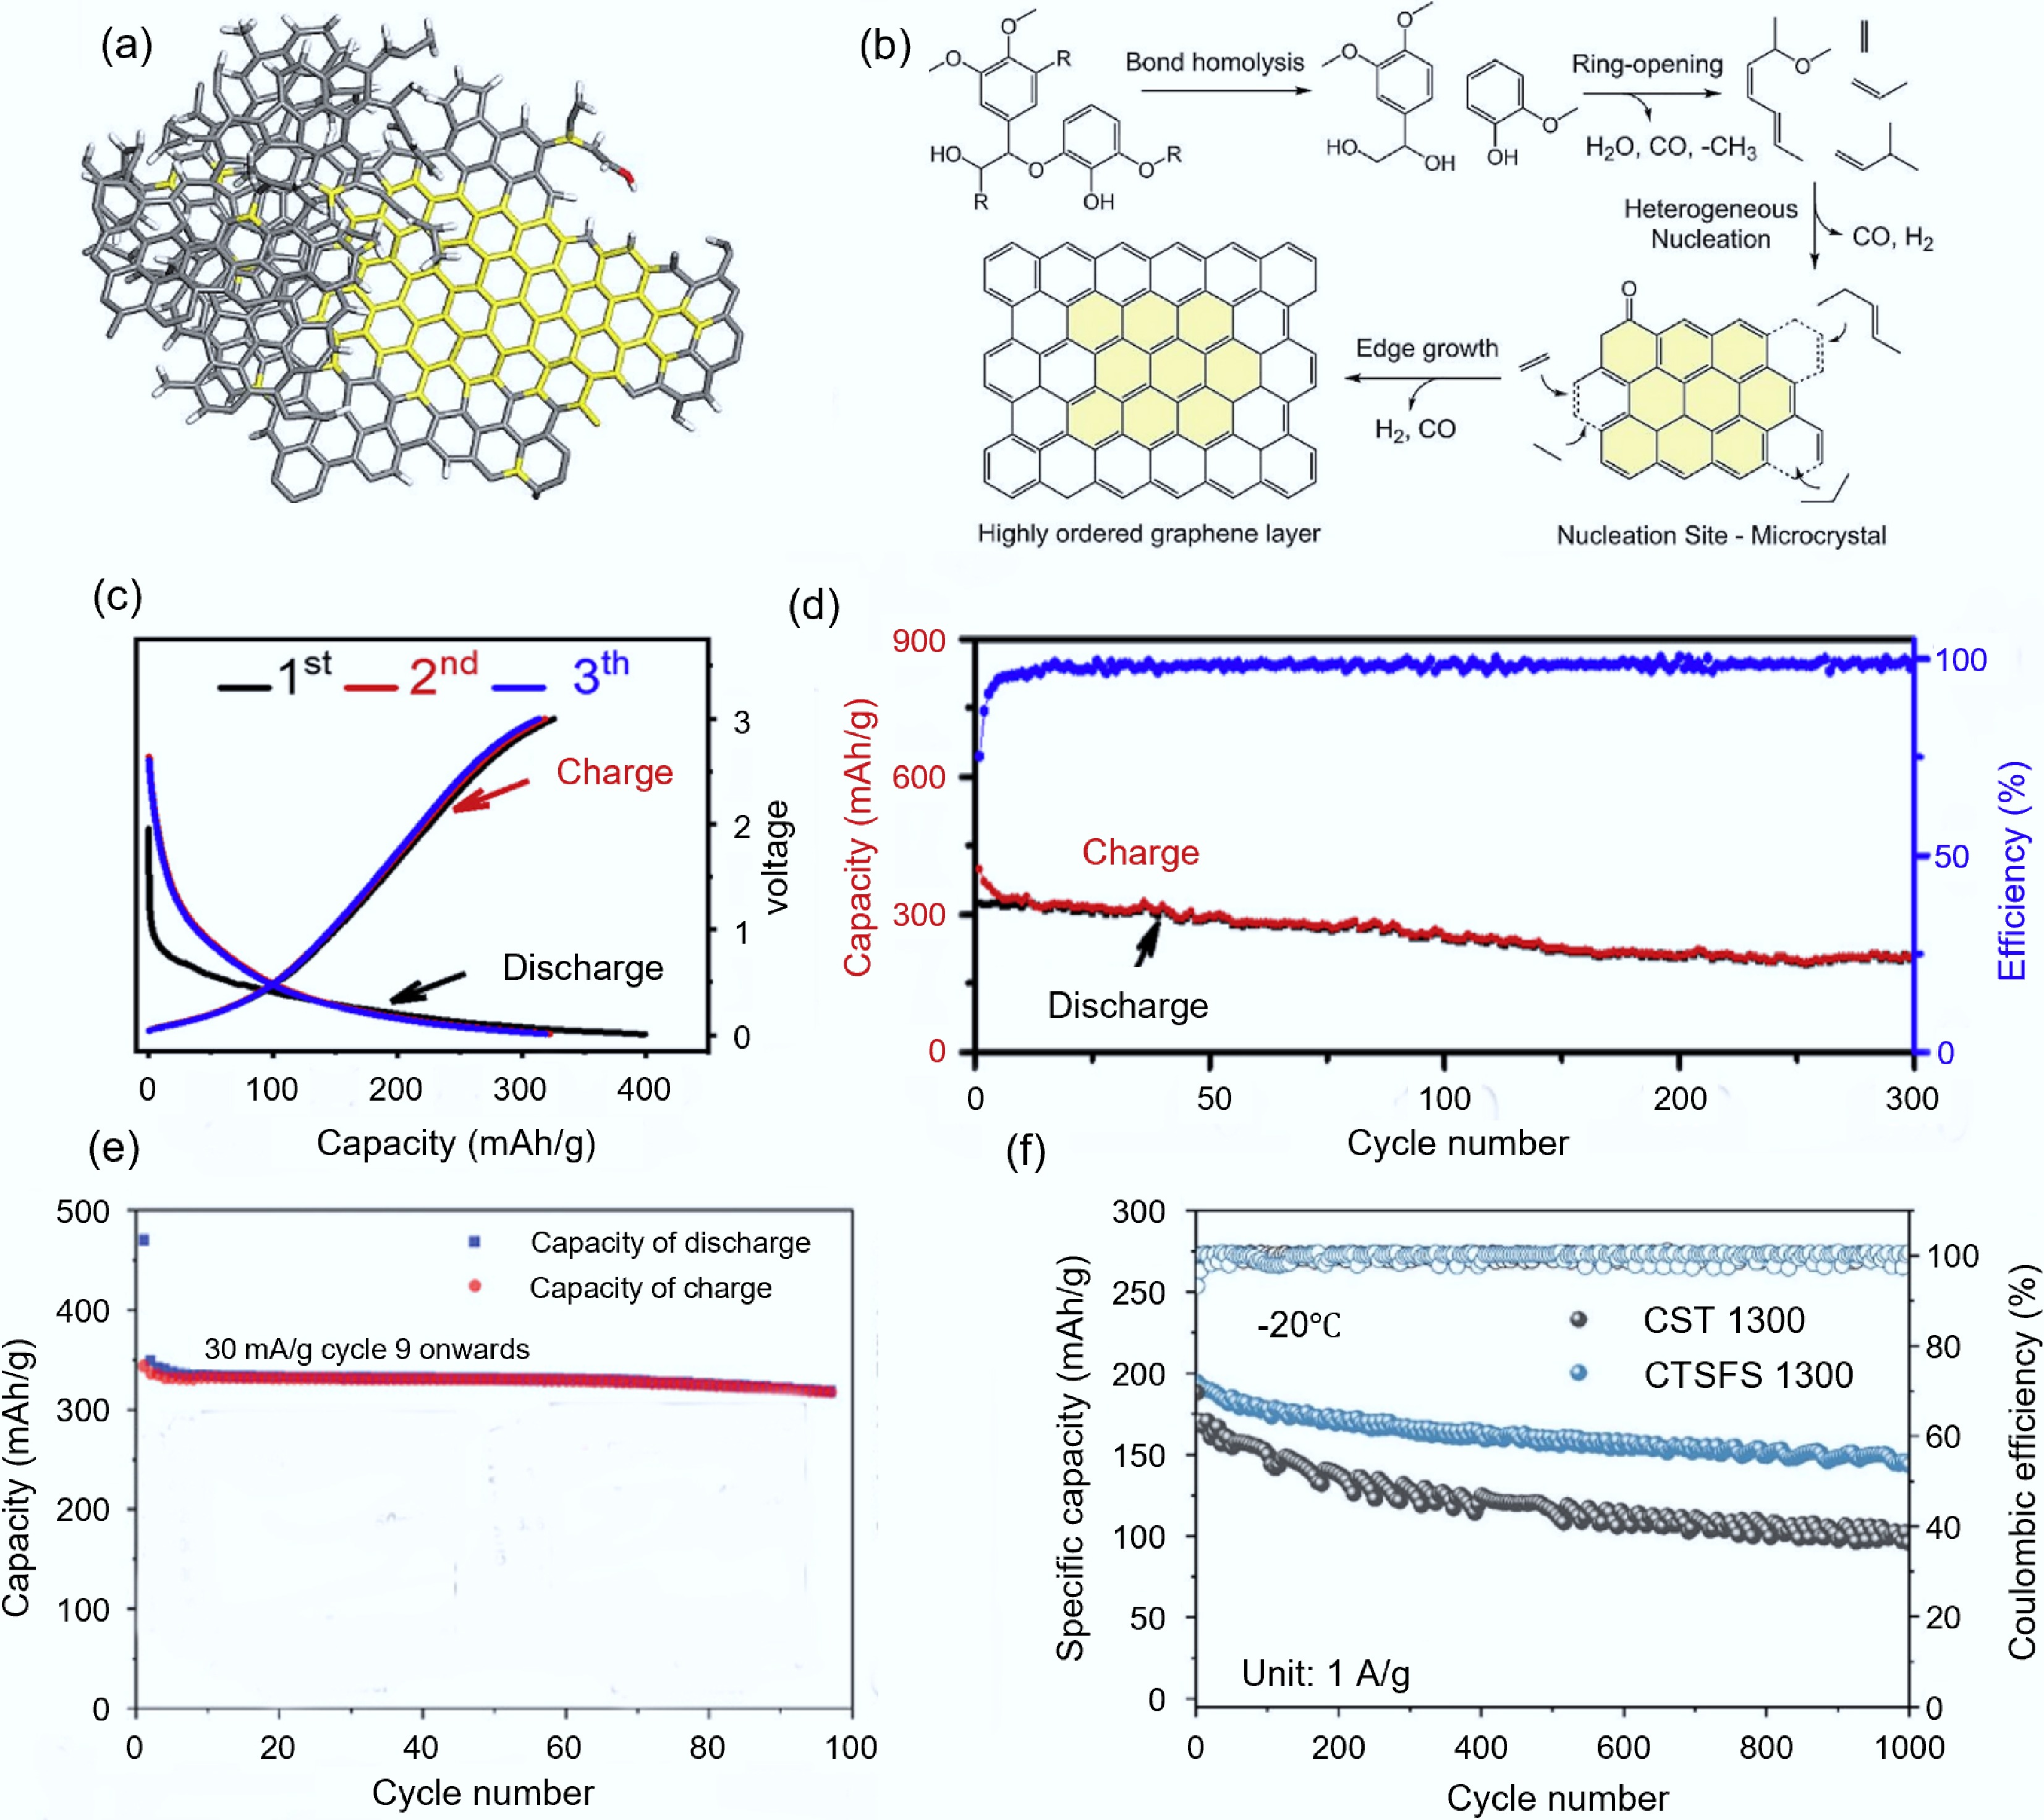
Figure 5.
Synthesis of carbon-based electrode materials from biomass via FJH. (a) Structure diagram of LFG[69]. (b) Mechanism of lignin graphitization[69]. (c) Cycling performance and Coulombic efficiency of LFG transformed from agricultural and forestry residues[72]. (d) Constant current charge-discharge curve of LFG materials[68]. (e) Constant current charge-discharge curve of GH materials[74]. (f) Cycling performance of CTS-1300 and CTSFS-1300 at −20 °C[76].
-
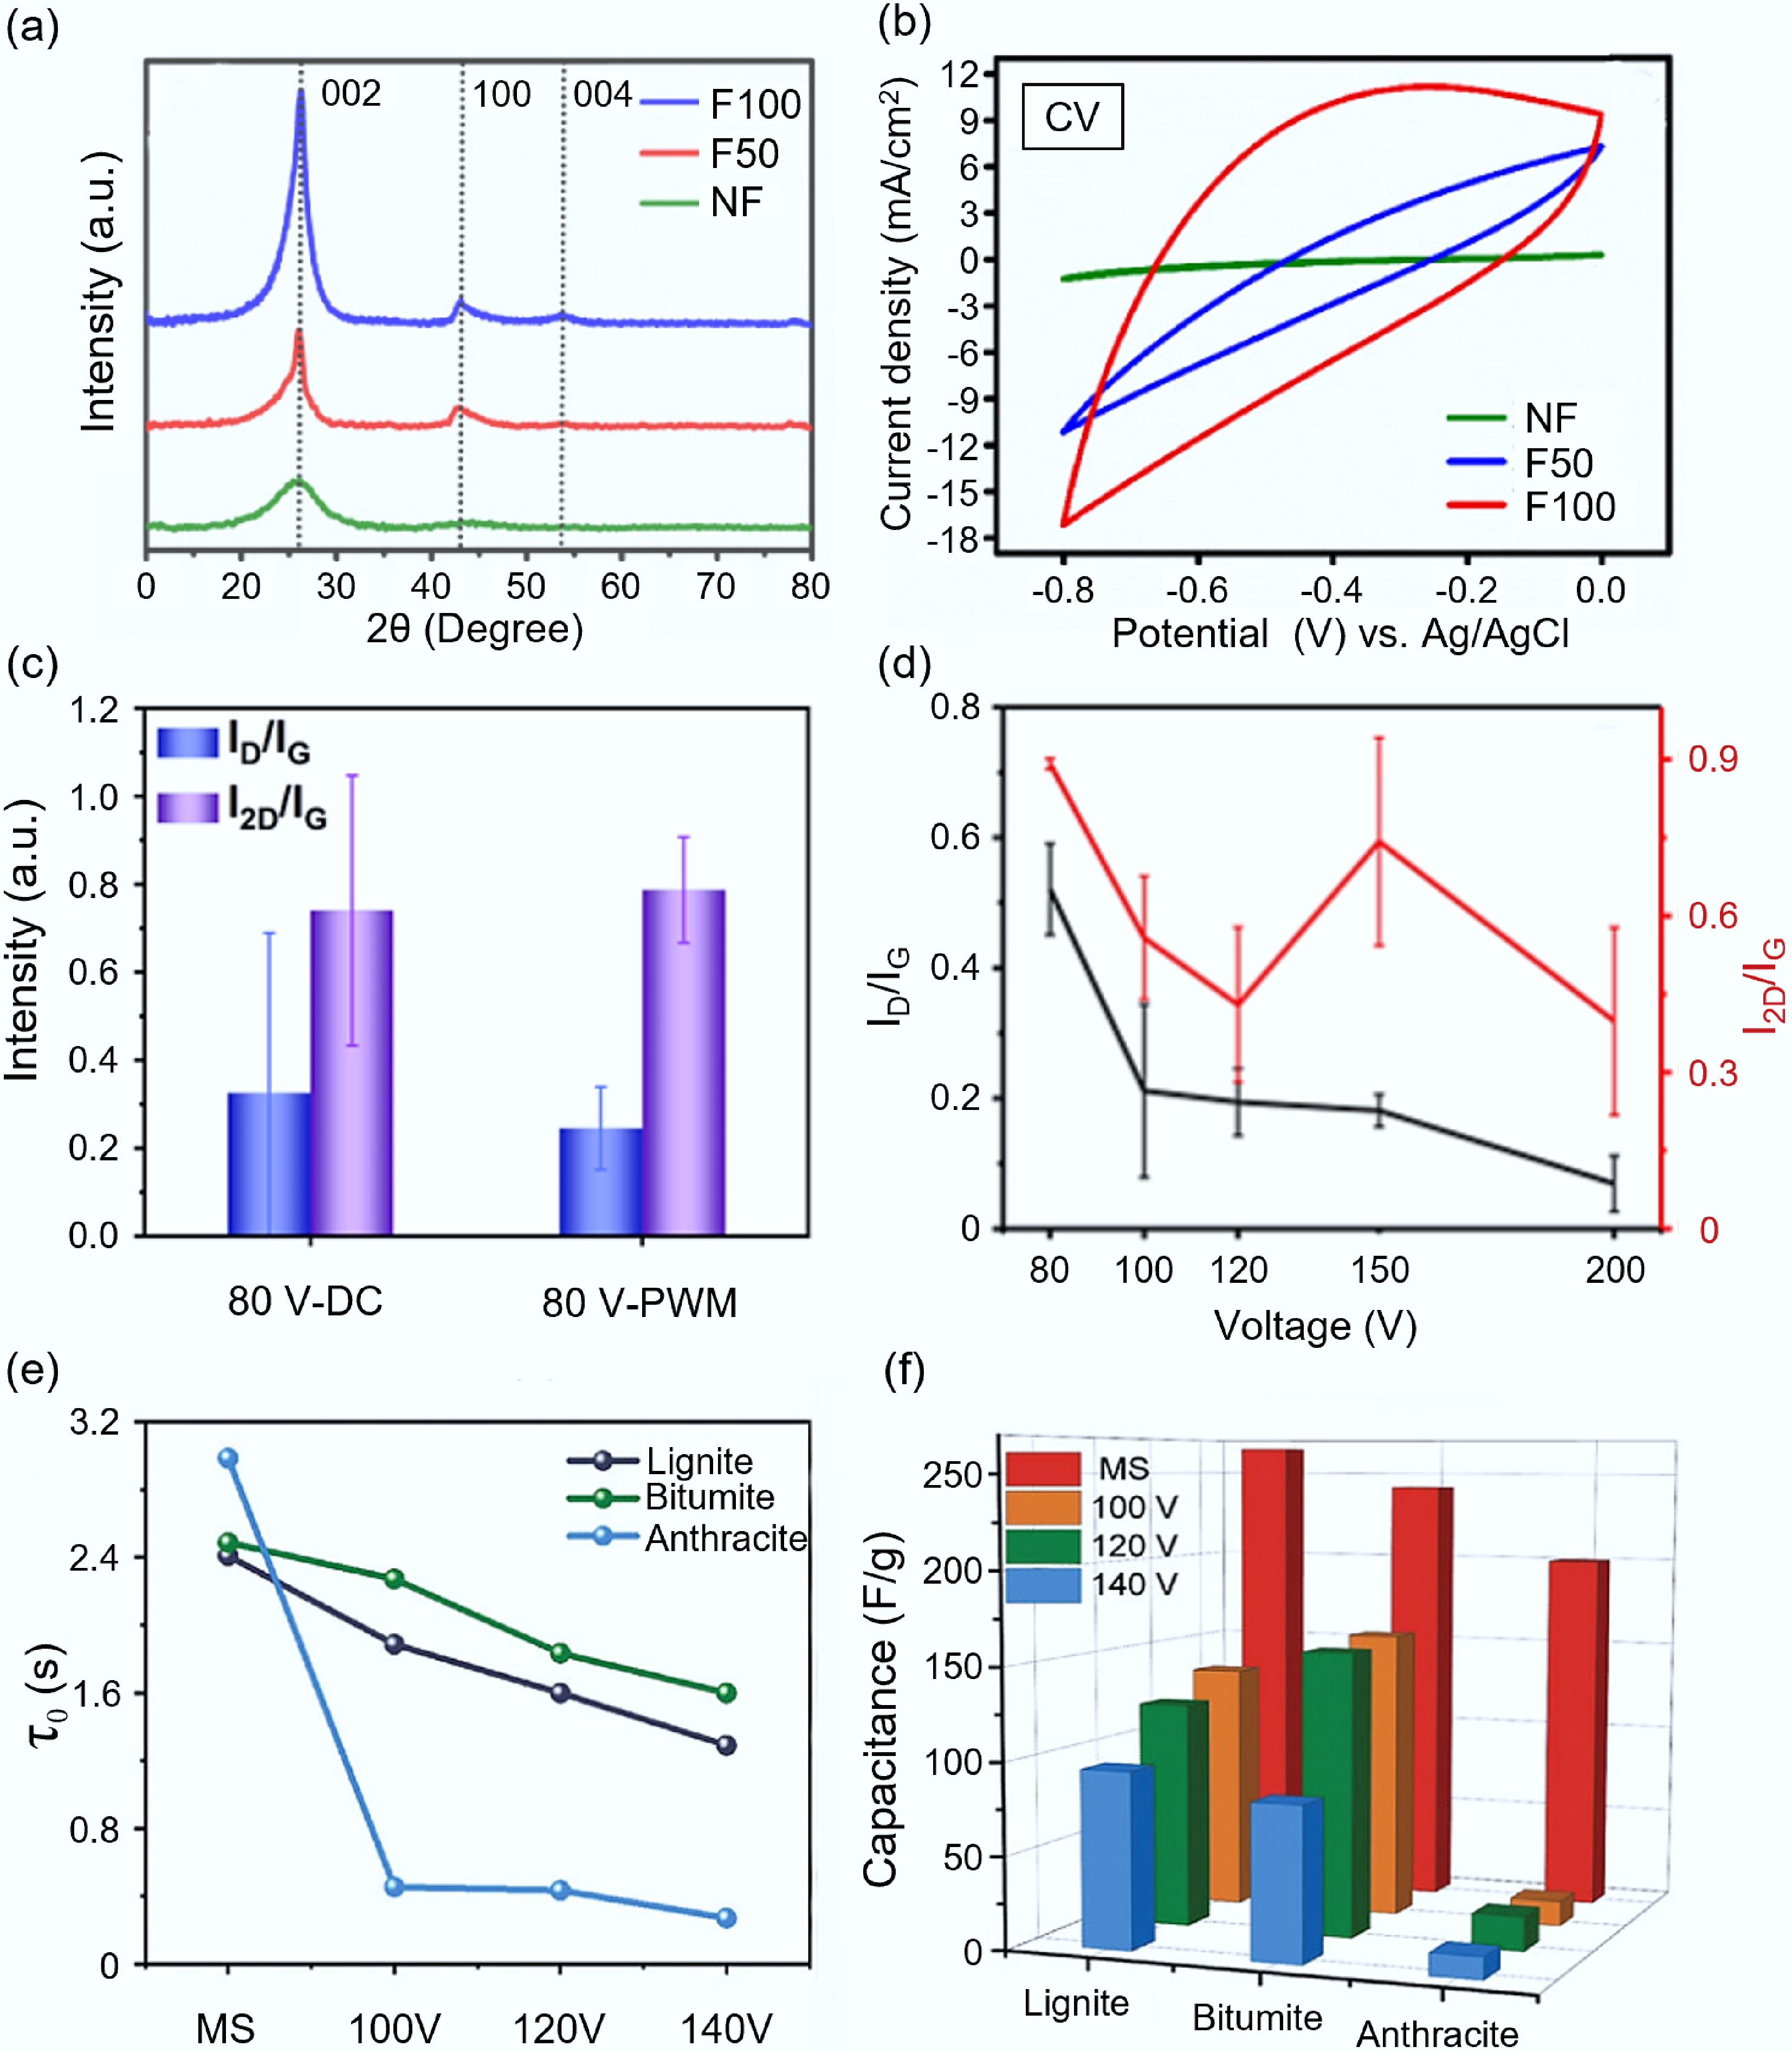
Figure 6.
The influence of electrical parameters on the synthesis of carbon-based electrode materials by FJH. (a) XRD patterns of graphene products under different voltages[77]. (b) CV curves of NF, F50, and F100 electrodes compared at 100 mV/s[77]. (c) The influence of PWM and DC on the structure of graphite products[79]. (d) The effect of flash voltage on the structure of carbon products[72]. (e) The impact of flash voltage on the relaxation time of carbon products[44]. (f) The influence of flash voltage on the specific capacitance of carbon products[44].
-
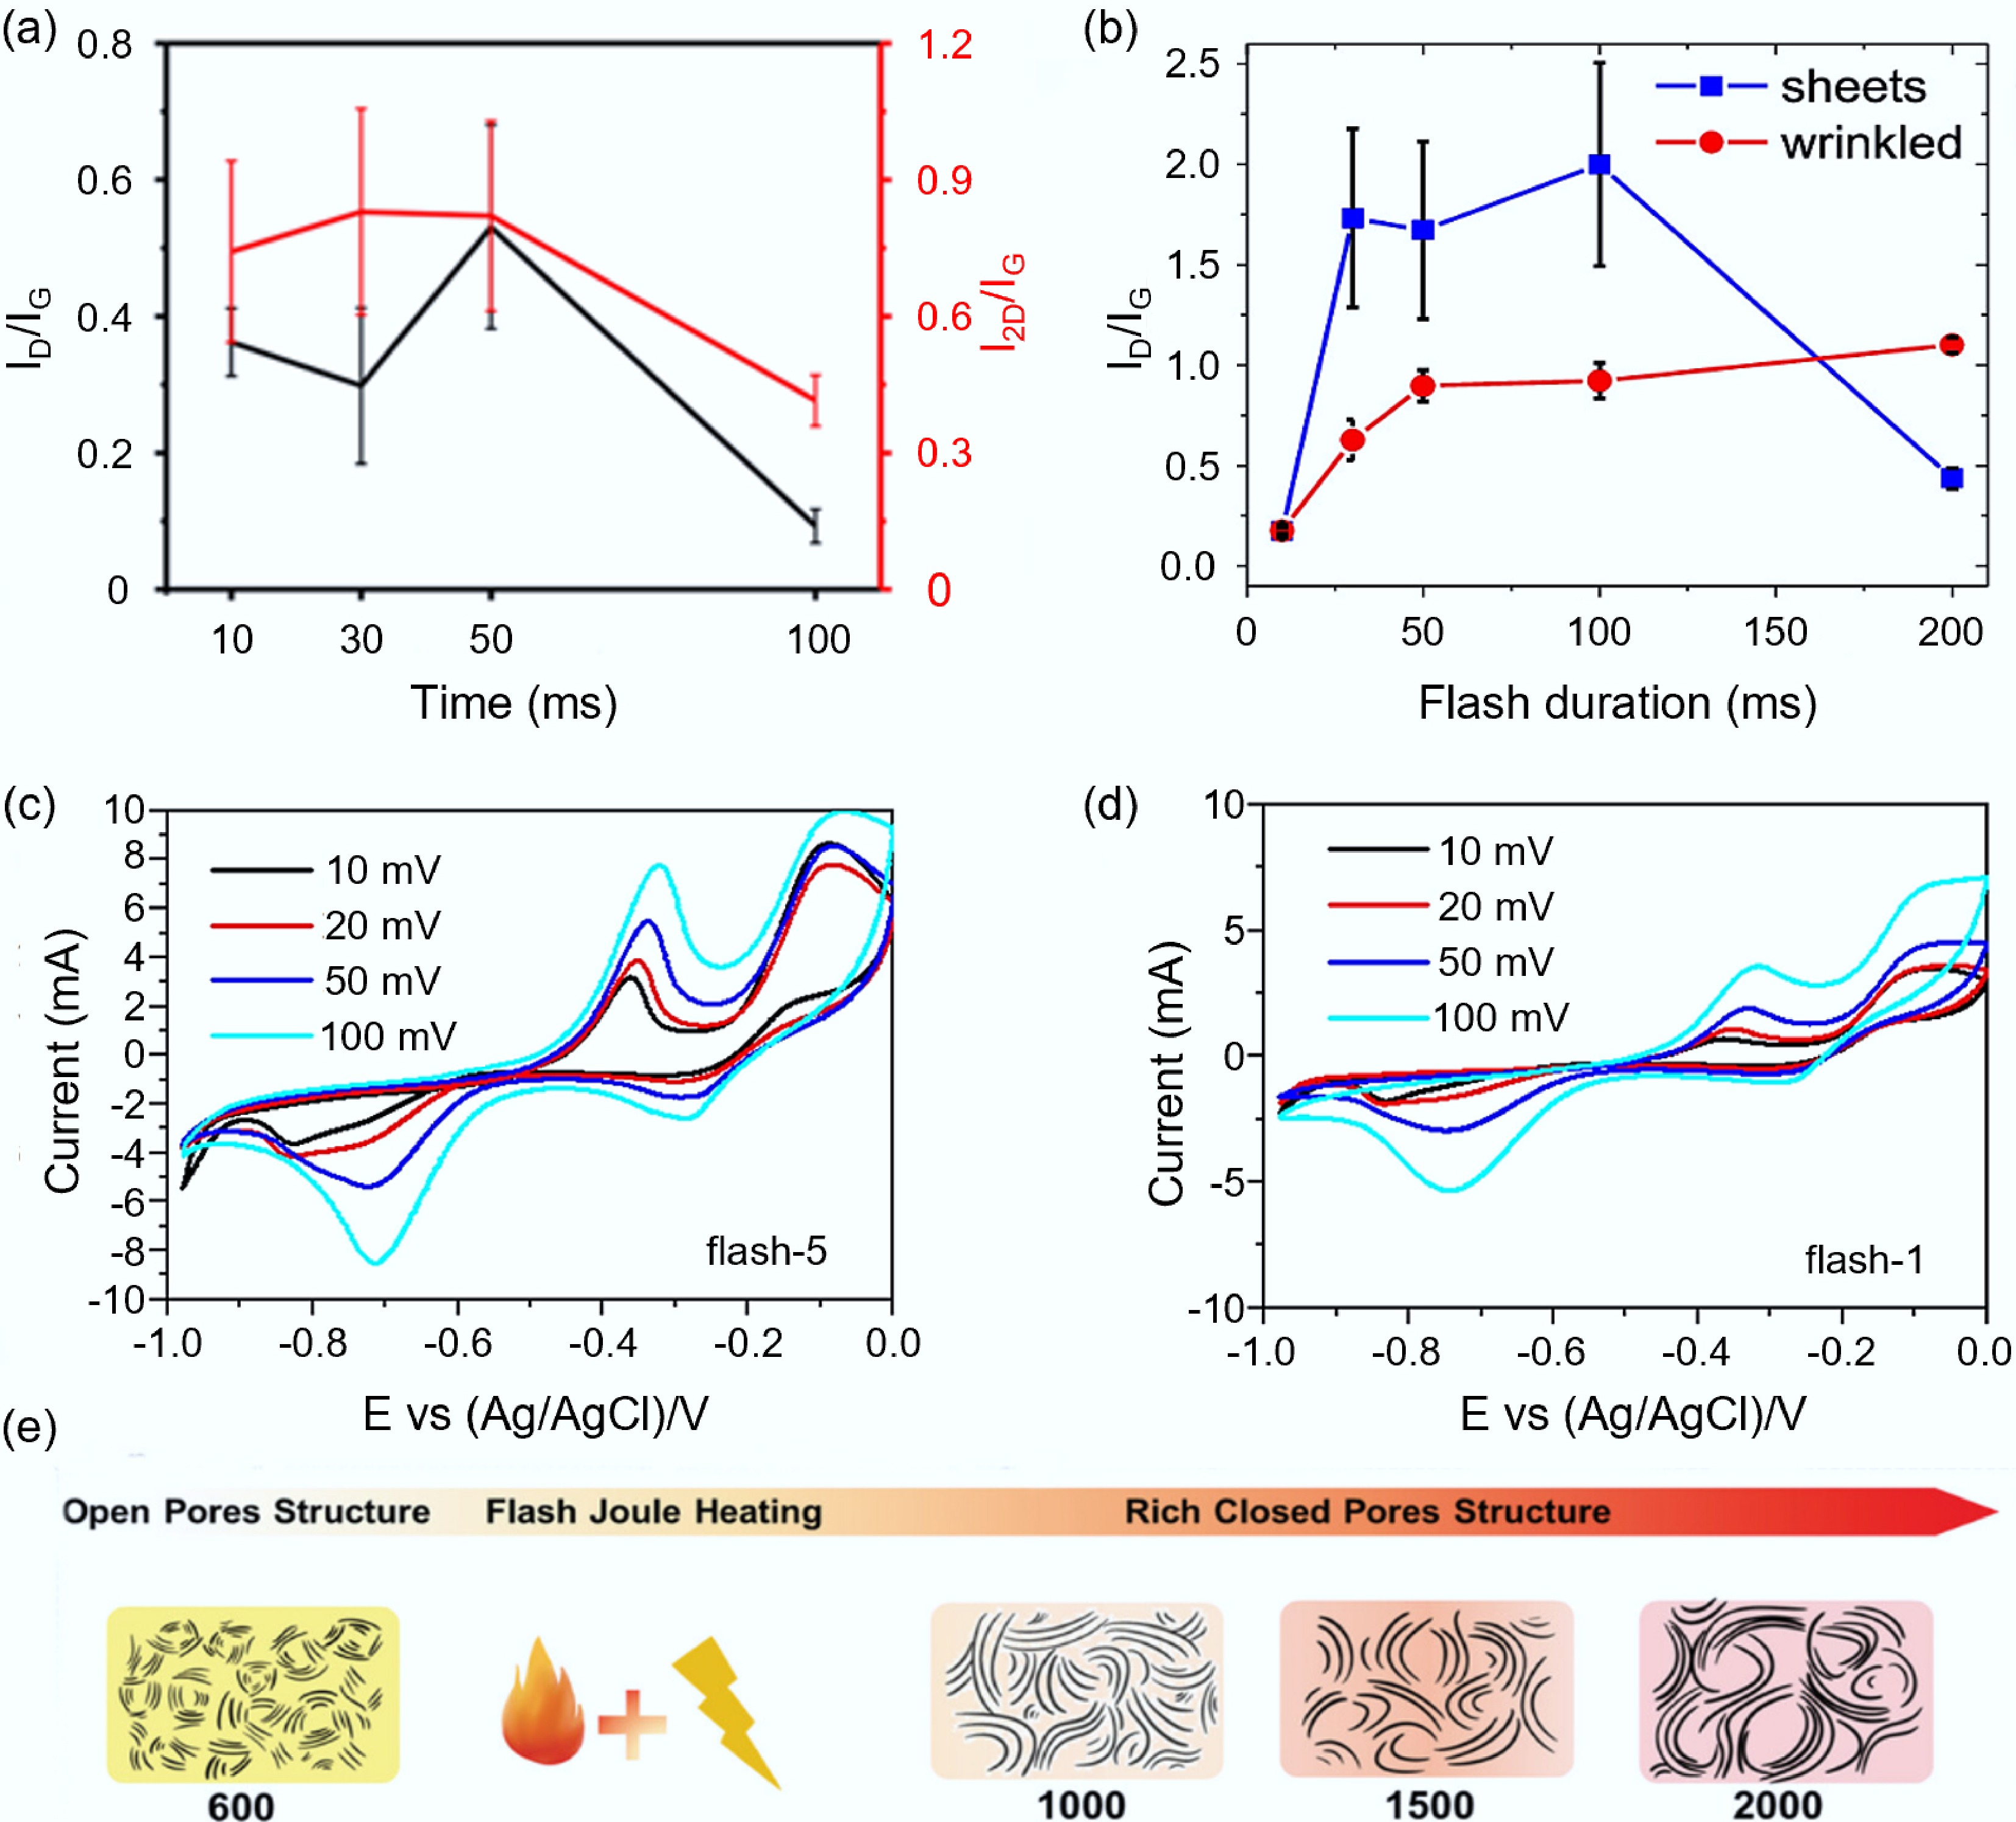
Figure 7.
Effects of temporal parameters and temperature on the synthesis of carbon-based electrode materials by FJH. (a) Influence of flash time on the structure of graphite products[72]. (b) Influence of flash time on the structural properties of tFG sheets and wrinkled graphene[81]. (c) CV curve of the carbon product after flash for only once[82]. (d) CV curve of the carbon product after flash for five times[82]. (e) The regulatory mechanism of FJH temperature on HC pores[85].
-
-
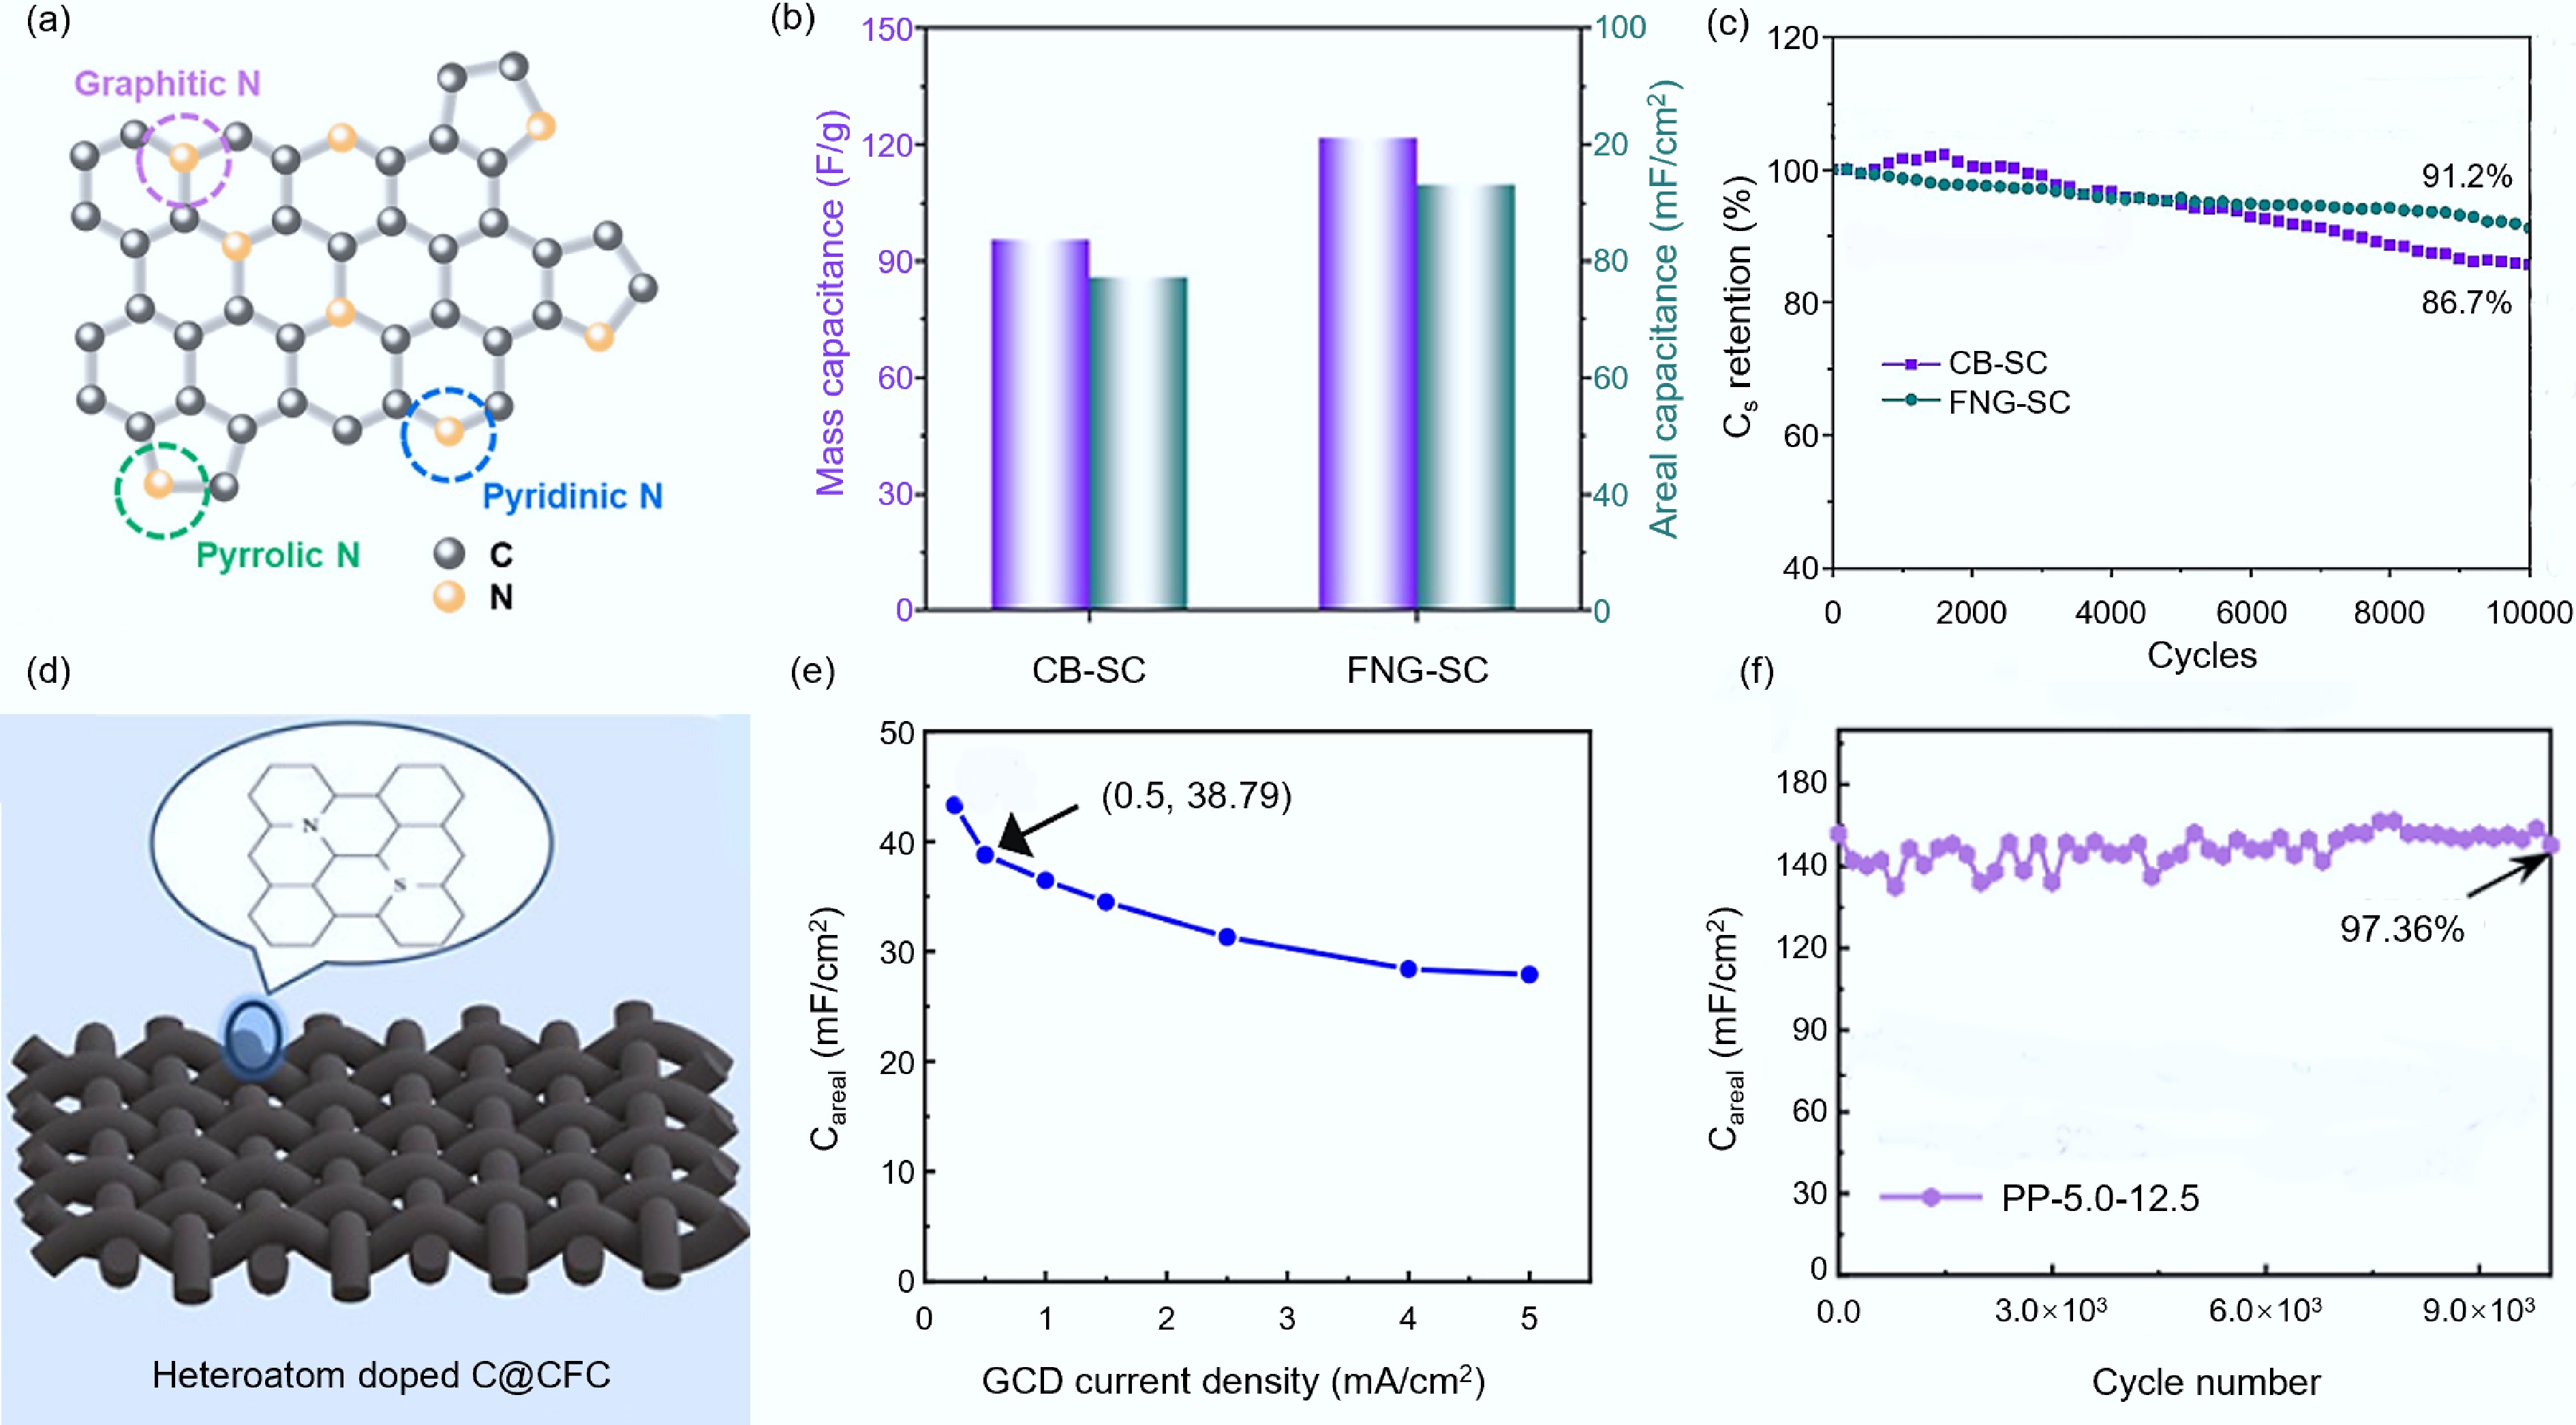
Figure 9.
Doping heteroatoms to enhance the quality of carbon materials. (a) Schematic diagram of nitrogen-doped carbon structure[93]. (b) Comparison of specific capacitance of symmetrical quasi-solid-state supercapacitors assembled by FNG and CB[93]. (c) Comparison of capacity retention rates of symmetrical quasi-solid-state supercapacitors assembled by FNG and CB[93]. (d) Simplified diagram of N-S co-doped carbon structure[101]. (e) Surface capacitance of the supercapacitor assembled with PP-5.0–12.5[101]. (f) Capacity retention rate of supercapacitors assembled with PP-5.0–12.5[101].
-
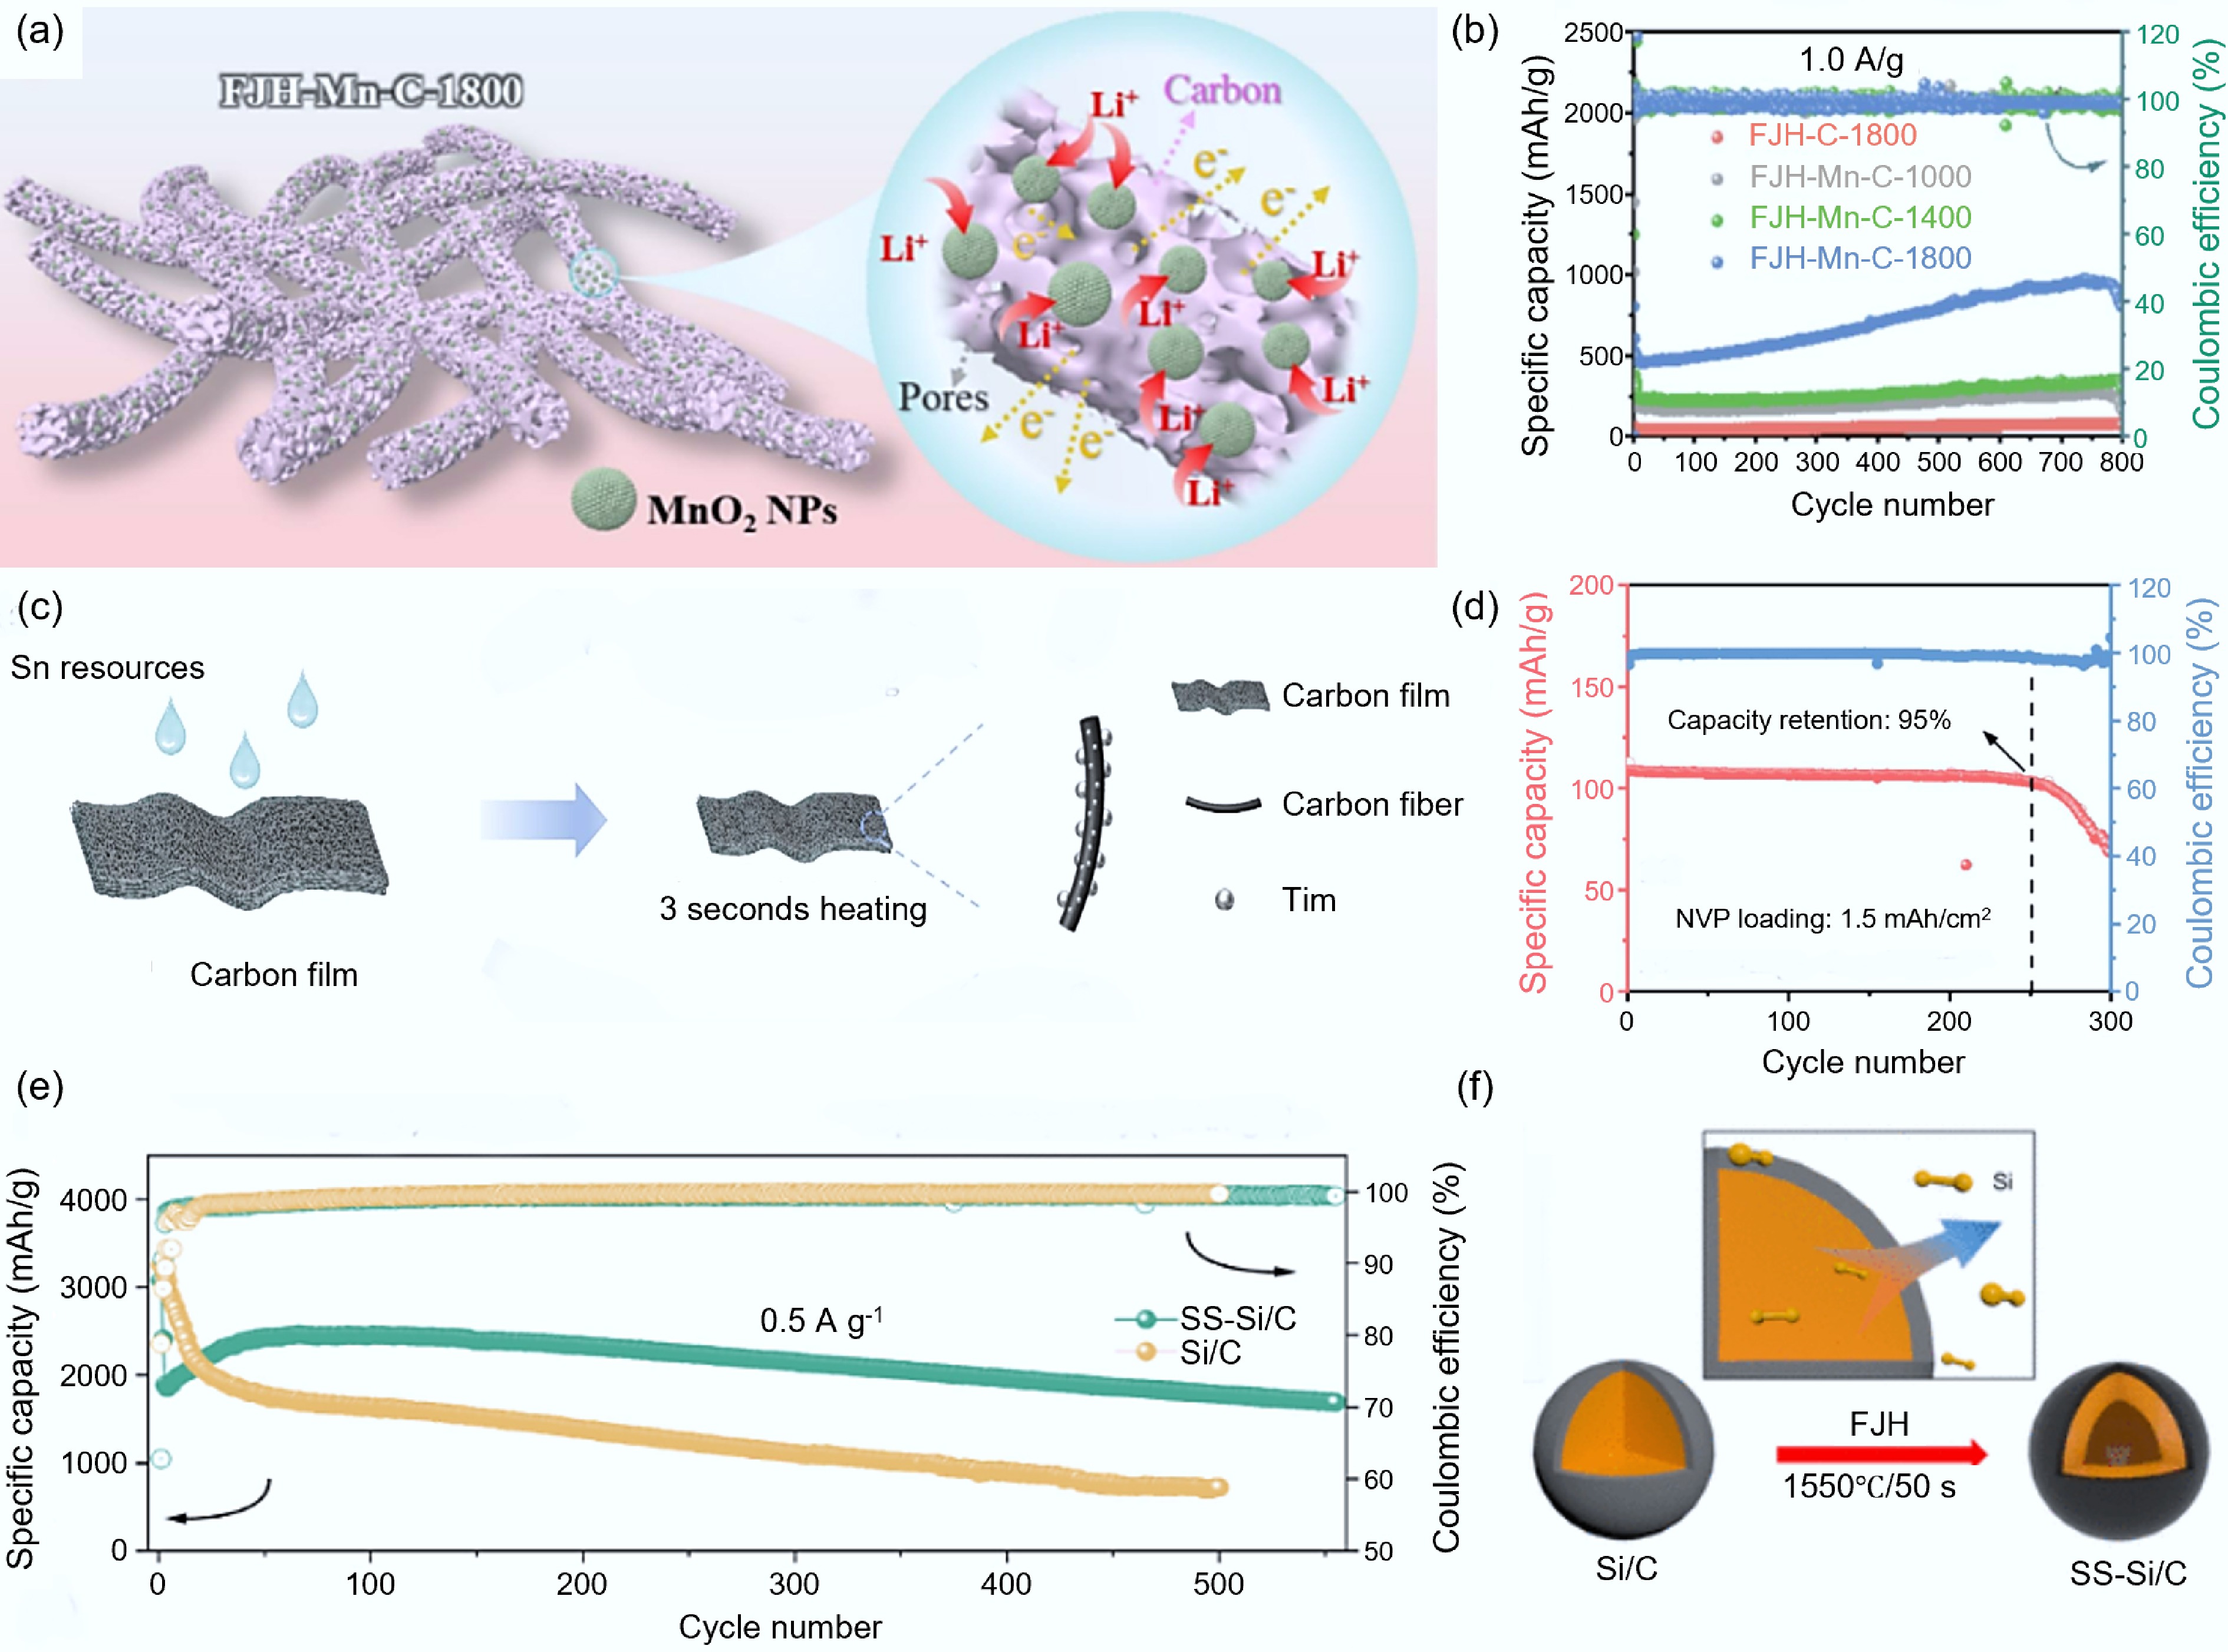
Figure 10.
Combination with metal and silicon-based materials. (a) Structural diagram of FJH-Mn-C[104]. (b) Electrochemical performance of FJH-Mn-C at different temperatures[104]. (c) Schematic diagram of the synthesis of J800-Sn/C[109]. (d) Electrochemical performance of J800-Sn/C[109]. (e) Comparison of electrochemical performance between SS-Si/C and Si/C[111]. (f) Schematic diagram of the synthesis of SS-Si/C[111].
-
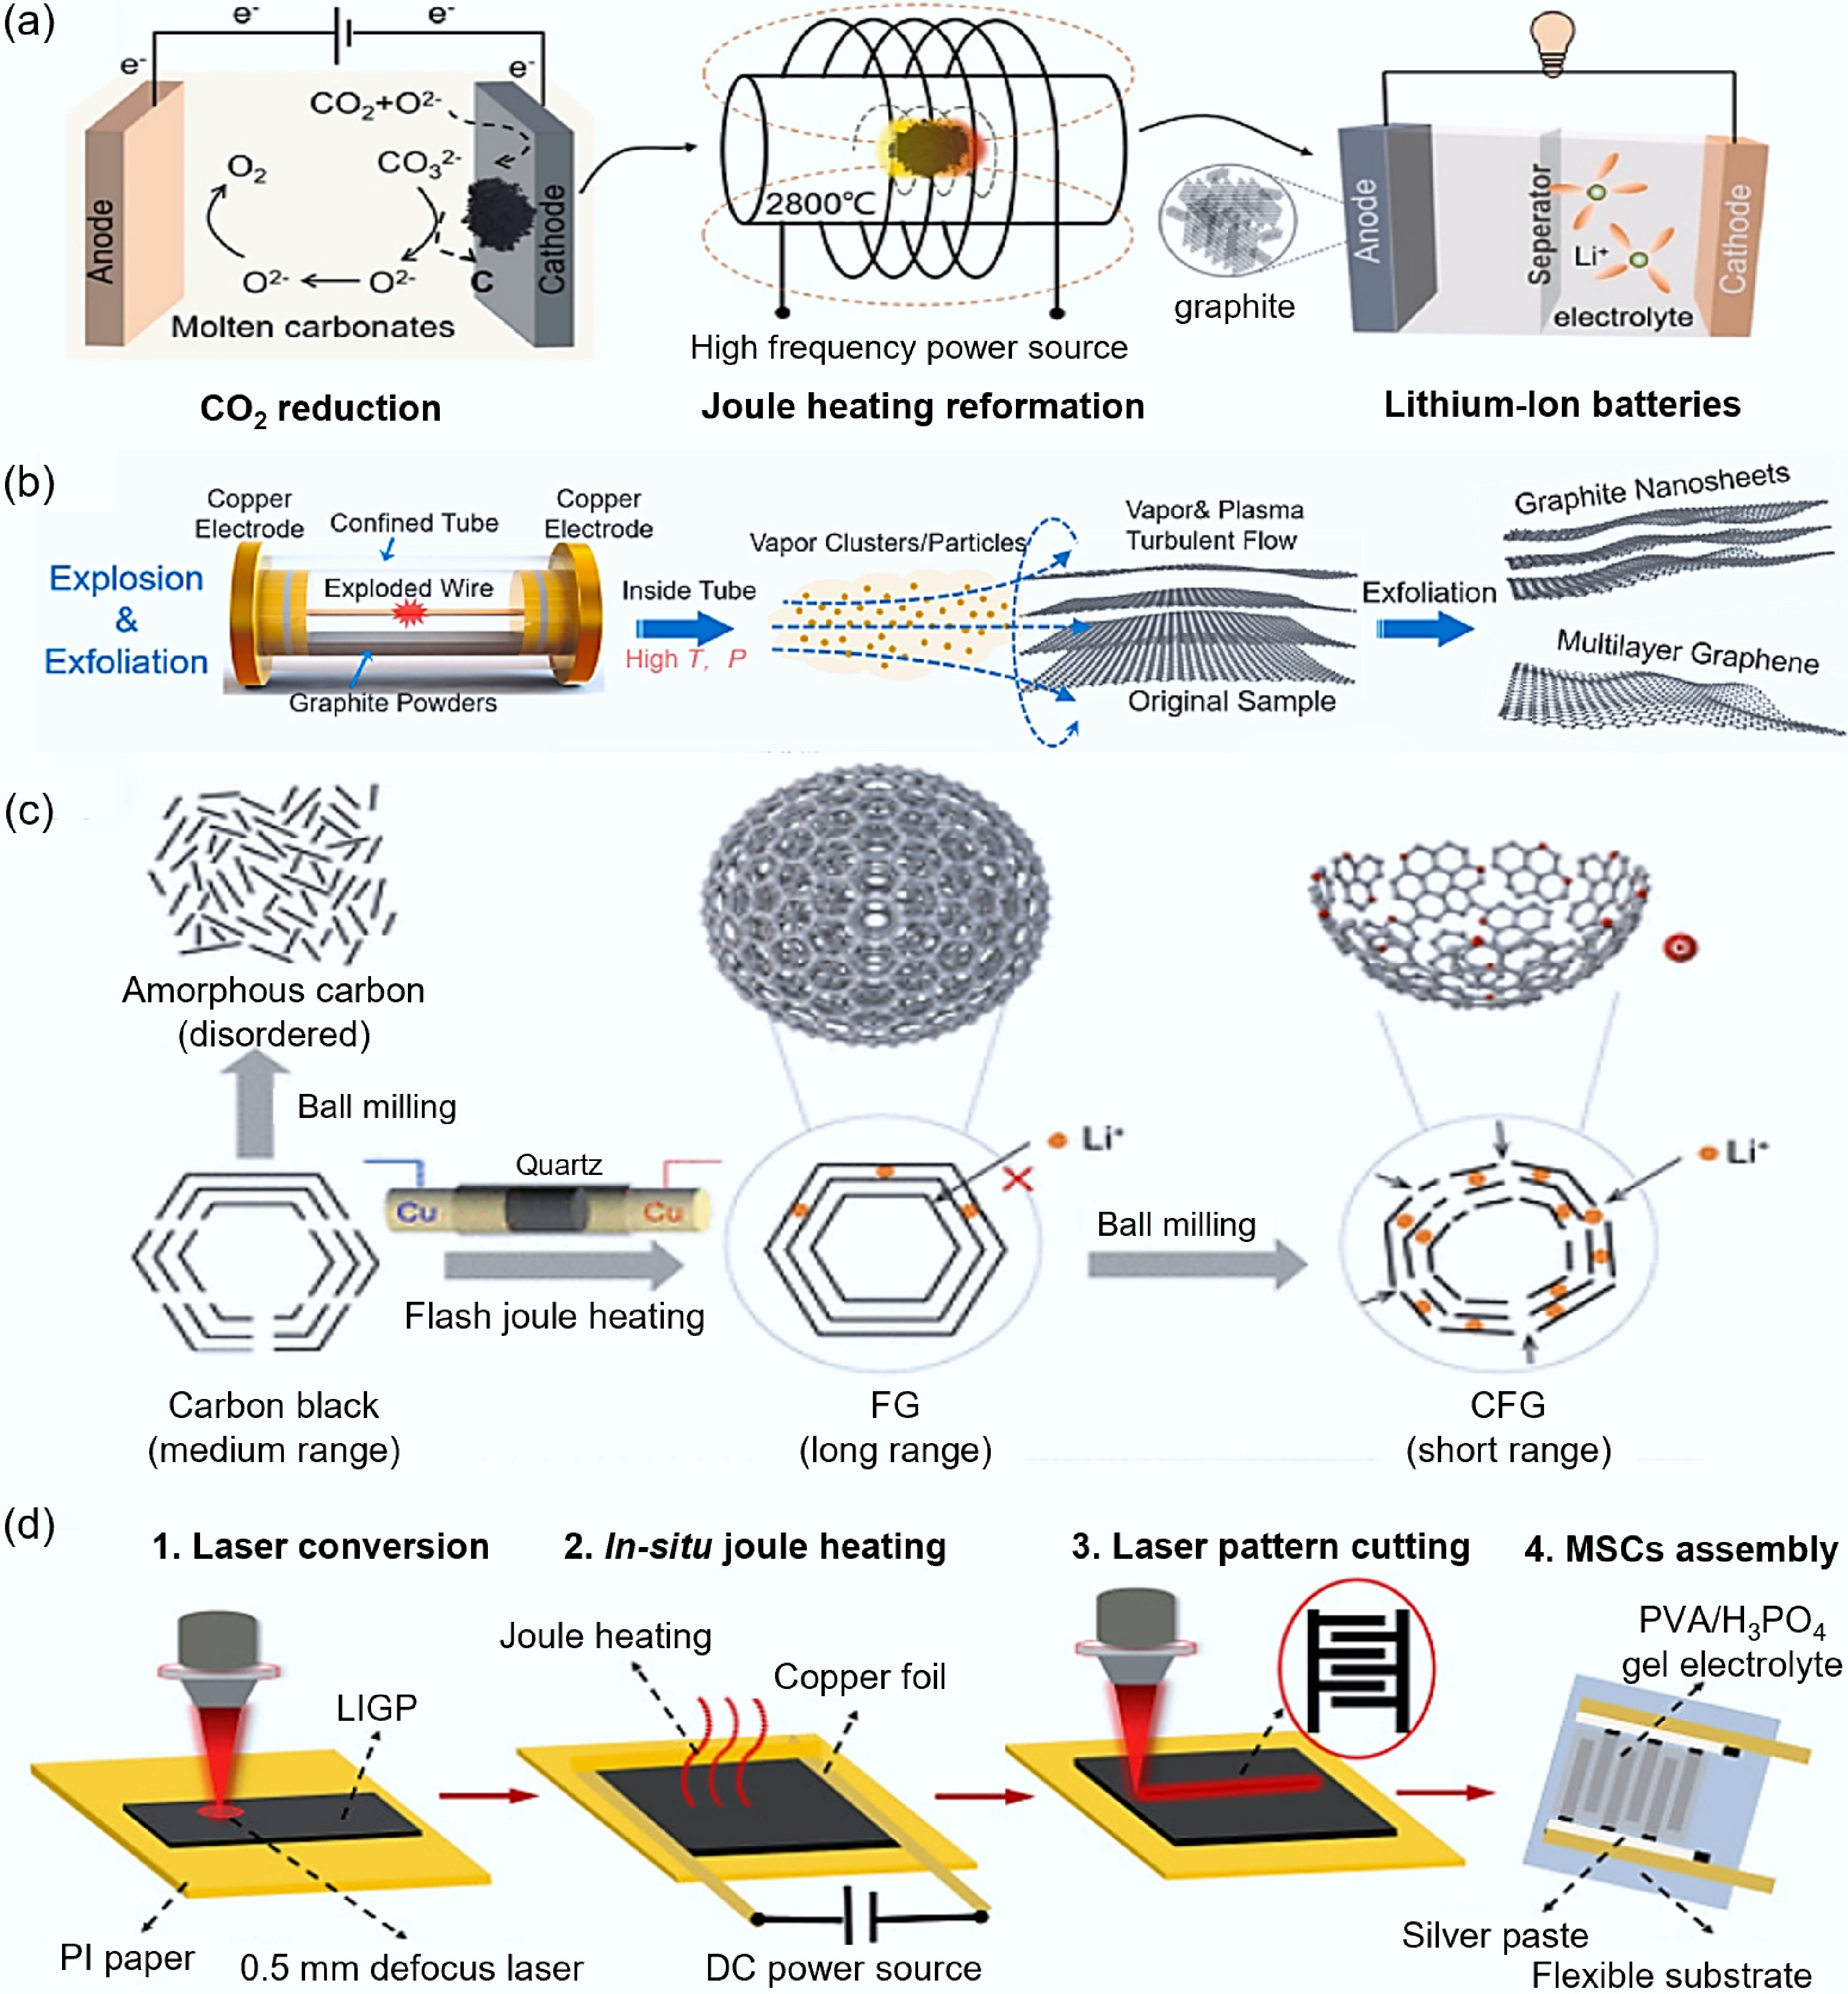
Figure 11.
Coupling other technologies with FJH. (a) Schematic diagram of FJH combined with molten salt electrolysis of carbon dioxide[114]. (b) Schematic diagram of steam activation assisting FJH[115]. (c) Schematic diagram of graphite technology assisting FJH[116]. (d) Schematic diagram of laser-induced assisting FJH[117].
-
Carbon source Parameter conditions Key structural characteristics
of the productElectrochemical performance
of the productApplication Ref. Asphalt ~3,000 K 3–5 × 10⁵/1 × 104 K/s
Capacitor 160 V, ~1 sd(002) = 3.71 Å, ID/IG = 0.2 Specific capacitance: 210 F/g (1 A/g) SC [41] Bitumite ~3,000 K 8.5 × 10⁴/8 × 103 K/s
Capacitor 100 V, ~1 sd(002) = 3.38 Å, ID/IG = 1.15
surface area: ~620 m2/g
Porosity rate: ~70%Specific capacitance: 136 F/g (1 A/g) SIB [44] Lignite ~3,000 K 8.5 × 10⁴/8 × 103 K/s
Capacitor 140 V, ~1 sd(002) = 3.43 Å, ID/IG = 1.15
surface area: ~450 m2/g
Porosity rate: ~60%Specific capacitance: 95.4 F/g (1 A/g) SIB [44] Anthracite ~1,573 K —/—
DC 42.5A, ~20 sd(002)= 3.789 Å, ID/IG = 1.09
surface area: ~8.01m2/g
Pore volume: 0.018 cm3/gReversible capacity: 256.2 mAh/g capacitance retention rate: 93.2%
after 200 cycles.SIB [45] Anthracite ~1,073 K —/—
Capacitor 150 V, ~0.1 sd(002) = 3.42 Å, ID/IG= 0.94
surface area: ~9 m2/gReversible capacity: 209 mAh/g
(0.05 A/g), with no significant degradation after 500 cyclesSIB [46] Plastic ~2,500 K —/—
Current increased from 0.1 A to 25 A, 50 s
Capacitor 100 V, 0.25 sd(002) = 3.56 Å, ID/IG =0.61
surface area: ~874m2/gDuring the 20-h long-cycle test, overpotential increased by only 19 mV (20 mA/cm²) LIB [55] Waste anode 2,850 K 1.6 × 10⁵/9.2 × 103 K/s
Capacitor 200 V, 0.1 sd(002) = 3.35 Å, ID/IG =0.14
surface area: ~15.4 m2/gCapacitance: 131.1 mAh/g (0.2 C) LIB [60] Waste anode ~3,000 K —/—
Capacitor 200 V, 0.1 sd(002) = 3.389 Å, ID/IG = 0.103
surface area: ~68.345 m2/gCapacitance: 350 mAh/g (1 C)
Capacitance retention rate: ~99% after 500 cyclesLIB [62] Sawdust ~3,100 K —/—
AC 200 V, 6 s; DC
150 V, 0.03 sd(002) = 3.45 Å, ID/IG = 0.2
surface area: ~53 m2/gCapacitance: 280 mAh/g (1 C)
Capacitance retention rate: ~90% after 200 cyclesSC [72] Hair ~1,673 K —/—
Capacitor 400 V, 0.15 sd(002) = 3.357 Å, ID/IG = 0.2
Surface area: ~13.107 m2/g
Pore volume: 0.018 cm3/gCapacitance: 500 mAh/g (0.1 C) LIB [74] Chitosan ~1,573 K —/—
DC 40 A, 1 sd(002) = 3.83 Å, ID/IG = 1.13
Surface area: ~7.33 m2/gDuring low-temperature test, at −20 °C, Reversible capacitance:149 mAh/g, after 1,000 cycles SIB [76] Table 1.
Synthesis of carbon-based electrode materials from different raw materials via FJH
-
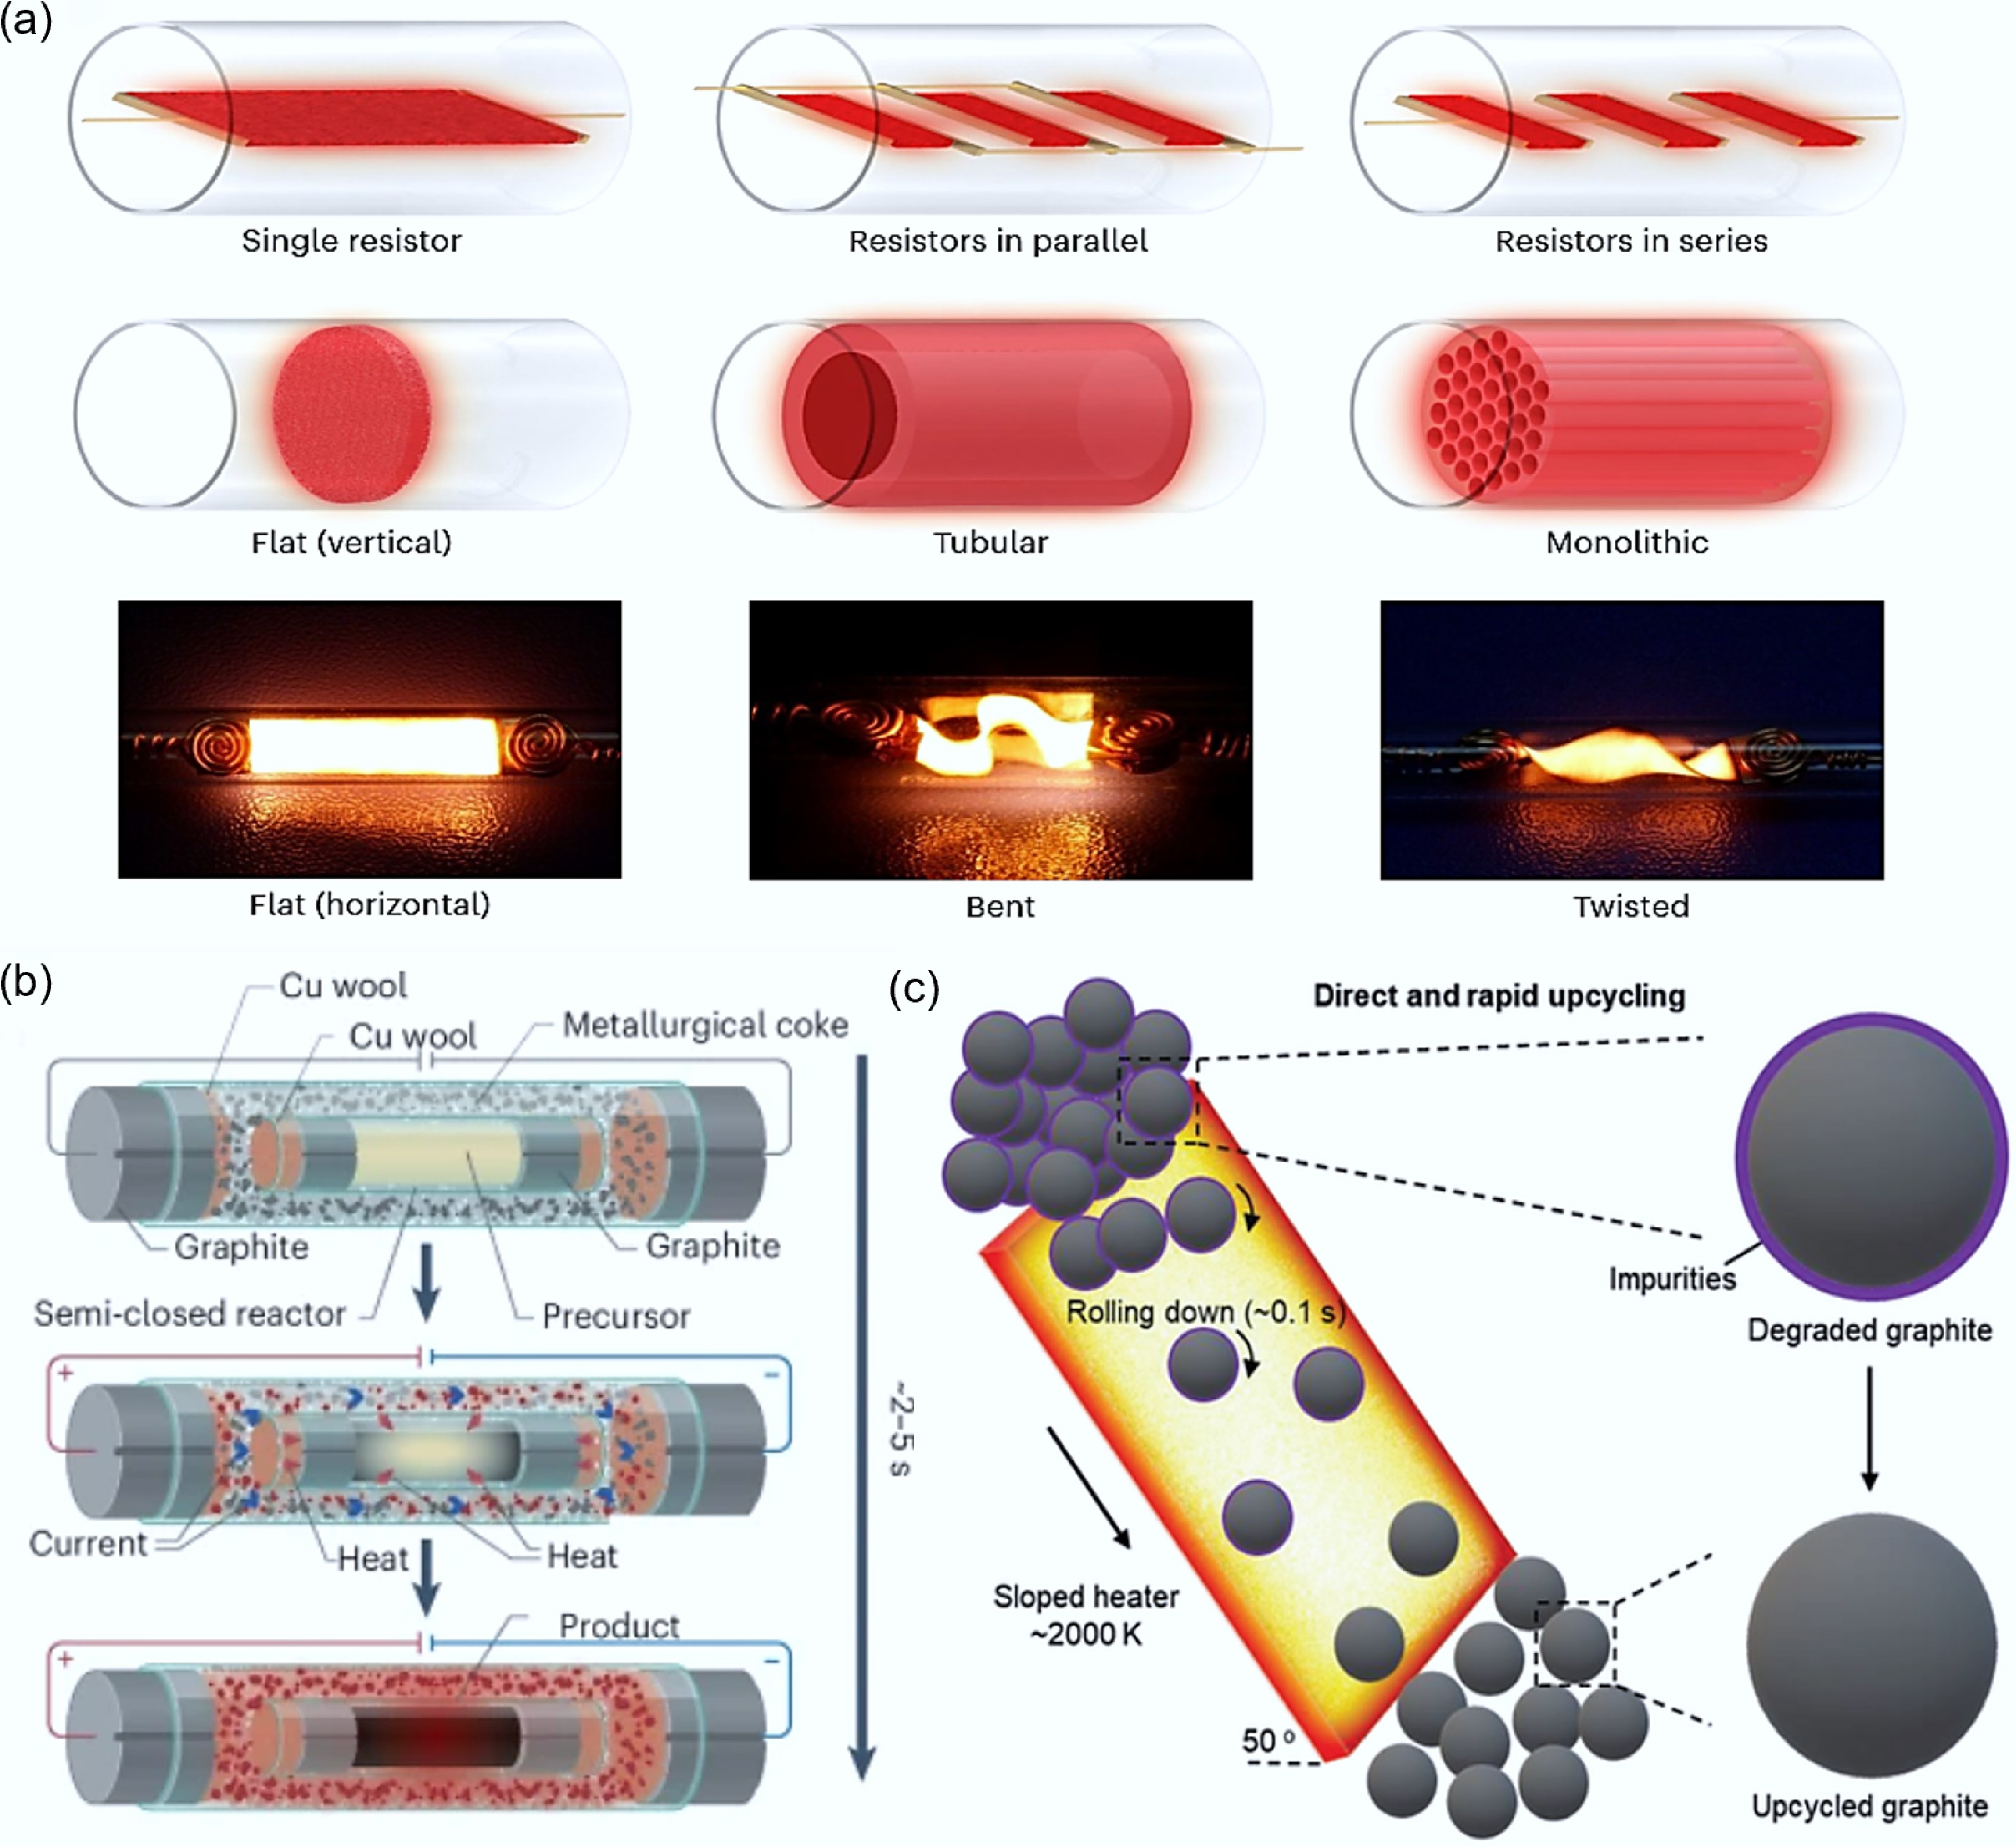
Heater design Advantages Drawbacks Applicable scene Single-panel Easy to set up and with quick heat
responseInsufficient heat supply Rapid characterization of the reaction results Series Greater heat supply and uniform temperature distribution High requirements for component consistency and the risk of overheating Reactions with high requirements for temperature conditions Parallel The power supply voltage requirement is low and the components are independent of each other. The heat transfer is unstable and the temperature field is unevenly distributed. Parallel processing of multiple samples or investigation of the effects of different parameters Monolithic High heat transfer efficiency and flexible catalyst loading The complexity of the processing technology and the design cost Large-scale continuous production Bent/Twisted High heat conduction efficiency The risk of local overheating Reactions with high requirements for temperature conditions Table 2.
Comparison of heat transfer and mass transfer effects of different types of heaters
Figures
(11)
Tables
(2)