-
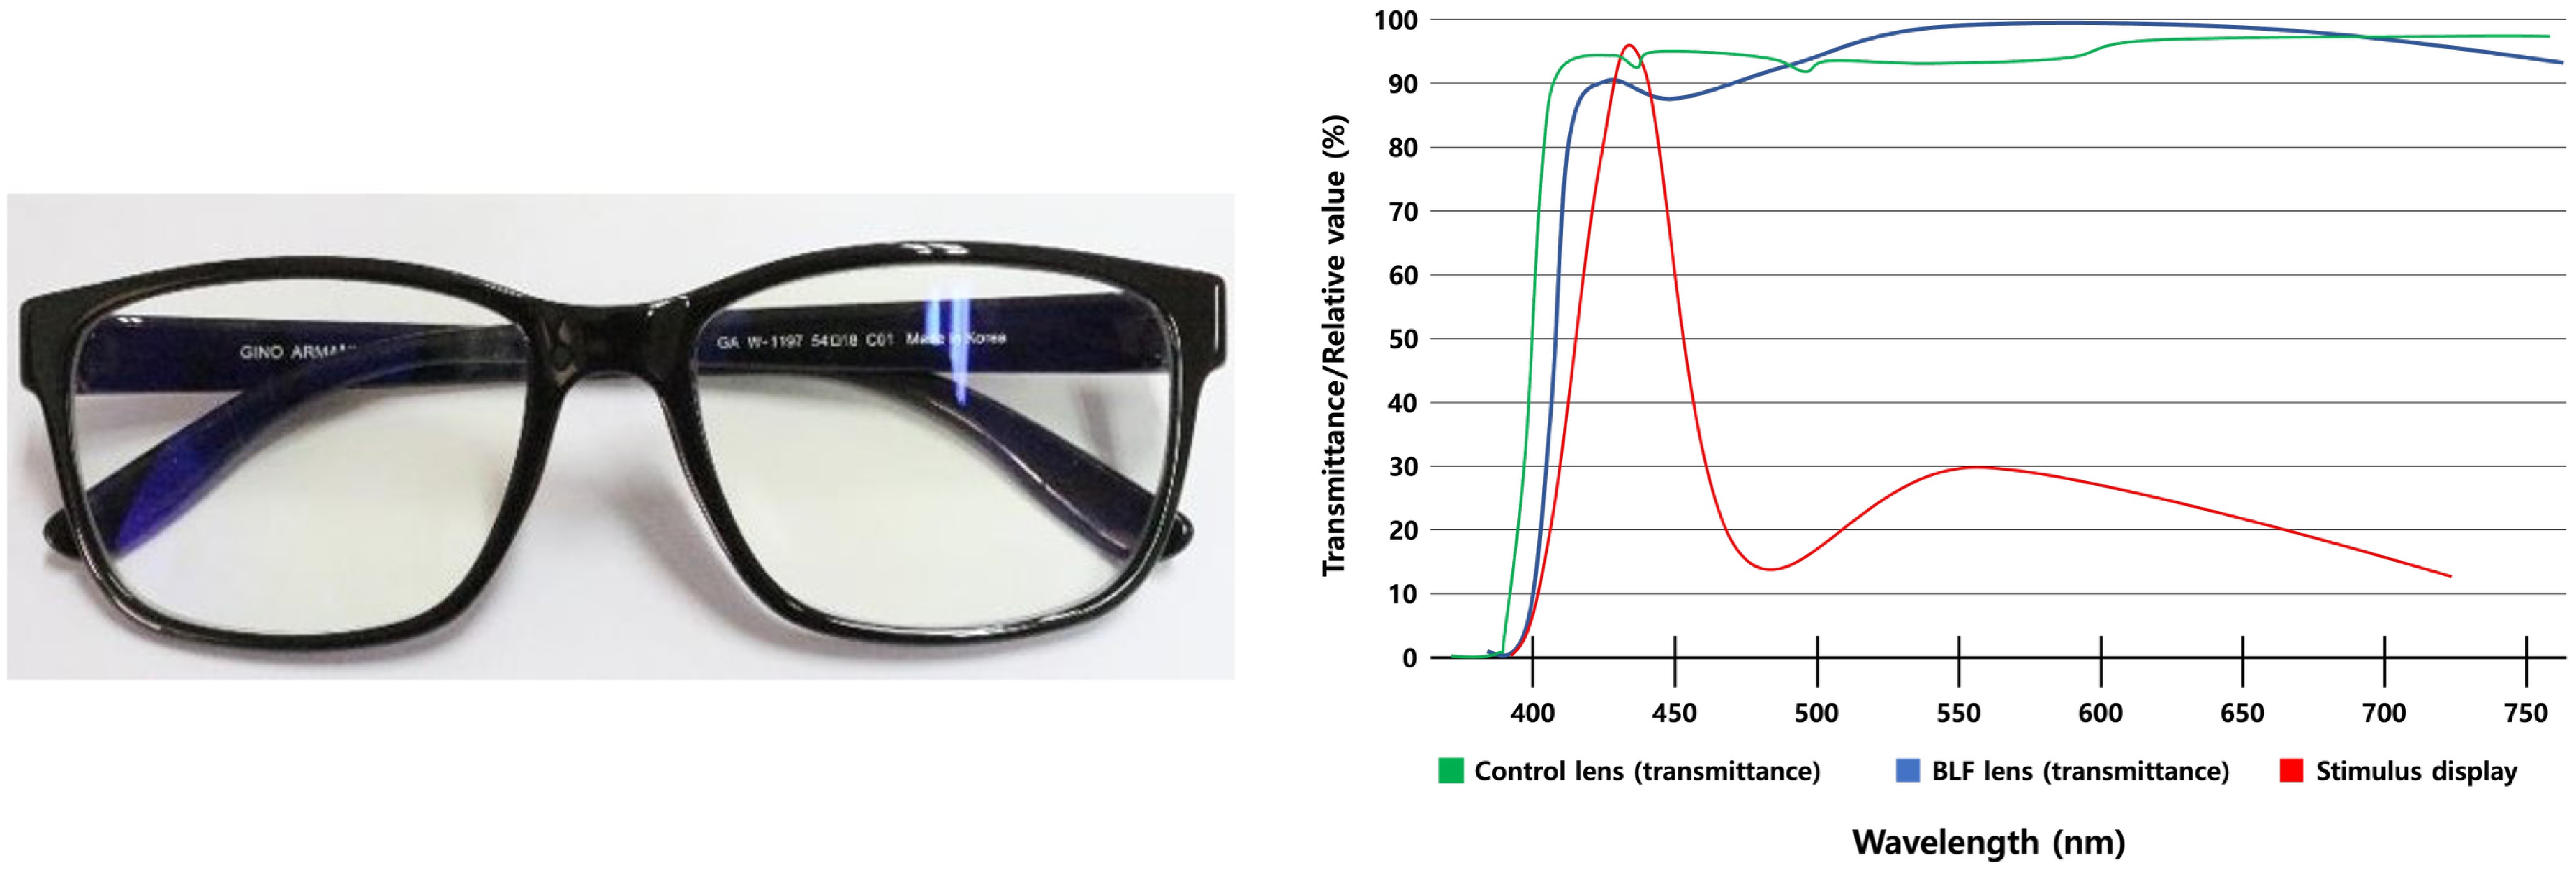
Figure 1.
Blue-light filtering (BLF) spectacles and optical characteristics of the BLF lens and stimulus display. Each participant was fitted with a BLF lens (shown on the left). The spectral transmittance of the BLF lens (blue curve), control lens (green), and the relative spectral output of the stimulus display (red curve), are plotted as percentages of maximum values. Spectral measurements were measured using a spectrophotometer (OPTIZEN 2120UV, Korea,
english.mecasys.co.kr ). -
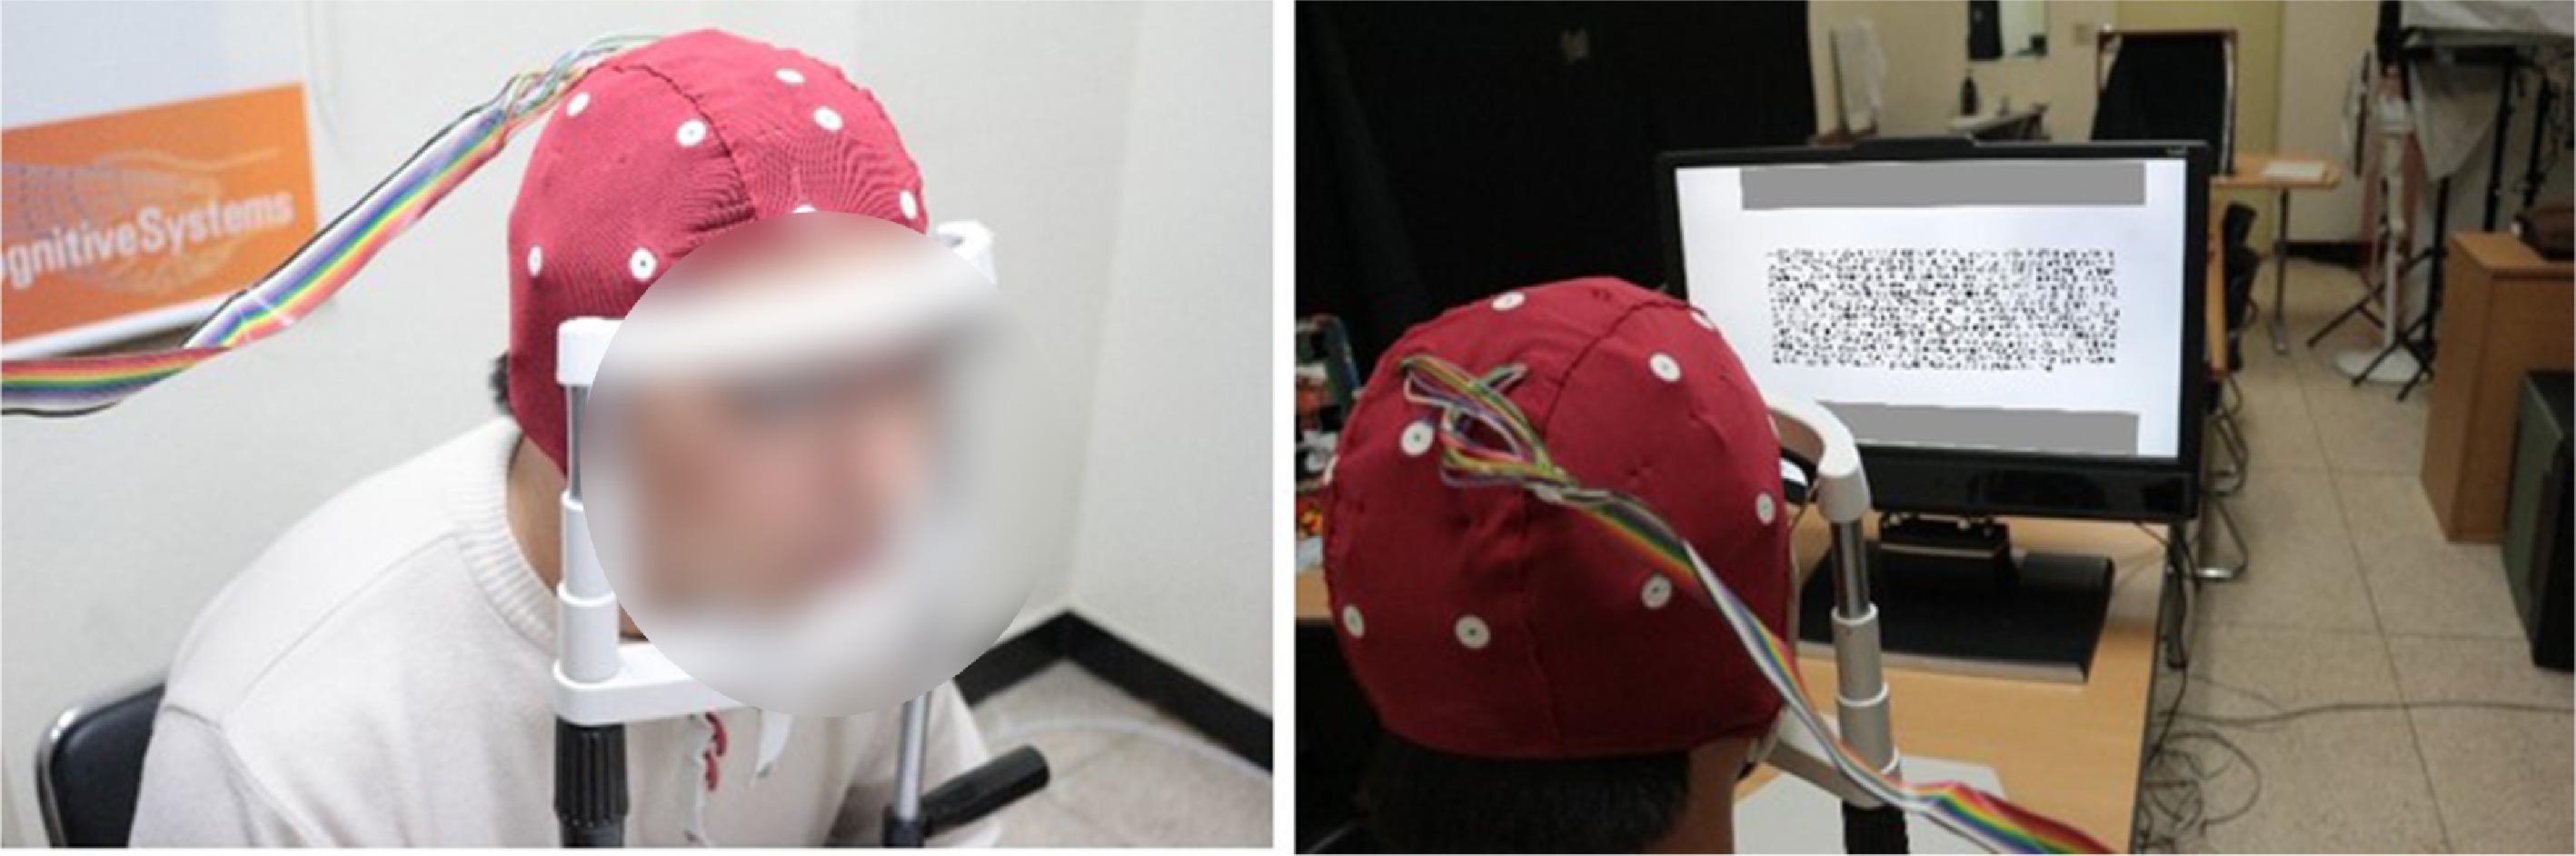
Figure 2.
Eye tracking and EEG experimental setup with an observer. Text passages were presented on the integrated display of the eye-tracking system while participants wore either BLF or control lenses. The setup includes a height adjustable chair, table, and chin rest.
-
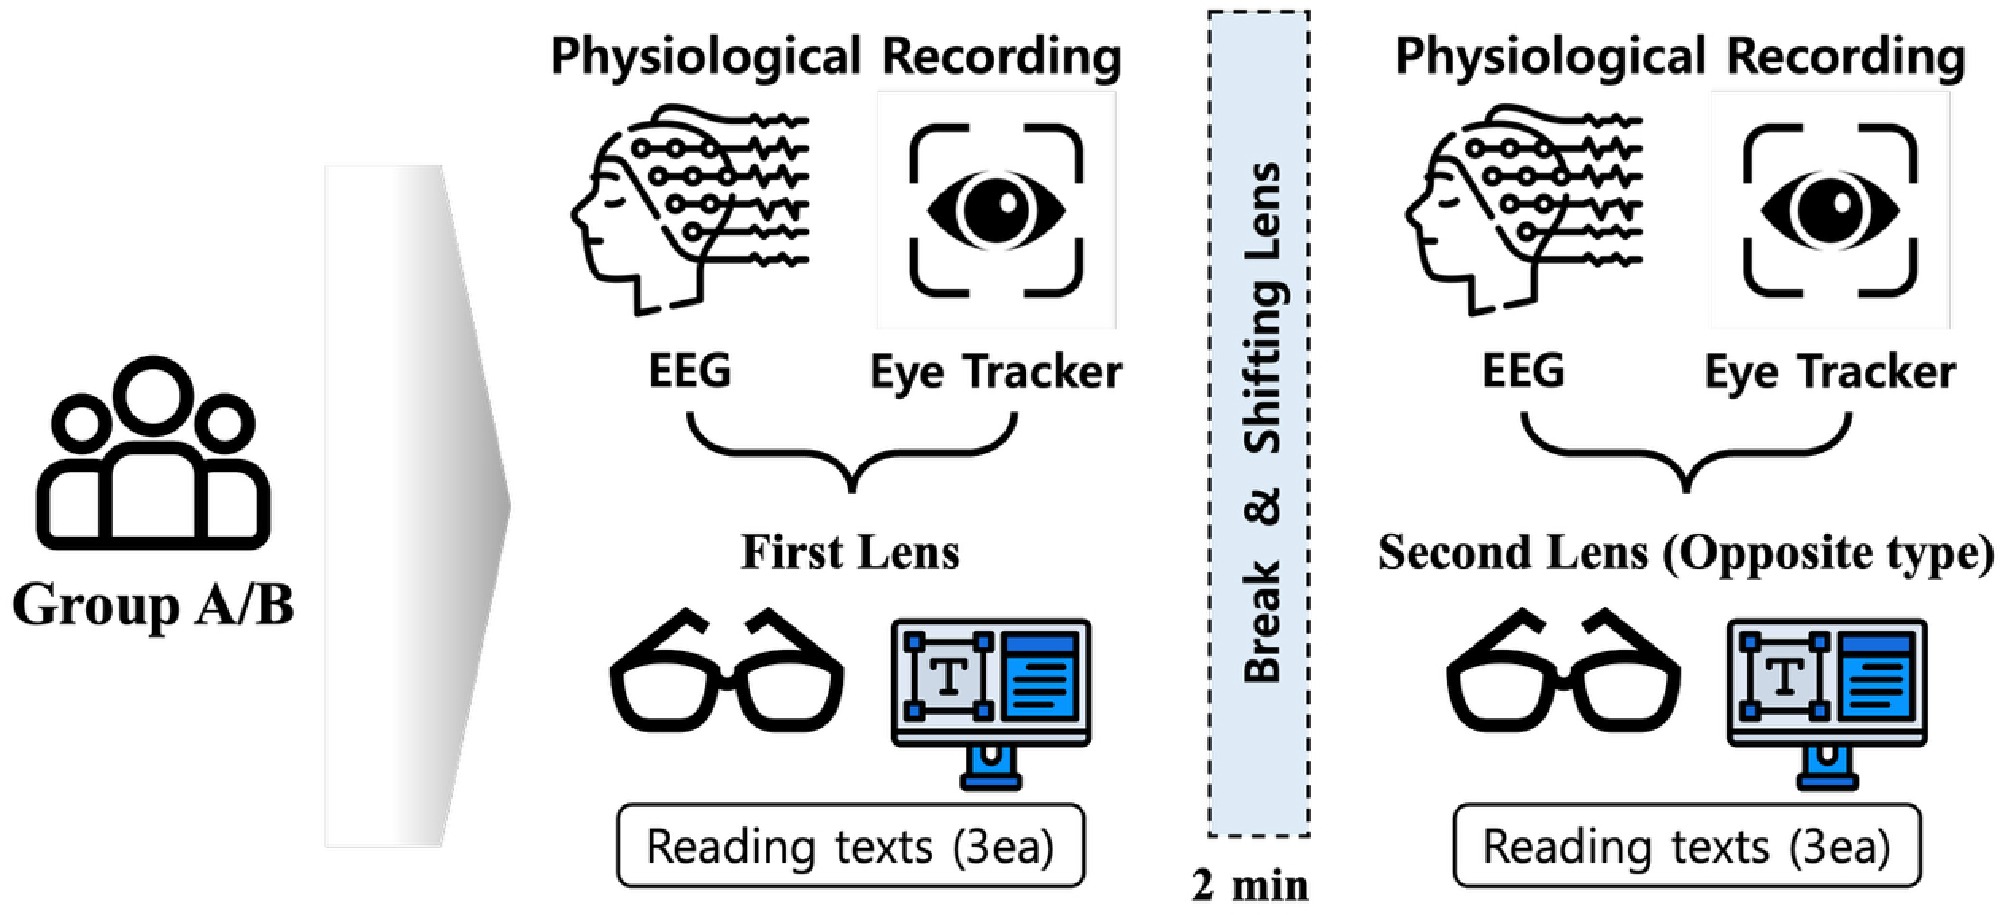
Figure 3.
Schematic representation of the experimental procedure. Each participant underwent reading tasks under two lens conditions (BLF lens and control lens). Two groups initially read three different texts under one lens condition, took a two-minute break and switched to the opposite lens condition, and then read another three different texts. The lens-wearing order was counterbalanced between groups.
-
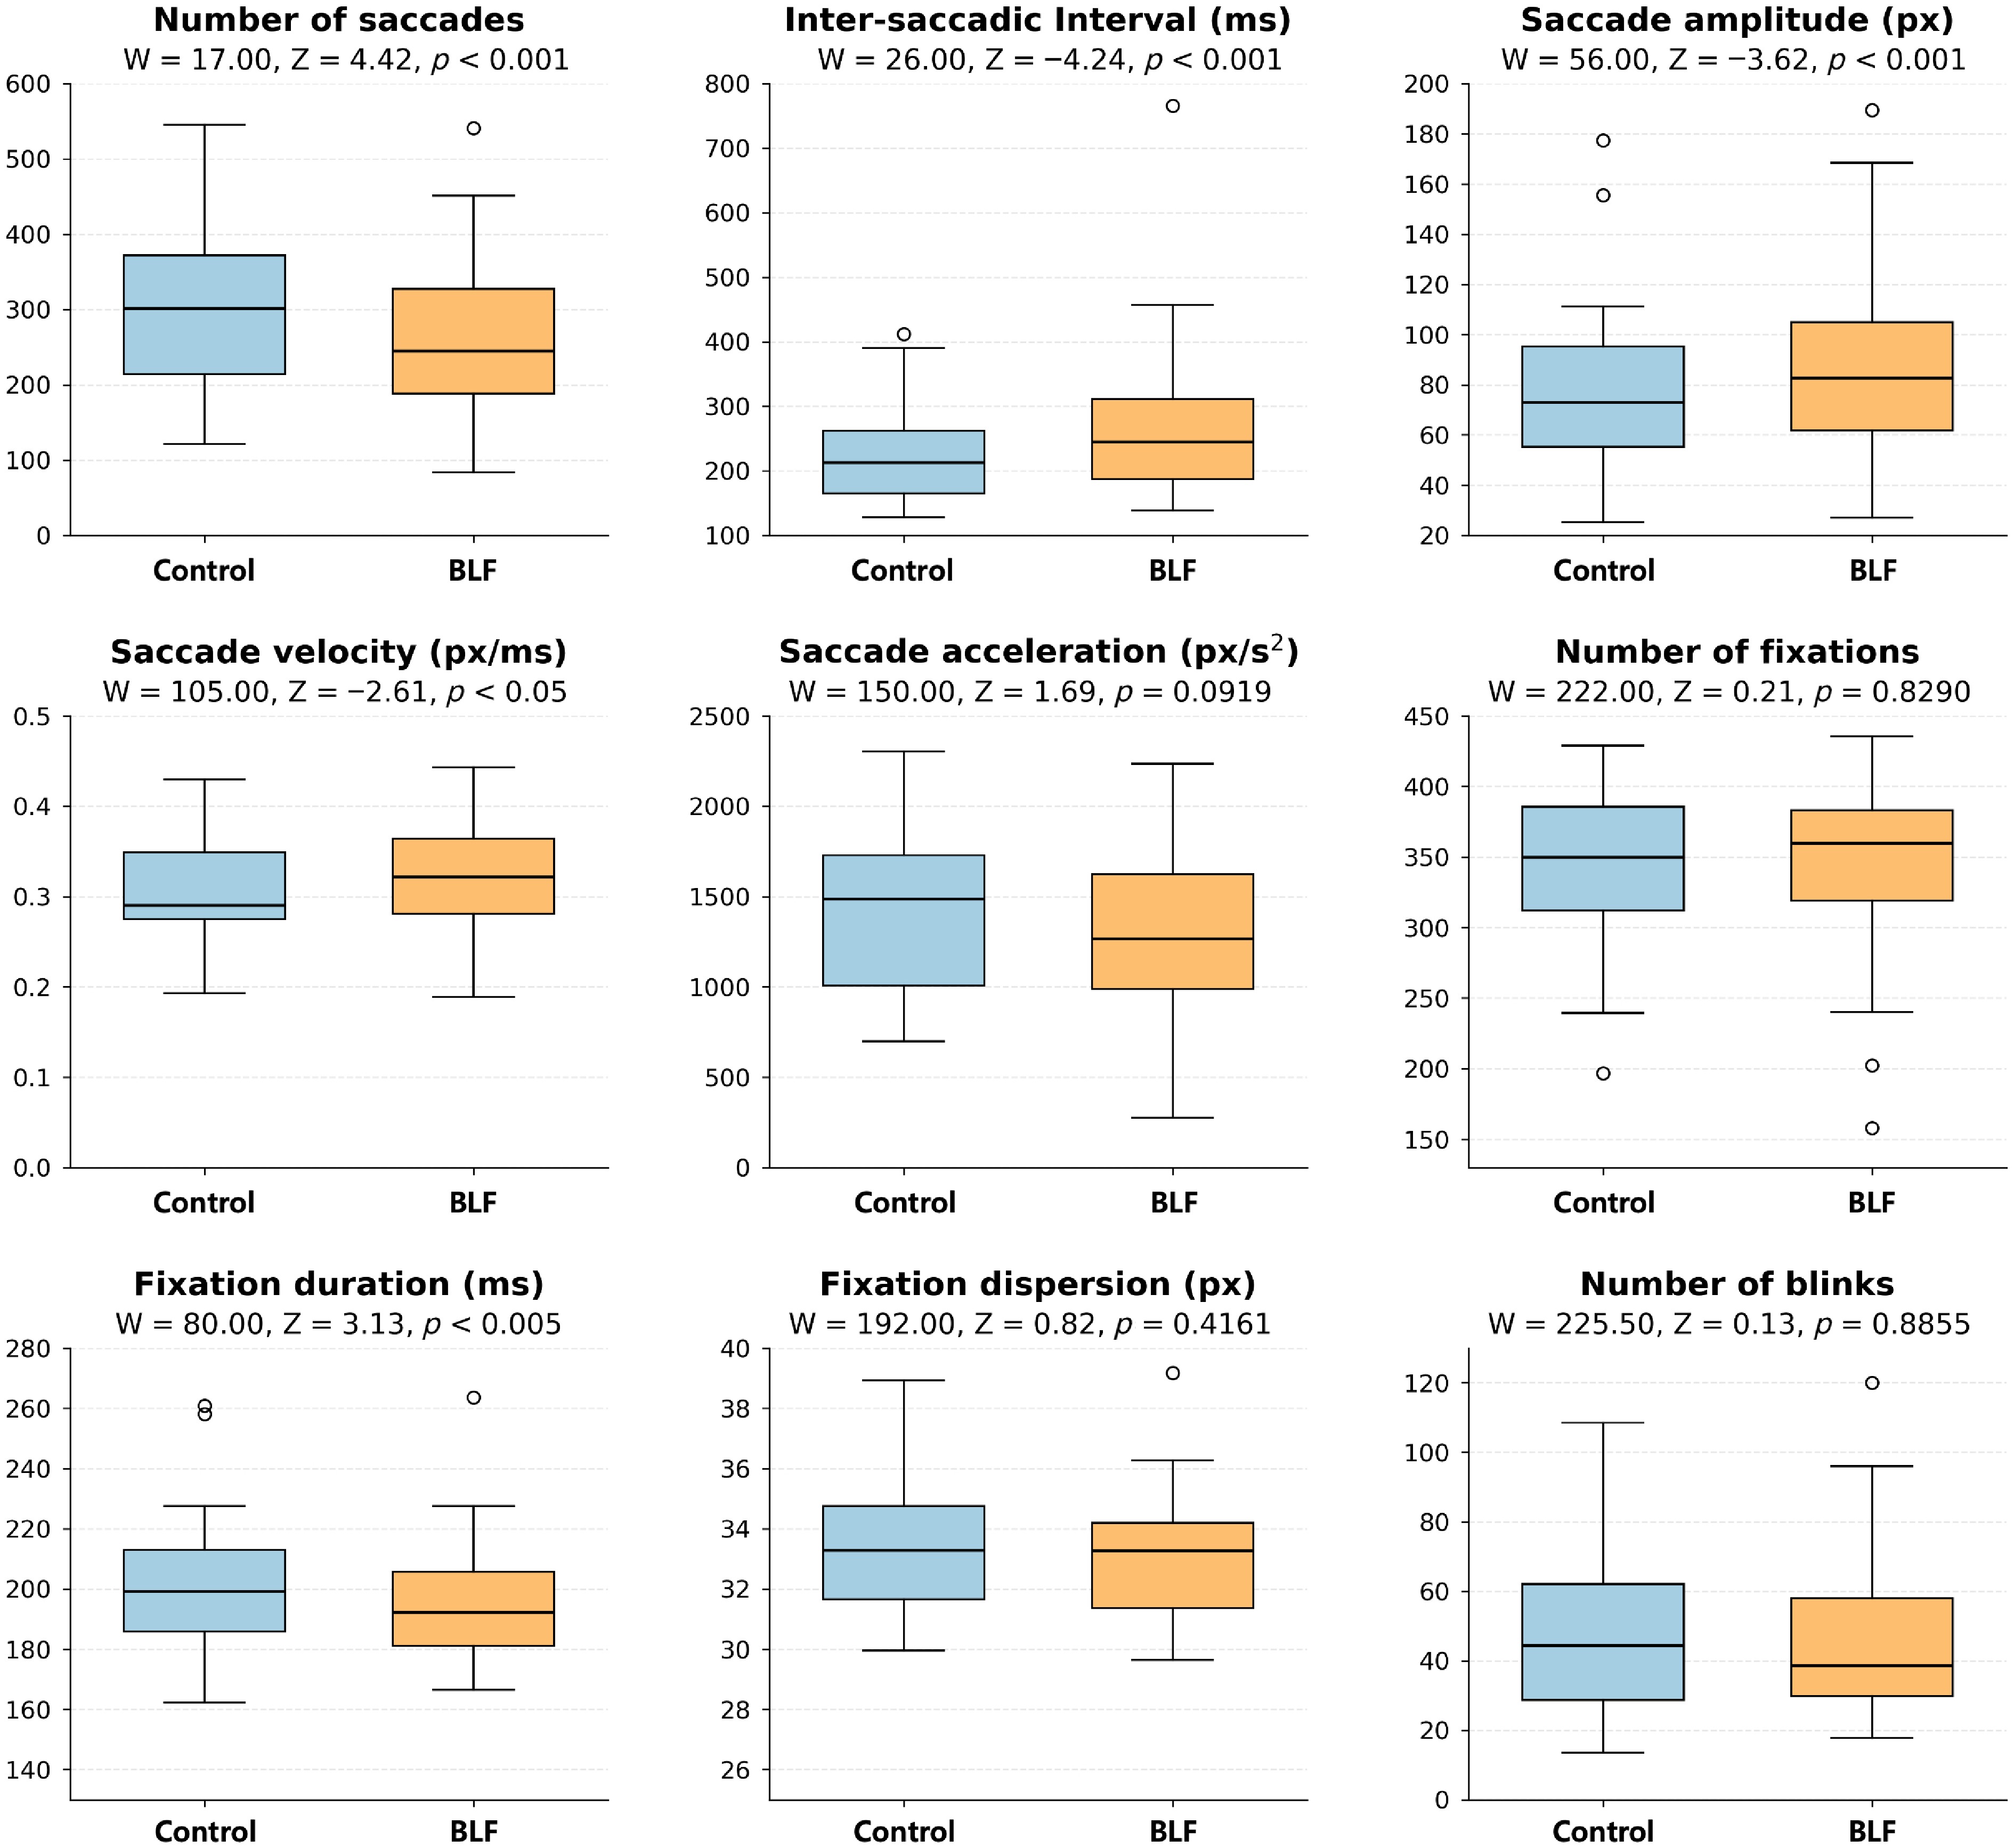
Figure 4.
Box plots of the nine metrics for control and filtered conditions together with associated p-values of non-parametric tests comparing the two conditions. For saccades, the BLF condition yielded fewer saccades, slightly higher mean velocity (px/ms), longer inter-saccadic interval (ms), and larger amplitudes (px); fixation duration was also reduced in the filtered condition. Acceleration is reported in px/s2.
-
Baseline characteristics Participants (n = 34) Demographics Age, years 23.5 ± 1.88 Male sex 24 (70.6%) Spherical equivalent refractive errors (Diopters) Right eye −0.51 ± 0.26 Left eye −0.38 ± 0.89 Best-corrected visual acuity (logMAR) Both eyes 0.1 ± 0.1 Right eye 0.1 ± 0.1 Left eye 0.1 ± 0.1 Binocular function (Titmus) Normal stereoacuity
(< 50 log arcsec)34 (100%) Distance binocular sensory status (Worth 4 Dots) Fusion 34 (100%) Diplopia 0 (0%) Suppression 0 (0%) Table 1.
Demographic characteristics of participants.
-
Frequency band Electrode Change of
BLF conditionStatistics Alpha F3 19% lower W = 154, p = 0.023 Alpha F4 26% lower W = 121, p = 0.004* Alpha C3 30% lower W = 153, p = 0.022 Alpha O2 5% lower W = 164, p = 0.037 Alpha F7 39% lower W = 122, p = 0.004* Alpha F8 23% lower W = 109, p = 0.002* Alpha FCz 22% lower W = 143, p = 0.013 Alpha Cz 17% lower W = 129, p = 0.006* Alpha Pz 2% lower W = 169, p = 0.046 Beta F3 23% lower W = 146, p = 0.015 Beta F4 26% lower W = 141, p = 0.012 Beta C3 33% lower W = 169, p = 0.046 Beta F7 38% lower W = 149, p = 0.018 Beta T8 24% lower W = 146, p = 0.015 Beta FCz 28% lower W = 159, p = 0.029 Gamma F3 21% lower W = 116, p = 0.003* Gamma C3 20% lower W = 148, p = 0.017 Gamma C4 18% lower W = 144, p = 0.014 Gamma F7 15% lower W = 156, p = 0.025 Gamma P8 18% higher W = 160, p = 0.031 Gamma FCz 23% lower W = 145, p = 0.014 Delta F3 5% higher W = 407, p = 0.023 Delta F4 4% higher W = 432, p = 0.006* Delta C3 5% higher W = 417, p = 0.014 Delta F7 5% higher W = 438, p = 0.004* Delta T8 7% higher W = 431, p = 0.006* Delta FCz 4% higher W = 418, p = 0.013 Theta F7 33% lower W = 154, p = 0.023 Theta T8 3% lower W = 156, p = 0.025 The table lists the frequency band, the electrode position in the 10−20 system, the change in power (in percent) compared to the control condition, and the detailed result of the Wilcoxon test. Starts mark the tests that pass a more stringent, Bonferroni corrected test. Bold values indicate statistically significant results (p < 0.05). Table 2.
Significant differences in band power for each electrode, in which the BLF condition differed from the control condition (p < 0.05 in Wilcoxon tests).
Figures
(4)
Tables
(2)