-
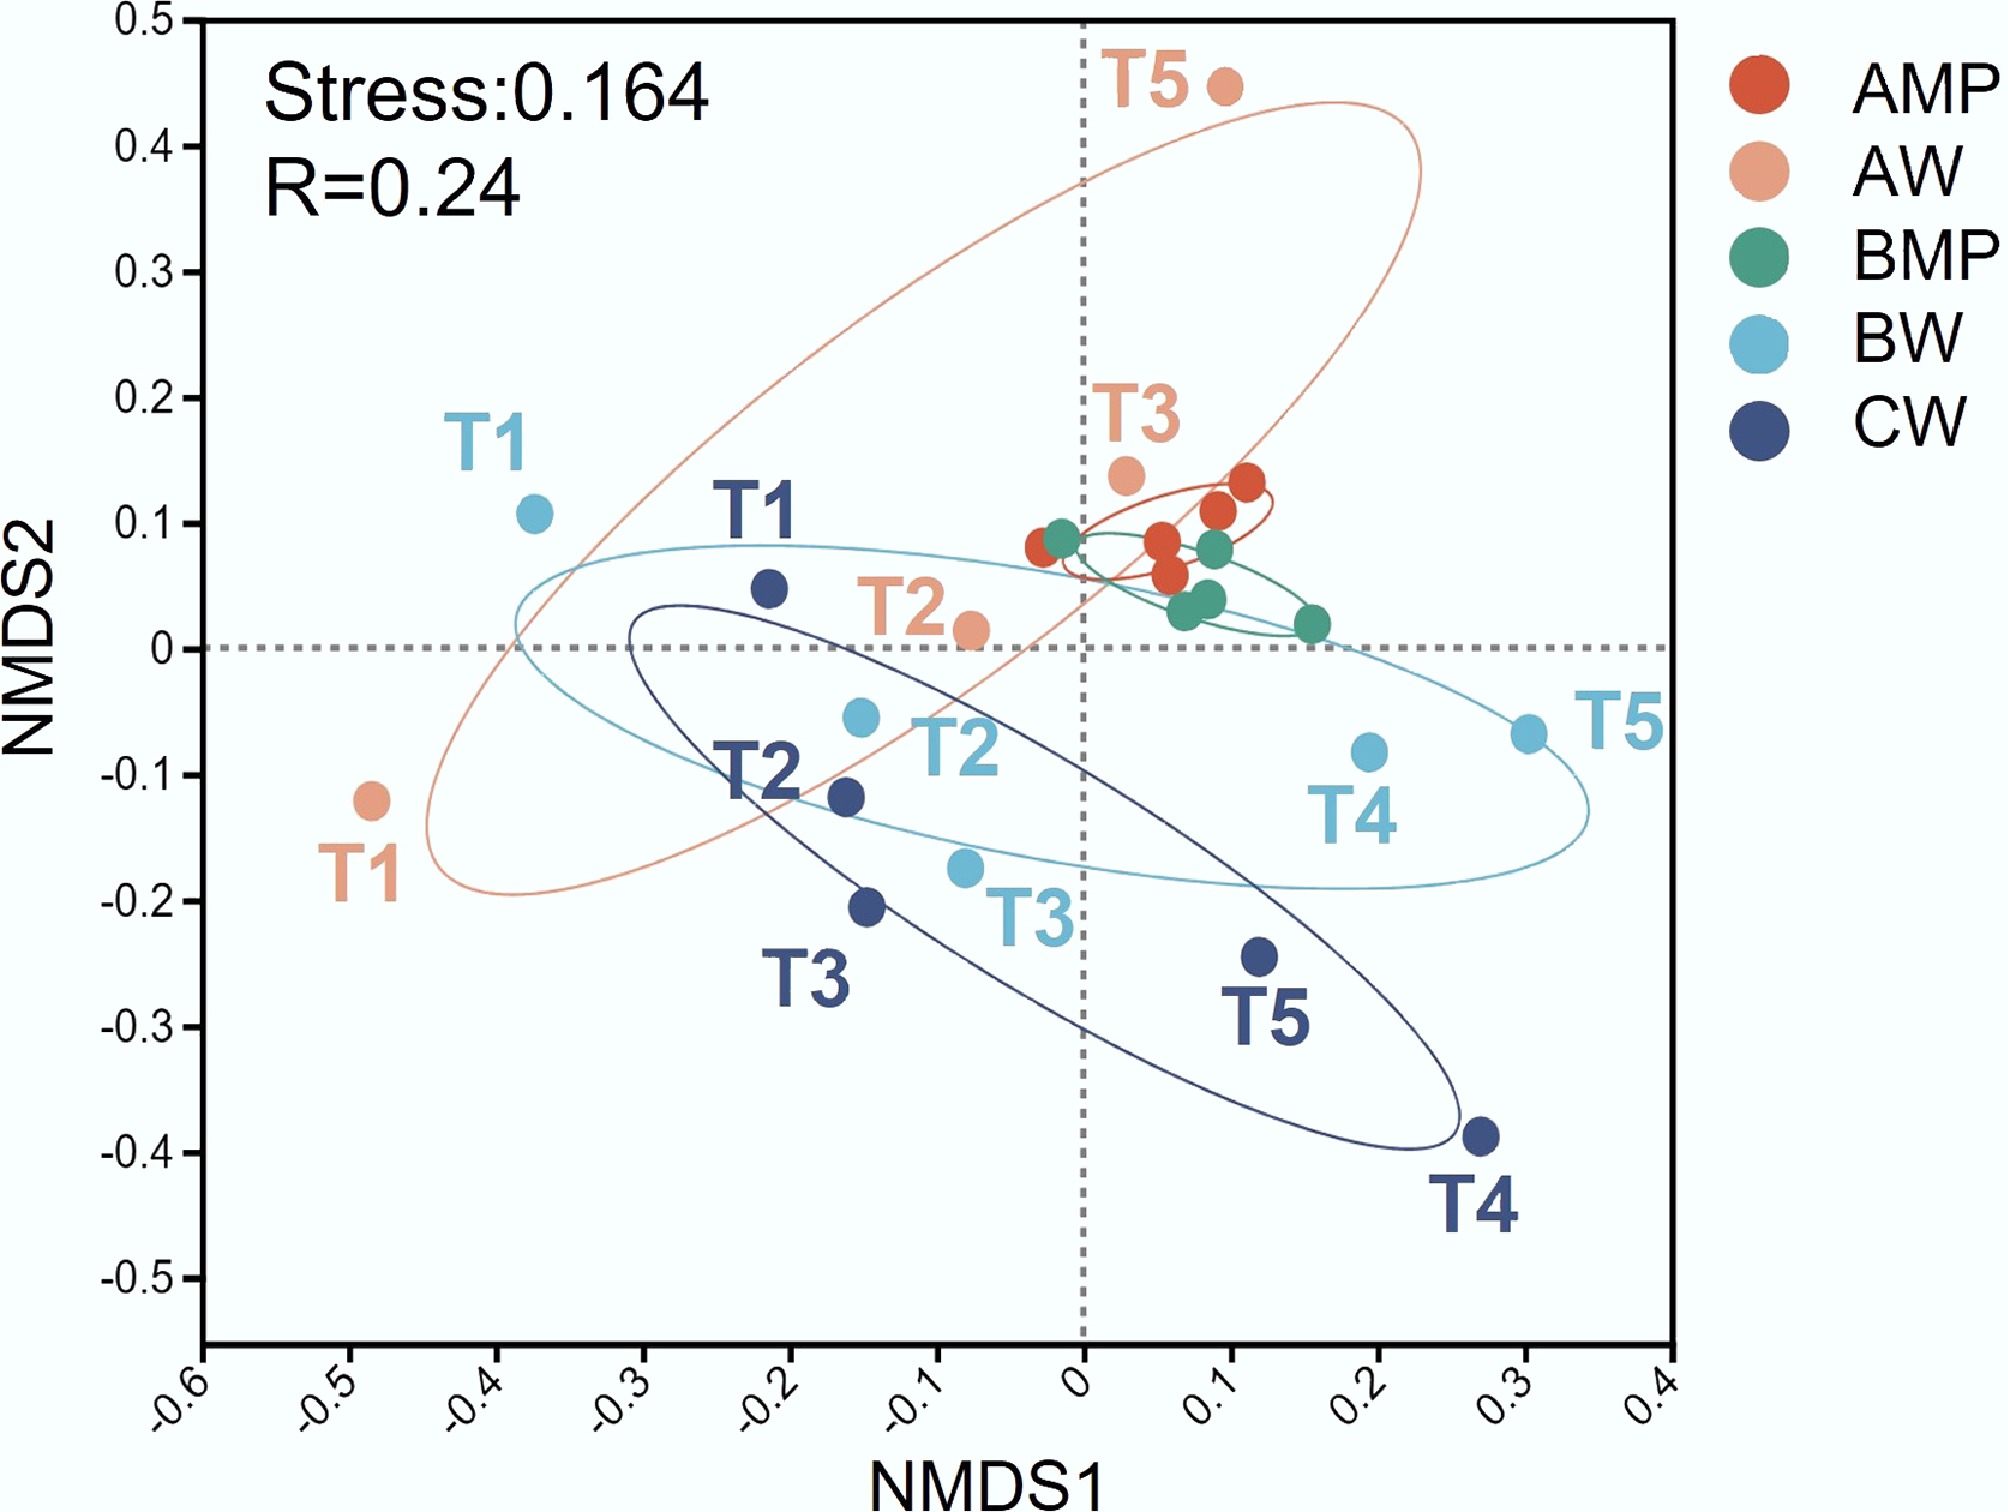
Figure 1.
NMDS analysis of microbial community beta-diversity across samples. AMP and AW represent the microplastic and water samples of Group A, respectively. BMP and BW represent the microplastic and water samples of Group B, respectively. CW represents the water sample of Group C.
-
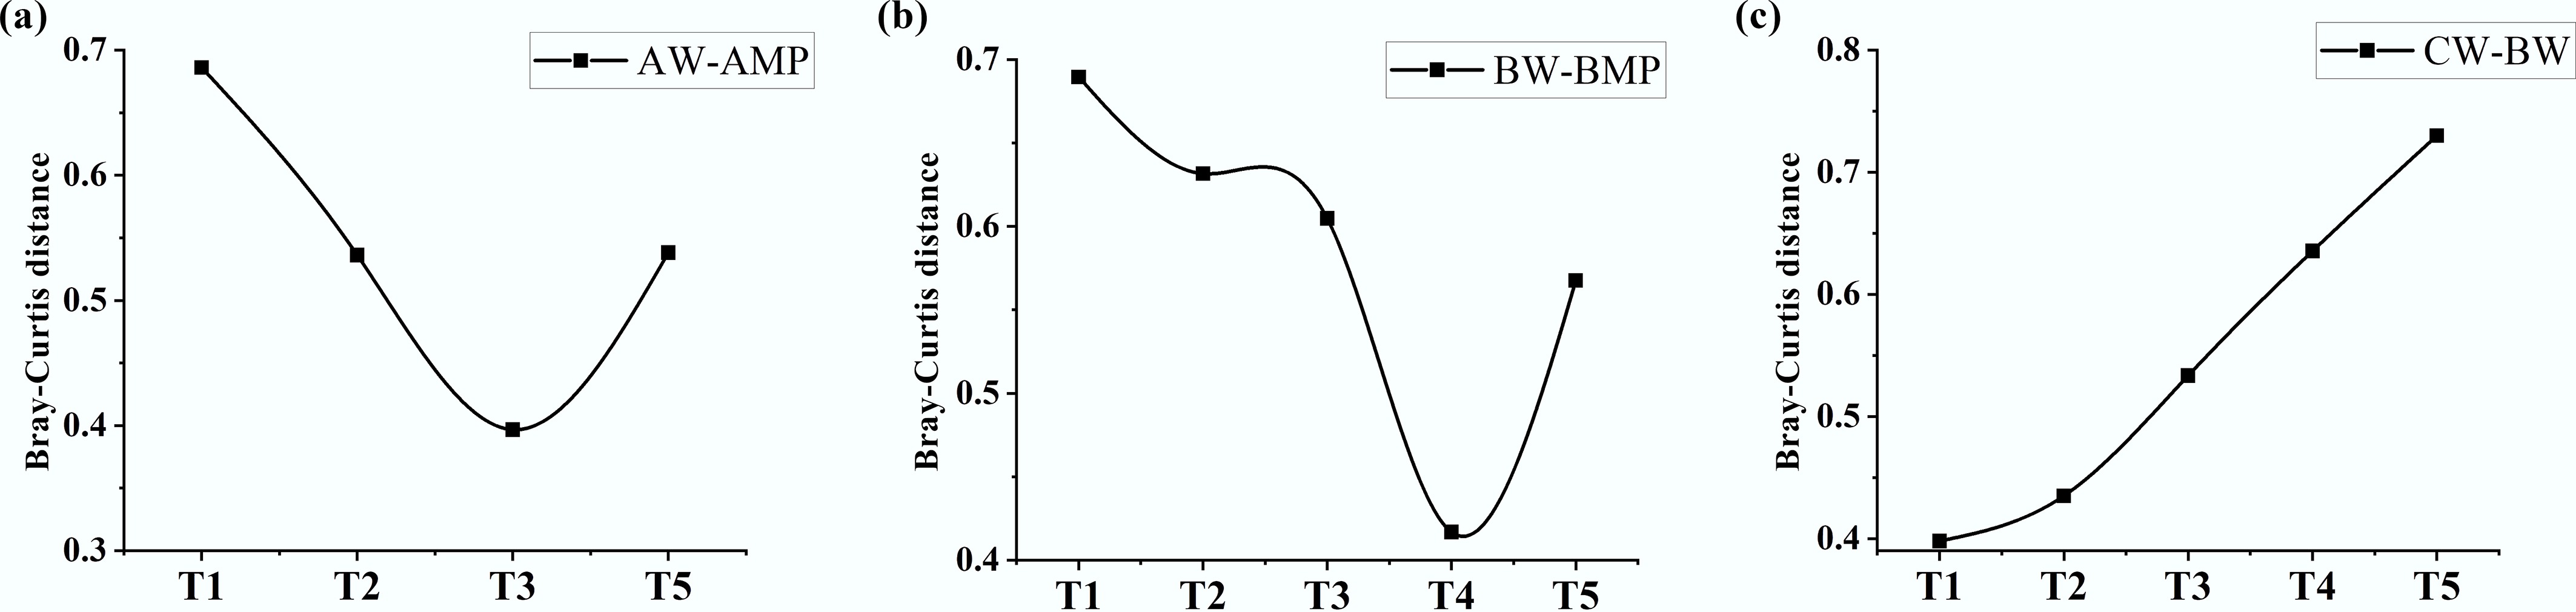
Figure 2.
Temporal variation in intergroup Bray-Curtis distance of microbial communities from week 1 to week 5. (a) Pure water group (Group A): plastisphere vs water. (b) River water group (Group B): plastisphere vs water. (c) River water of experimental group (Group B) vs control group (Group C).
-
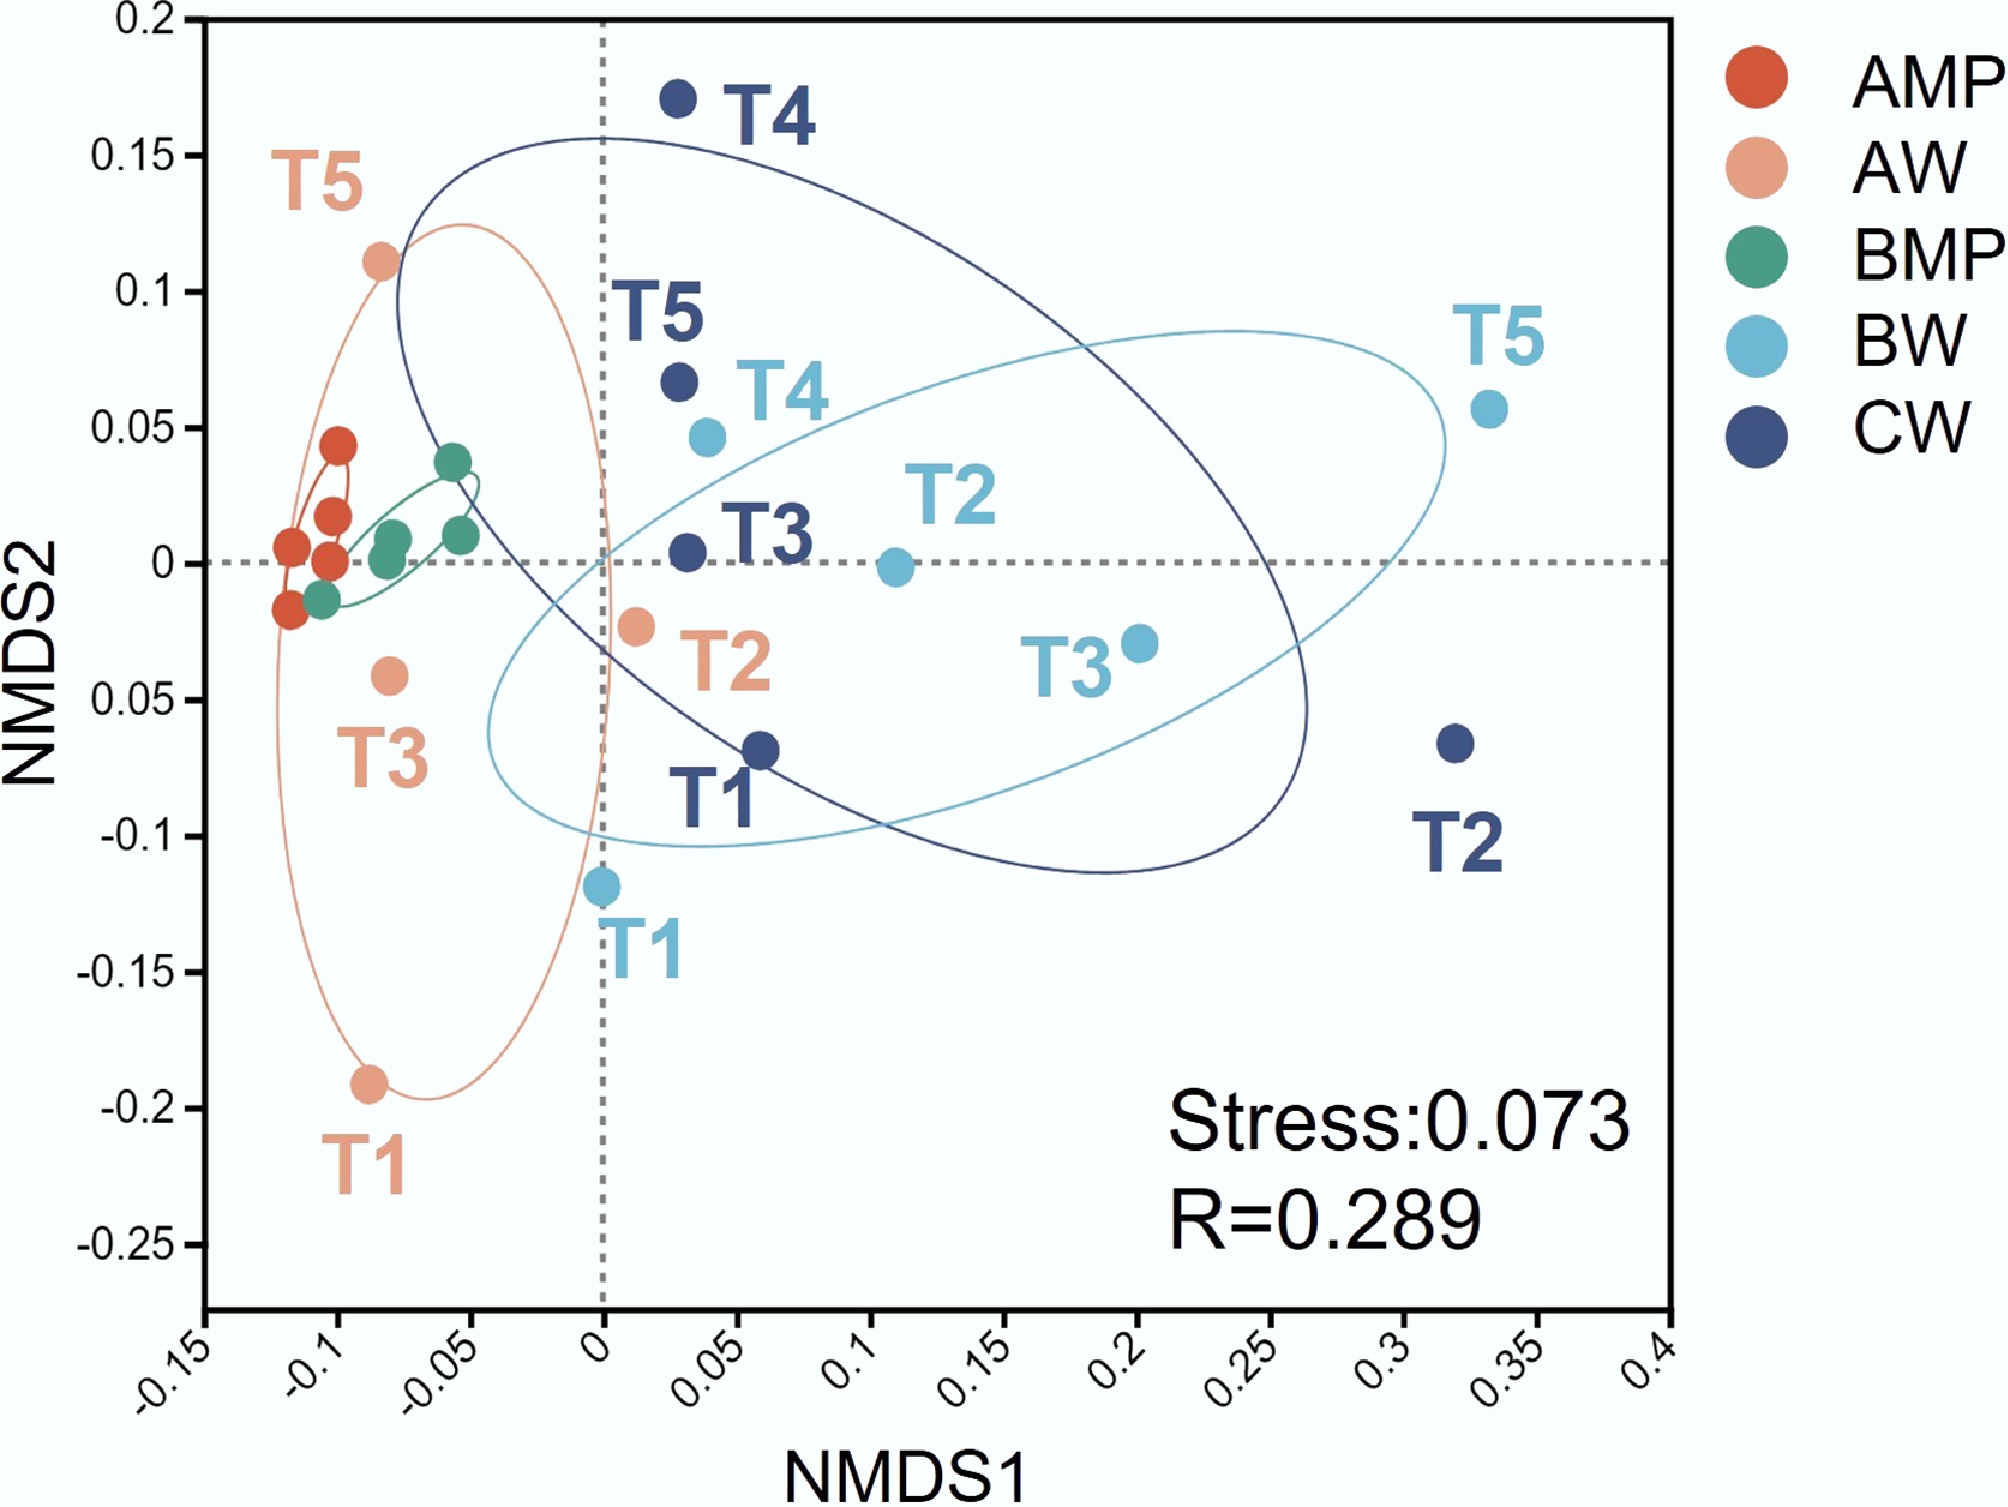
Figure 3.
NMDS analysis of ARGs across samples. AMP and AW represent the microplastic and water samples of Group A, respectively. BMP and BW represent the microplastic and water samples of Group B, respectively. CW represents the water sample of Group C.
-
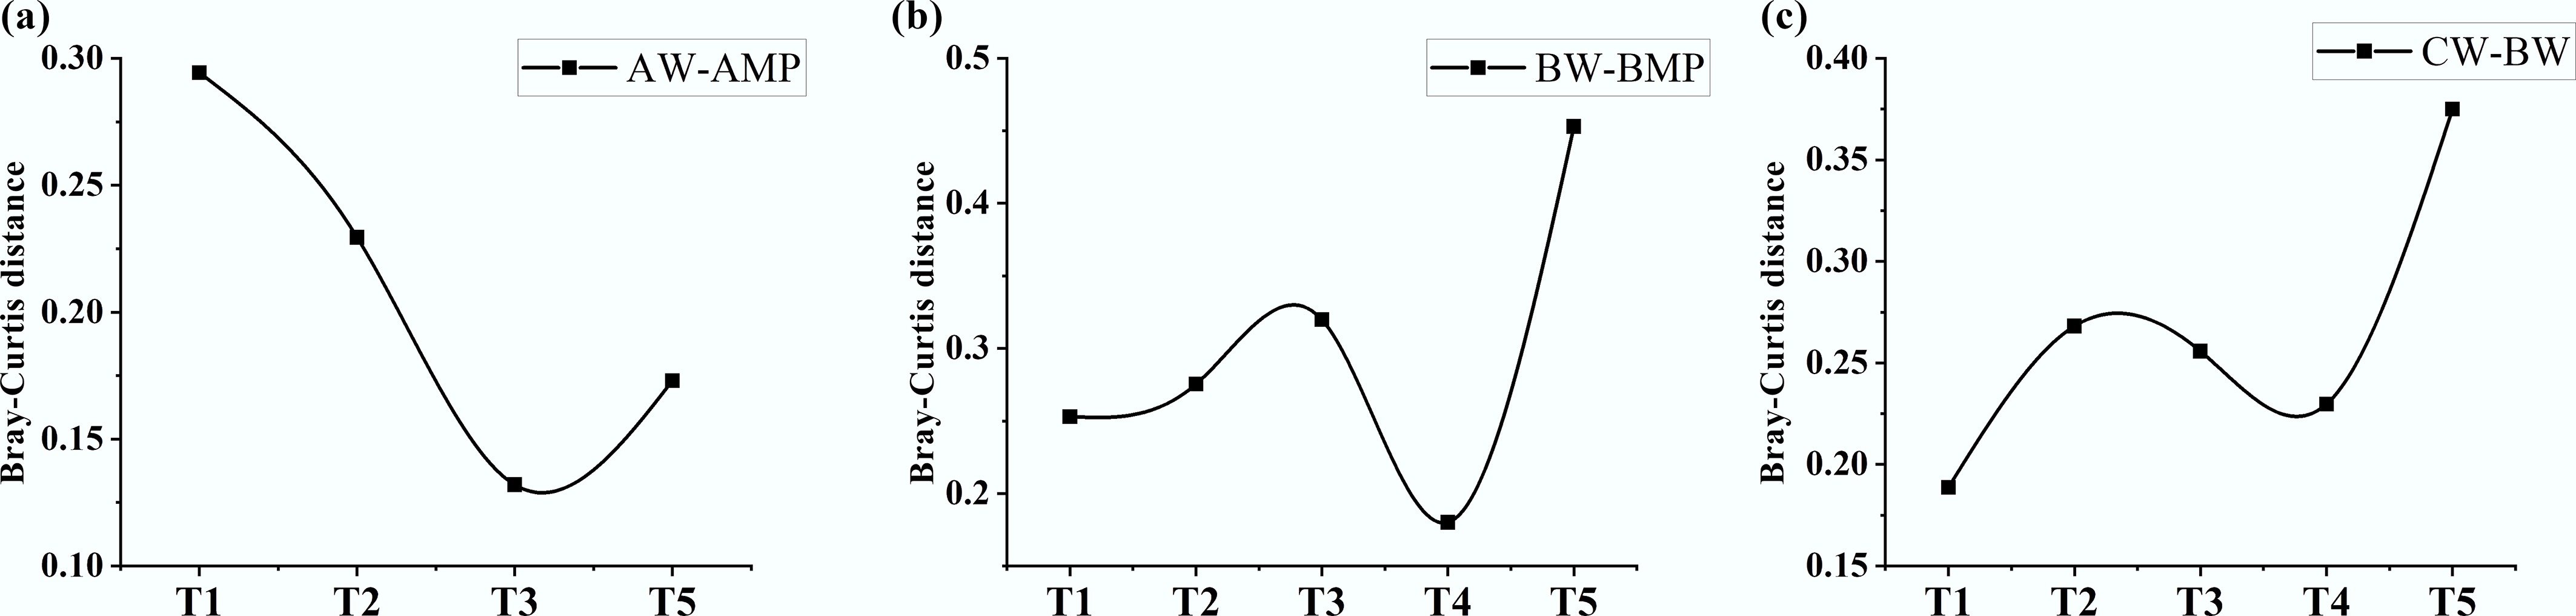
Figure 4.
Temporal variation in intergroup Bray-Curtis distance of ARGs from week 1 to week 5. (a) Pure water group (Group A): plastisphere vs water. (b) River water group (Group B): plastisphere vs water. (c) River water of experimental group (Group B) vs control group (Group C).
-
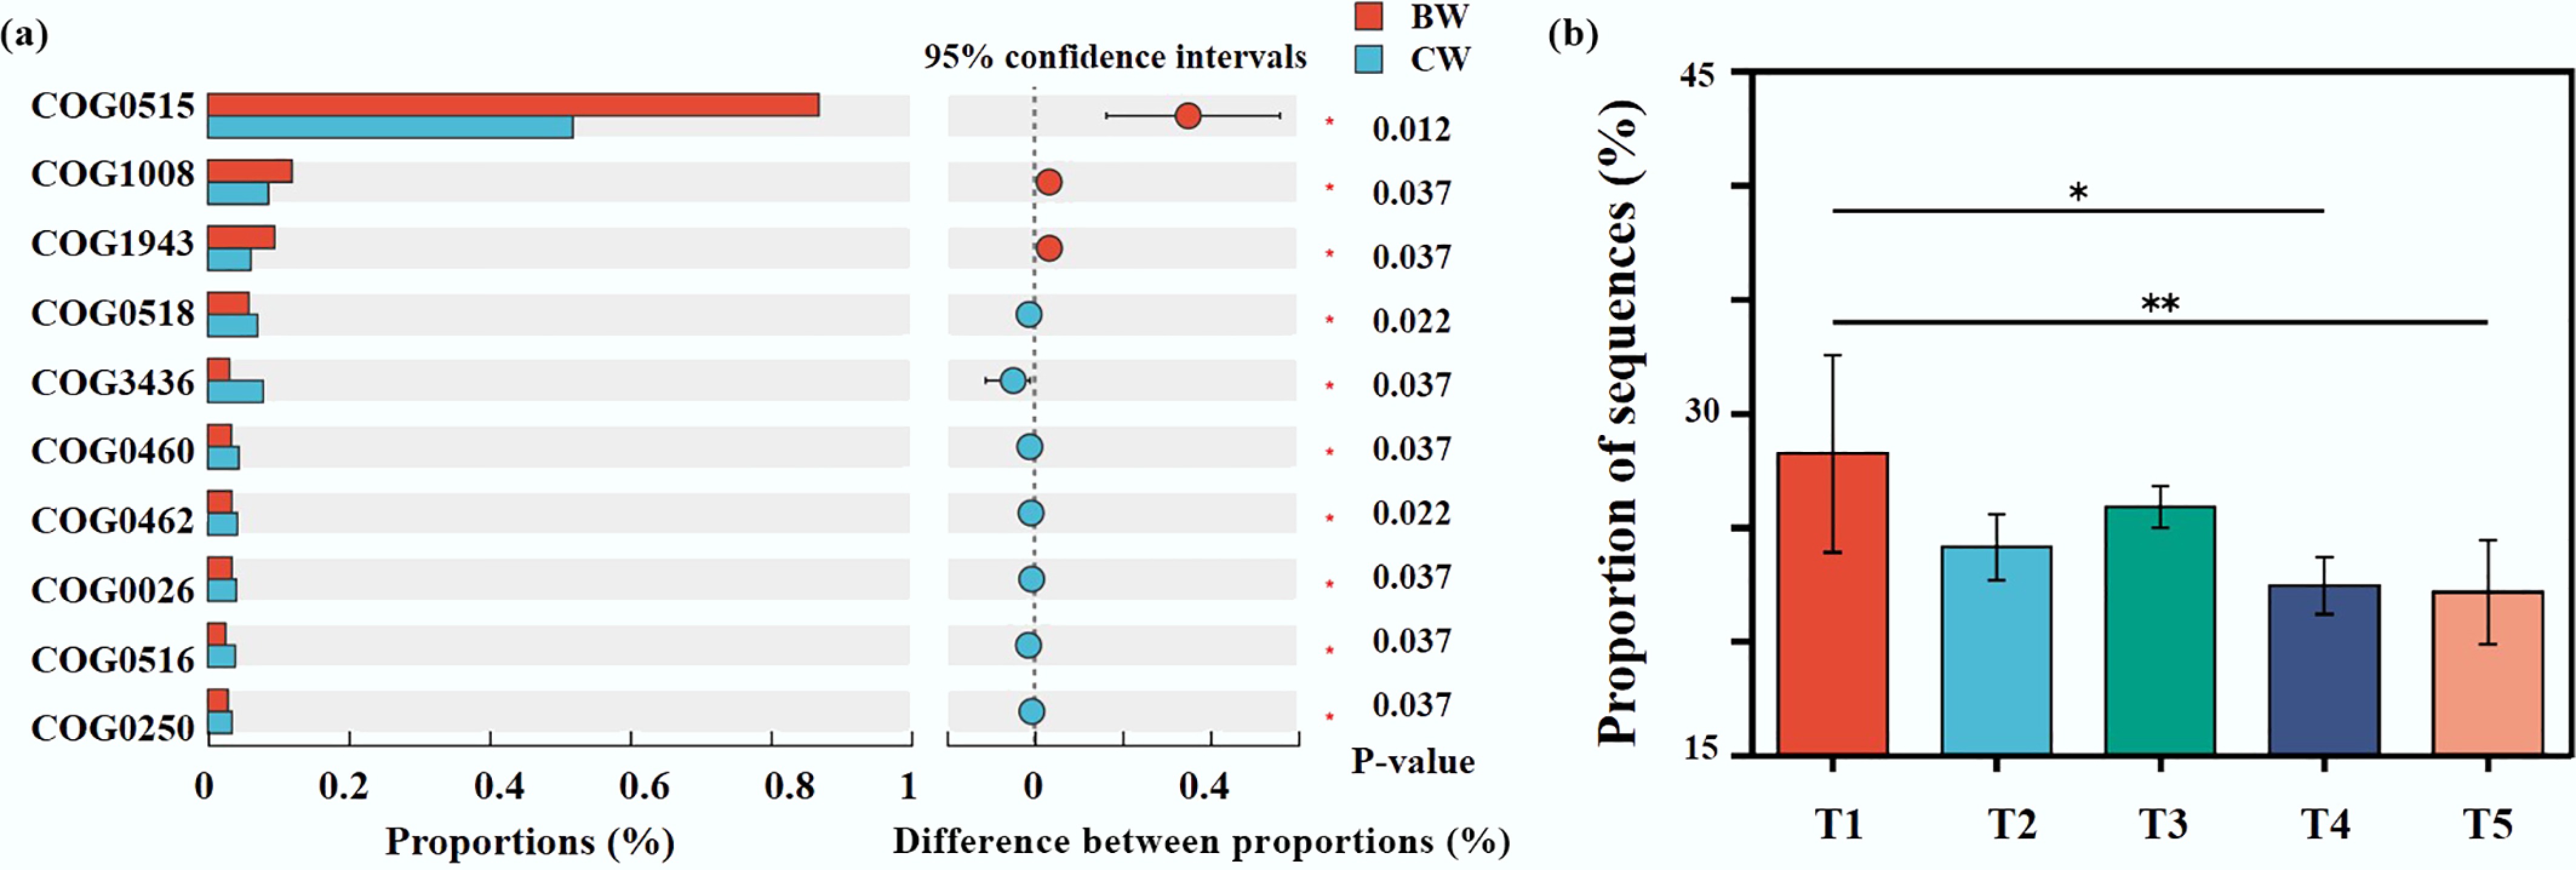
Figure 5.
Functional and metabolic responses of the receiving water to MP introduction. (a) Comparative analysis of COG functions. (b) Temporal dynamics of the autoinducer from week 1 to week 5.
Figures
(5)
Tables
(0)