-
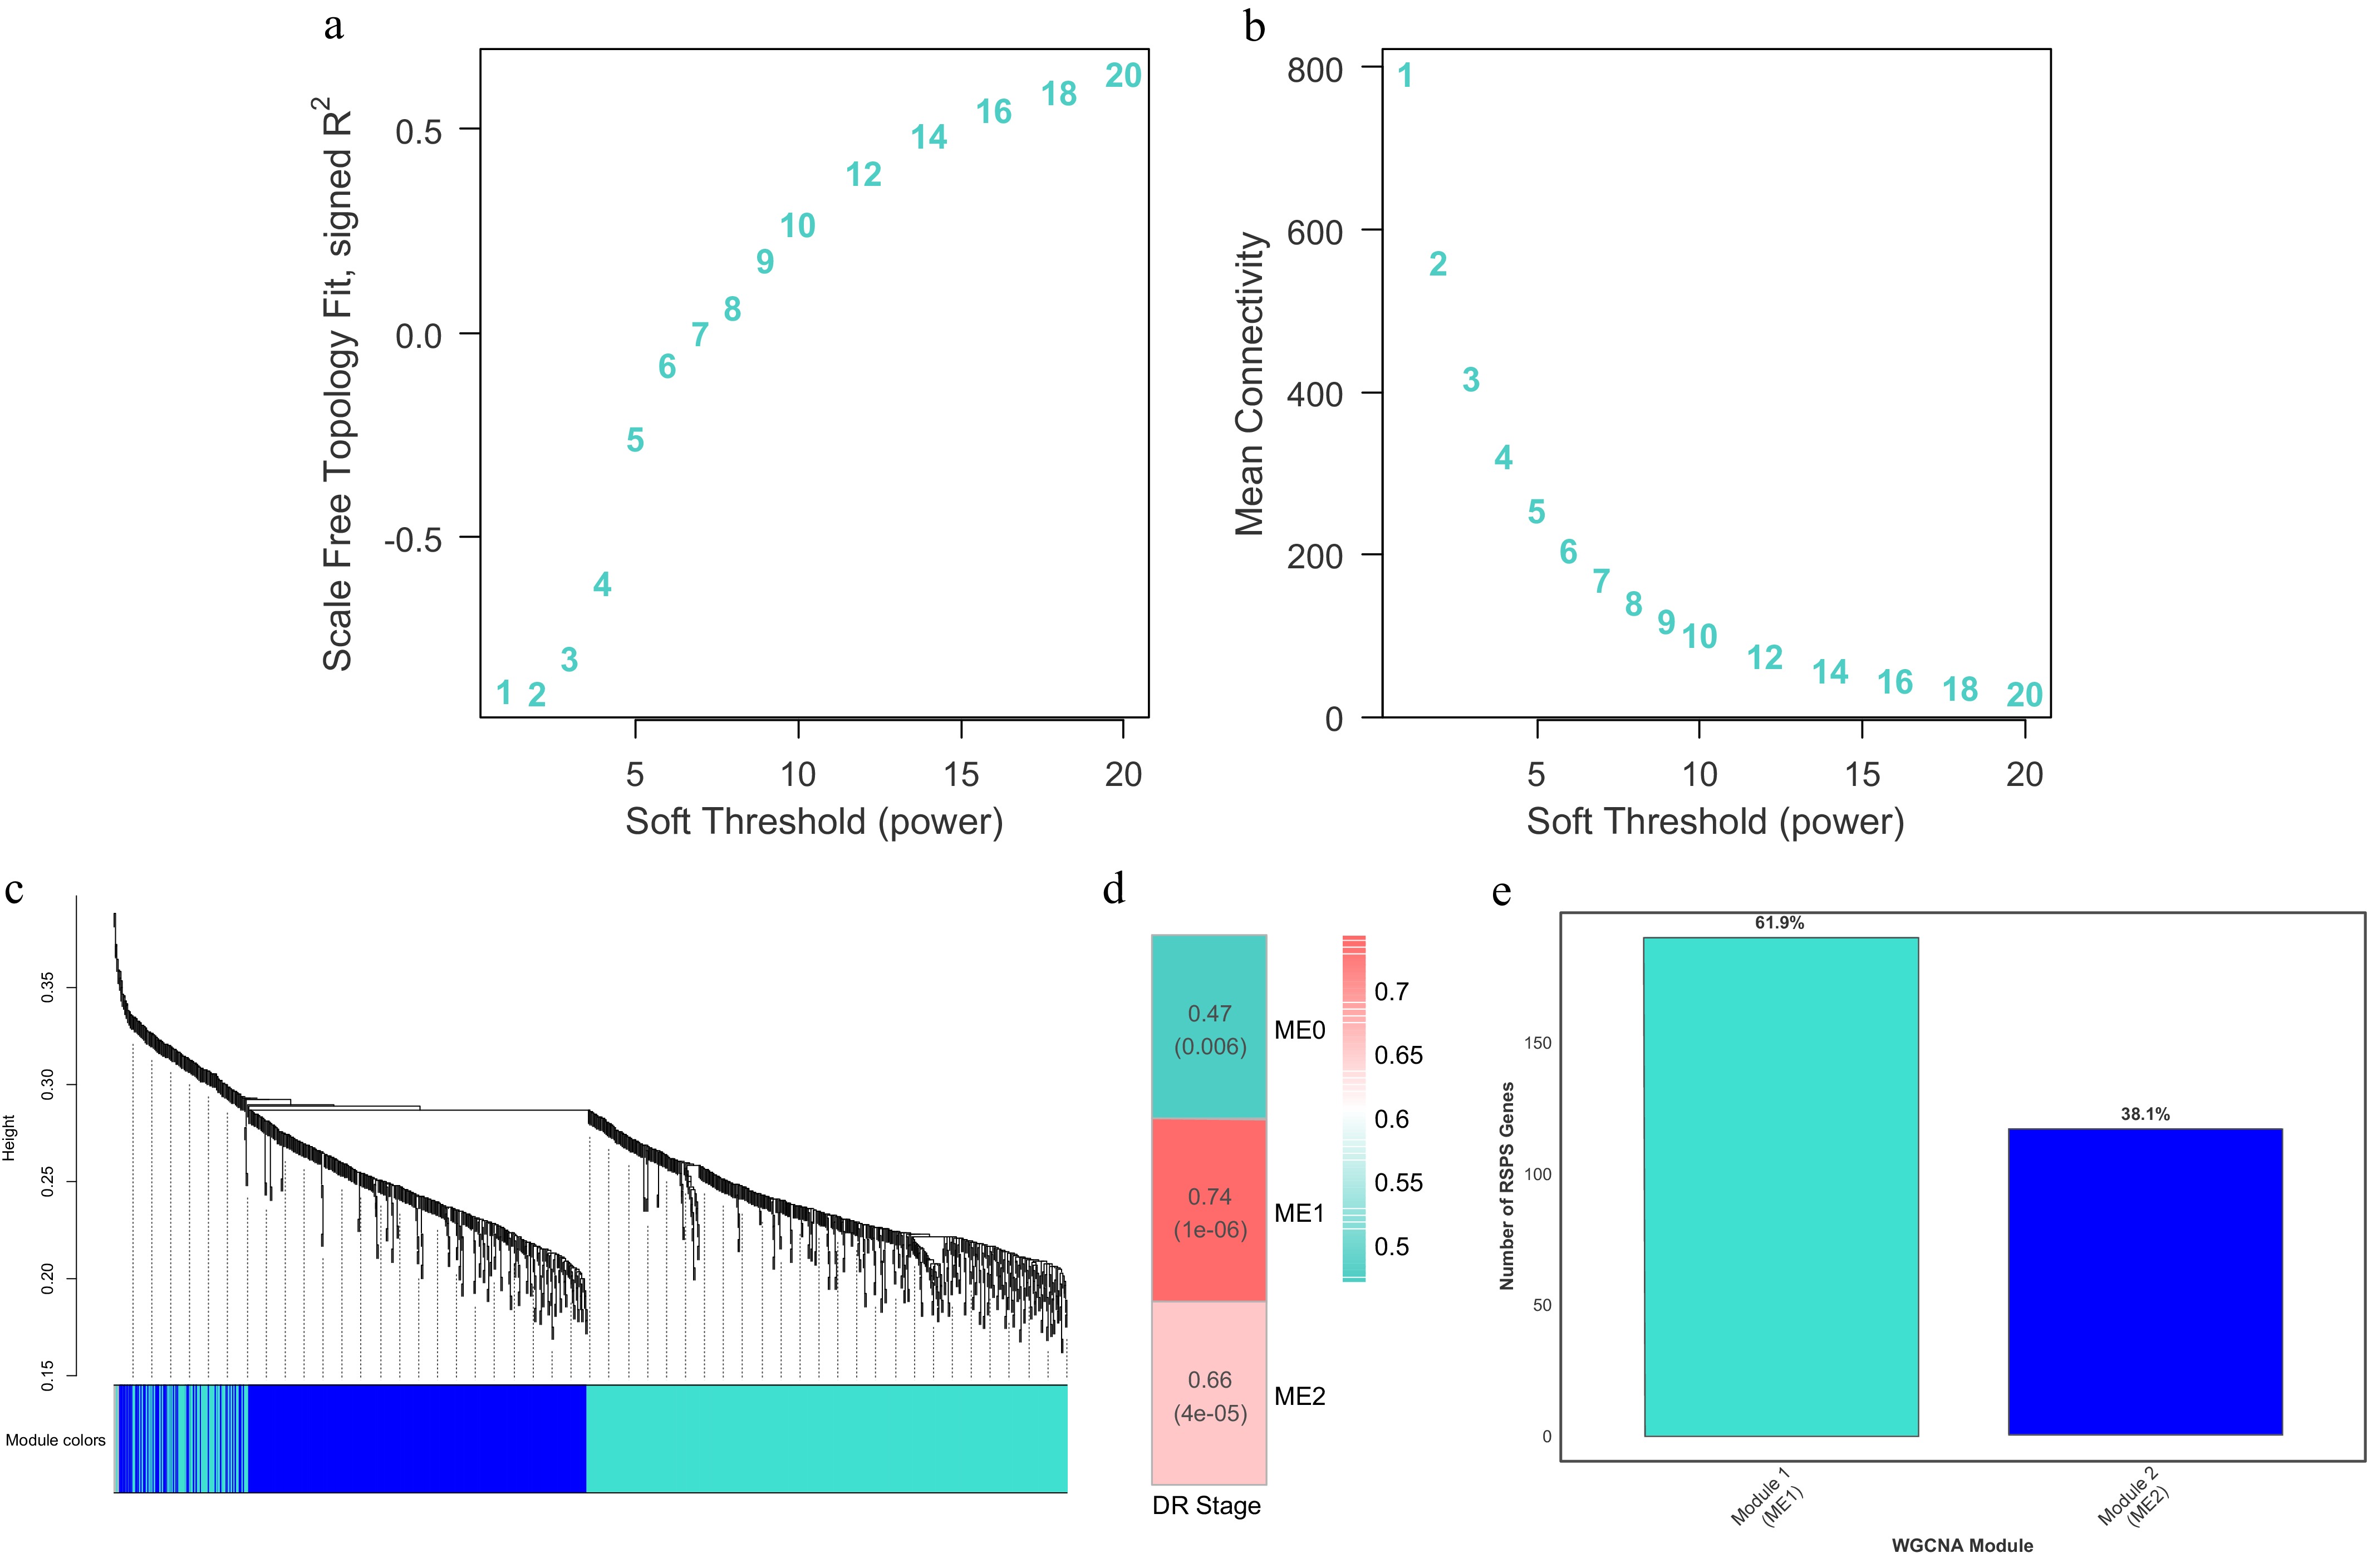
Figure 1.
Construction of the WGCNA and module localization of RSPS genes. (a, b) Soft-thresholding power selection analyses showing the scale-free topology fit index (a) and mean connectivity (b) as a function of the soft-thresholding power. (c) Hierarchical clustering dendrogram of proteins based on topological overlap dissimilarity (1 − TOM), with the identified co-expression modules labeled by distinct colors. (d) Heatmap of correlations between MEs and clinical DR stages. Numbers in each cell indicate Pearson's correlation coefficients and the corresponding p-values. (e) Distribution and percentage of the 307 RSPS candidate genes within the key co-expression modules, Module 1 (ME1) and Module 2 (ME2).
-
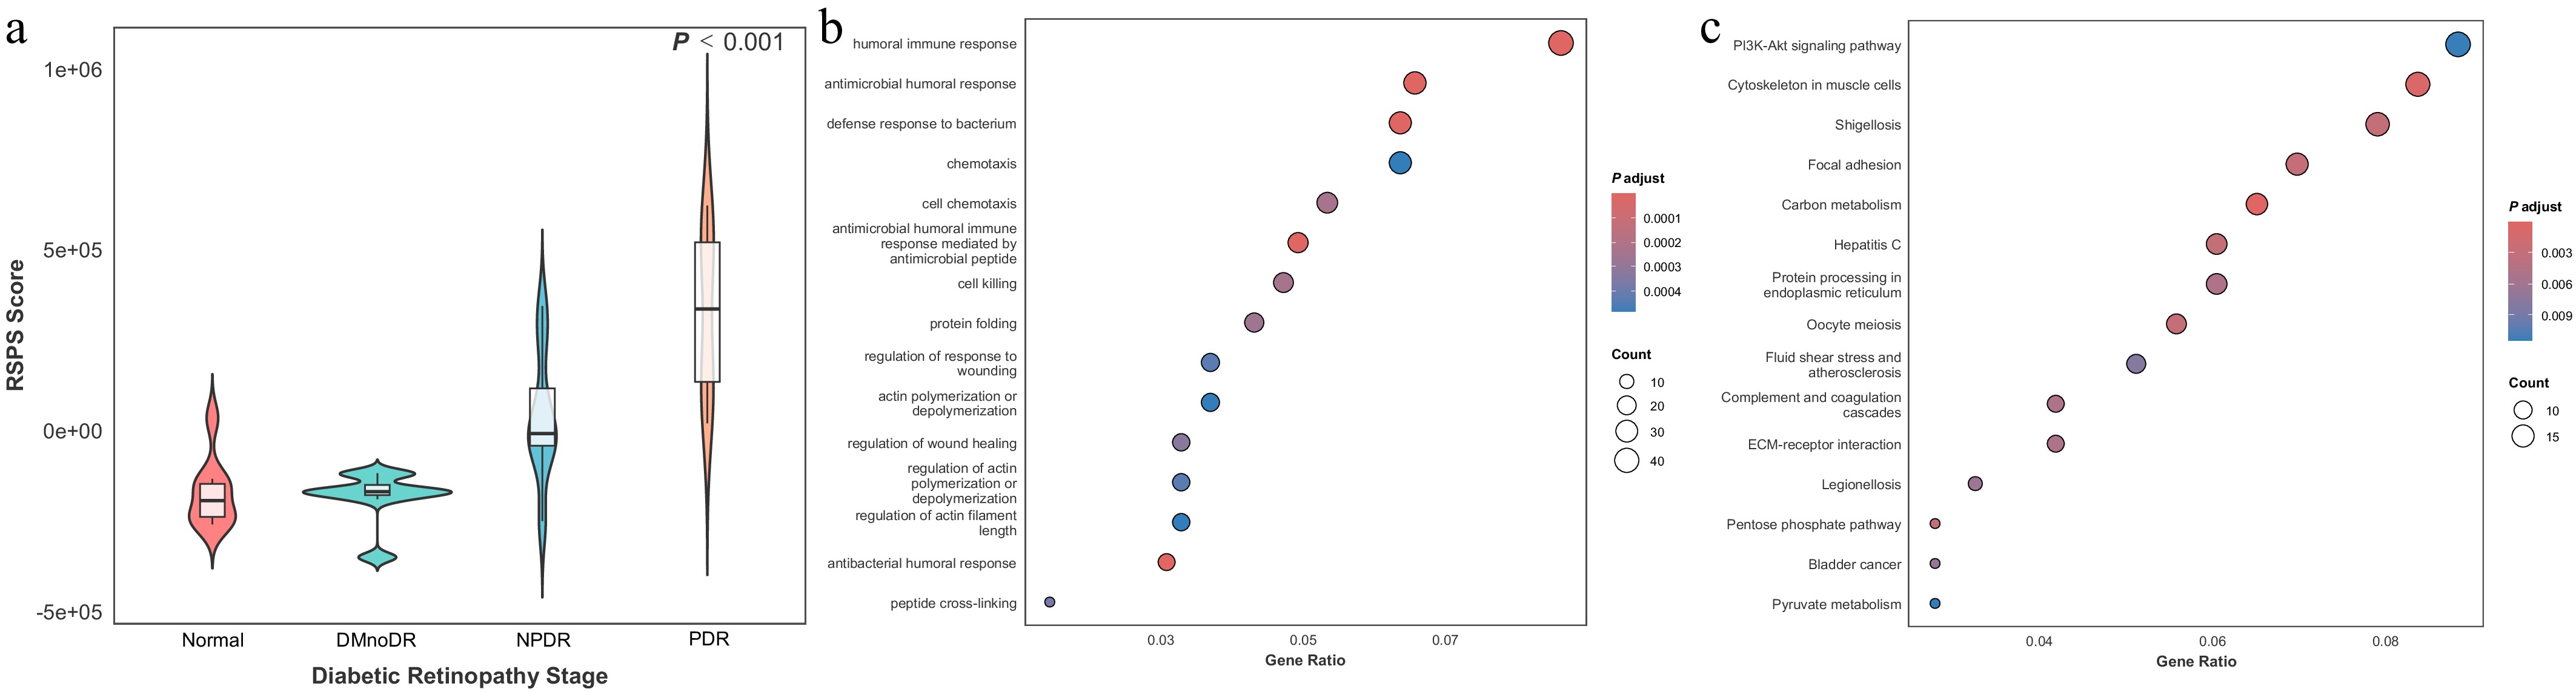
Figure 2.
Identification of the RSPS score and functional enrichment analysis. (a) Violin plot of RSPS scores across DR stages in the discovery cohort. Overlaid boxplots indicate the median (center line), interquartile range (IQR; box boundaries), and whiskers extending to 1.5 × IQR. (b, c) Bubble plots showing GO biological process enrichment (b) and KEGG pathway enrichment (c) for RSPS-related genes.
-
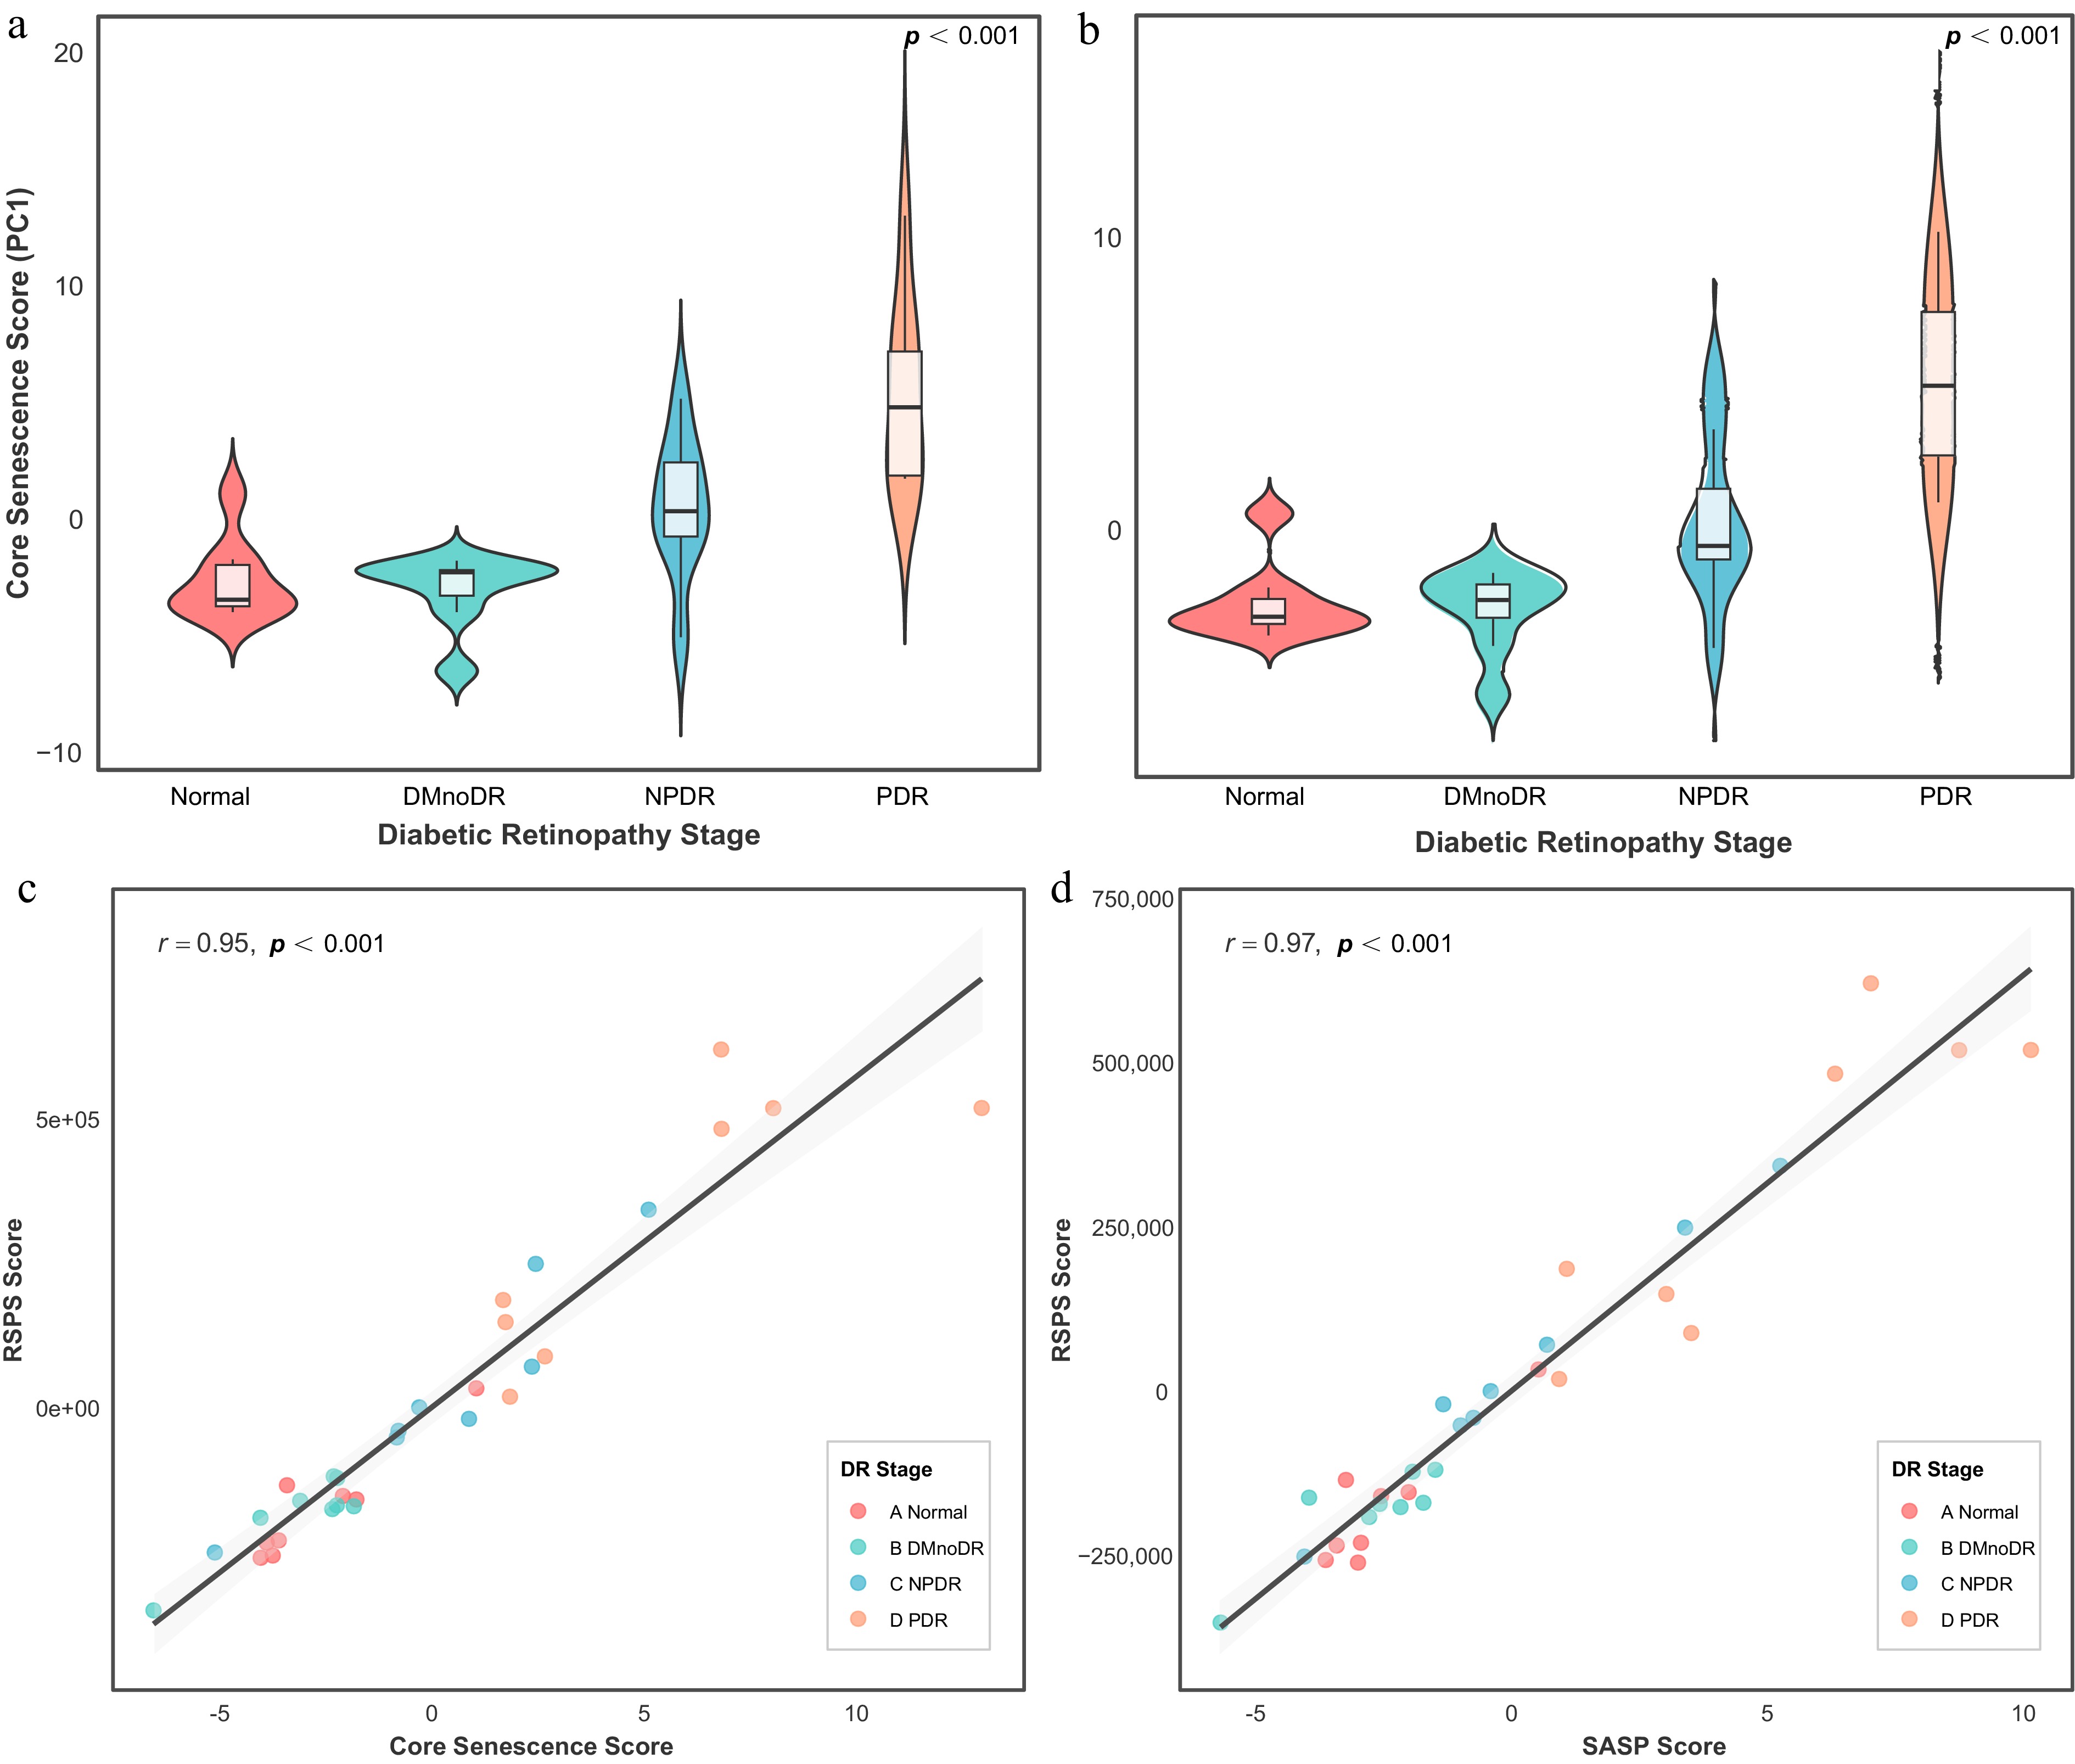
Figure 3.
Association of the RSPS score with senescence-related features. (a, b) Violin plots of core senescence scores (a) and SASP scores (b) across DR stages in the discovery cohort. Overlaid boxplots indicate the median, IQR, and 1.5 × IQR whiskers. (c, d) Correlations between RSPS scores and core senescence scores (c) or SASP scores (d). Shaded areas represent 95% confidence intervals.
-
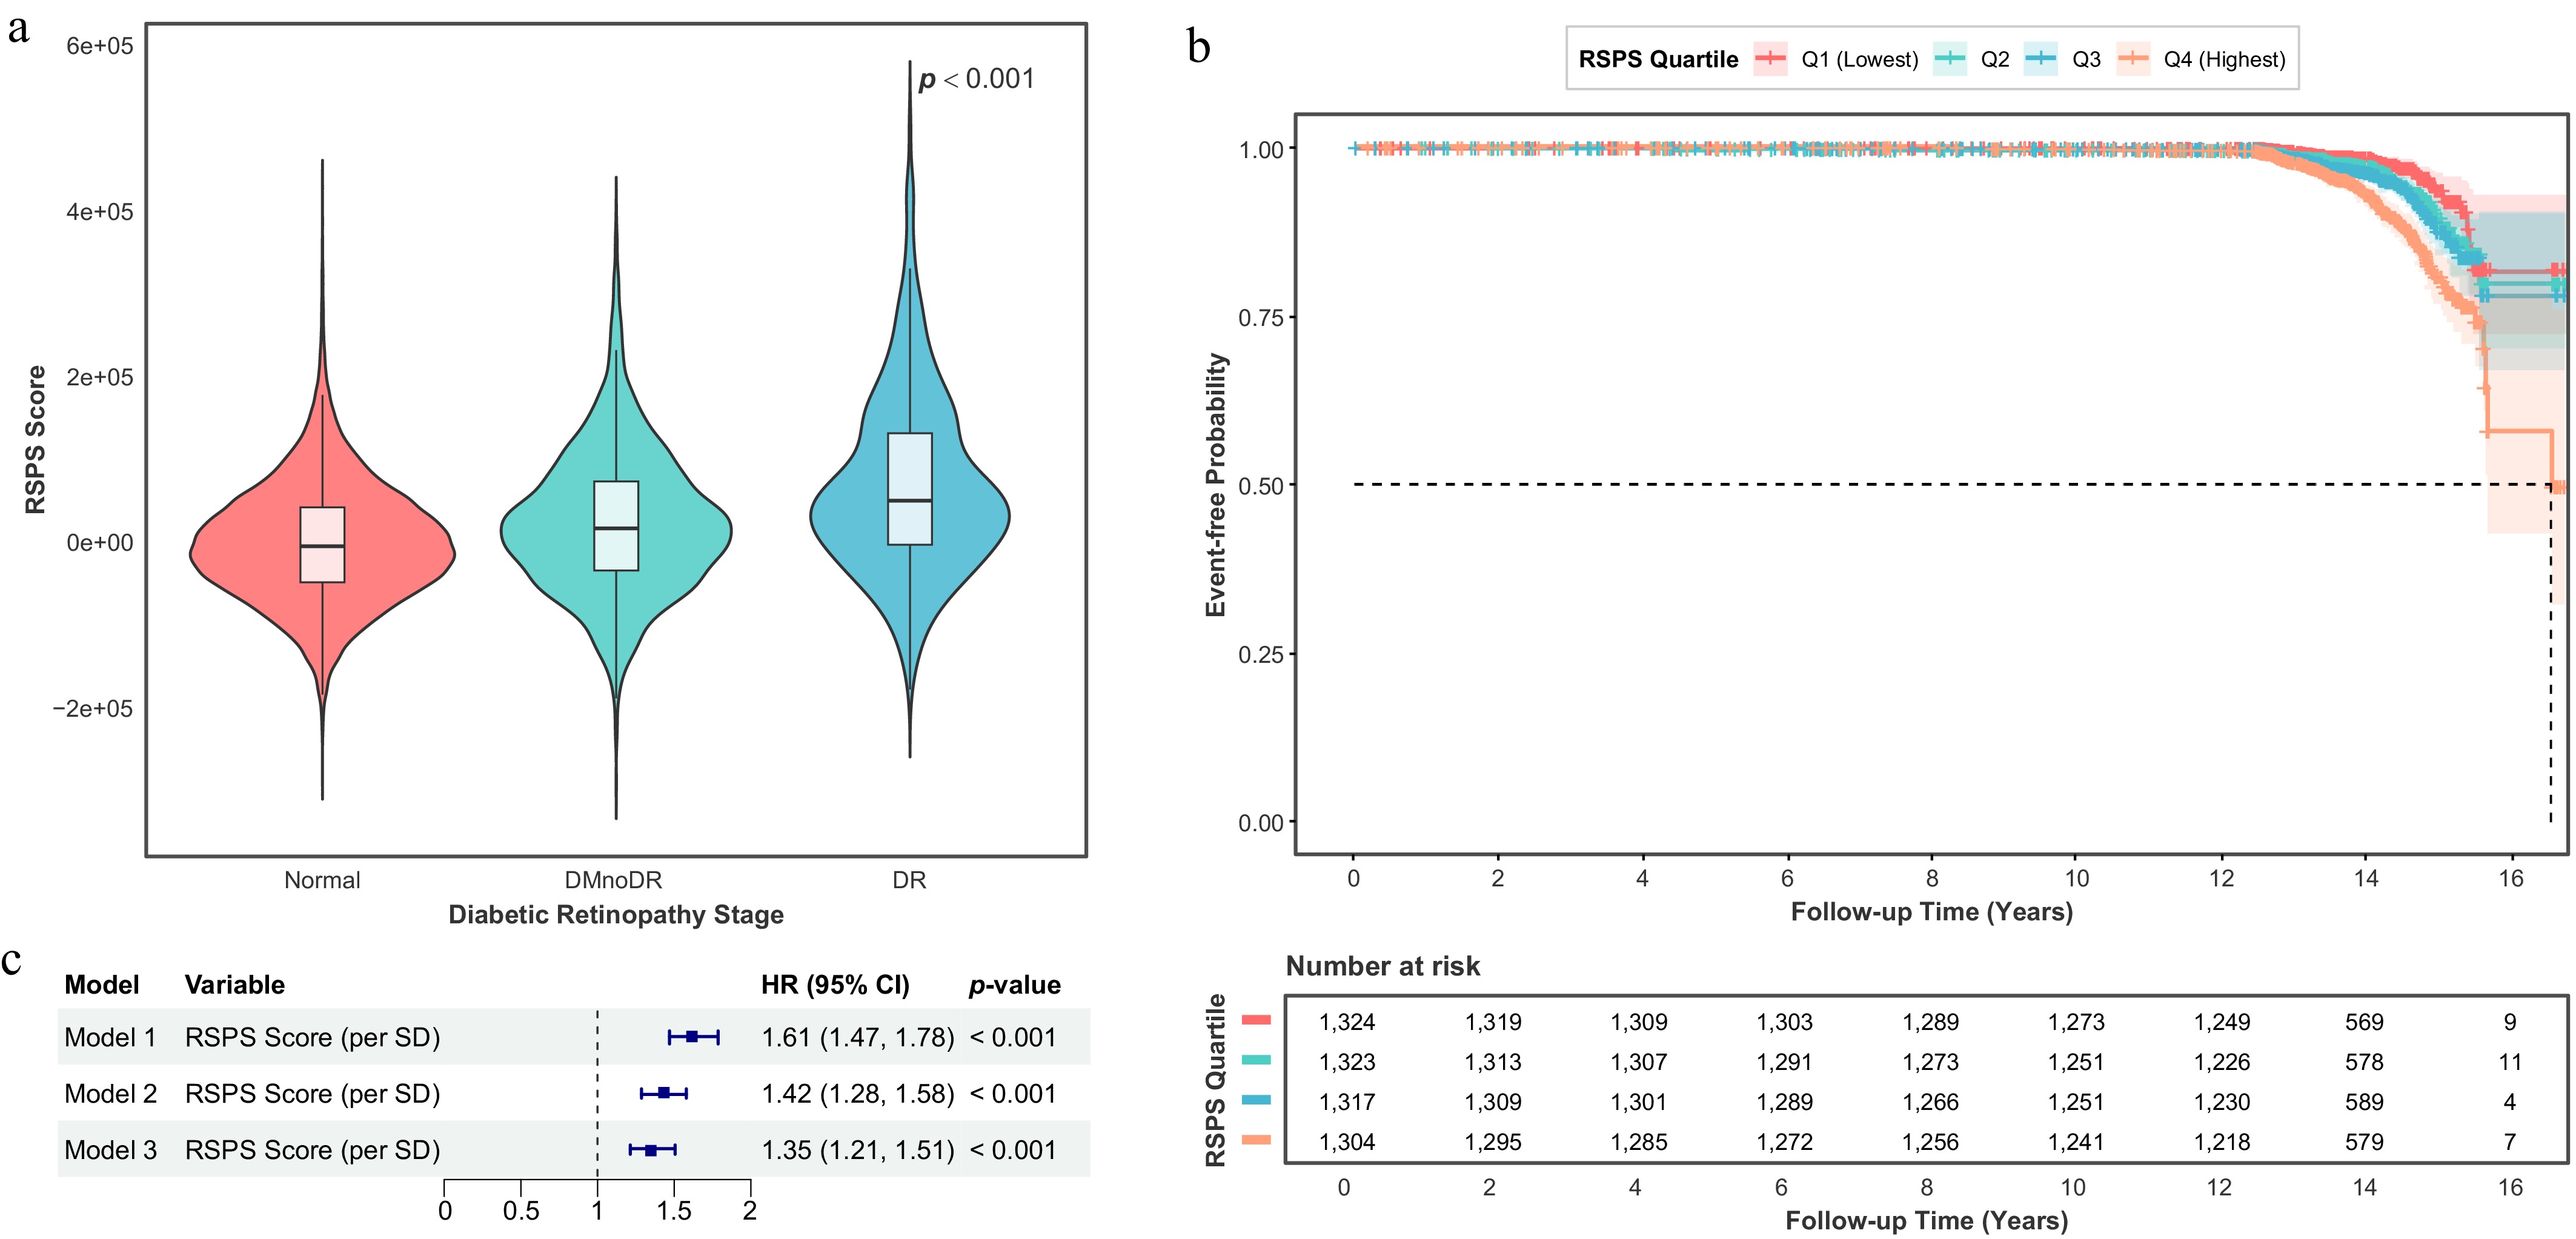
Figure 4.
Validation of the RSPS score in the UKB cohort and survival analyses. (a) Violin plot of RSPS scores across DR stages in the UKB cohort. Overlaid boxplots show the median, IQR, and 1.5 × IQR whiskers. (b) Kaplan–Meier curves for the composite endpoint (DR incidence or all-cause mortality) stratified by baseline RSPS quartiles among participants without DR at baseline. (c) Forest plot of Cox proportional hazard regression analyses evaluating the predictive value of the RSPS score for the composite endpoint. Model 1: Unadjusted. Model 2: Adjusted for age, sex, and ethnicity. Model 3: Additionally adjusted for hypertension, hyperlipidemia, obesity, BMI, and HbA1c based on Model 2.
-
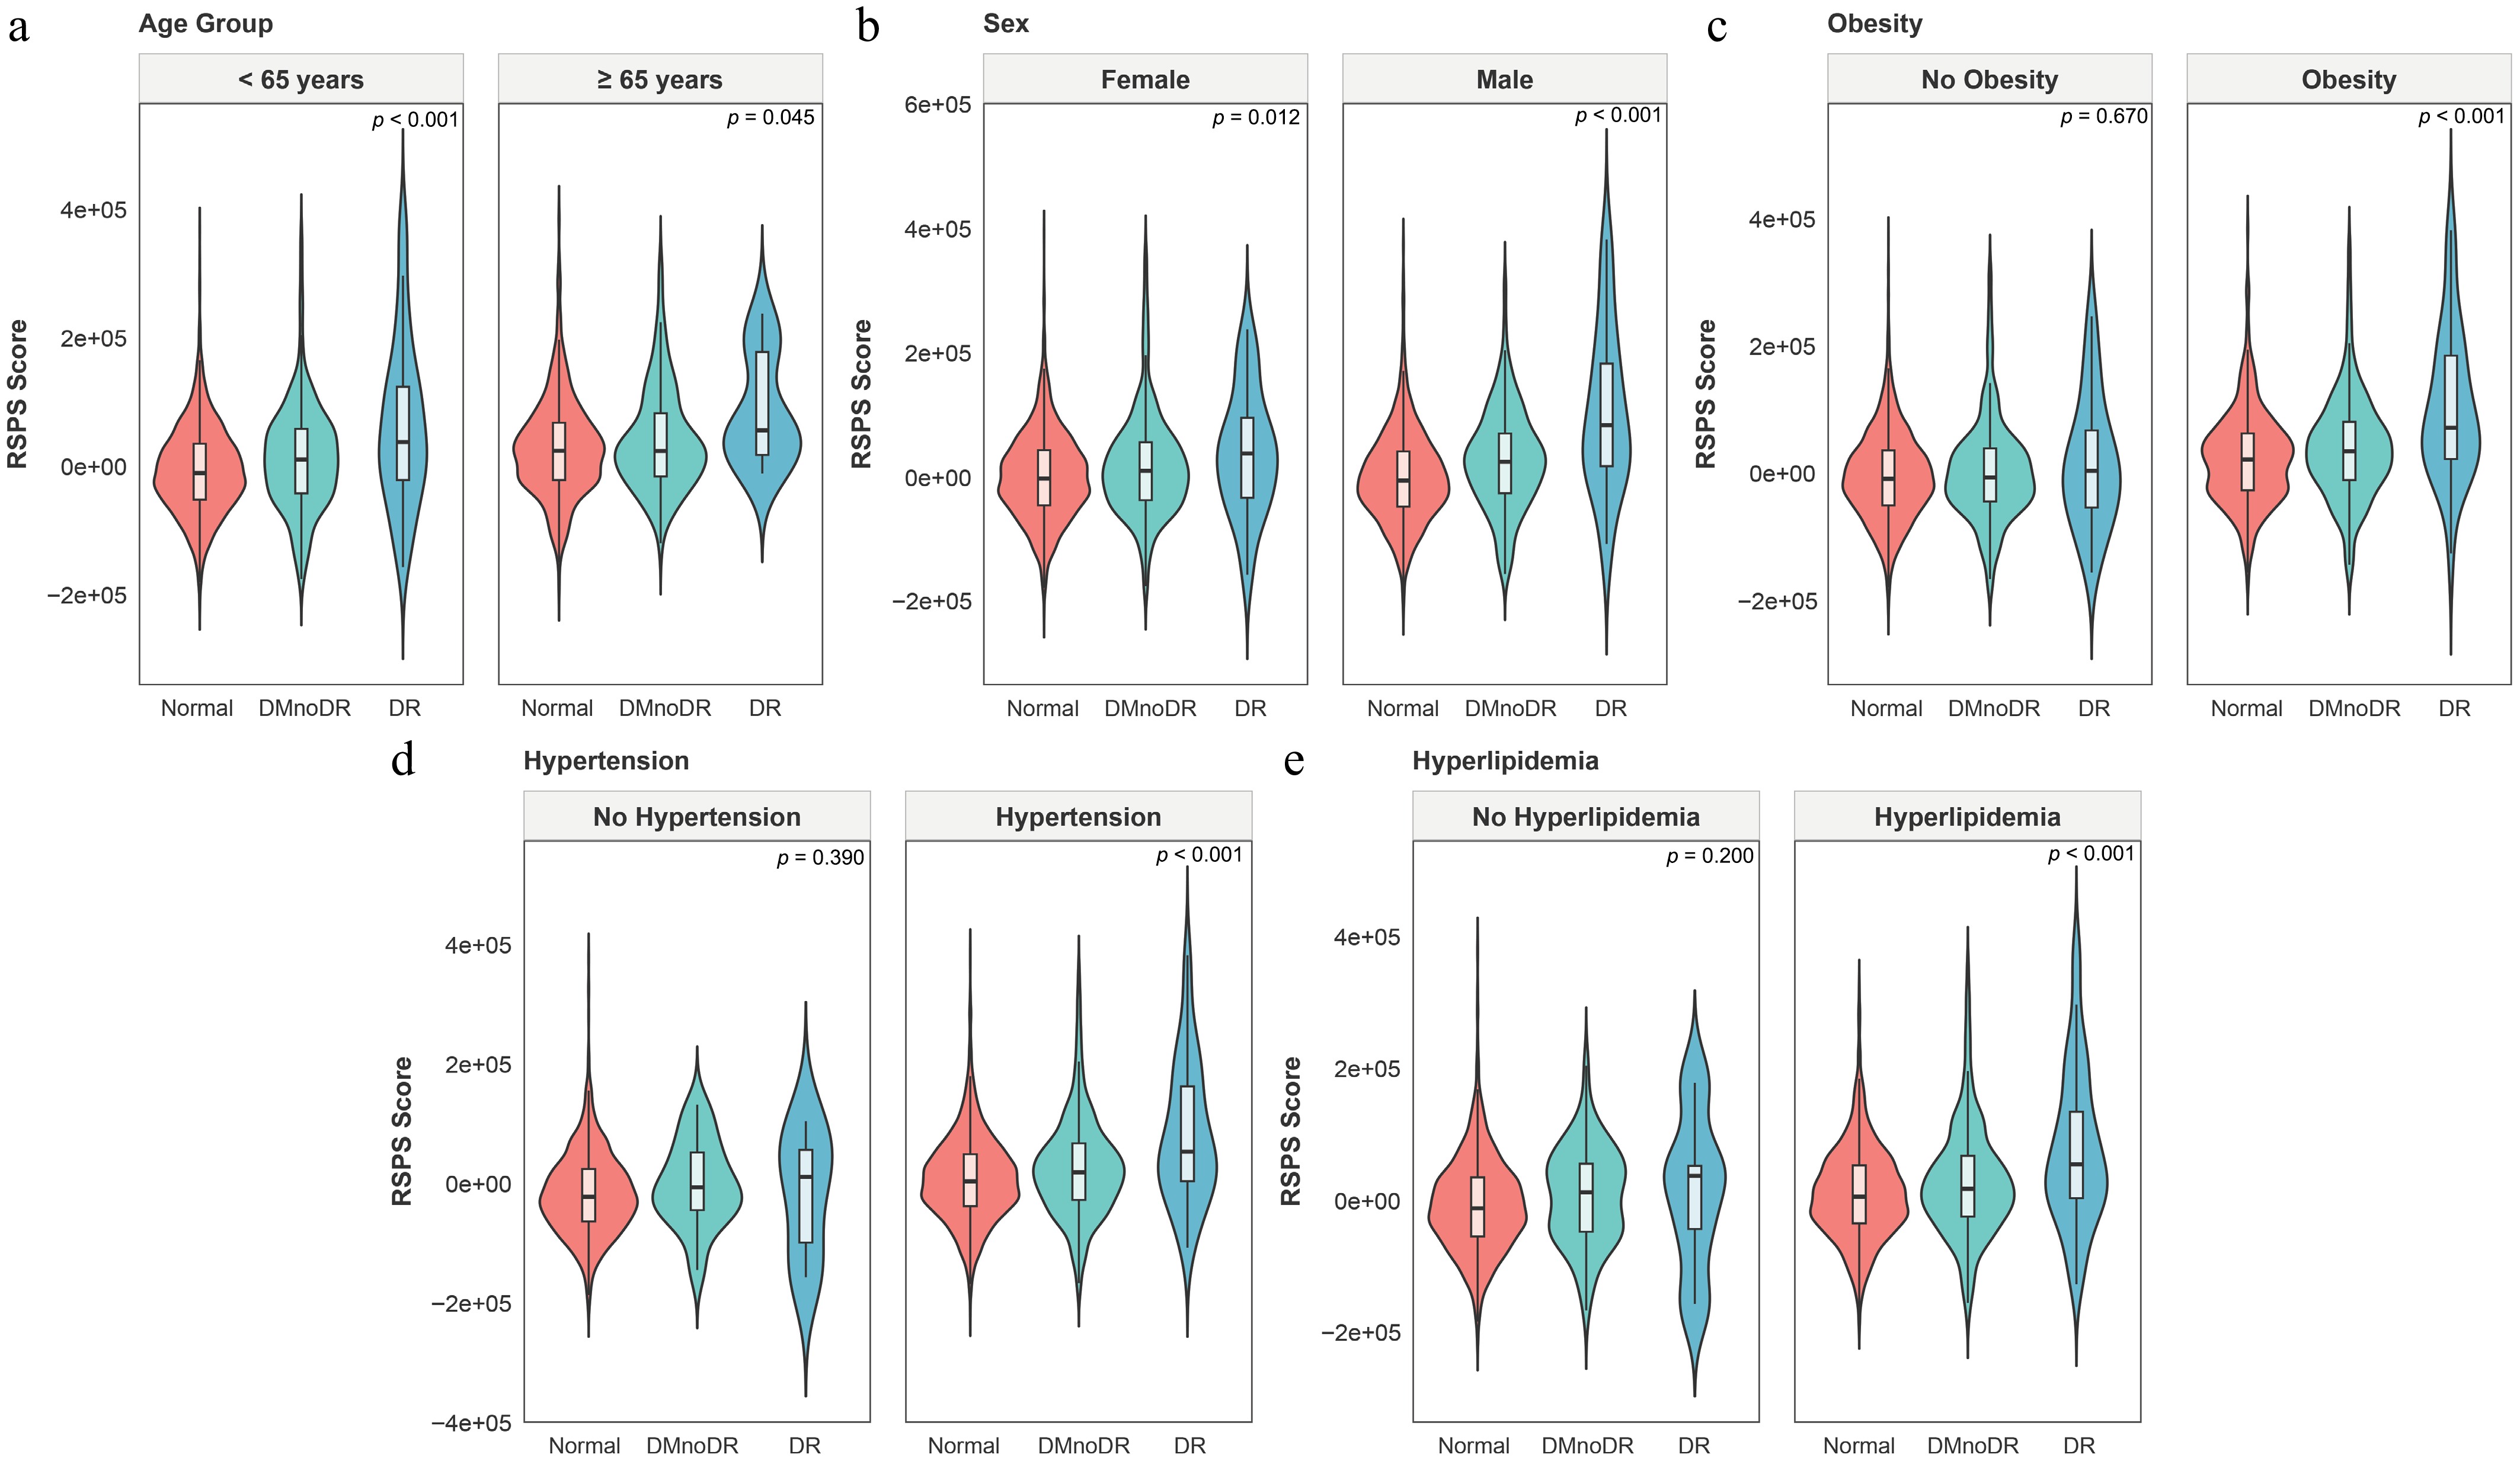
Figure 5.
Stratified analyses of the RSPS score in the UKB cohort. (a–e) Subgroup analyses stratified by age (a), sex (b), obesity (c), hypertension (d), and hyperlipidemia (e). Overlaid boxplots show the median, IQR, and 1.5 × IQR whiskers.
Figures
(5)
Tables
(0)