


-
Diabetic retinopathy (DR) is the leading cause of blindness among working-age populations and the primary cause of vision loss in the elderly worldwide[1]. Globally, the number of DR patients is approximately 100 million, and this number is expected to grow to 160 million by 2045. About one-fifth of these individuals have vision-threatening DR, which includes severe nonproliferative diabetic retinopathy (NPDR) and proliferative diabetic retinopathy (PDR)[2]. As the global population ages, the risk of DR increases significantly with the duration of diabetes, and the number of patients with advanced DR is expected to continue rising[3,4]. Aging, as a complex and multifactorial process, has been shown to play a critical role in the onset and progression of DR[5,6]. Therefore, exploring the relationship between aging and DR's progression is essential for alleviating the socioeconomic burden of DR.
Cellular senescence (CS), a hallmark of aging, is suggested to play a crucial role in the development of DR and the progression from NPDR to PDR[5,7,8]. In a hyperglycemic environment, retinal endothelial cells (RECs) and pericytes undergo senescence caused by DNA damage, mitochondrial dysfunction, and telomere shortening[9]. These senescent cells lose their function and exhibit irreversible cell cycle arrest and activation of the senescence-associated secretory phenotype (SASP). SASP factors, including vascular endothelial growth factor (VEGF), interleukin (IL)-6, and matrix-degrading enzymes, contribute to inflammation and tissue damage[10]. These core SASP factors compromise the integrity of the blood–retinal barrier (BRB)[4], promote pathological neovascularization, and recruit immune cells to exacerbate local inflammatory responses, thereby driving the key pathological processes of PDR[11,12]. Additionally, senescent cells may worsen insulin resistance and oxidative stress, forming a vicious cycle with hyperglycemia, further promoting the progression from NPDR to PDR[13]. These findings collectively support an important role for retinal senescence in the progression of DR.
In recent years, aging scores have been used as a method to assess biological aging and predict DR risk[14]. Compared with traditional chronological age, aging scores based on molecular characteristics or clinical indicators more accurately reflect the actual biological aging status of the body. It has been reported that biological age (BA) or phenotypic age (PA) is significantly associated with the DR risk, whereas chronological age shows a weaker correlation[14]. Aging scores can improve the early warning level for DR's progression and help identify high-risk patients in the early stages of DR, thereby facilitating personalized treatment and helping delay the disease's progression[14]. However, there is limited research specifically focusing on the relationship between aging scores and DR's progression, and some of these scores rely on subjective patient-reported data, which may not accurately reflect the individual's true biological phenotype. For instance, many aging scores rely on self-reported lifestyle and health status, which may not fully reflect the individual's actual physiological age and aging process[15,16]. In the context of ocular diseases, especially DR, there remains a lack of clinically applicable, retina-relevant biomarkers that can reflect local senescence-related biological changes and their association with disease progression[17]. This gap limits our ability to translate the concept of CS into risk stratification and therapeutic targeting in DR. The aqueous humor, as an intraocular fluid adjacent to posterior segment tissues, has been reported to reflect molecular alterations associated with retinal and vascular pathology, providing a biologically relevant window into local ocular disease-related processes.
Therefore, we propose a novel senescence-associated signature derived from the aqueous humor's proteomics and clinical data and validate it using plasma proteomics from the UK Biobank (UKB,
www.ukbiobank.ac.uk ). This new score serves as a reliable predictor of DR's progression and is closely linked to core aging genes and SASP factors, providing new insights into evaluating DR's progression and reducing the risk of blindness in an aging population. -
Proteomic data from human aqueous humor samples were retrieved from the Guangdong DR Multiple-Omics Study (GD-RMOS) as the discovery cohort. These samples were analyzed using the SomaScan Assay v4.1 platform (SomaLogic, USA), which utilizes SOMAmer (Slow Off-rate Modified Aptamer) reagents for multiplexed protein detection, with a total of 6,379 proteins quantified. Ethical approval was obtained from the institutional review board (the Medical Research Ethics Committee of the Guangdong Provincial People's Hospital, ID: KY2024-316-03), and the study adhered to the Declaration of Helsinki. Written informed consent was obtained from all enrolled patients. These samples were collected from 32 patients across different stages of DR, including healthy controls (normal), those with diabetes mellitus without retinopathy (DMnoDR), and NPDR and PDR patients. Clinical baseline information, including age, gender, and glycated hemoglobin (HbA1c) levels, were also recorded. Known aging-related genes were sourced from the CellAge database and SASP datasets under stimulation by ionizing radiation (IR), inducible RAS overexpression (RAS), and atazanavir treatment (ATV). For external validation and survival analysis, proteomic data of the plasma from 53,014 participants in the UKB were used. The UKB proteomic data were generated using a targeted immunoassay platform (Olink panels). DR severity in this cohort was classified into three stages according to the clinical records: Healthy controls (normal), diabetes mellitus without DR (DMnoDR), and DR. The International Classification of Diseases (10th Revision) (ICD-10) codes were used for DMnoDR (ICD-10 codes E10-E14) and DR (ICD-10 code H36.0). Among the 307 retinal senescence protein signature (RSPS) proteins identified in the discovery cohort, 138 (45.0%) were quantifiable on this targeted platform and were used for score calculation in the validation cohort. The survival analysis was followed up until December 31, 2022. UKB participants provided written informed consent at enrollment, and the present study was conducted according to approved UKB application procedures. UKB application procedures (approval number: 86091), and received ethical approval from the North West – Haydock Research Ethics Committee (No. 21/NW/0157).
Proteomic data were preprocessed by constructing an expression matrix. For proteins with repeated annotations, the method of calculating the average expression was used to merge entries. The external validation cohort used strict complete-case analysis to directly exclude individuals with any missing values in the candidate protein profiles. In addition, proteins with extremely low expression variances (close to zero) were also filtered to ensure the robustness of downstream statistical modeling. Sample metadata (including DR stage) were mapped according to the patients' ID and merged with clinical variables. Quality control (QC) included visual checks for data distribution and sample clustering. Density plots of log2-transformed protein expression values were generated to assess the samples' consistency and exclude batch effects or outliers. Principal component analysis (PCA) was performed on the scaled expression matrix to assess separation by DR stage, with the first two principal components (PCs) visualized and annotated by stage. Adequate clustering by disease severity indicated good data quality and suitability for downstream analysis.
Definition of the RSPS
-
To identify proteins whose expression level correlated with DR's progression, a multivariable linear regression model was applied. DR stage (normal = 1, DMnoDR = 2, NPDR = 3, PDR = 4) was used as the independent variable, with protein expression levels as the dependent variable, adjusting for covariates such as age and HbA1c. To assess the robustness of the primary screening results to the linear coding assumption, a sensitivity analysis was conducted using proportional odds ordinal logistic regression models, with DR stage treated as an ordered categorical outcome (normal < DMnoDR < NPDR < PDR) and individual protein expression levels entered as predictors, adjusting for age and HbA1c. Proteins with regression coefficients of >0 and p-values < 0.05 for the DR stage were selected as proteins associated with DR's progression.
To find proteins that are upregulated in DR and involved in the aging process, we matched the selected proteins related to DR's progression with known aging genes from the CellAge database and SASP datasets. This intersection was performed on the basis of gene symbols. This intersection formed the core candidate list for theRSPS. Weighted RSPS scores were then constructed, using the linear regression's t-statistics as weights, reflecting the strength of the association between the RSPS and DR's progression. Protein expression values for RSPS proteins were first z-score-normalized across samples, and the weighted sum of the scores was calculated for each sample. Z-score normalization was applied within each cohort to standardize protein expression levels. This ensures that the composite score reflects relative expression patterns rather than absolute expression values, thereby minimizing the influence of scale differences across datasets profiled using different platforms. The RSPS score for each patient
$ j $ $ n $ $ n $ $ {{RS PS\;S core}}_{{j}}=\sum \limits_{{i=1}}^{{n}}{(}{{w}}_{{i}} \times {{E}}_{{i,j}}{)} $ where, Ei,j represents the normalized expression level (Z-score) of protein i in patient j, and wi represents the weight of protein i, derived from the t-statistic of the multivariable linear regression model (adjusting for age and HbA1c) in the discovery phase, reflecting the strength and direction of its association with DR's progression. The Kruskal–Wallis' test was used to compare RSPS scores across DR stages in the discovery cohort.
Weighted gene co-expression network analysis
-
To uncover the functional co-expression patterns of the RSPS genes, we performed a weighted gene co-expression network analysis (WGCNA) of the transposed expression matrix. The soft-thresholding power was selected according to the scale-free topology fit index (R2 > 0.85) and average connectivity. Modules were identified using an unsigned topological overlap matrix (TOM), with a minimum module size of 5, deepSplit = 2, and a merging threshold of 0.05. The first principal component of each module, referred to as the module eigengene (ME), was calculated.
We assessed the module–trait relationships by calculating the Pearson correlation coefficients and p-values between the MEs and the numerical DR stages, which were visualized in a heatmap. The module with the highest absolute correlation coefficient with DR's progression was selected for further analysis. Fisher's exact test was used to evaluate the enrichment of RSPS candidate genes within the module, and the distribution of RSPS genes across modules was quantified and visualized.
Functional enrichment analysis and association with RSPS
-
To further understand the biological significance of the RSPS, we performed Gene Ontology (GO) biological process and Kyoto Encyclopedia of Genes and Genomes (KEGG,
https://www.kegg.jp/ ) pathway enrichment analyses for RSPS candidate genes and key WGCNA modules. Gene symbols were converted to Entrez IDs for the enrichment tests, and multiple testing corrections were applied using the Benjamini–Hochberg procedure (adjusted p < 0.05). The top 15 enriched terms were visualized in a dot plot, with the dots' size representing gene count and color indicating the adjusted p-values.External validation and survival analysis
-
To further validate the ability of RSPS score to capture aging signals, we calculated two additional aging scores: one based on 96 core cellular senescent genes curated from the literature[18] and the second based on the SASP gene set from the Molecular Signatures Database (MSigDB) database. Pearson's correlation analysis was used to evaluate the correlation between these scores and the RSPS, and the scores were visualized across DR stages using violin box plots with Kruskal–Wallis tests to assess group differences.
For evaluating the clinical applicability and robustness of RSPS, we performed external validation in the UKB cohort. RSPS scores were calculated using the weighted model from the discovery phase and tested for association with DR severity using the Kruskal–Wallis test. Stratified analyses were performed by comorbidity (hypertension, hyperlipidemia, obesity), age groups (< 65 years vs ≥ 65 years), and gender to examine RSPS trends within each DR stage.
The prognostic value of baseline RSPS quartiles for all-cause mortality, new-onset DR (in participants initially without DR), and a composite endpoint (new-onset DR or death) was evaluated through survival analysis. Follow-up time was calculated from recruitment until the event or censoring. Kaplan–Meier survival curves were generated, and log-rank tests were used to compare group differences. In participants without DR at baseline, Cox proportional hazards regression models were used to assess the predictive value of RSPS for the composite endpoint. Three hierarchical models were constructed: Model 1 (unadjusted), Model 2 (adjusted for age, sex, and ethnicity), and Model 3 (further adjusted for hypertension, hyperlipidemia, obesity, body mass index [BMI], and HbA1c). Hazard ratios (HRs) for RSPS per standard deviation of increase and their 95% confidence intervals (CIs) were reported.
Preparation of the Connectivity Map gene list
-
To explore potential therapeutic strategies targeting retinal cell aging in DR, we prioritized RSPS genes within the key WGCNA module by sorting them according to their linear regression t-statistics. The top 150 genes were submitted to the Connectivity Map (CMap) database for drug repurposing analysis, with a focus on upregulated genes to reverse features of aging.
Statistical analysis
-
Statistical analyses were conducted using R (version 4.5.2). Nonparametric tests (e.g., Kruskal–Wallis) were used for non-normally distributed data. Pearson's or Spearman's correlation methods were applied as appropriate. Multiple testing corrections in the enrichment analyses were performed using the Benjamini–Hochberg procedure to control the false discovery rate (FDR), with a significance threshold set at an adjusted p-value < 0.05. All statistical tests were two-sided, and p-values < 0.05 were considered statistically significant.
-
The baseline clinical characteristics of the discovery cohort are provided in Supplementary Table S1. This cohort included eight individuals in each group: Normal, DMnoDR, NPDR, and PDR. Baseline information for the 53,014 UKB participants used for external validation and survival analysis is shown in Supplementary Table S2. Among them, 49,580 were normal, 3,025 had DMnoDR, and 409 had DR. In total, 9,478 participants (18%) were younger than 65 years, and 43,536 (82%) were older than 65 years; 54% of the participants were male.
Protein expression levels of the discovery cohort were log2-transformed and normalized, and then a density plot of all samples was generated (Supplementary Fig. S1a). The overall distribution followed typical patterns of proteomic datasets, with no evidence of global distribution abnormalities. The normalized data structure was consistent with expectations. The PCA of all samples is shown in Supplementary Fig. S1b. PC1 and PC2 explained 45.4% and 15% of the variance, respectively. In the PCA plot, the stages labeled as A (normal) and B (DMnoDR) exhibited broader dispersion along PC2, whereas Stages C (NPDR) and D (PDR) clustered near the center with substantial overlap. This pattern indicates a separation trend between early (A and B) and late (C and D) disease stages. The results suggest that the scaled samples clustered appropriately according to disease severity, and no apparent batch effects were detected, supporting the reliability of subsequent downstream analyses.
Identification of candidate RSPS proteins
-
We applied a three-step proteomic filtering workflow (Supplementary Fig. S2). From the initial 6,379 quantified proteins, multivariable linear regression identified 1,228 proteins positively associated with DR severity (Supplementary Table S3). Sensitivity analysis using proportional odds ordinal logistic regression showed that 79.6% of proteins identified in the primary linear trend analysis remained significantly associated with DR stage (p < 0.05), with the effect directions consistent with increasing disease severity (Supplementary Fig. S3). Cross-referencing these proteins with the CellAge database (Supplementary Table S4) and the SASP datasets (Supplementary Table S5–S7) further narrowed the list to 307 RSPS candidate genes (Supplementary Table S8).
Core co-expression network driving DR's progression
-
To characterize the functional interaction patterns among the 1,228 DR-associated proteins, a WGCNA was performed to construct an unsigned weighted co-expression network. The soft-thresholding power β was selected according to the scale-free topology criterion (Fig. 1a). As the β-value increased, the scale-free topology fit index (R2) and network heterogeneity both increased, whereas network density and centralization gradually decreased (Fig. 1b).
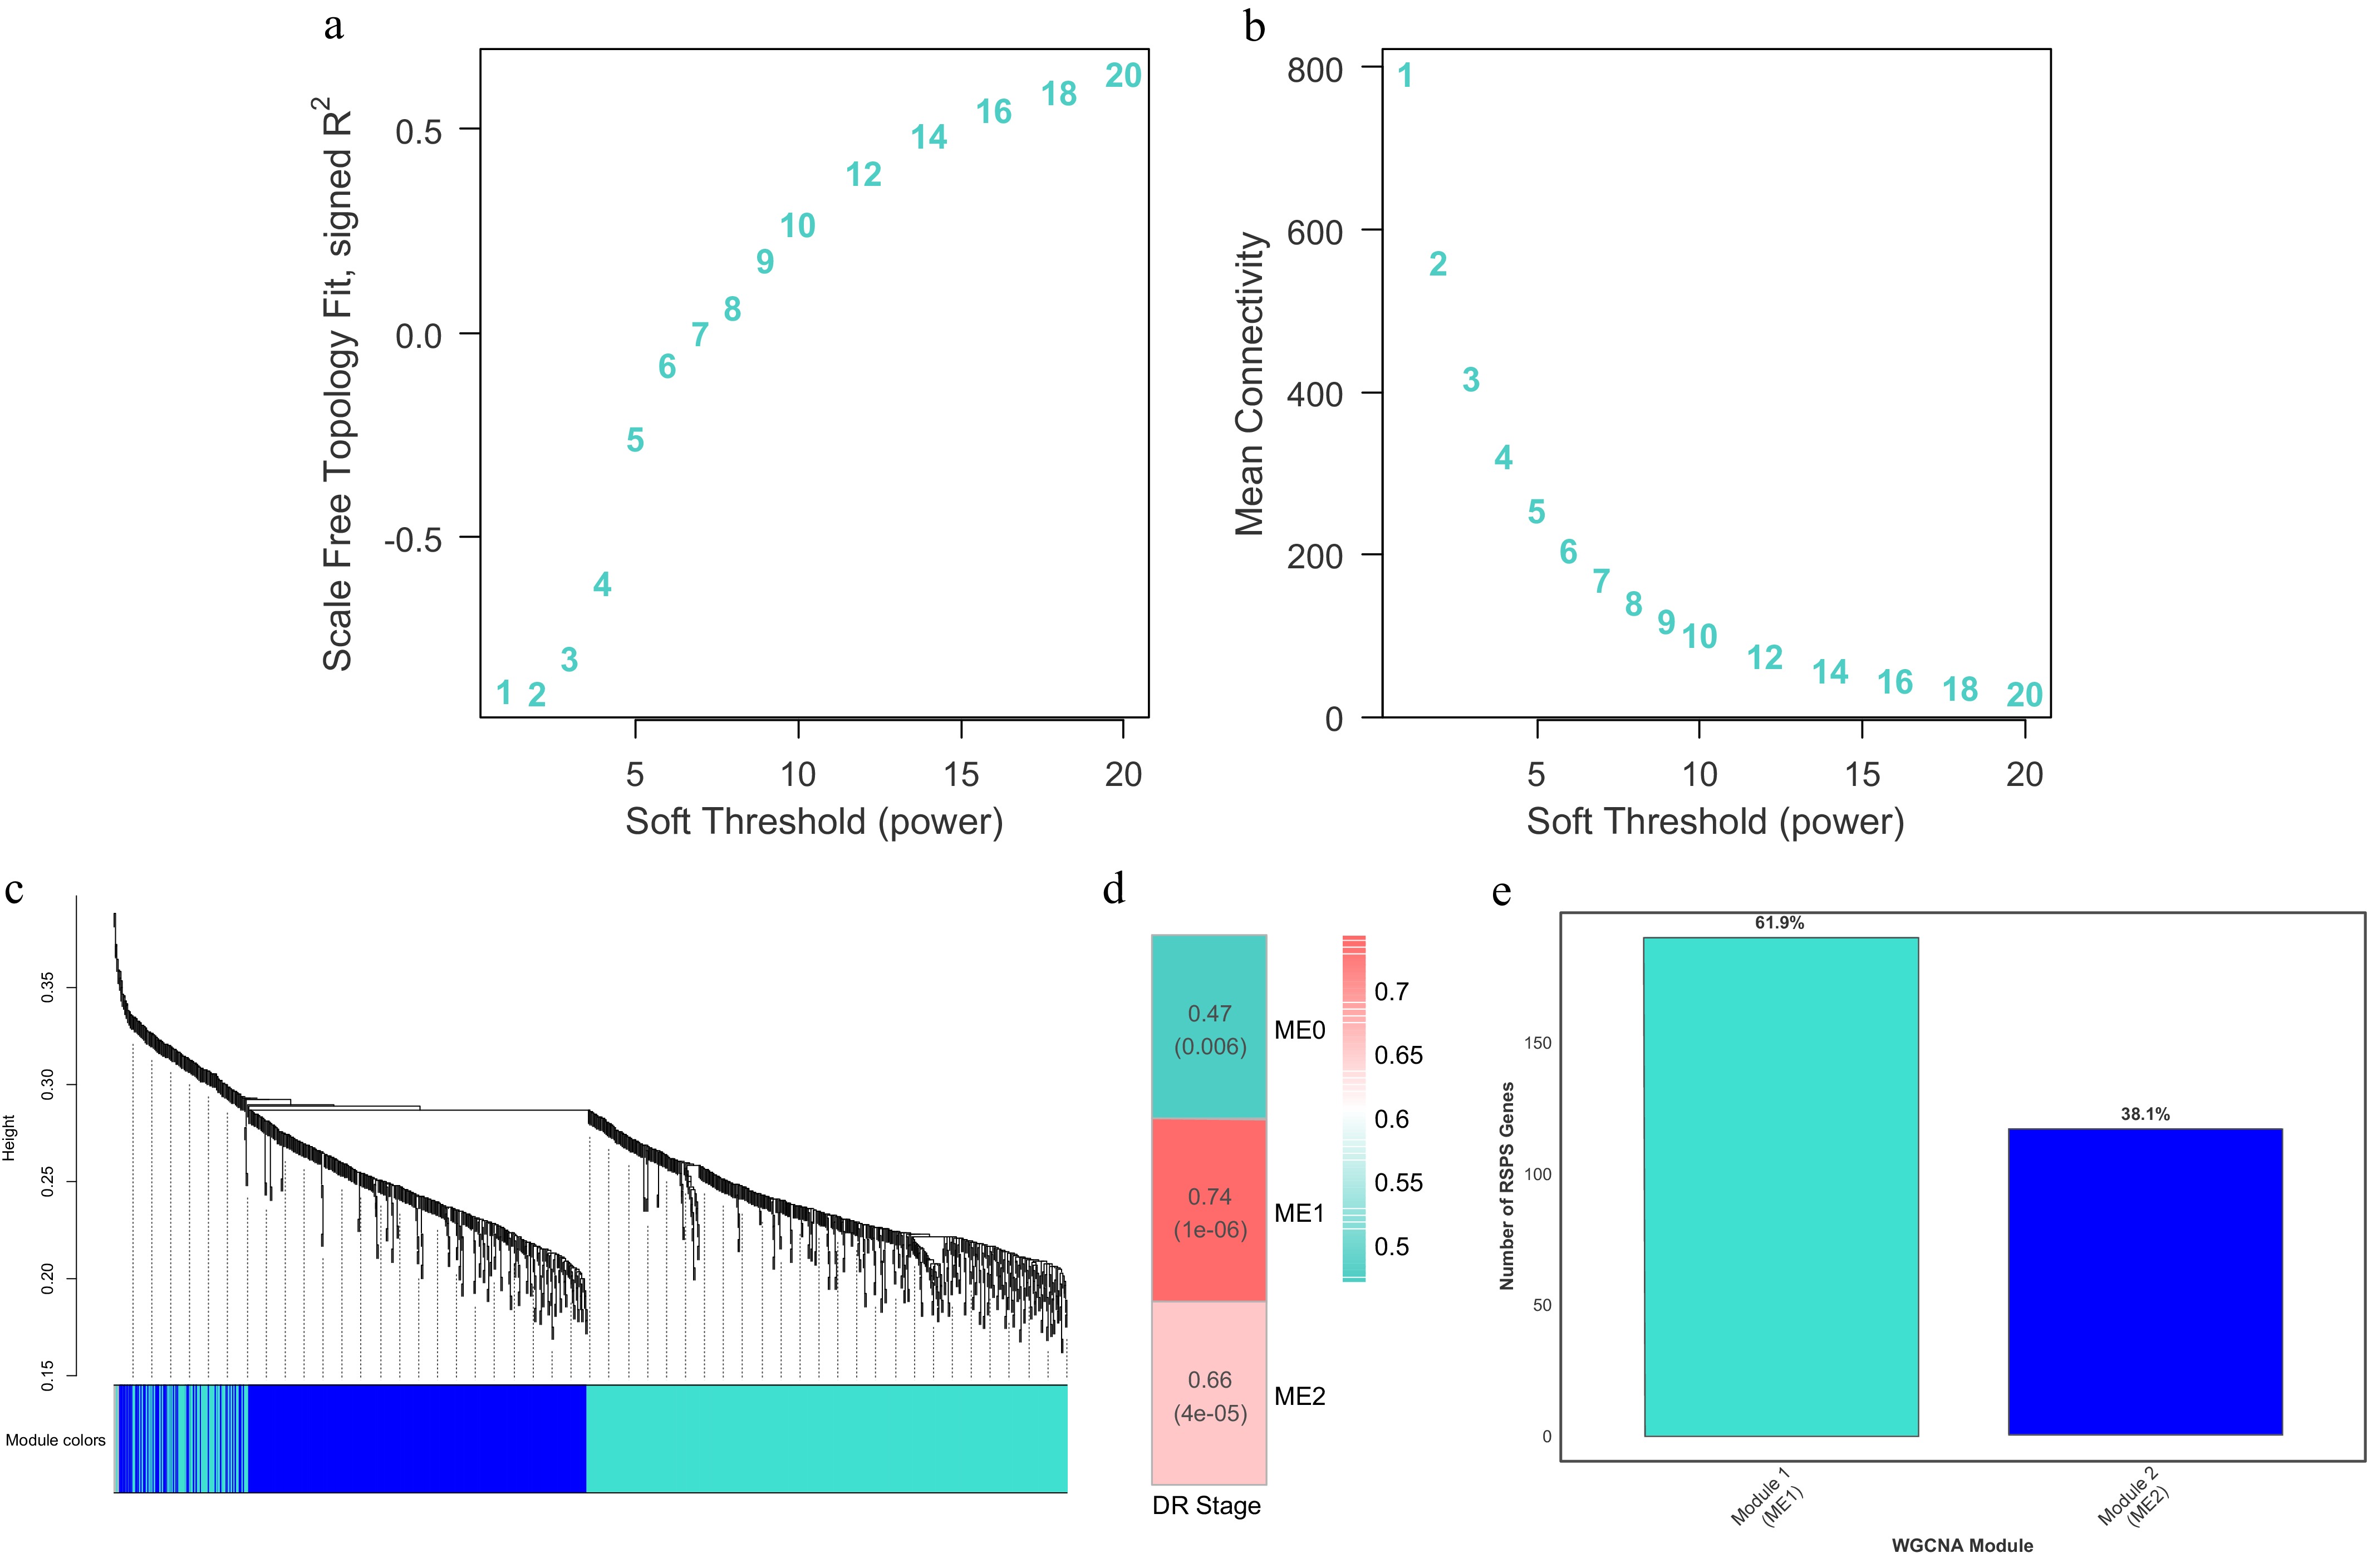
Figure 1.
Construction of the WGCNA and module localization of RSPS genes. (a, b) Soft-thresholding power selection analyses showing the scale-free topology fit index (a) and mean connectivity (b) as a function of the soft-thresholding power. (c) Hierarchical clustering dendrogram of proteins based on topological overlap dissimilarity (1 − TOM), with the identified co-expression modules labeled by distinct colors. (d) Heatmap of correlations between MEs and clinical DR stages. Numbers in each cell indicate Pearson's correlation coefficients and the corresponding p-values. (e) Distribution and percentage of the 307 RSPS candidate genes within the key co-expression modules, Module 1 (ME1) and Module 2 (ME2).
Hierarchical clustering based on the TOM revealed that all proteins included in the analysis could be grouped into several co-expression modules according to their expression patterns (Fig. 1c). The dynamic tree-cutting algorithm identified stable and well-defined modules. Among them, Module 1 and Module 2 were the two largest modules, representing groups of proteins with highly consistent expression across samples. The clear module structure indicates that the dataset showed a robust co-expression architecture, providing a solid foundation for identifying DR-relevant modules and their biological functions.
Module–trait associations were assessed using Pearson's correlations and relative p-values between MEs and the numerically coded DR stages. As shown in Fig. 1d, both Module 1 (r = 0.740, p < 0.001) and Module 2 (r = 0.660, p < 0.001) showed significant correlations with DR severity. Notably, Module 1 exhibited the strongest positive correlation with DR's progression, suggesting that proteins within this module form the core network driving DR's progression (Fig. 1d). Further analysis showed that the majority of the 307 previously defined RSPS candidate genes (approximately 61.9%) were located within Module 1 (Fig. 1e), reinforcing its central role in DR's progression.
Identification and analysis of the RSPS score
-
Based on the 307 candidate proteins, a weighted RSPS scoring model was applied. In the discovery cohort, the RSPS score showed a significant increasing trend with DR's progression (Kruskal–Wallis, p < 0.001). Notably, the mean score in late-stage DR (NPDR and PDR) was markedly higher than that in early-stage disease (normal and DMnoDR), indicating that RSPS effectively reflects DR severity (Fig. 2a). Moreover, the pairwise differences between adjacent DR stages increased progressively, suggesting an enhanced discriminative capability of the RSPS model as the disease severity advances.
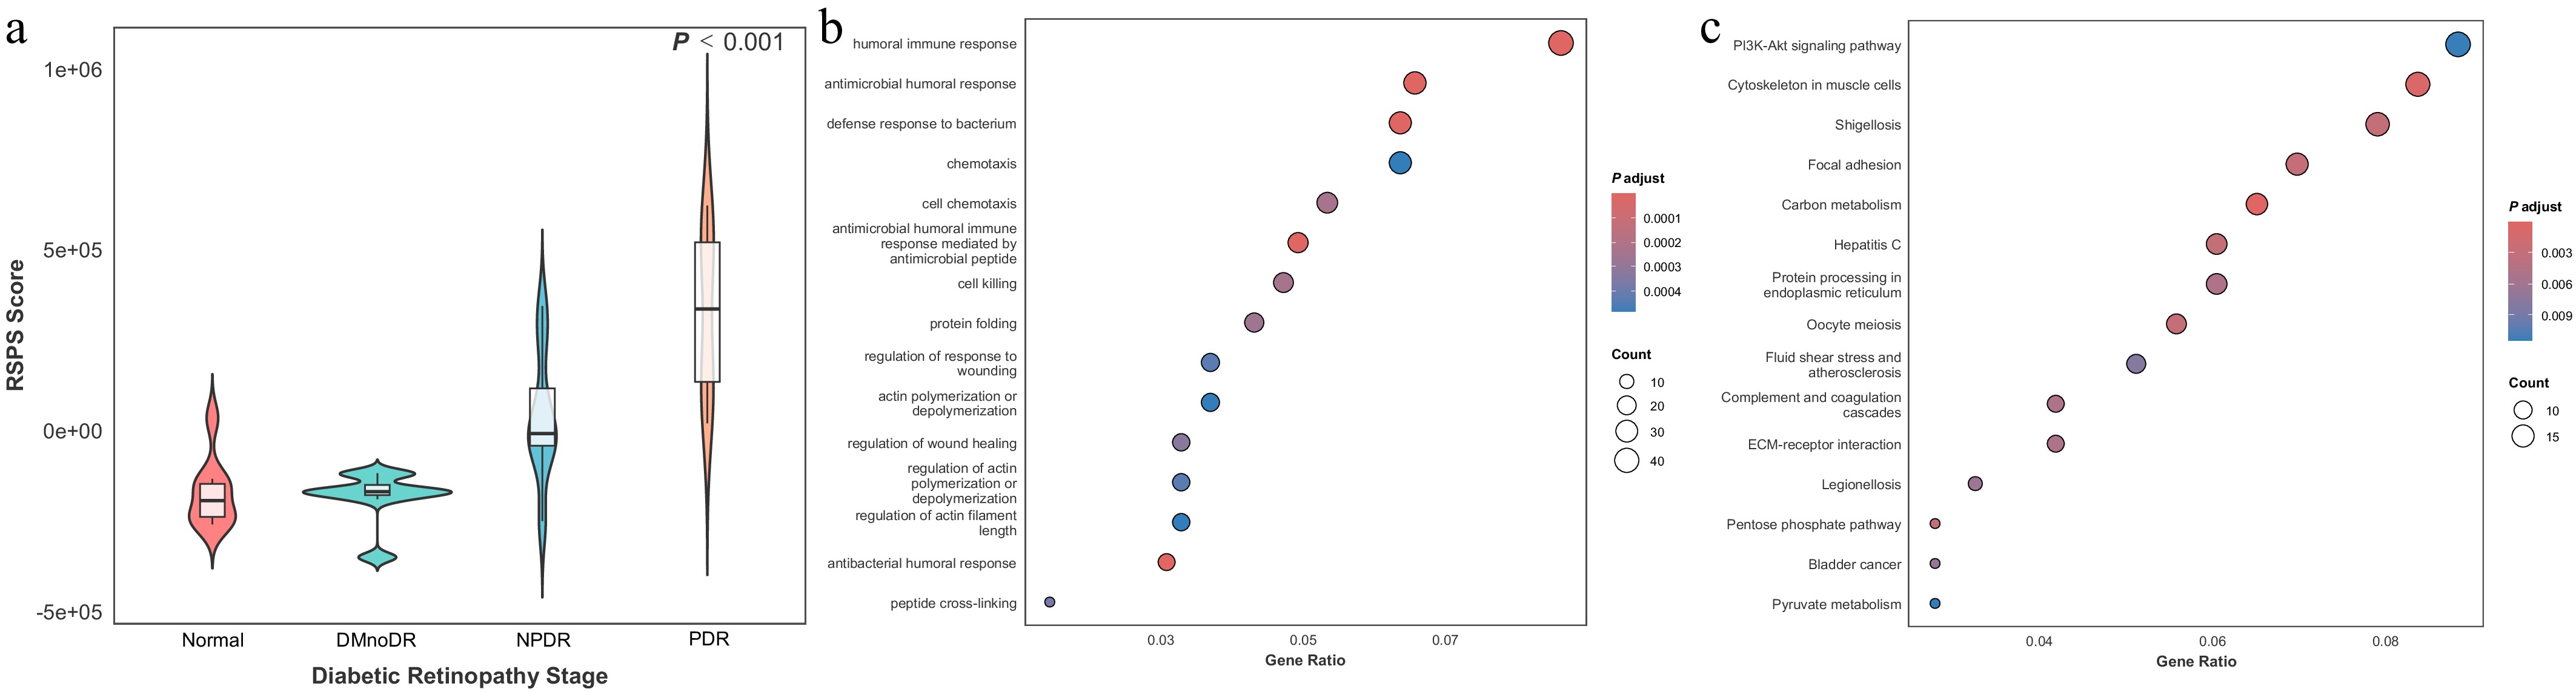
Figure 2.
Identification of the RSPS score and functional enrichment analysis. (a) Violin plot of RSPS scores across DR stages in the discovery cohort. Overlaid boxplots indicate the median (center line), interquartile range (IQR; box boundaries), and whiskers extending to 1.5 × IQR. (b, c) Bubble plots showing GO biological process enrichment (b) and KEGG pathway enrichment (c) for RSPS-related genes.
To further elucidate the biological functions captured by the RSPS, we performed GO and KEGG enrichment analyses on RSPS-related genes. GO biological process analysis indicated that RSPS-related genes are primarily involved in immune and inflammatory responses (Fig. 2b), including humoral immune activity, chemotaxis, and cell death, consistent with increased inflammatory involvement during DR's progression. The enrichment in processes such as wound healing, actin filament remodeling, and protein folding is also consistent with activation of cellular stress responses and homeostatic processes. KEGG pathway analysis further showed the significant enrichment of pathways relevant to vascular and metabolic changes associated with DR (Fig. 2c). In particular, PI3K-Akt signaling and extracellular matrix–receptor interaction pathways were among the top enriched pathways, both of which are functionally related to endothelial cells' survival and extracellular matrix remodeling. The enrichment of protein processing in the endoplasmic reticulum and pyruvate metabolism is likewise consistent with altered proteostasis and metabolic adaptation under chronic hyperglycemic stress.
To evaluate the relationship between the RSPS score and aging-related characteristics, we examined its correlation with established aging metrics (Fig. 3a, b). Spearman's correlation analysis demonstrated that RSPS was strongly positively correlated with the core aging score derived from 96 hallmark senescence genes (ρ = 0.95, p < 0.001; Fig. 3c). Similarly, the RSPS score showed a strong positive correlation with the SASP/inflammatory score constructed from inflammatory mediators (r = 0.97, p < 0.001; Fig. 3d). These findings suggest that the RSPS score may serve as an indicator of CS and associated inflammatory phenotypes.
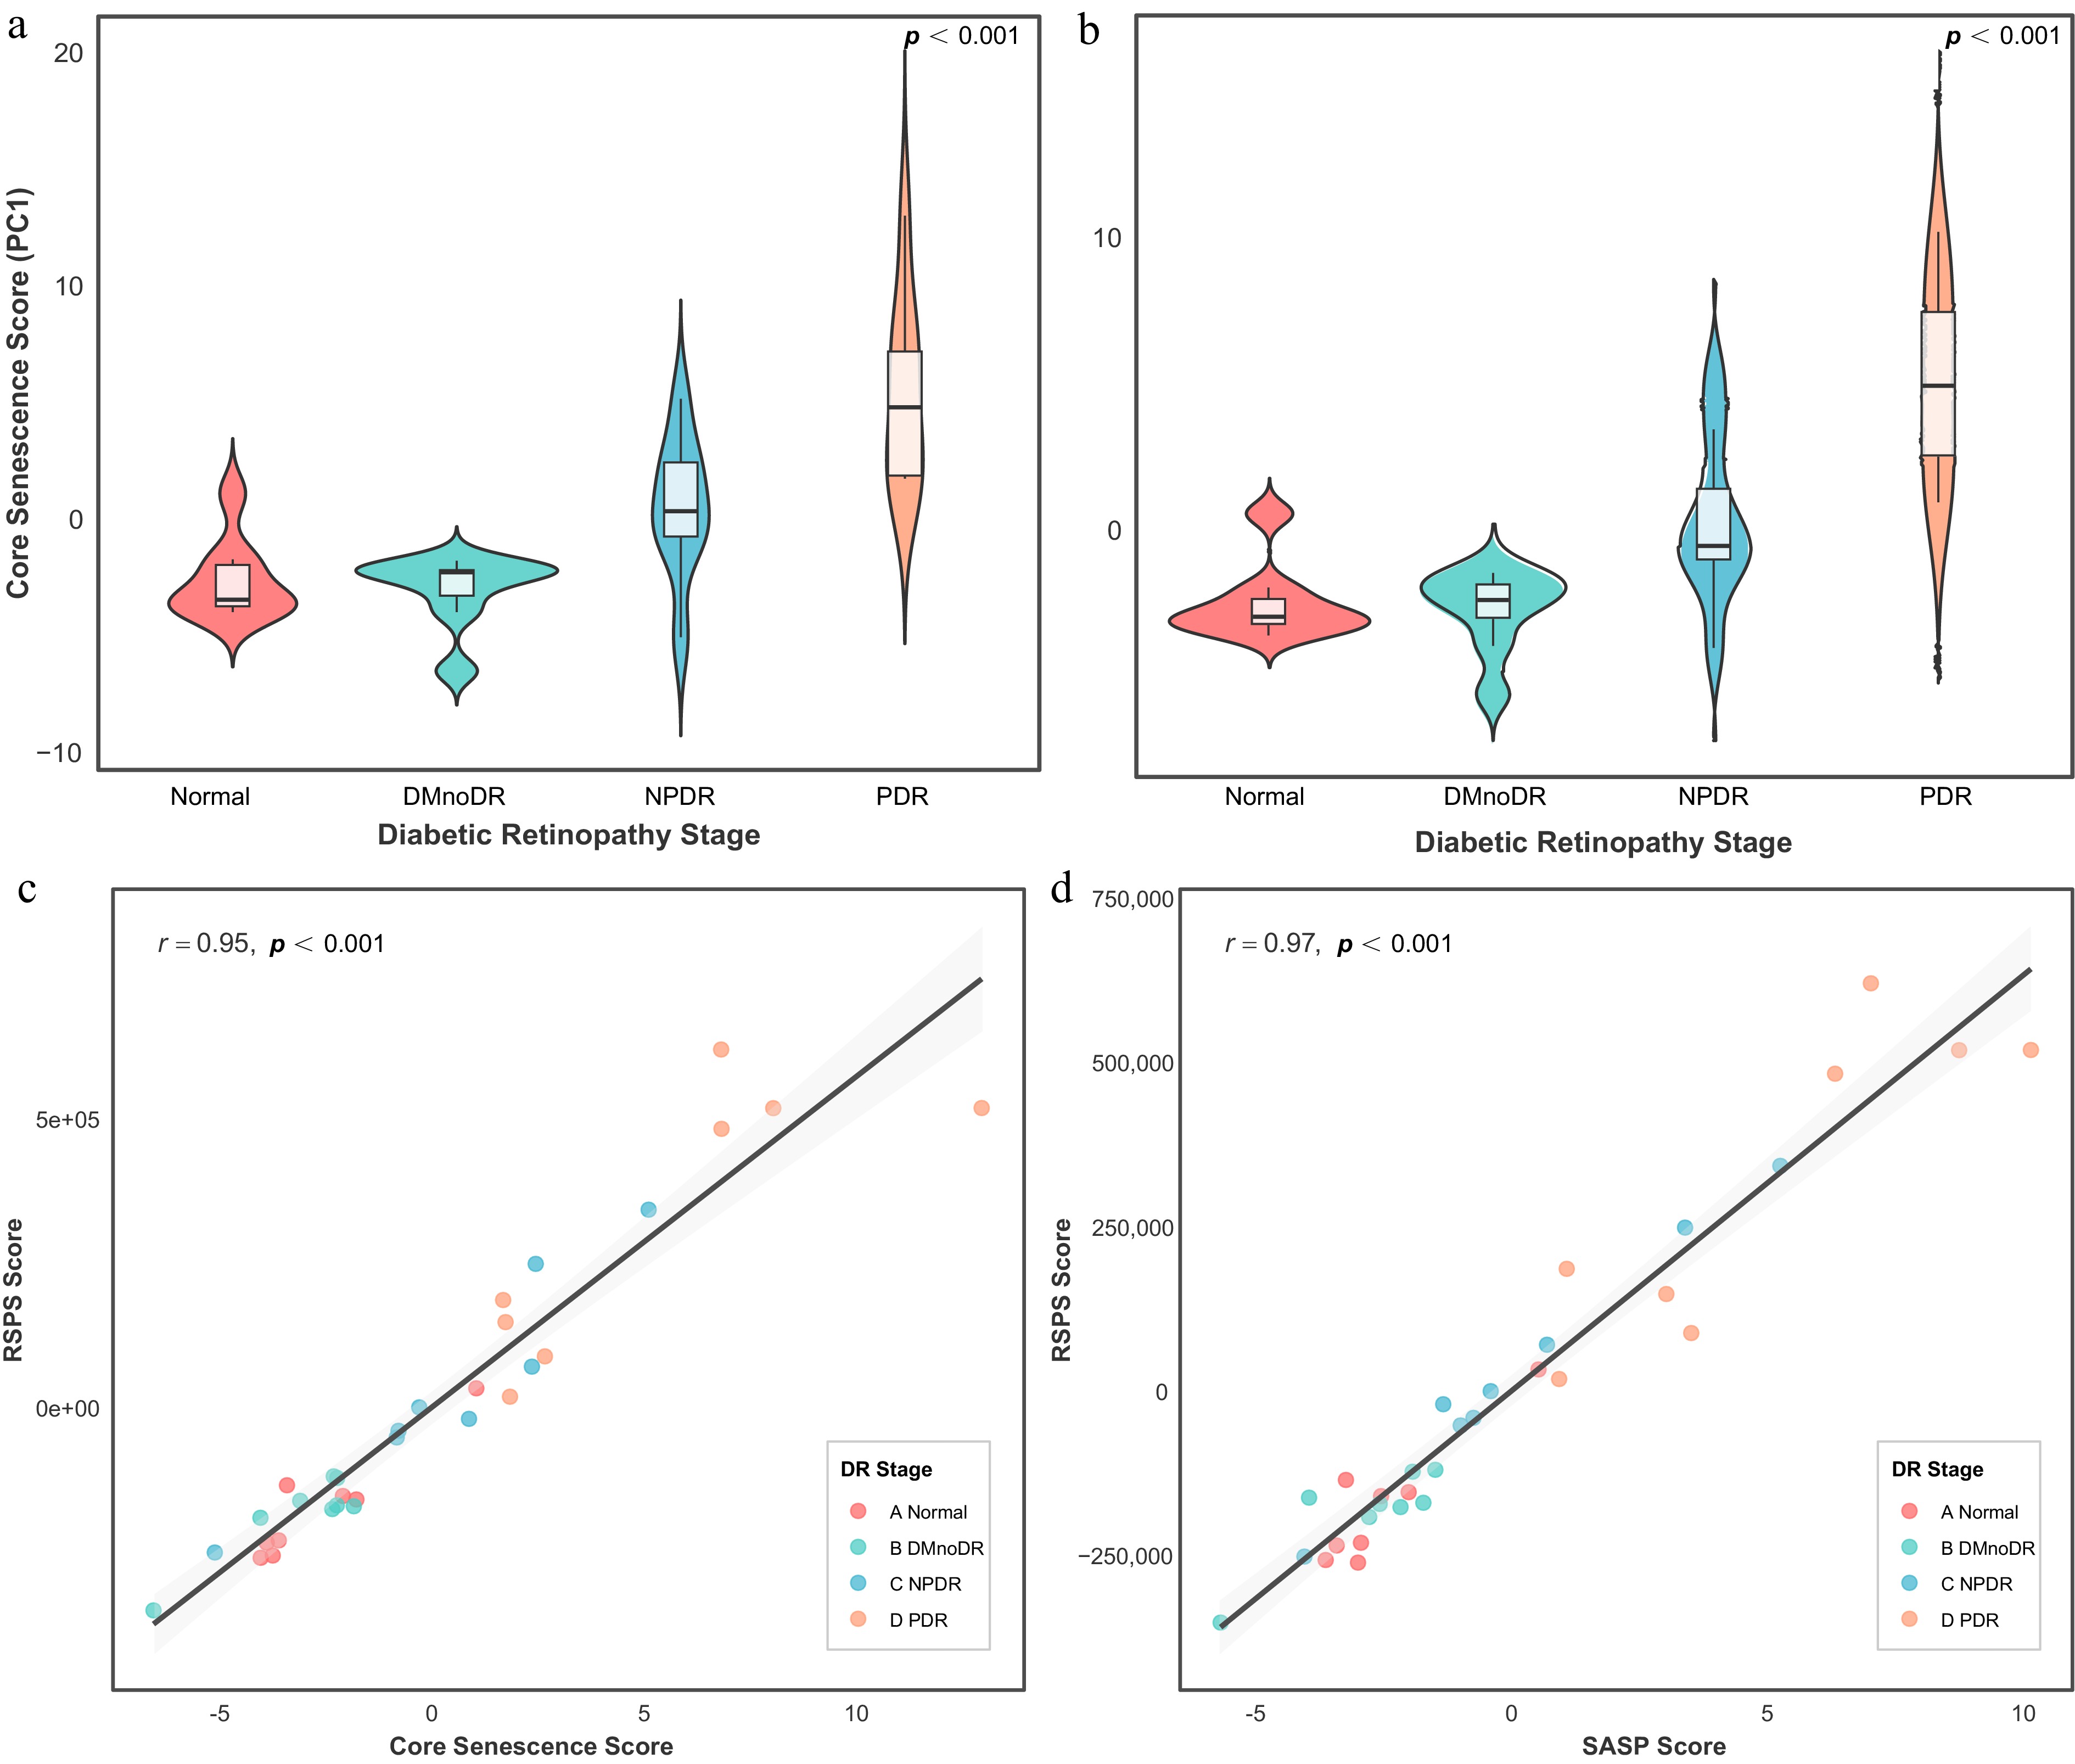
Figure 3.
Association of the RSPS score with senescence-related features. (a, b) Violin plots of core senescence scores (a) and SASP scores (b) across DR stages in the discovery cohort. Overlaid boxplots indicate the median, IQR, and 1.5 × IQR whiskers. (c, d) Correlations between RSPS scores and core senescence scores (c) or SASP scores (d). Shaded areas represent 95% confidence intervals.
Validation of the RSPS in the UKB cohort
-
The weighted RSPS model derived from the discovery stage was applied to the UKB cohort to evaluate its clinical utility and robustness. Out of the 307 RSPS proteins, 138 proteins (45.0%) were quantifiable in the targeted UKB Olink plasma panel and were utilized for score calculation. As shown in Fig. 4a, the RSPS scores displayed a clear upward trend across the spectrum from normal to DR, with both the median and the overall score distribution progressively increasing with disease severity. Higher RSPS scores were significantly enriched in DR patients (p < 0.001), consistent with the logic underlying the RSPS's construction from proteomic profiling in the discovery cohort.
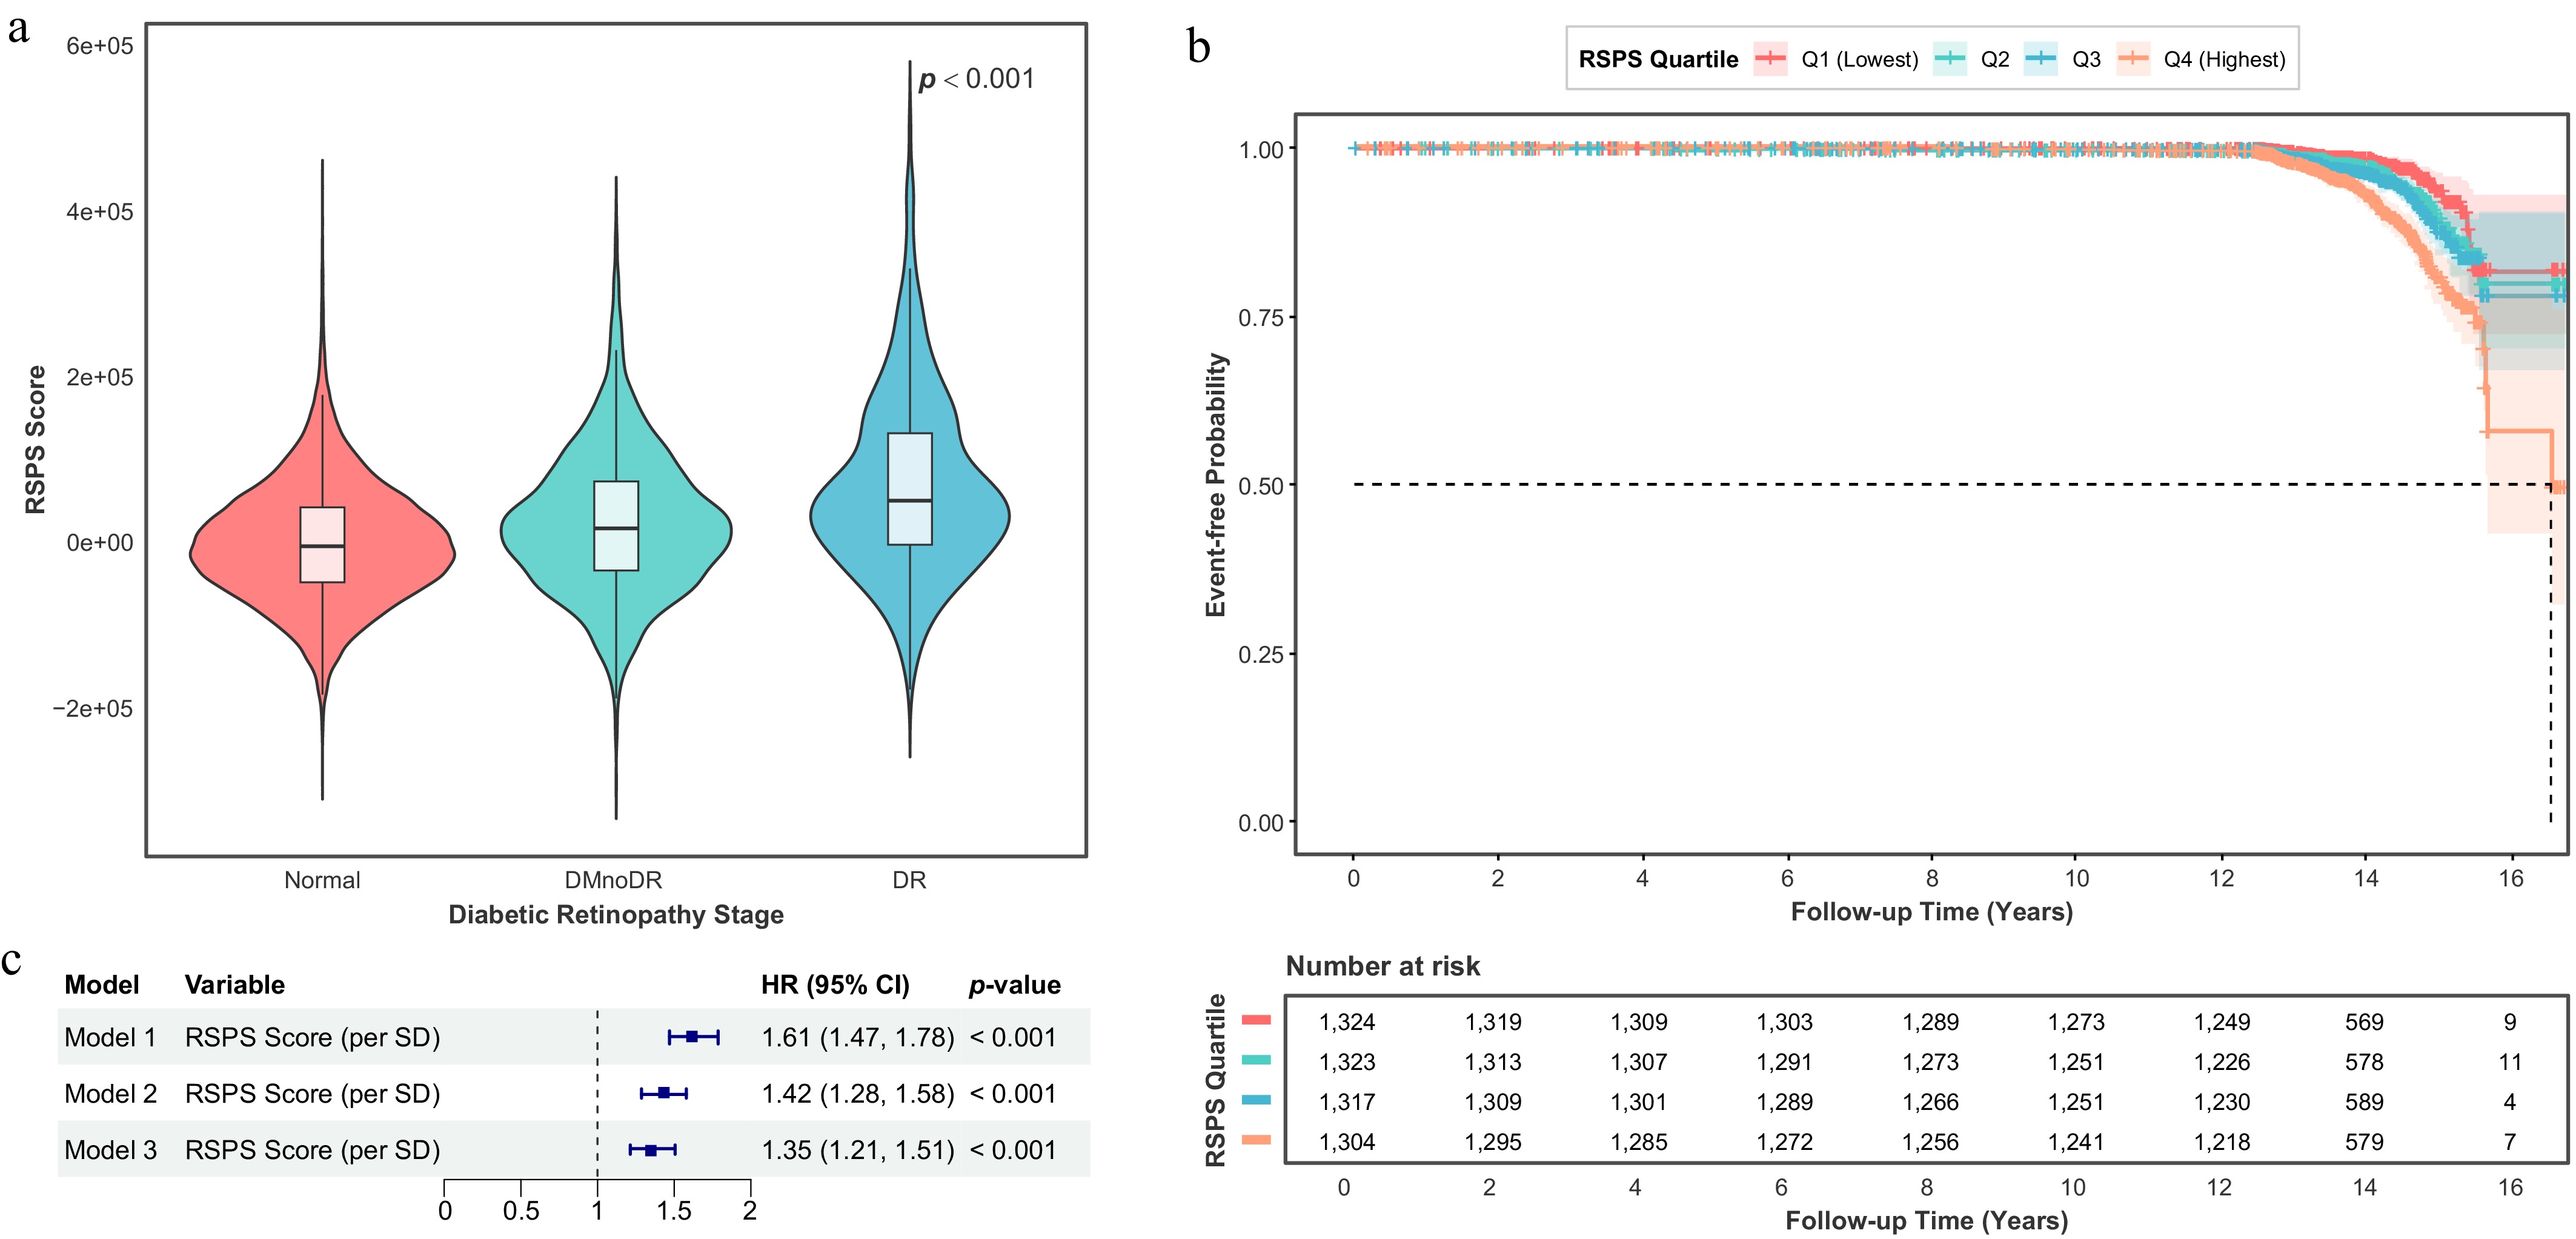
Figure 4.
Validation of the RSPS score in the UKB cohort and survival analyses. (a) Violin plot of RSPS scores across DR stages in the UKB cohort. Overlaid boxplots show the median, IQR, and 1.5 × IQR whiskers. (b) Kaplan–Meier curves for the composite endpoint (DR incidence or all-cause mortality) stratified by baseline RSPS quartiles among participants without DR at baseline. (c) Forest plot of Cox proportional hazard regression analyses evaluating the predictive value of the RSPS score for the composite endpoint. Model 1: Unadjusted. Model 2: Adjusted for age, sex, and ethnicity. Model 3: Additionally adjusted for hypertension, hyperlipidemia, obesity, BMI, and HbA1c based on Model 2.
To assess whether the RSPS score could independently predict overall adverse outcomes, we performed survival analyses using baseline RSPS scores and future clinical events. When considering a composite endpoint of DR incidence or all-cause mortality, the RSPS scores demonstrated significant association with incidence outcomes (Fig. 4b). The survival curves began to separate notably after approximately 14 years. Individuals in the highest RSPS quartile (Q4) exhibited a markedly lower event-free survival probability, whereas those in the lowest quartile (Q1) showed the most favorable prognosis (p < 0.001). Consistent with these observations, Cox proportional hazard regression analyses confirmed that a higher baseline RSPS score (per 1-SD increase) was significantly associated with an increased risk of the composite endpoint across all models (all p < 0.001). In the fully adjusted model (Model 3), which accounted for demographic and metabolic risk factors (including HbA1c), each 1-SD increase in the RSPS score corresponded to a 35% higher risk of adverse outcomes (HR = 1.35, 95% CI: 1.21–1.51), indicating that elevated retinal senescence signatures were associated with poorer long-term systemic health outcomes after adjustment for HbA1c (Fig. 4c).
To further explore potential clinical factors influencing variation in the RSPS score, we conducted stratified analyses by DR stage based on age, sex, and common comorbidities including obesity, hypertension, and hyperlipidemia (Fig. 5a–e). The progressive increase in RSPS scores along with DR severity was consistent across age and sex subgroups (all p < 0.001), showing no evidence of heterogeneity. However, in participants without obesity (p = 0.670), without hypertension (p = 0.390), or without hyperlipidemia (p = 0.200), this trend was less apparent.
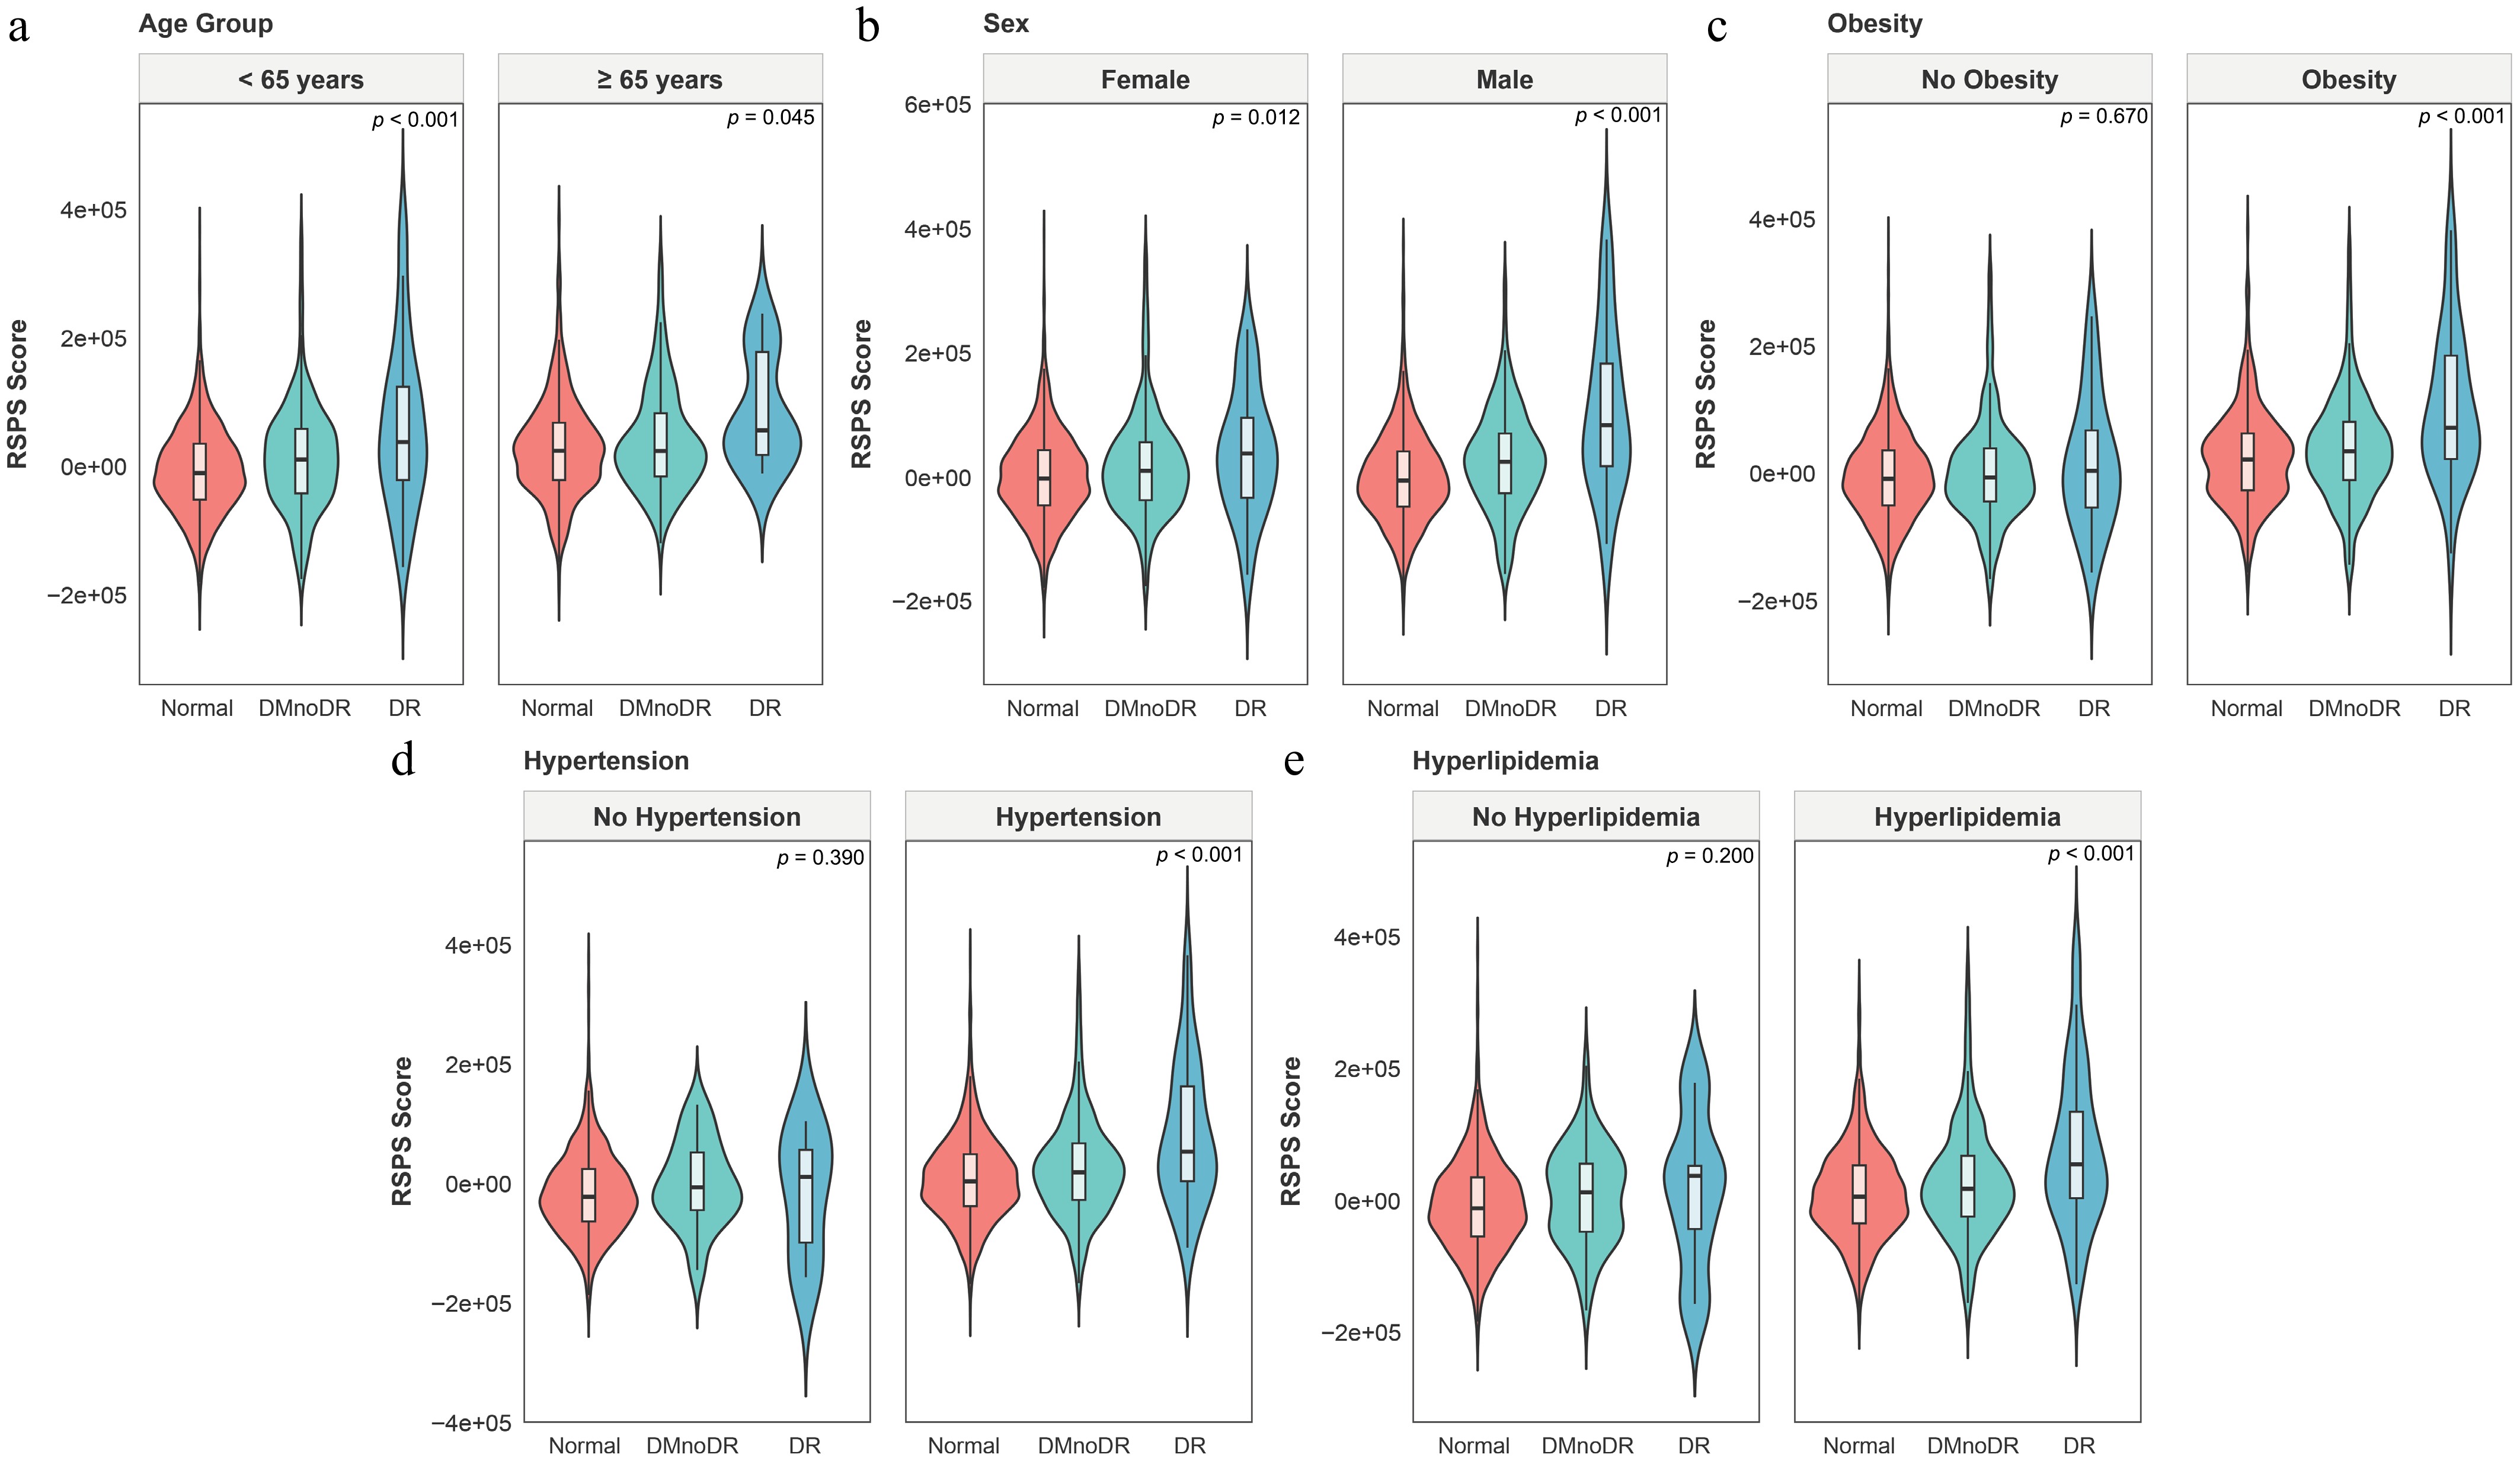
Figure 5.
Stratified analyses of the RSPS score in the UKB cohort. (a–e) Subgroup analyses stratified by age (a), sex (b), obesity (c), hypertension (d), and hyperlipidemia (e). Overlaid boxplots show the median, IQR, and 1.5 × IQR whiskers.
Finally, to explore potential therapeutic opportunities targeting retinal senescence, a drug repurposing analysis using the CMap database was performed. Several compounds demonstrated strong potential to reverse RSPS-associated transcriptional signatures (scores approaching –100) (Supplementary Table S9). These candidate drugs encompass diverse mechanisms, such as protein phosphatase inhibition (e.g., calyculin), calcium-channel blockade (e.g., nimodipine), purinergic receptor antagonism (e.g., clopidogrel), and cyclooxygenase inhibition (e.g., parecoxib), providing preliminary clues for senescence-targeted interventions.
-
In this study, we developed the RSPS derived from a proteomic analysis of aqueous humor samples across different stages of DR severity. This ocular fluid-based signature was statistically associated with DR status and its progression, and represented the molecular correlates enriched in senescence-related pathways. It was systematically validated in the large-scale UKB cohort, supporting its potential as a candidate biomarker for DR. The RSPS score was demonstrated to evaluate DR's progression and clinical outcomes. The results showed that higher scores were associated with more advanced disease stages and an increased risk of adverse composite endpoints. The strength of the RSPS score lies in its ability to capture the molecular features characteristic of retinal senescence. CS is driven by diverse metabolic and inflammatory stresses that disrupt proteostasis, sustain a chronic inflammatory response, and reinforce the SASP[19,20]. The accumulation of senescent cells is reported to disturb retinal homeostasis, promote fibrotic remodeling, and impair vascular function[4,10−12]. Consistent with these mechanisms, our research demonstrated that individuals with high RSPS scores exhibited enriched molecular hallmarks of senescence including genomic instability, heightened inflammatory signaling, and a pronounced SASP profile, and were more likely to present with clinical phenotypes like advanced chronological age, hypertension, and obesity. Chronic inflammation and metabolic dysregulation are widely recognized drivers of DR, serving not only as initiating triggers but also as key determinants of late-stage pathological remodeling. Furthermore, multiple potential therapeutic compounds were identified via the RSPS. Collectively, these findings position RSPS as a senescence-associated molecular signature linked to DR's progression. By reflecting senescence-relevant molecular alterations that are detectable in ocular fluid and systemic circulation, the RSPS provides a conceptual and translational framework for developing therapeutic strategies targeting senescence-driven pathology in DR.
To explore the molecular basis linking senescence to DR's progression, WGCNA was applied to identify 307 genes significantly associated with advances in the DR stage. The score derived from these genes showed strong positive correlations with core aging scores and SASP scores. Previous studies have shown that the proinflammatory SASP factors maintains and spreads the senescent state through autocrine and paracrine signaling, inhibiting long-term vascular repair while promoting pathological neovascularization, thus driving the pathological progression of DR[12]. Functional enrichment analysis indicated that RSPS-associated proteins are enriched in pathways related to SASP components and extracellular matrix remodeling, which are processes that have been previously implicated in retinal aging and DR's progression. Additionally, during DR's progression, CS activates specific inflammatory pathways, further accelerating retinal vascular damage and inducing secondary senescence, thereby creating a vicious cycle[21]. Consistent with this biology, we observed a progressive increase in RSPS scores with DR severity, suggesting an association between senescence-related molecular alterations and DR's progression. Our analysis revealed that RSPS genes were significantly enriched in the PI3K-Akt signaling pathway and complement and coagulation cascades. The PI3K-Akt signaling pathway and the complement system have been reported to form a closely interconnected and synergistically acting pathogenic network in DR. Chronic hyperglycemia-induced metabolic and oxidative stress can dysregulate PI3K-Akt signaling and promote complement activation[22,23]. Complement components such as C5a have been reported to modulate intracellular signaling pathways, including PI3K-Akt, thereby sustaining inflammatory and stress signaling[24−26]. Persistent activation of these pathways has been associated with endothelial dysfunction, impaired cellular homeostasis, and the development of senescence-like states in retinal vascular cells. Senescent vascular and glial cells are known to secrete proinflammatory mediators and matrix-modifying enzymes as part of the SASP[27,28], contributing to chronic low-grade inflammation and extracellular matrix remodeling. In addition, both PI3K-Akt signaling and complement pathways have been implicated in VEGF regulation and vascular remodeling[22,29], providing a potential link between senescence-associated inflammatory signaling and pathological vascular changes. In summary, these findings indicate that the relationship between CS and DR is dynamic rather than static. DR's progression is associated with increasing tissue damage and the accumulation of aging-related molecular alterations, which may interact to sustain a self-reinforcing cycle of retinal dysfunction.
Consistent with previous literature, we observed a positive correlation between biological aging and the prevalence of DR. However, the existing evidence is largely based on cross-sectional studies. For instance, Tang et al. used the National Health and Nutrition Survey (NHANES) data to measure BA, PA, and DR stage and concluded that biological aging increases the risk of DR[14]. However, this study could not address a more critical dynamic question: Does aging contribute to the longitudinal progression of DR? In contrast, our study shifts the focus from disease risk to disease progression. The RSPS score developed in our study could identify a set of protein biomarkers that are upregulated during DR's progression in addition to traditional risk factors. This provides new insights for predicting DR's progression and analyzing the relationship between aging and DR's progression. Additionally, Vetter et al. found that accelerated epigenetic aging is associated with the risk of diabetic complications[26], but it remains unclear whether this is a specific marker of DR's progression or a confounding effect mediated by other comorbid metabolic burdens. In comparison, our findings complement previous research. Through refined group design and protein screening, we confirmed that the RSPS and the corresponding scores are significantly associated with the progression of retinal aging, rather than with diabetes. This suggests that the aging score reflects specific pathological aging signals within the retina, rather than systemic metabolic disturbances. In addition, retinal structural biomarkers, such as retinal thickness, were not incorporated into the present analyses. Molecular alterations related to biological aging may not always occur synchronously with structural changes detectable by imaging and may represent upstream processes along the disease's trajectory. Future studies integrating molecular and structural biomarkers will be important to clarify their complementary roles in risk stratification and disease monitoring.
This study systematically highlights the significant role of aging in the progression of DR. The RSPS score, derived from proteomic profiling, provides a molecular perspective that complements traditional clinical indicators and may offer additional insights into DR's heterogeneity. Unlike conventional assessments that rely on structural or metabolic indicators such as retinal imaging and HbA1c, the RSPS score reflects the biological aging process within the retina. In the UKB cohort, the RSPS scores were significantly correlated with DR severity, making it a potential effective tool for identifying high-risk, progressive DR patients and assisting in disease stratification. Notably, the association between RSPS score and DR's progression exhibited population heterogeneity, which may be attributed to the modulatory effects of comorbid conditions on aging. In the population without comorbidities, the metabolic and vascular microenvironment remains relatively stable, and the influence of aging on DR's progression may be partially buffered by compensatory mechanisms, resulting in no significant correlation. However, in individuals with comorbidities such as obesity, hypertension, or hyperlipidemia, these diseases themselves contribute to retinal vascular damage, including endothelial dysfunction, enhanced oxidative stress, and inflammation. When combined with aging, these conditions create a cumulative effect that exacerbates the decline in vascular repair capacity and the accumulation of oxidative stress, thereby amplifying the risk of DR and making the association more apparent. Further analysis suggested that individuals with high RSPS scores may have a disease progression primarily driven by aging-related pathways, rather than solely by the VEGF axis. This provides new insights for DR treatment, including identifying individuals who may benefit from targeted antiaging therapies. It may also be used in clinical trials for stratified designs and predictive responses. Additionally, drug screening based on the RSPS genes indicated that several compounds that inhibit MAPK/ERK signaling, protein folding stress, and regulation of inflammation, such as the ERK1/2 phosphorylation inhibitor tyrphostin-AG-126, may offer novel interventions to alleviate DR's progression. The drug repurposing analysis was computational and hypothesis-generating in nature, and no experimental validation of the predicted compounds was conducted. Overall, this study advances the management of DR from identifying structural damage to monitoring the molecular aging burden. Combined with emerging antiaging therapeutic strategies, the RSPS score holds promise as a breakthrough in improving clinical management of DR and reducing its blindness burden.
Although this study confirmed a robust association between the RSPS score and DR's progression through a multicohort analysis, as a high-throughput omics-based observational study, it cannot fully determine, from a causal perspective, whether the key components of the RSPS are upstream initiators or downstream products driving DR's progression. However, the strategy of identifying core regulatory modules through WGCNA and cross-referencing them with authoritative aging databases supports the RSPS as a pathology-associated molecular feature from the perspectives of computational biology and functional enrichment. Additionally, though this study achieved a cross-tissue translation from discovery in the ocular fluid to external validation in the peripheral blood, the study design did not include synchronous cross-tissue detection of paired samples. Therefore, the specific transport efficiency of these proteins across the BRB was not directly quantified. Nevertheless, the RSPS score demonstrated strong validation performance and robust clinical relevance in the independent large-scale blood cohort from the UKB, providing strong evidence that the RSPS can effectively cross tissue barriers and capture systemic aging signals with universal applicability and detection feasibility. Moreover, we use the term 'retinal senescence' to explain the biological relevance of the RSPS because many proteins in the RSPS are molecular effectors of mature cell senescence and SASP, which play a direct role in retinal pathology[30,31]. Therefore, although the RSPS is derived from the aqueous humor's proteomics, the inclusion of these and other aging-related proteins provides a coherent biological basis for explaining the molecular correlation characteristics of aging-related processes in DR-related retinal microrings. However, it should be noted that although we use the term 'retinal aging' to explain the biological relevance of RSPS, we recognize that the direct link between the aqueous humor's proteins and the aging burden of retinal cells requires future research, paired tissue liquid sampling, or single-cell transcriptome verification. In addition, the RSPS-based drug repurposing analysis was conducted to identify candidate compounds linked to senescence-associated pathways. Though these predictions are yet to be experimentally validated, they provide biologically informed leads for future mechanistic and translational investigations into DR.
-
Our study used a dual screening strategy that combines data-driven and biological priors to develop the RSPS score, based on our local cohort. The RSPS score integrates both statistical significance and clear pathological mechanisms, overcoming the limitation of traditional differential analysis, which often lacks a mechanistic explanation. WGCNA was utilized to reveal potential mechanisms through which CS remodels the retinal microenvironment. Furthermore, external validation based on the large-scale UKB cohort established the independent prognostic value of the RSPS score in predicting DR's progression and composite clinical endpoints.
-
Data were accessed from UK Biobank under application number 86091, and the study was approved by the North West – Haydock Research Ethics Committee (reference 21/NW/0157; approval date 29 June 2021). The study's clinical trial was approved by the Medical Research Ethics Committee of the Guangdong Provincial People's Hospital (KY2024-316-03, approved on July 2, 2024) and adhered to the tenets of the Declaration of Helsinki. The present study involved proteomic profiling of human biological samples without genomic sequencing or genetic analysis. Thus, it falls outside the scope of human genetic resources as defined by Chinese regulations. Written informed consent was obtained from all participants.
-
The authors confirm their contribution to the paper as follows: study conception and design: Zuo X, Chi K, Wang Y; data collection: Huang A, Lai C, Su T, Huang P, Liang R, Lin X, Zhong W, Chen M, Li Z; analysis and interpretation of the results: Zuo X, Chi K, Huang A, Liang A; draft manuscript preparation: Zuo X, Chi K, Pan Q, Jiao M. All authors reviewed the results and approved the final version of the manuscript.
-
The datasets generated during and/or analyzed during the current study are available from the corresponding author on reasonable request.
-
This work was supported by the National Natural Science Foundation of China (U24A20707, 82301260, 82271125, 82301205, 82301246), Guangdong Basic and Applied Basic Research Foundation (2023B1515120028), China Postdoctoral Science Foundation (2024T170185), Brolucizumab Efficacy and Safety Single-Arm Descriptive Trial in Patients with Persistent Diabetic Macular Edema (2024-29), the launch fund of Guangdong Provincial People's Hospital for NSFC (8227041127), and the Postdoctoral Research Fund of Guangdong Provincial People's Hospital (BY012024031). This research has been conducted using the UK Biobank Resource under application number [86091].
-
The authors declare that they have no conflict of interest.
-
Authors contributed equally: Xin Zuo, Kaiyi Chi, Andong Huang
- Supplementary Fig. S1 Quality control of the discovery cohort.
- Supplementary Fig. S2 Workflow of proteomic data filtering.
- Supplementary Fig. S3 Sensitivity analysis based on ordinal logistic regression.
- Supplementary Table S1 Baseline characteristics of GD-RMOS.
- Supplementary Table S2 Baseline characteristics of the validation Cohort derived from the UK biobank.
- Supplementary Table S3 Genes identified in the secondary screening stage.
- Supplementary Table S4 Cell age build 3.
- Supplementary Table S5 Irradiated renal epithelial cell SASP profiles.
- Supplementary Table S6 Atazanavir-treated fibroblast SASP profiles.
- Supplementary Table S7 Inducible RAS overexpression fibroblast SASP profiles.
- Supplementary Table S8 Final set of selected genes for analysis.
- Supplementary Table S9 Final list of candidate therapeutic drugs identified after multi-stage filtering.
- Copyright: © 2026 by the author(s). Published by Maximum Academic Press, Fayetteville, GA. This article is an open access article distributed under Creative Commons Attribution License (CC BY 4.0), visit https://creativecommons.org/licenses/by/4.0/.
-
About this article
Cite this article
Zuo X, Chi K, Huang A, Lai C, Su T, et al. 2026. Development of the retinal senescence protein signature based on proteomics to evaluate the progression of diabetic retinopathy. Visual Neuroscience 43: e010 doi: 10.48130/vns-0026-0011 

Development of the retinal senescence protein signature based on proteomics to evaluate the progression of diabetic retinopathy
- Received: 03 December 2025
- Revised: 25 February 2026
- Accepted: 25 February 2026
- Published online: 13 March 2026
Abstract: Diabetic retinopathy (DR) is a leading cause of visual impairment, with biological aging implicated in its pathogenesis. However, how cellular senescence (CS) relates to DR's progression remains unclear. This study aimed to develop a senescence-associated proteomic signature to evaluate DR's progression. We performed a proteomic analysis of ocular fluid samples from Guangdong DR Multiple-Omics Study (GD-RMOS) patients across DR stages defined by clinical records and the International Classification of Diseases (10th Revision) (ICD-10). Multivariate linear regression identified 1,228 proteins significantly associated with DR severity from 6,379 candidates. Intersection with the CellAge and senescence-associated secretory phenotype (SASP) databases yielded 307 proteins defining the retinal senescence protein signature (RSPS). A weighted RSPS score was developed and then validated in the UK Biobank plasma proteomic cohort. Functional enrichment and subgroup analyses were conducted. The RSPS score was significantly associated with DR's progression and adverse outcomes; each standard deviation of increase was associated with a 35% higher risk of the composite endpoint (hazard ratio = 1.35, 95% confidence interval: 1.21–1.51) in the fully adjusted model. The RSPS score serves as a senescence-associated molecular signature linked to DR's progression, correlates with metabolic syndromes, inflammation, and SASP activation, as well as supporting molecular senescence monitoring and targeted therapeutic strategies.