-
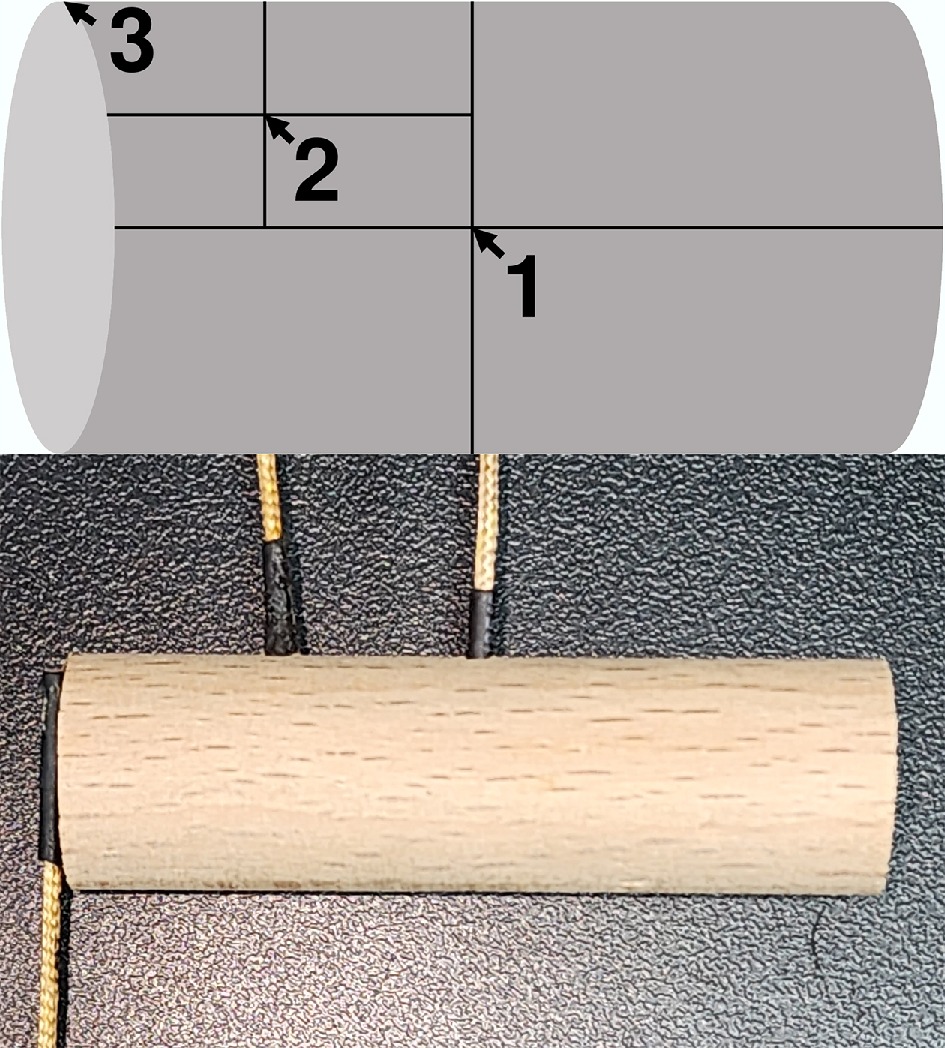
Figure 1.
Different thermocouple locations: (1) core, (2) middle, and (3) surface.
-
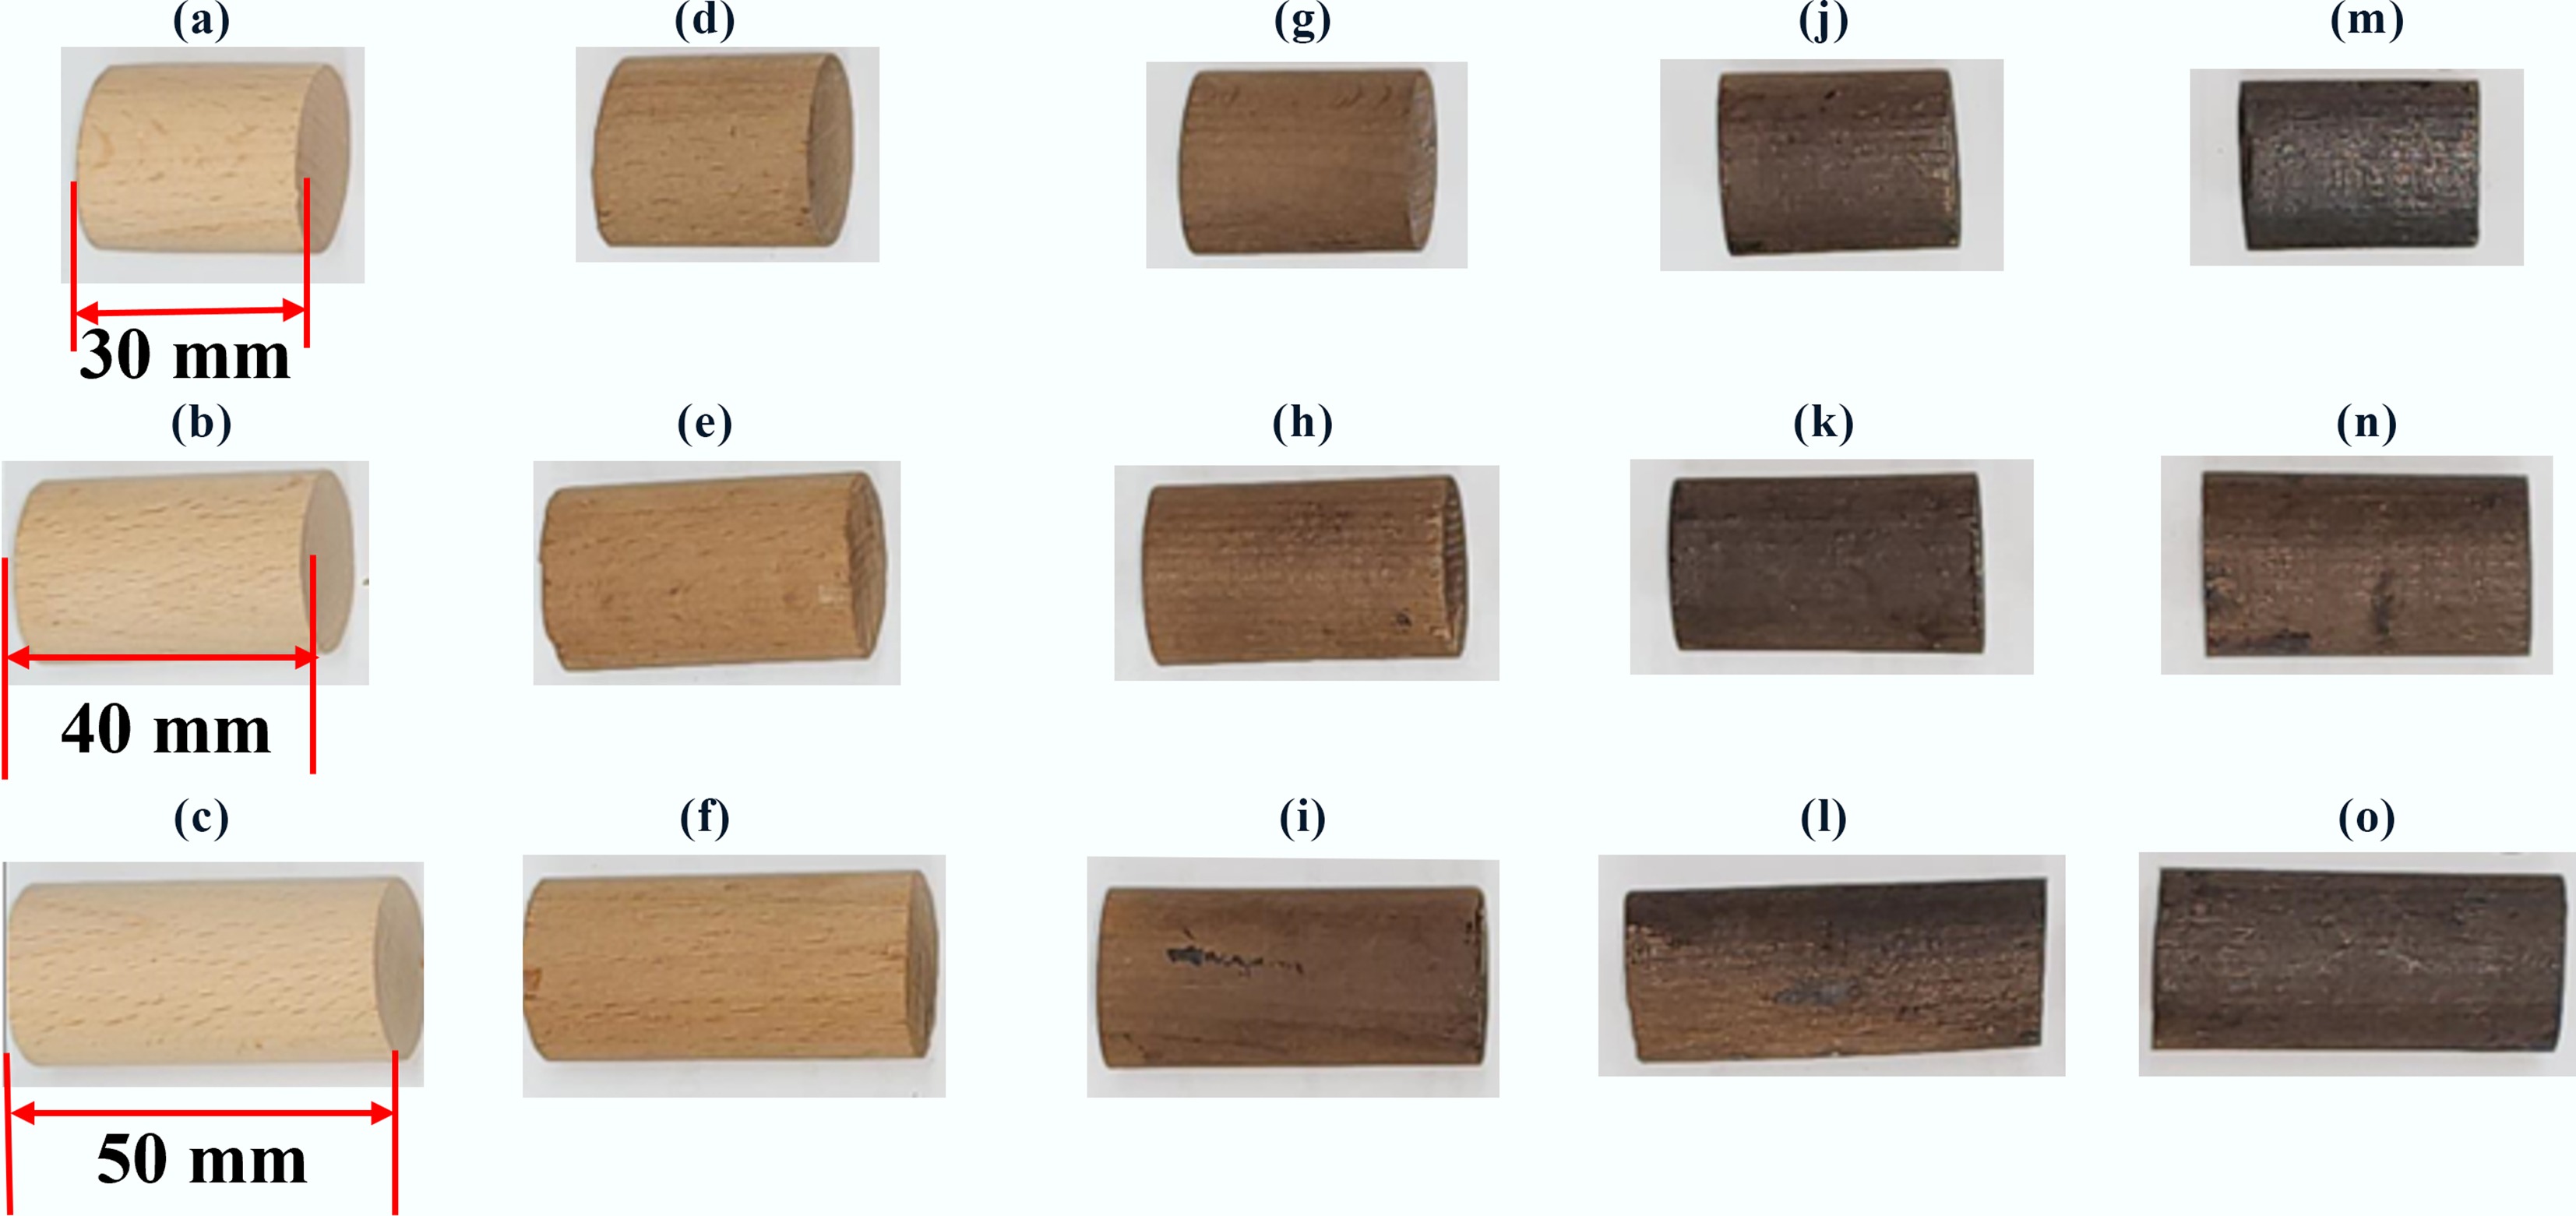
Figure 2.
Colours obtained for (a)–(c) raw BW, (d)–(f) 250BW30, (g)–(i) 250BW60, (j)–(l) 300BW30, and (m)–(o) 300BW60 samples. The samples have a diameter of 25 mm.
-
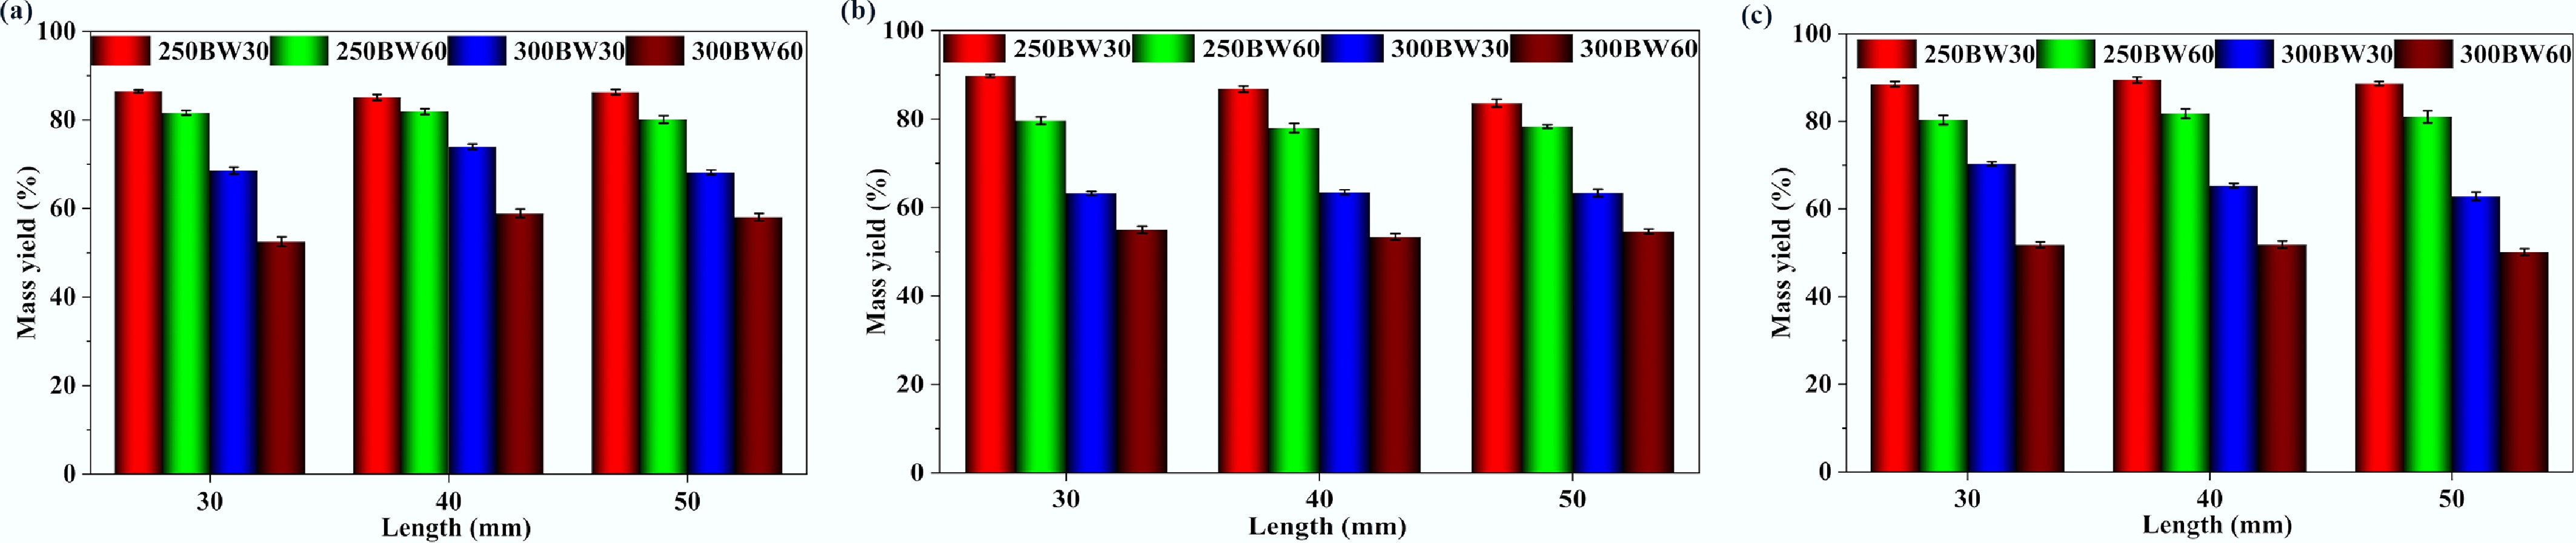
Figure 3.
Mass yields obtained for torrefied samples with different diameters and lengths. Particle diameters are (a) mass yields for 15 mm diameter samples, (b) mass yields for 25 mm diameter samples, and (c) mass yields for 35 mm diameter samples.
-
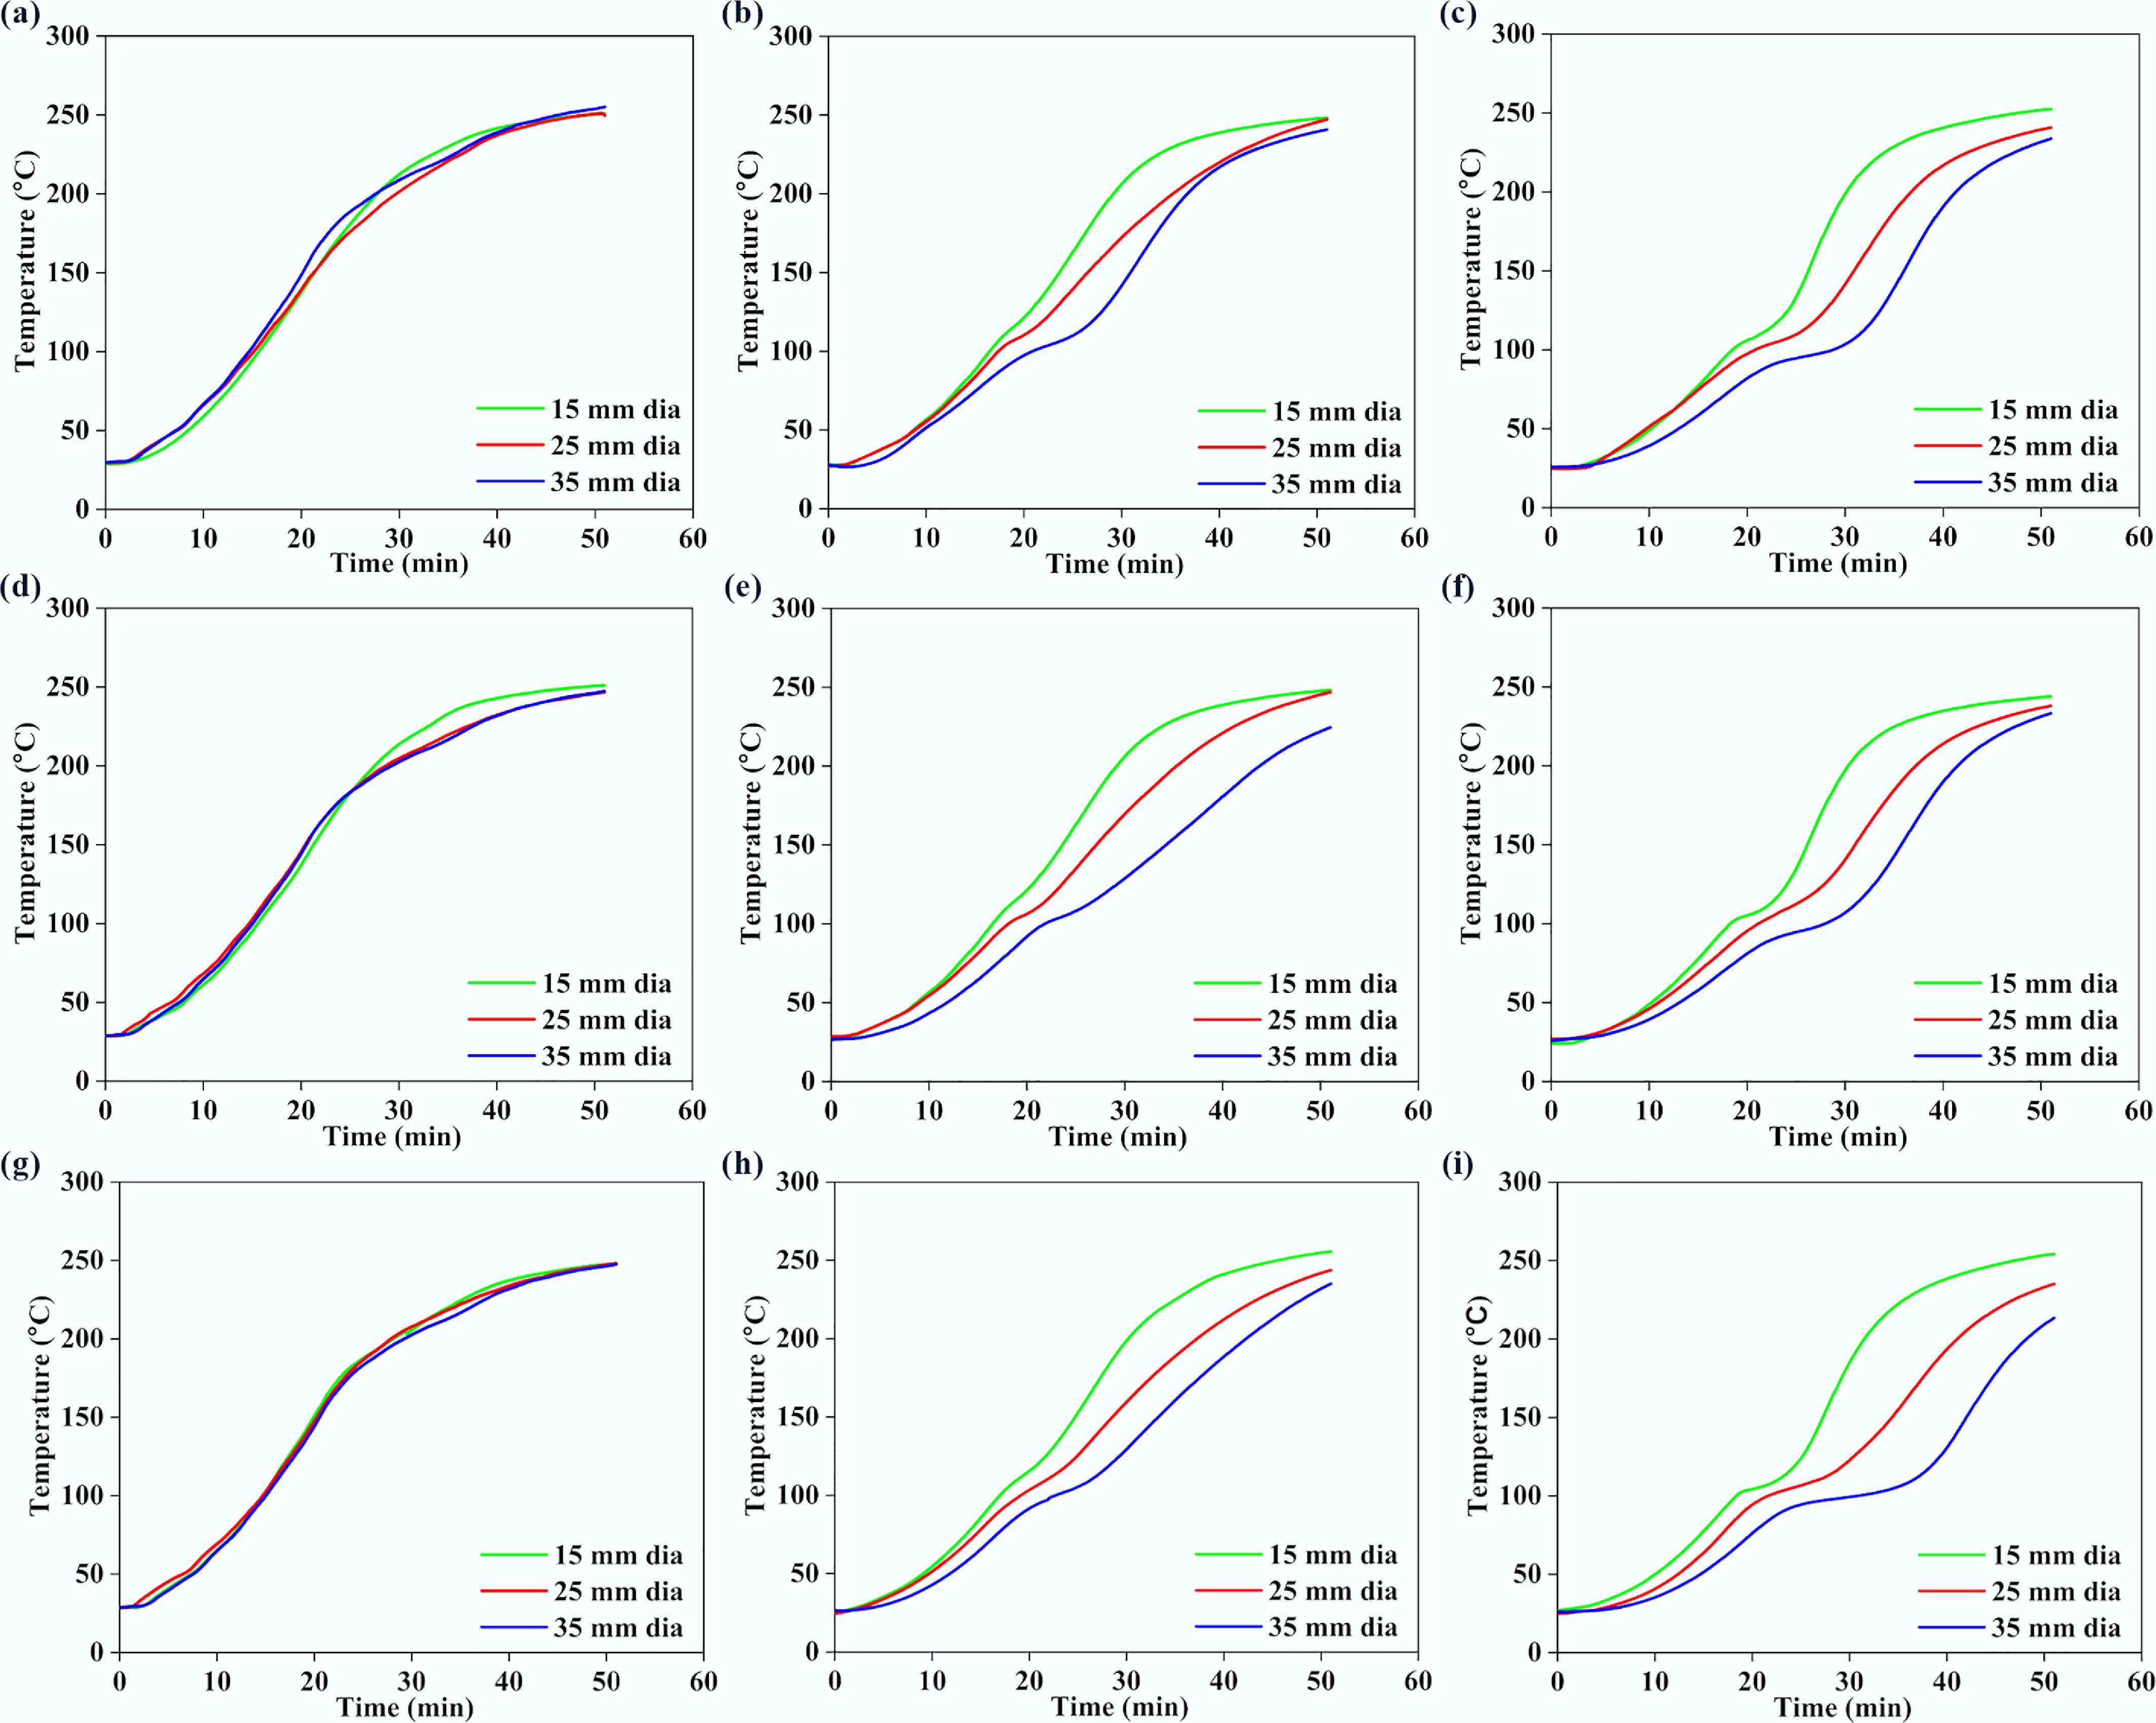
Figure 4.
Variations in (a), (d), (g) surface, (b), (e), (h) middle, and (c), (f), (i) core temperatures with time, for 250BW30 particles with different lengths. Panels (a)–(c), (d)–(f), and (g)–(i), correspond to particle lengths of 30, 40, and 50 mm, respectively.
-
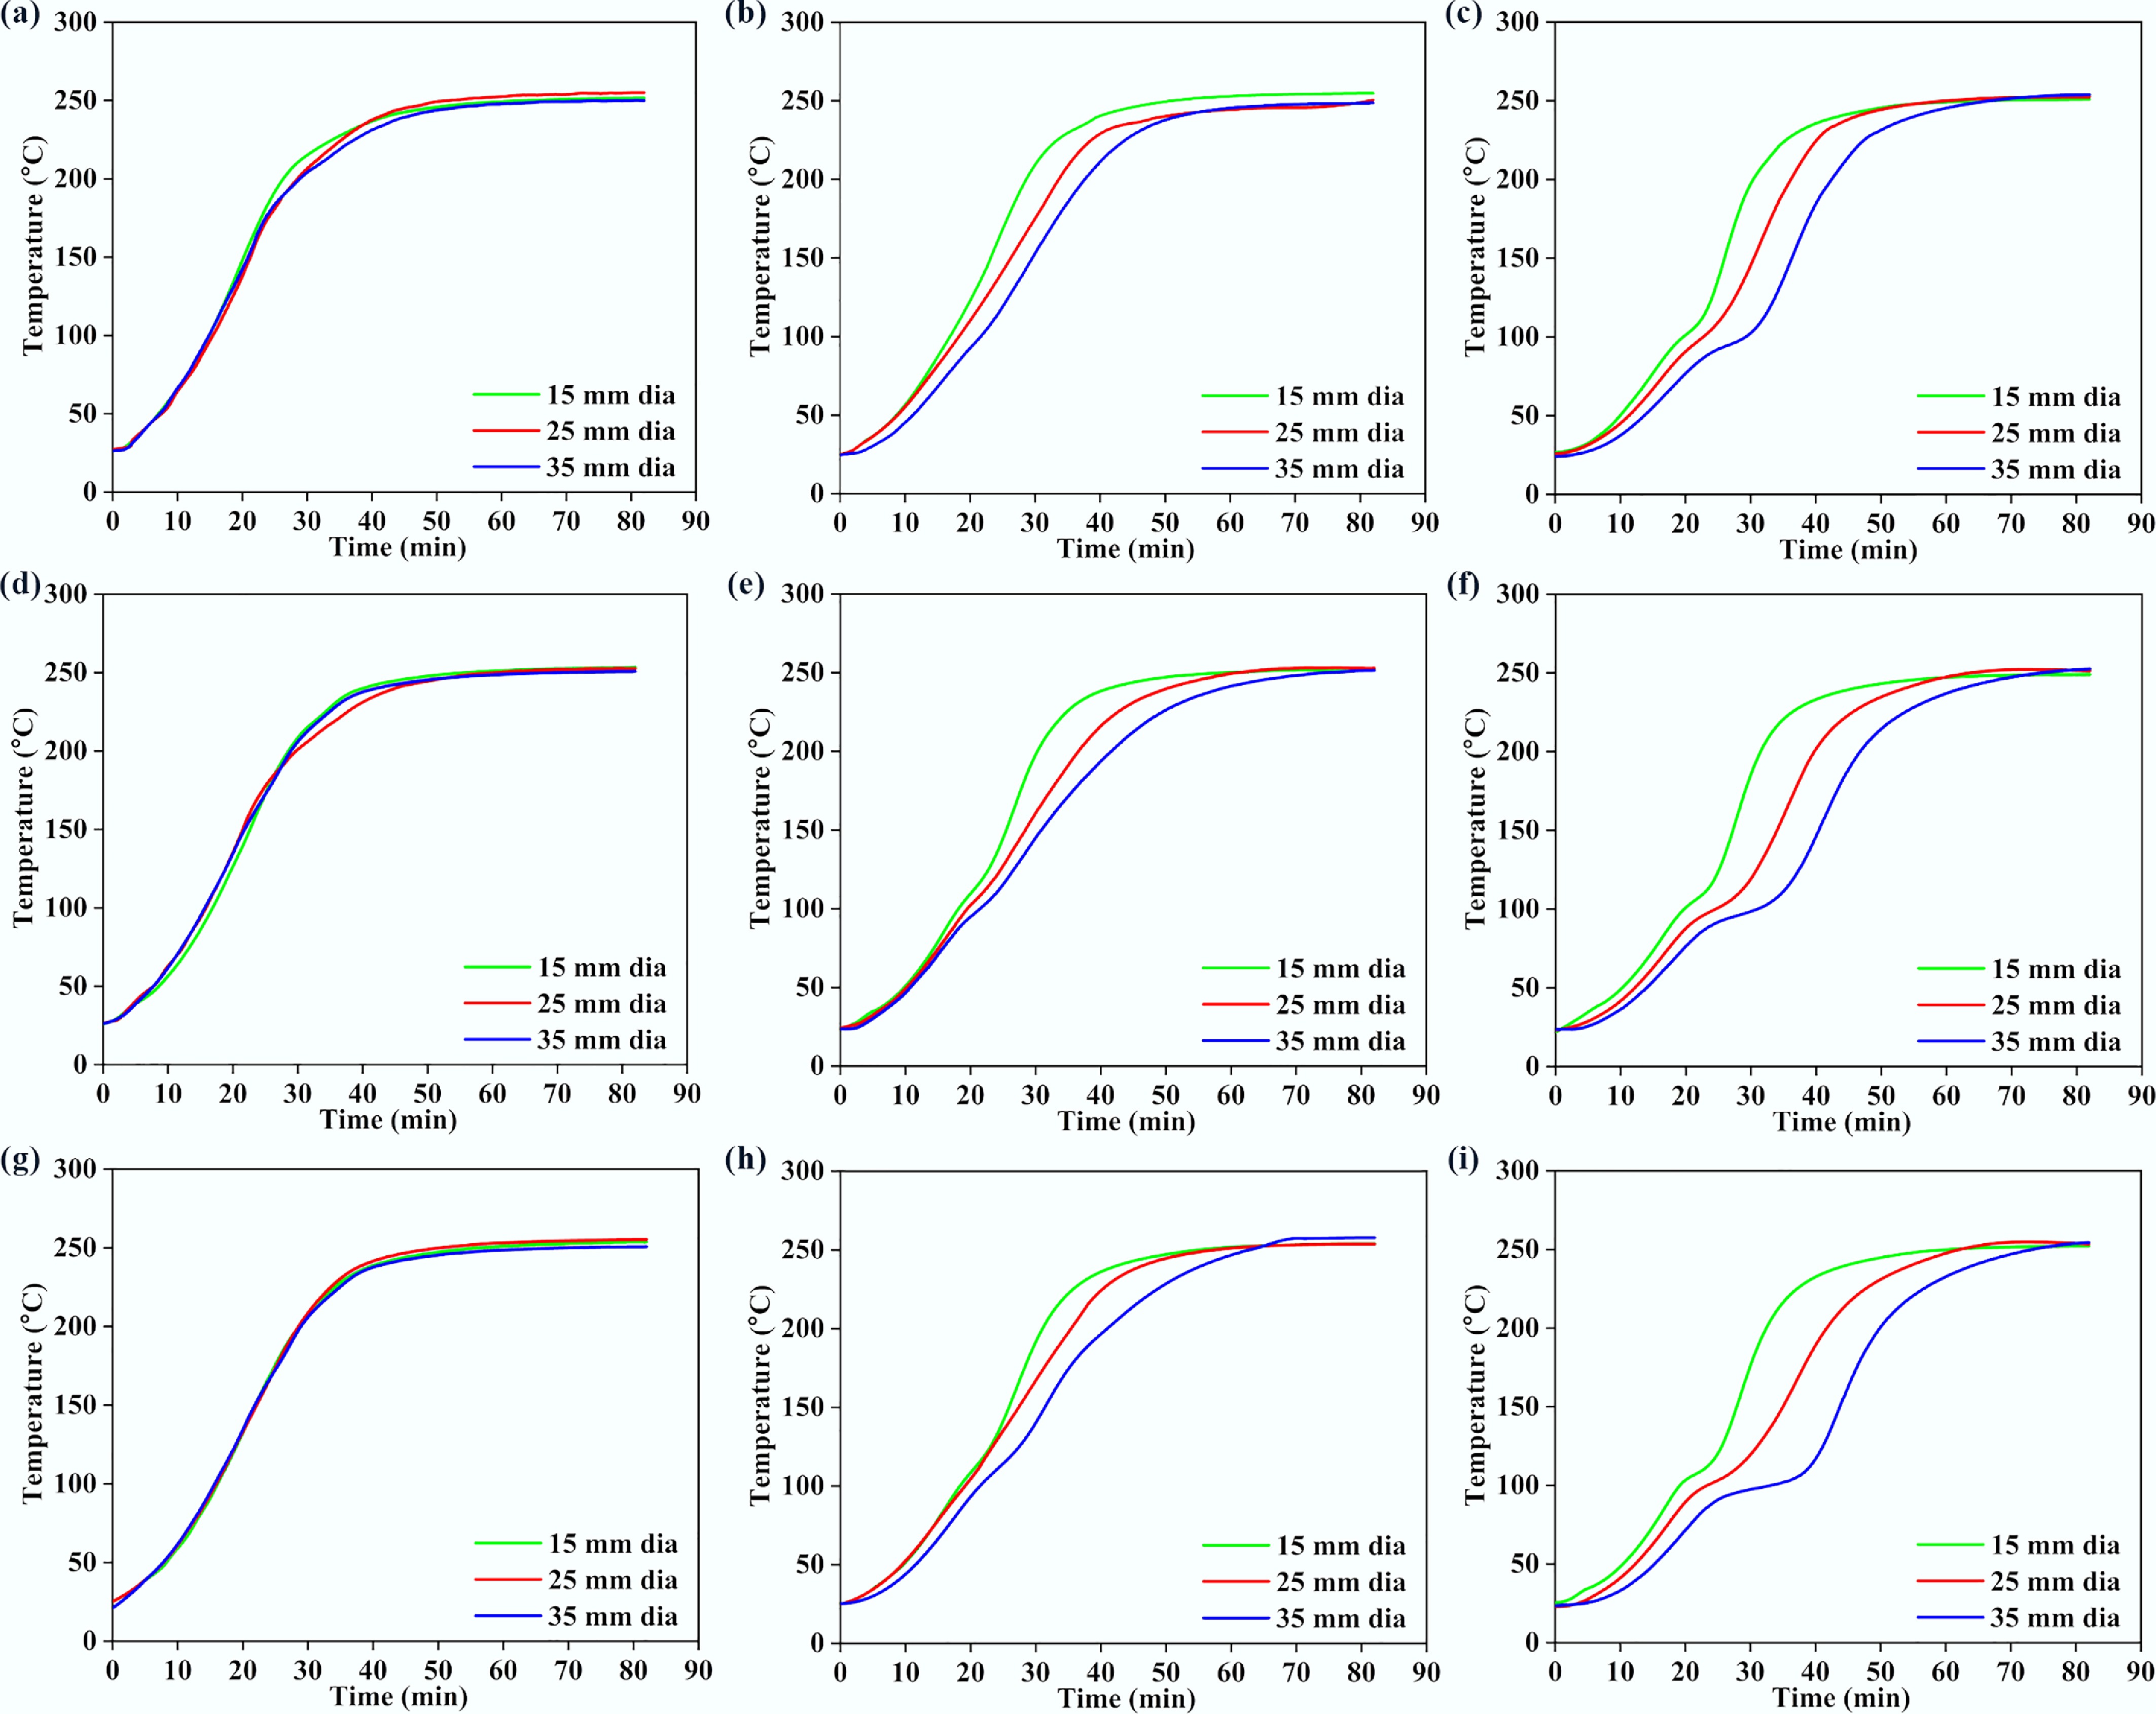
Figure 5.
Variations in (a), (d), (g) surface, (b), (e), (h) middle, and (c), (f), (i) core temperatures with time, for 250BW60 particles with different lengths and diameters. Panels (a)–(c), (d)–(f), and (g)–(i) correspond to particle lengths of 30, 40, and 50 mm, respectively.
-
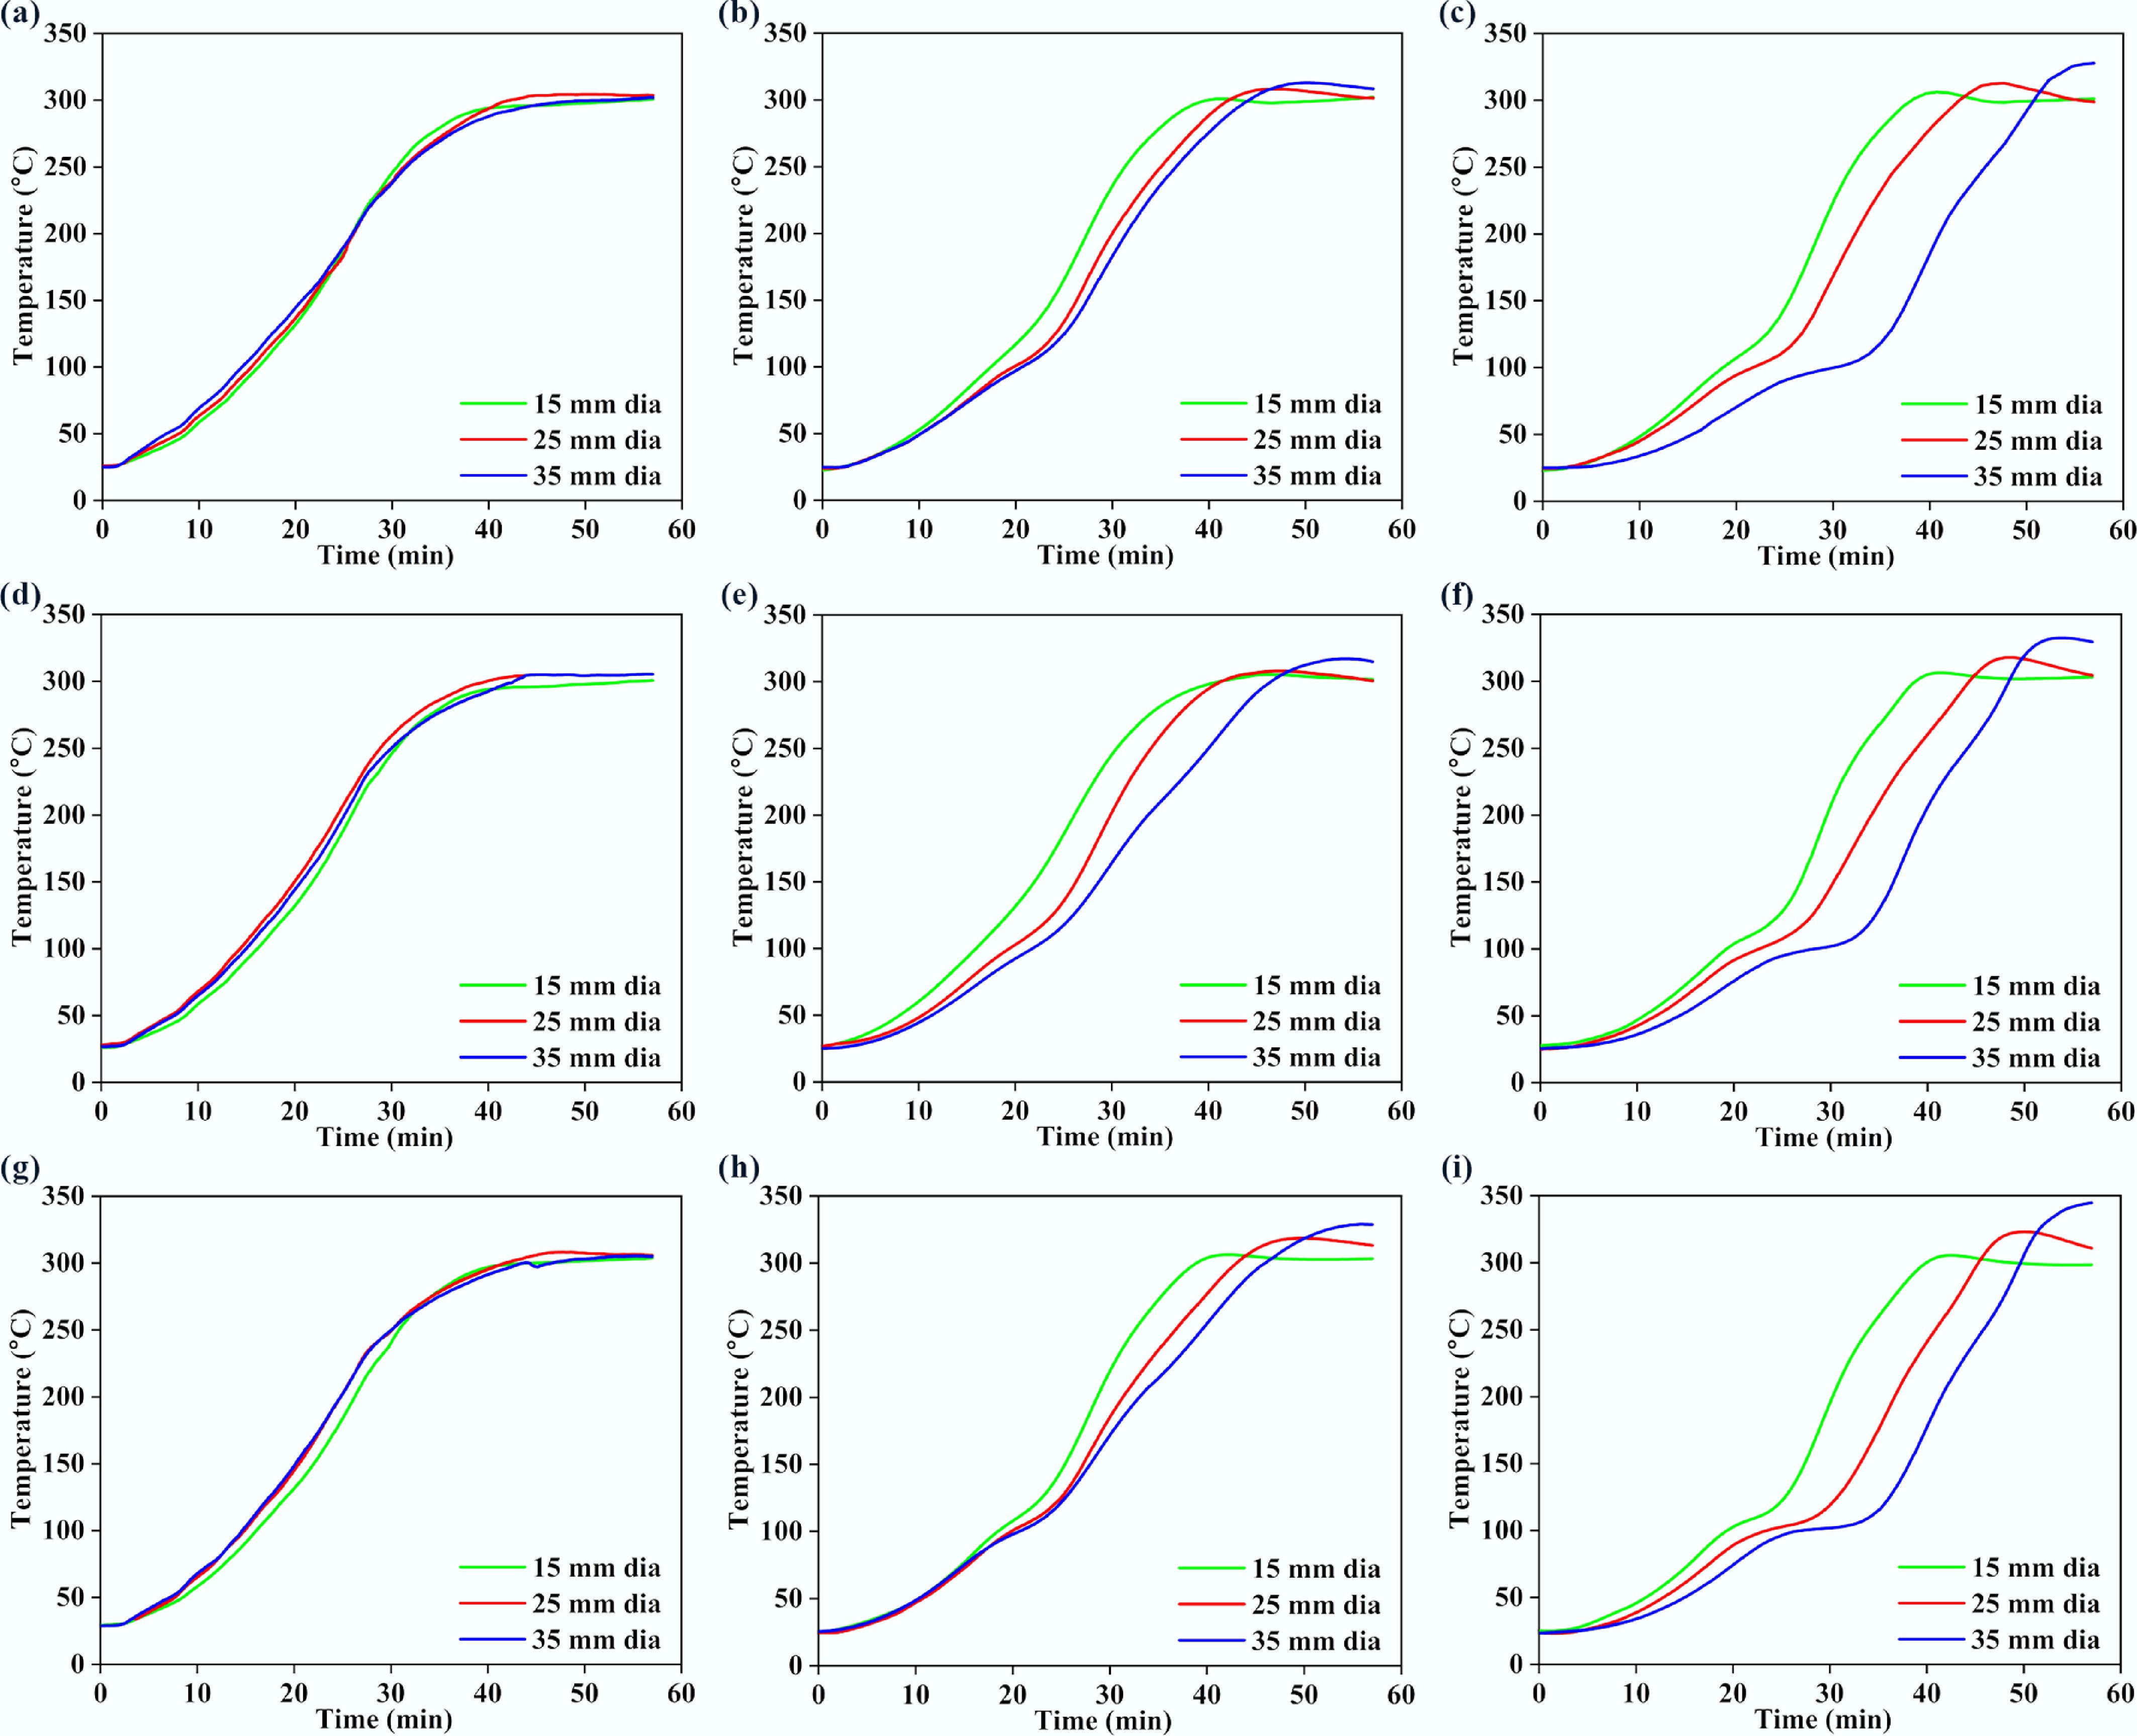
Figure 6.
Variations in (a), (d), (g) surface, (b), (e), (h) middle, and (c), (f), (i) core temperatures with time, for 300BW30 particles with different lengths and diameters. Panels (a)–(c), (d)–(f), and (g)–(i) correspond to particle lengths of 30, 40, and 50 mm, respectively.
-
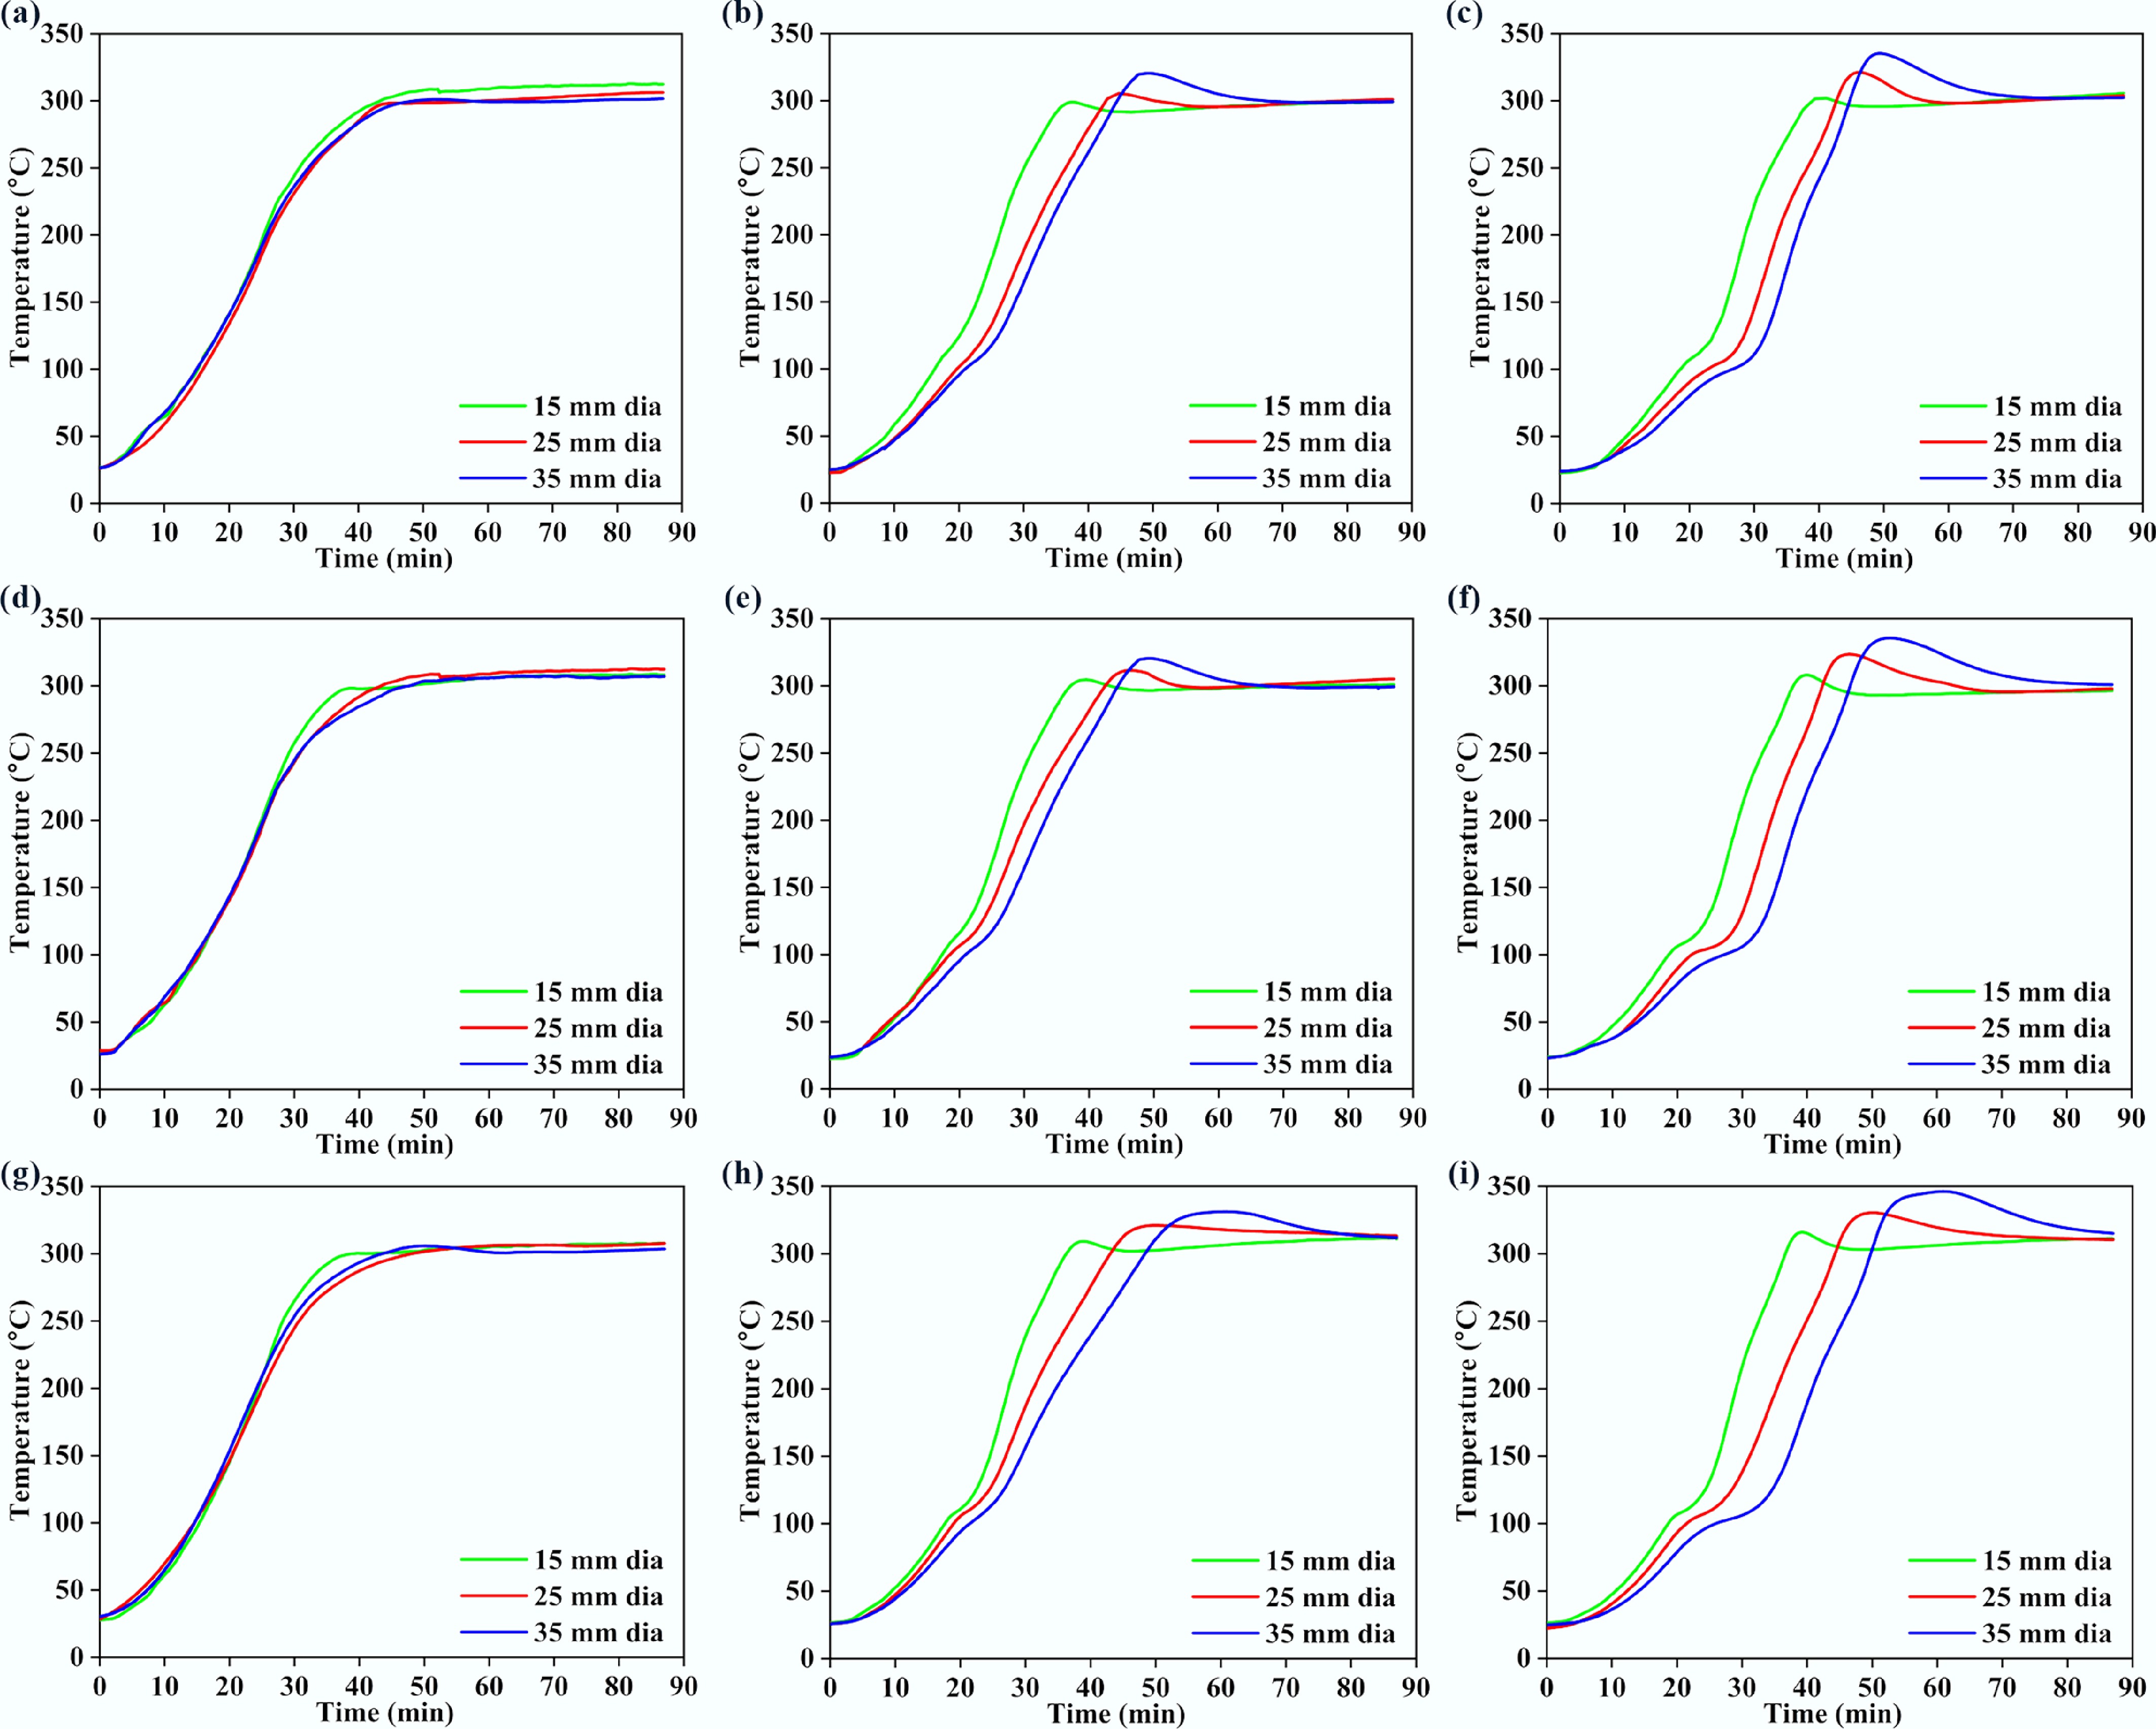
Figure 7.
Variations in (a), (d), (g) surface, (b), (e), (h) middle, and (c), (f), (i) core temperatures with time for 300BW60 particles with different lengths and diameters. Panels (a)–(c), (d)–(f), and (g)–(i) correspond to particle lengths of 30, 40, and 50 mm, respectively.
-
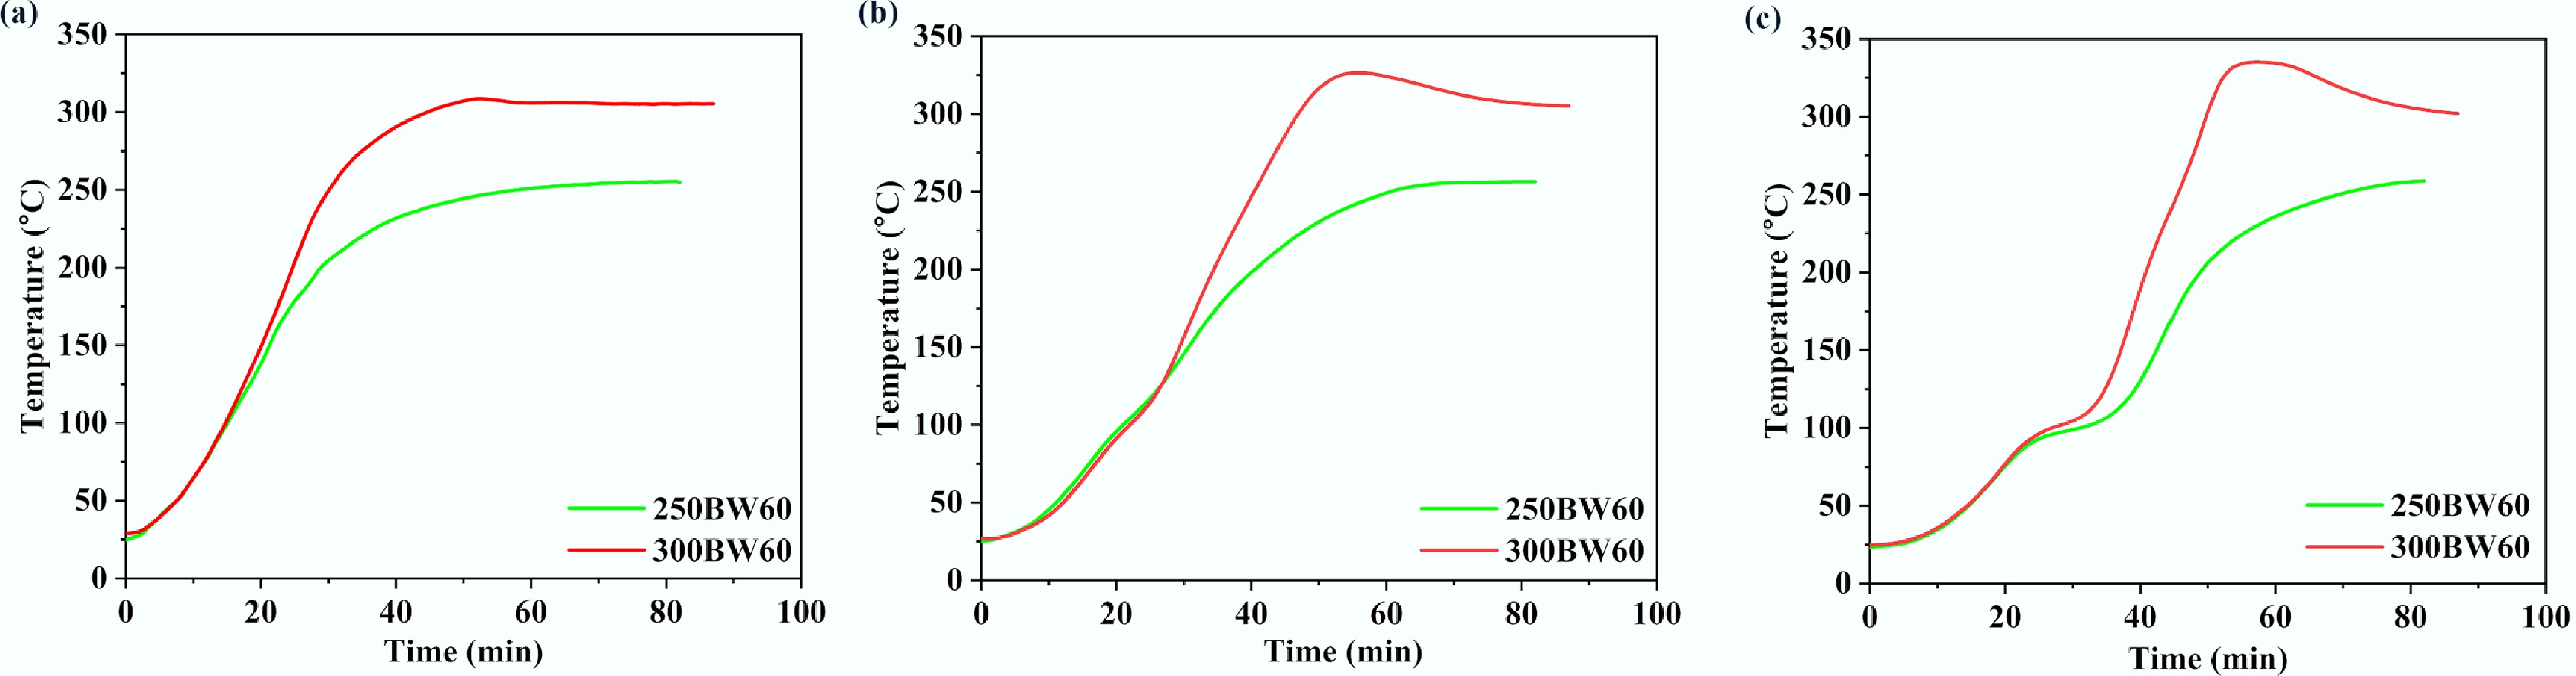
Figure 8.
Variations of (a) surface, (b) middle, and (c) core temperatures with time for 250BW60 and 300BW60 samples. The particle has a diameter of 35 mm and a length of 50 mm.
-
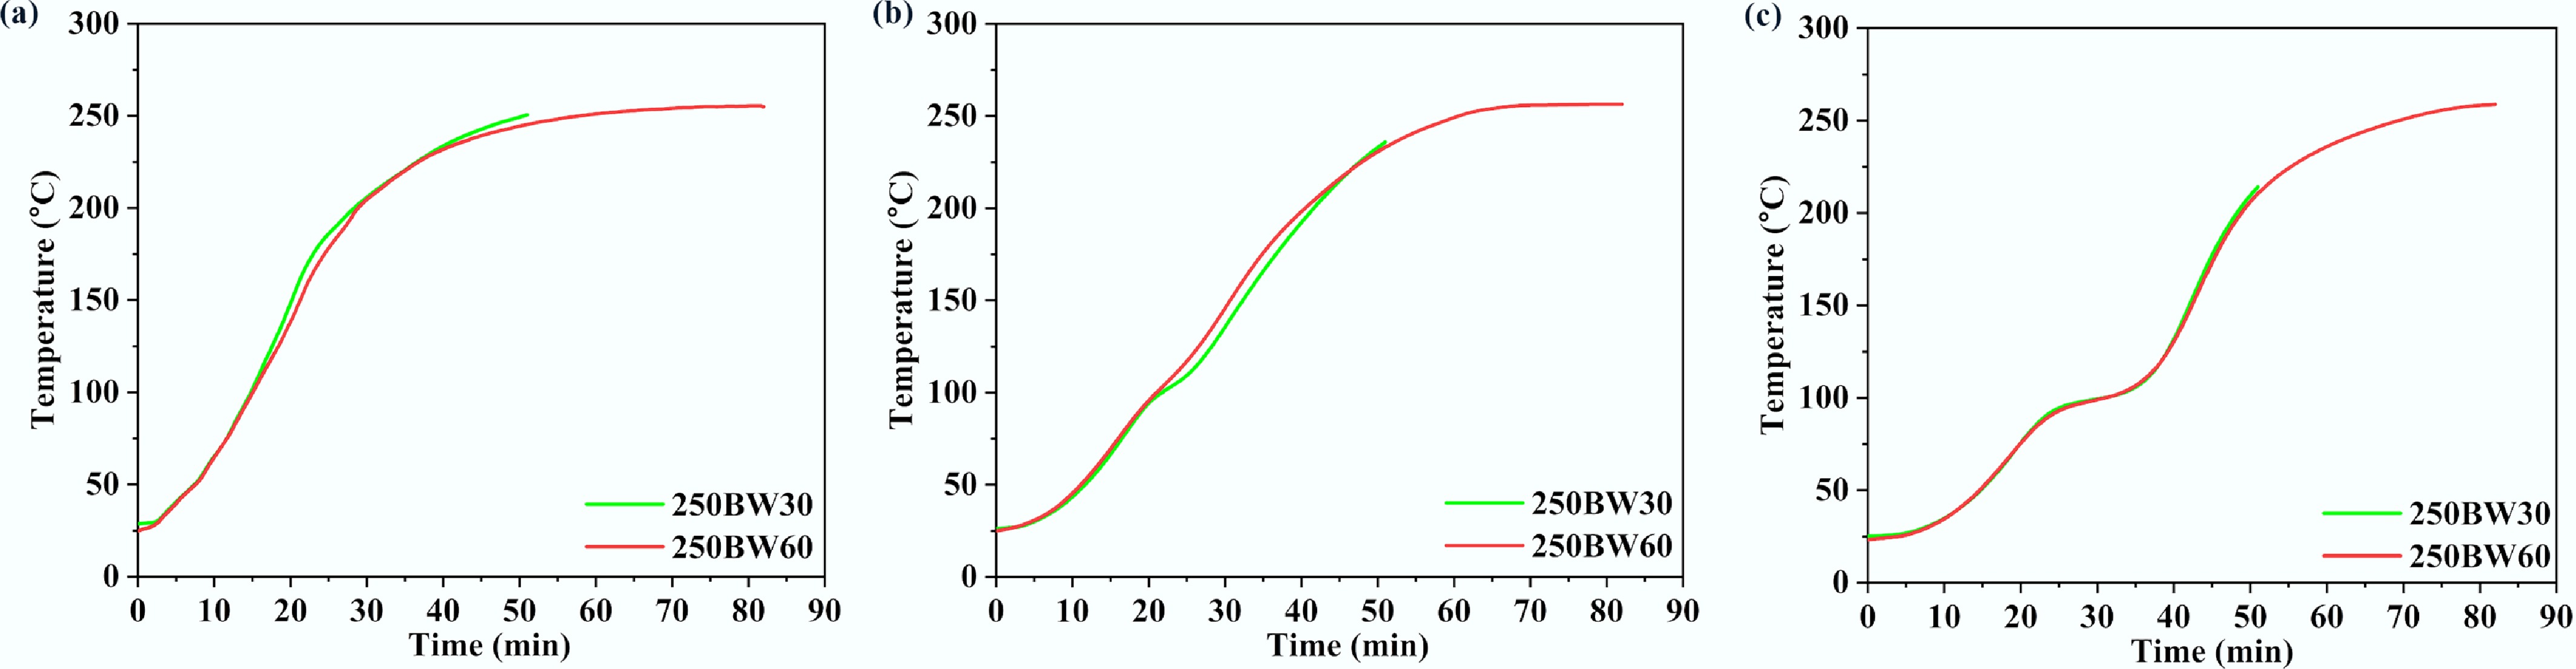
Figure 9.
Temperatures at the (a) surface, (b) middle, and (c) core locations for 250BW30 and 250BW60 samples. The particle has a diameter of 35 mm and a length of 50 mm.
-
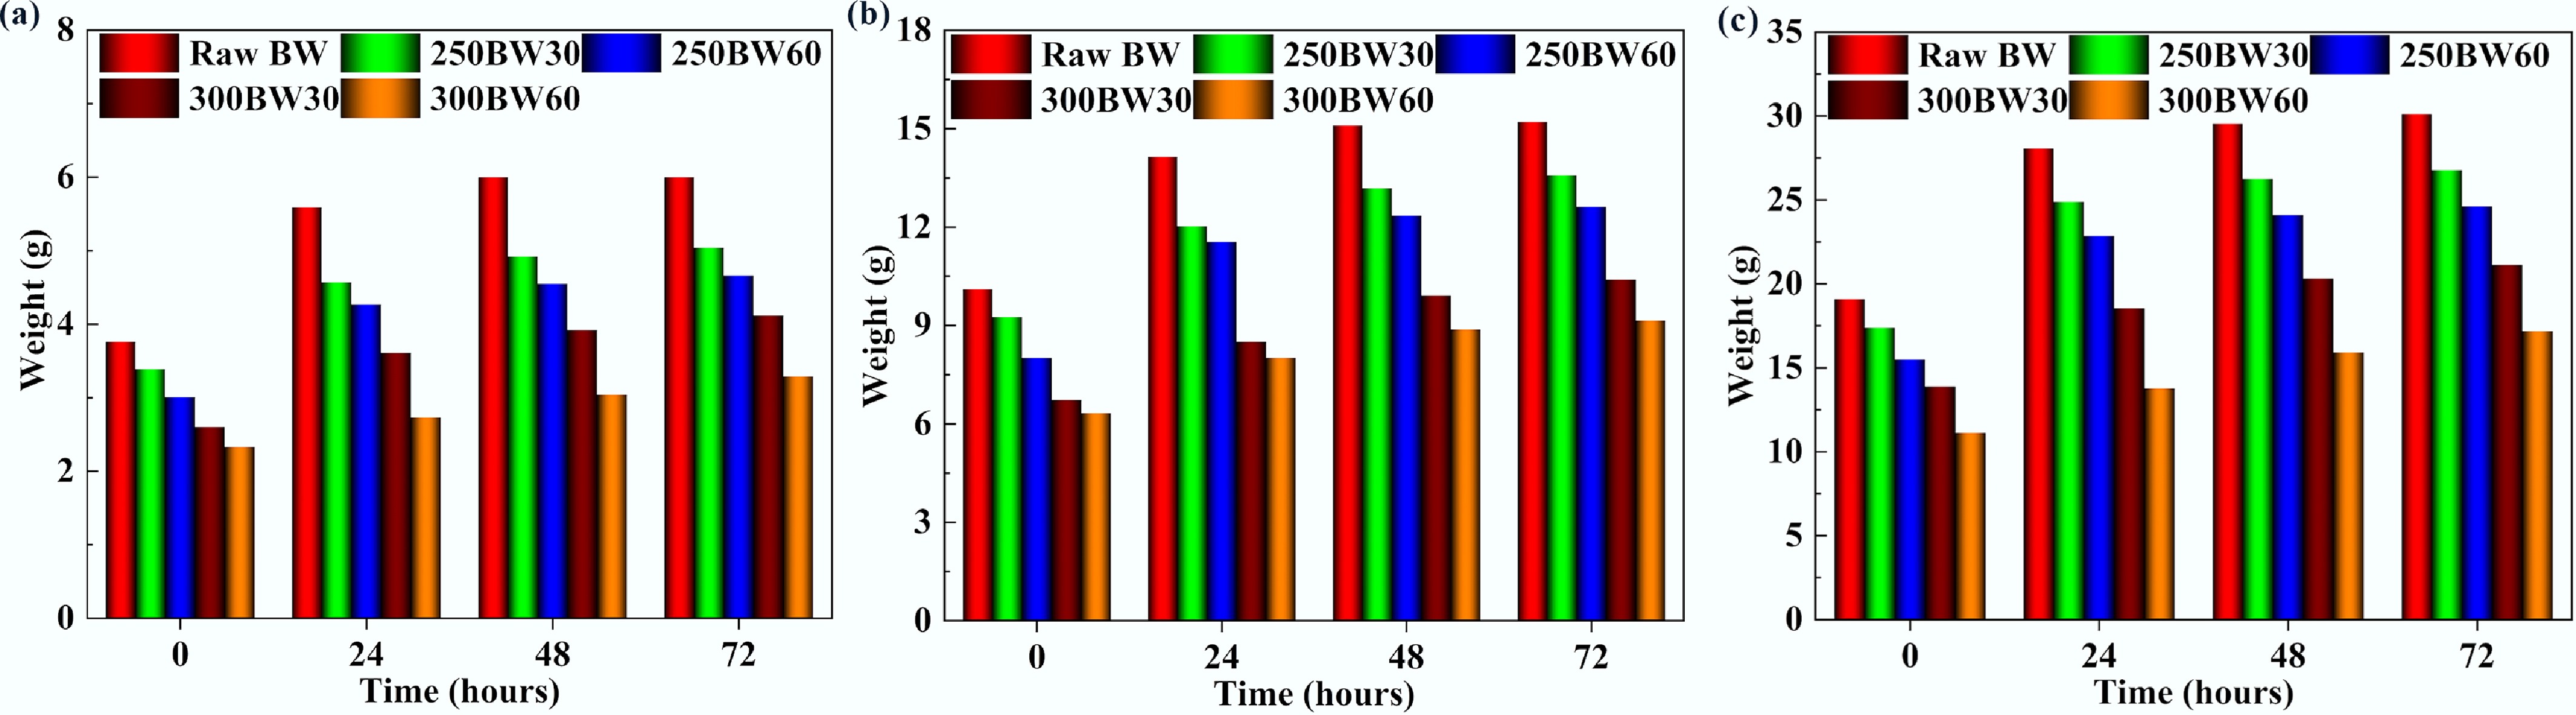
Figure 10.
Variation in the amount of water absorbed by samples with (a) 15 mm, (b) 25 mm, and (c) 35 mm diameters, torrefied at different severities.
-
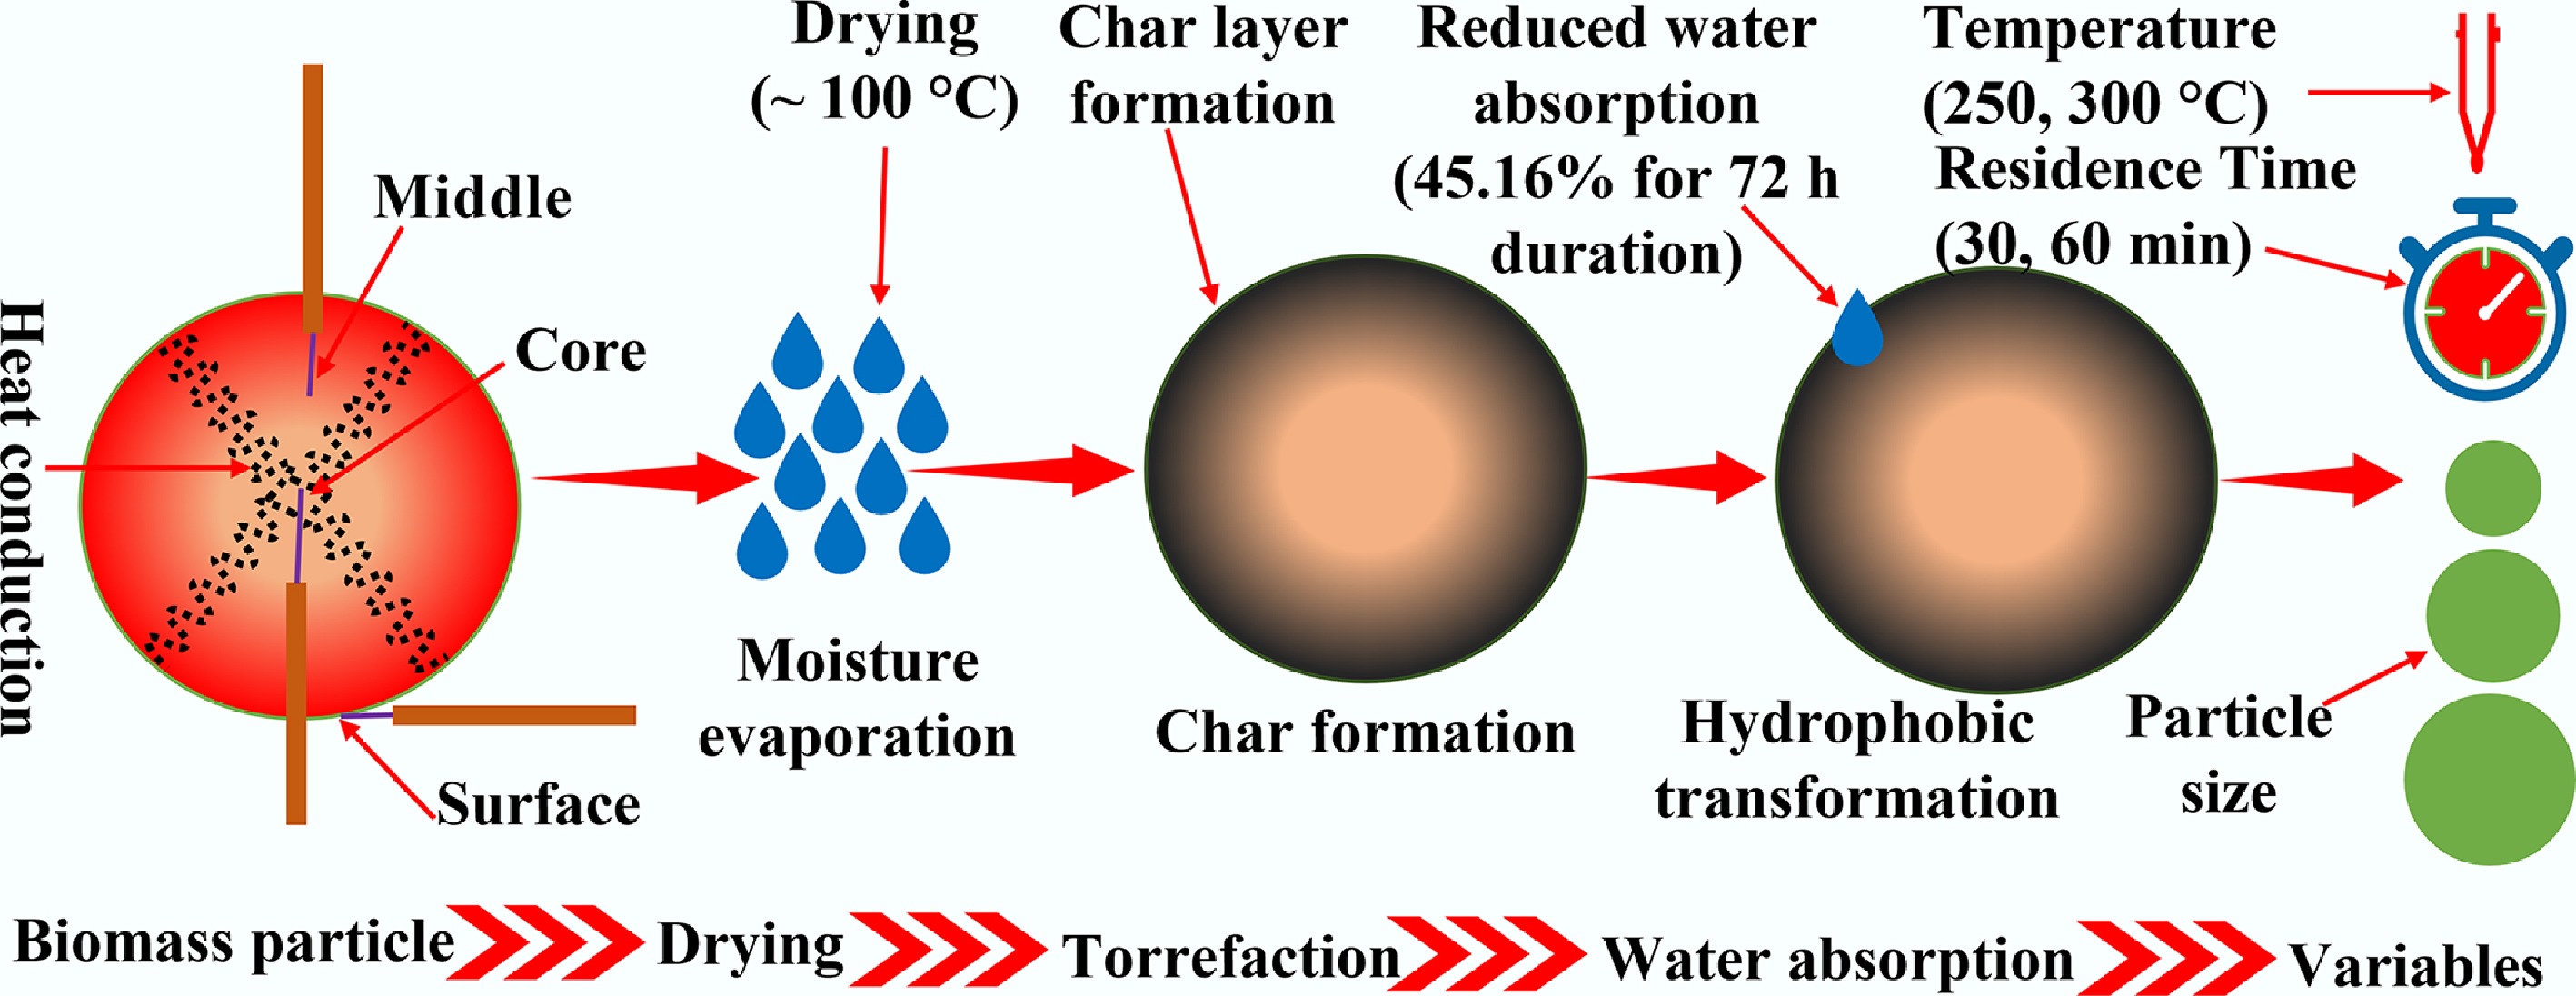
Figure 11.
Schematic of temperature progression in large biomass samples during torrefaction.
-
Parameter Raw BW Proximate analysisa, wt. (%) Mb 9.31 ± 0.33 VMc 74.60 ± 0.45 FCd, e 12.02 Ash 4.07 ± 0.05 Ultimate analysisf, wt. (%) Carbon 43.50 ± 1.86 Hydrogen 6.06 ± 0.04 Nitrogen 0.47 ± 0.07 Sulphur 0.14 ± 0.01 Oxygene 49.83 HHV (MJ/kg) 23.66 ± 0.09 a As-received basis; b M denotes moisture; c VM is volatile matter; d FC represents fixed carbon; e Calculated by difference; f dry and ash-free basis. Table 1.
Properties of raw BW sample
Figures
(11)
Tables
(1)