


-
Due to the significant increase in energy demand and the enhanced awareness of environmental protection, biomass has gained much attention because of its abundance, wide availability, and carbon neutrality[1,2]. However, for energy utilization, raw biomass has a few shortcomings, e.g., low energy density, high moisture content, heterogeneity, and high hydrophilicity, which hinder its efficient use as a fuel[3,4]. Consequently, thermal treatments such as torrefaction have emerged as a promising solution to address these challenges and enhance biomass properties[5]. Generally, torrefaction is a process involving the heating of biomass at temperatures ranging from 200–300 °C under an inert atmosphere[6]. The torrefied product is more energy-dense, with reduced moisture content and improved grindability, making it easier to handle and transport[7].
Torrefaction is influenced by parameters such as temperature, residence time, particle size, and biomass type. The torrefaction temperature significantly affects the solid product yields, physicochemical properties, and reactivities[8]. The residence time influences the torrefaction process and products, as a longer residence time provides a prolonged period for thermal reactions[9]. The diversity in the chemical compositions of different biomass species also influences the torrefaction products[10,11]. In addition, particle size is also a key parameter for the torrefaction process. He et al.[12] found that reducing Paulownia wood particle size during torrefaction decreased the solid product yield, increased the liquid product yield, and slightly affected the gas yield. Moreover, higher torrefaction temperatures, particularly 290 °C, were recommended for larger biomass particles to reduce size-related effects and shorten residence time. Niu et al.[13] explored the torrefaction of soybean straw and pine wood pellets at temperatures from 200 to 350 °C, revealing temperature-dependent changes in physicochemical properties. Specifically, torrefaction reduced oxygen-containing functional groups, enhancing hydrophobicity, and reducing hemicellulose content. Further, optimal temperatures for high-quality pellets were determined to be 250 °C for soybean straw and 300 °C for pine wood. Rousset et al.[14] studied the effect of temperature and oxygen concentration on the torrefaction of Eucalyptus grandis. They suggested the use of inert atmospheres up to 280 °C to optimize biomass reactivity. Becker et al.[15] investigated large biomass torrefaction, revealing temperature-dependent mass loss and kinetic parameters. Results demonstrated the influence of process temperature on mass loss, suggesting increased decomposition of cellulose at higher temperatures. Lu et al.[16] studied the influence of torrefaction on the single particle combustion characteristics of wood at 1,231 °C. Torrefaction reduced the devolatilization time but extended the char combustion time, showing a linear dependency on particle mass. In addition, increased torrefaction severity enhanced char yield and density, attributed to prolonged combustion. Most of these studies primarily focused on process parameters, product analyses, and characterization.
Besides this, temperature propagation and distribution inside large samples during torrefaction are also important for product characteristics and process optimization. Bourgonje et al.[17] used radially positioned thermocouples to record the temperature profiles within a cylindrical biomass particle at a torrefaction temperature of 300 °C. They revealed that larger samples experienced slow heating, necessitating a longer duration to generate torr-gas. Basu et al.[18] revealed a temperature overshoot in the core of a poplar wood sample during torrefaction, which exceeded the furnace temperature of 250 °C. They attributed this temperature overshoot to the occurrence of exothermic reactions at high torrefaction temperatures. Turner et al.[19] performed the torrefaction of Fagus sylvatica L. in the temperature range of 200–260 °C and found a similar temperature overshoot. They observed that the centreline position exhibited an extended drying plateau compared to the near-surface position. Despite a few studies having investigated temperature progression, the effect of sample size and torrefaction severity on the temperature progression and distribution inside large biomass samples is more rarely reported. Although commercial pellets are typically 6–8 mm in diameter, biomass is frequently processed and torrefied as larger pieces (e.g., chips, briquettes, or large densified cylinders) where internal thermal non-uniformity can be substantial. Therefore, we intentionally investigated larger diameters to quantify the extent of internal gradients and to provide guidance for designing residence time and geometry when torrefaction is applied prior to final size reduction/pelletization.
Therefore, in this work, the influence of sample size and torrefaction severity on the temperature progression inside large biomass samples was investigated. For the torrefaction experiments, birchwood (BW) was selected in different sizes. Specifically, three different lengths of 30, 40, and 50 mm, each length corresponding to three distinct diameters (15, 25, and 35 mm), were used. The torrefaction experiments were conducted at 250 and 300 °C with residence times of 30 and 60 min. To record the temperature profiles, three K-type thermocouples were placed at the core, middle, and surface locations of the particles. Subsequently, the effects of particle size, torrefaction temperature, and residence time on the temperature progressions inside the samples were analysed. Additionally, water absorption experiments were also performed on raw and torrefied BW samples. All these observations provided useful information on the temperature progression inside large biomass samples during torrefaction, and contribute to a better understanding of the biomass torrefaction process.
-
BW samples with a cylindrical shape were selected for the torrefaction experiments, which had three lengths (i.e., 30, 40, and 50 mm) and diameters (i.e., 15, 25, and 35 mm). To analyze the temperature progression within the sample, K-type thermocouples were placed at three different locations, i.e., the core, middle, and surface, as demonstrated in Fig. 1. Specifically, the core thermocouple was placed at the particle centre through a drilled hole, the middle thermocouple was positioned at 1/4 of the particle length from the end face and at a depth of 1/4 of the diameter, and the surface thermocouple was fixed directly on the end face. After inserting the thermocouple, the entry point was sealed with a high-temperature, inert sealing compound to minimize gas leakage and prevent movement of the junction during heating. Note that the particle initial weight was recorded after drilling the hole, but before the thermocouple attachment. Also, the raw biomass samples were characterized using the procedures reported in our previous work[20].
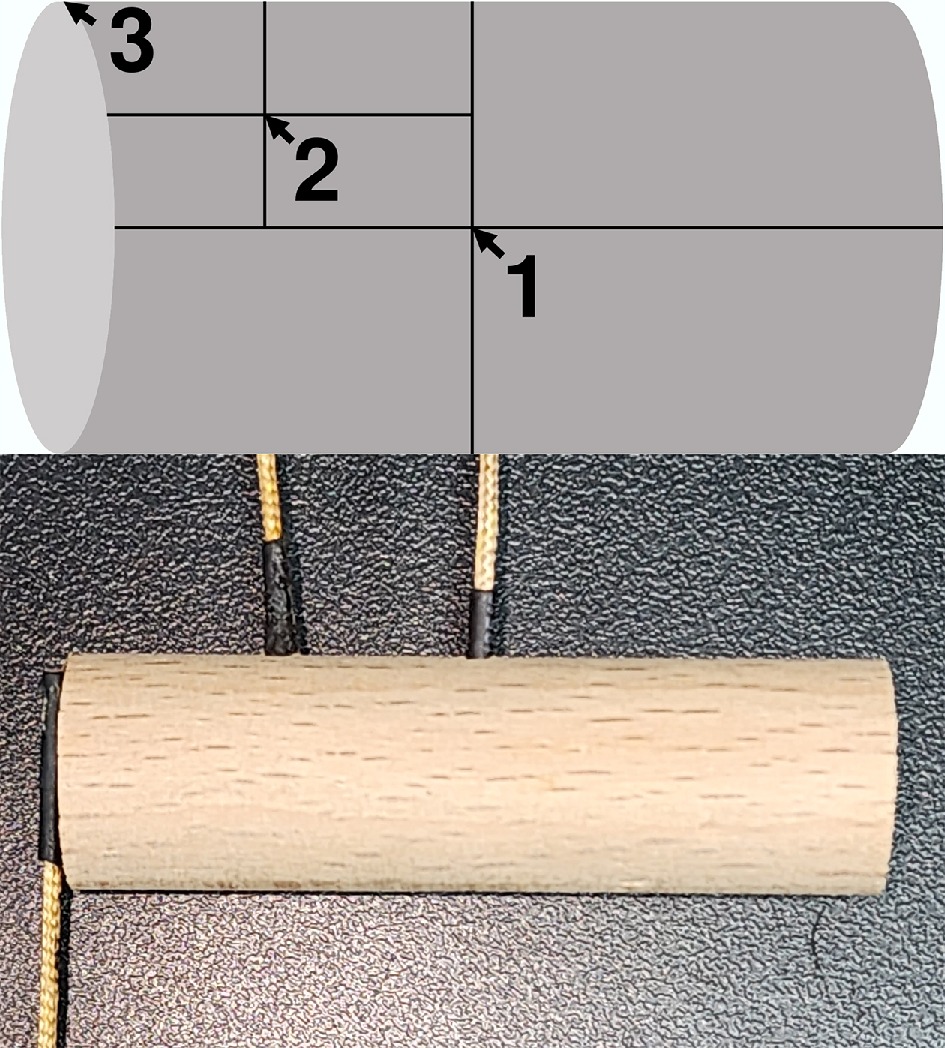
Figure 1.
Different thermocouple locations: (1) core, (2) middle, and (3) surface.
Torrefaction experiments
-
The torrefaction experiments were conducted in a horizontal quartz tube furnace (SG-GL1100K-100), which was manufactured by Zhuochi Instrument Co., Ltd, Hangzhou, China. Two torrefaction temperatures (i.e., 250 and 300 °C), and residence times (i.e., 30 and 60 min) were tested. The sample particle was placed horizontally in a ceramic boat and moved to the middle of the furnace. To establish an inert atmosphere inside the furnace, the reactor was purged with nitrogen for 30 min at a flow rate of 1 L/min before each experiment. Subsequently, the temperature was increased from 25 °C to the desired value at a heating rate of 10 °C/min, and then held constant for the required residence time. Meanwhile, the temperature histories of the thermocouples were recorded. The surface temperature was measured by fixing the Type-K thermocouple junction in direct contact with the outer surface; minor run-to-run differences in measured surface temperature can occur due to contact resistance and local convective/radiative conditions, and are interpreted within the thermocouple accuracy specification. Moreover, the weight of the torrefied particle was also recorded after removing the thermocouples when each experiment was finished. To differentiate between torrefied samples, they were named as follows. The first three digits represent the torrefaction temperature, the next two letters indicate the biomass name, and the last two digits show the residence time. For example, 250BW30 represents the birchwood sample torrefied at 250 °C with a residence time of 30 min.
Water absorption test
-
For the water absorption test, the samples were initially cleaned to remove any dust and contaminants from the surface, and their initial weights were recorded. Subsequently, the samples were placed horizontally at the bottom of a container. According to TS EN 317, the particle surface was immersed 25 ± 5 mm under water with a pH value and temperature of 9.18 and 25 °C, respectively[21]. Then, after 24, 48, and 72 h, the samples were removed and weighed after draining the excess water. Note that samples with 30 mm length were chosen for the experiments. Water uptake was measured as a practical indicator of hydrophobicity improvement with torrefaction severity, which directly relates to storage stability and resistance to moisture re-absorption during handling.
-
Table 1 shows the proximate and ultimate analyses as well as the higher heating value (HHV) of the raw BW sample. The proximate analysis was performed following the procedures of Qin & Thunman[22], and the ultimate analysis was performed using CHN-2000 and 5E-IRSII sulphate analysers as reported in our previous study[23]. The HHV was experimentally measured by using a bomb calorimeter and was 23.66 MJ/kg. Additionally, the raw BW sample had a high volatile content (74.60%) and a low fixed carbon content (12.02%).
Table 1. Properties of raw BW sample
Parameter Raw BW Proximate analysisa, wt. (%) Mb 9.31 ± 0.33 VMc 74.60 ± 0.45 FCd, e 12.02 Ash 4.07 ± 0.05 Ultimate analysisf, wt. (%) Carbon 43.50 ± 1.86 Hydrogen 6.06 ± 0.04 Nitrogen 0.47 ± 0.07 Sulphur 0.14 ± 0.01 Oxygene 49.83 HHV (MJ/kg) 23.66 ± 0.09 a As-received basis; b M denotes moisture; c VM is volatile matter; d FC represents fixed carbon; e Calculated by difference; f dry and ash-free basis. Figure 2 highlights the colours of raw and different torrefied samples. The darkening intensity increased with increasing torrefaction severity, and the torrefaction temperature had a stronger effect than the residence time. During torrefaction, the degradation of hemicellulose and the formation of Maillard reaction products could lead to the formation of brown-coloured compounds[24]. In addition, the dark substances might also result from the formation of aldehydes and phenols during torrefaction[25].
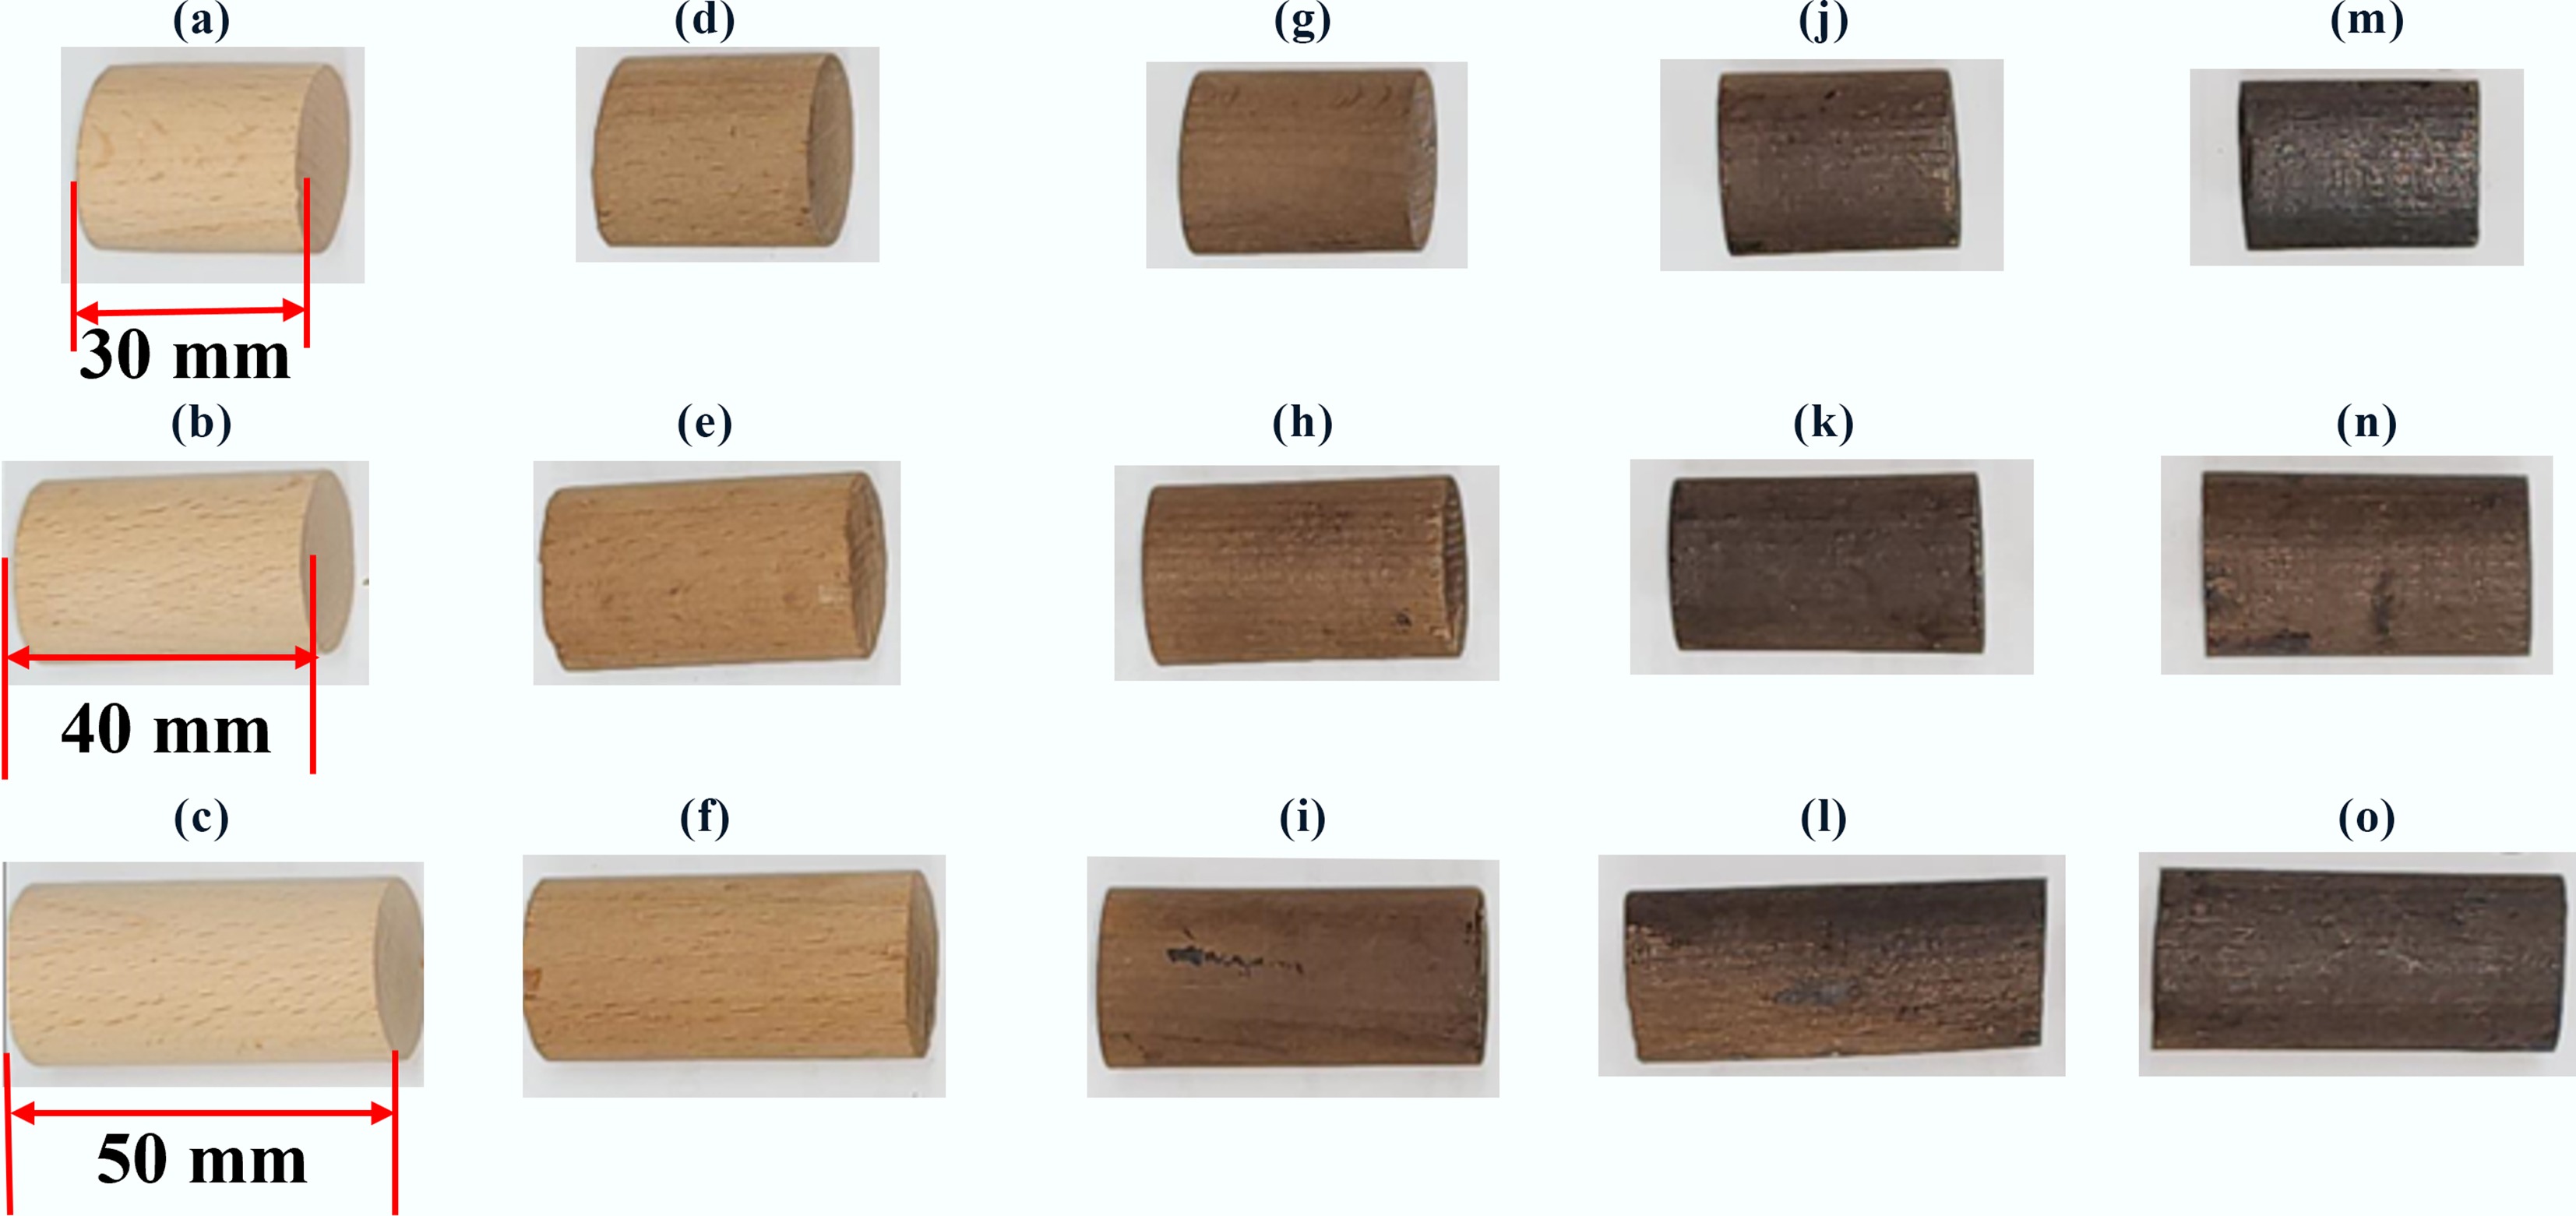
Figure 2.
Colours obtained for (a)–(c) raw BW, (d)–(f) 250BW30, (g)–(i) 250BW60, (j)–(l) 300BW30, and (m)–(o) 300BW60 samples. The samples have a diameter of 25 mm.
Figure 3 depicts the mass yields obtained for torrefied BW samples with different diameters and lengths. The mass yield after torrefaction decreased with increasing torrefaction severity, and the torrefaction temperature exerted a stronger influence than the residence time. Specifically, the mass yield was the highest for the 250BW30 samples and the lowest for the 300BW60 samples, although the quantitative values also slightly changed with the particle length and diameter. In general, increasing the torrefaction temperatures or residence times leads to intensified breakdown and removal of volatile components from the biomass, thus reducing the mass yield[26]. Where mass yield differences across lengths are small, relative to the uncertainty bounds, the results should be interpreted cautiously, and additional replicated measurements would be required to resolve subtle length effects.
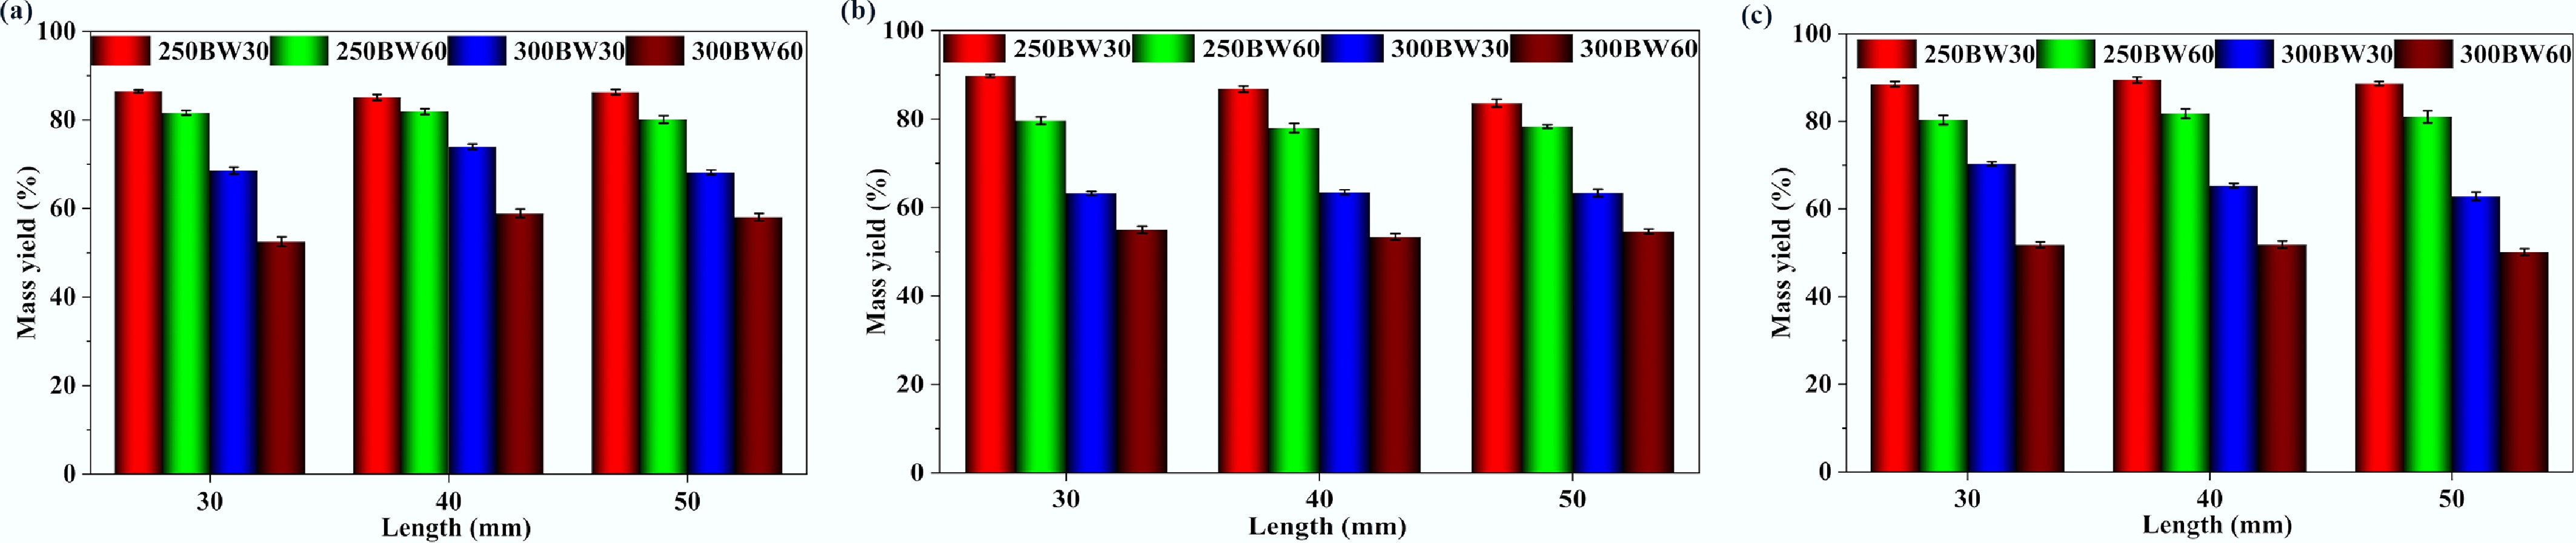
Figure 3.
Mass yields obtained for torrefied samples with different diameters and lengths. Particle diameters are (a) mass yields for 15 mm diameter samples, (b) mass yields for 25 mm diameter samples, and (c) mass yields for 35 mm diameter samples.
Effect of particle size on temperature progression
-
Figures 4 and 5 present the variations of surface, middle, and core temperatures with time for 250BW30 and 250BW60 samples with different lengths and diameters, respectively. Meanwhile, Figs 6 and 7 depicts the variations in temperature with time for the surface, middle, and core regions of samples with various sizes for torrefaction experiments performed at 300 °C with 30 and 60 min of residence time, respectively. Increasing the particle diameter and length generally decreased the rate of temperature progression for the middle and core positions, while its effect on the surface temperature was marginal and thus the surface temperature curves at different sample sizes were close to each other. Moreover, at the middle and core locations, the particle diameter seemed to exert a stronger influence than its length. A simple scaling argument supports the stronger diameter effect: for a cylinder, the characteristic internal diffusion times scale as tr ~ R2/α (radial) and tz ~ (L/2)2/α (axial). Across the tested geometries, R changes substantially (15–35 mm diameter) while L/2 changes more modestly (30–50 mm length), so the increase in tr is the dominant contributor to delayed core heating and larger core–surface gradients. Accordingly, the temperature progression is more sensitive to diameter than length under the present heating configuration. A plateau in the curve was observed at approximately 100 °C, indicating the drying stage. After the drying plateau, the sample temperature rises toward the set-point as latent heat demand diminishes; this post-plateau interval occurs in the temperature range where hemicellulose devolatilization is expected during torrefaction, although the temperature curves alone do not provide direct chemical speciation. The ~100 °C plateau reflects latent-heat-limited heating during internal water evaporation. In large cylinders, an evaporation front can move from the surface toward the core as liquid water migrates and vapor escapes through the pore network, so moisture gradients persist for longer times and locally absorb heat, buffering temperature rise. Once drying is largely complete, the temperature can increase more rapidly because latent heat demand diminishes and internal transport pathways open, which can also contribute to the conditions under which a transient core overshoot is observed. The plateau width increased with the particle size and was larger at the core position, suggesting a longer drying process. After the plateau, the biomass particle underwent various processes such as depolymerization and devolatilization of organic compounds[27], which resulted in carbonization and the formation of torrefied biochar. At a specific location, the temperature progression curves exhibited a similar evolving trend for different particle sizes. Thus, when exploring the effect of other parameters, the particle with a diameter of 35 mm and a length of 50 mm was normally chosen.
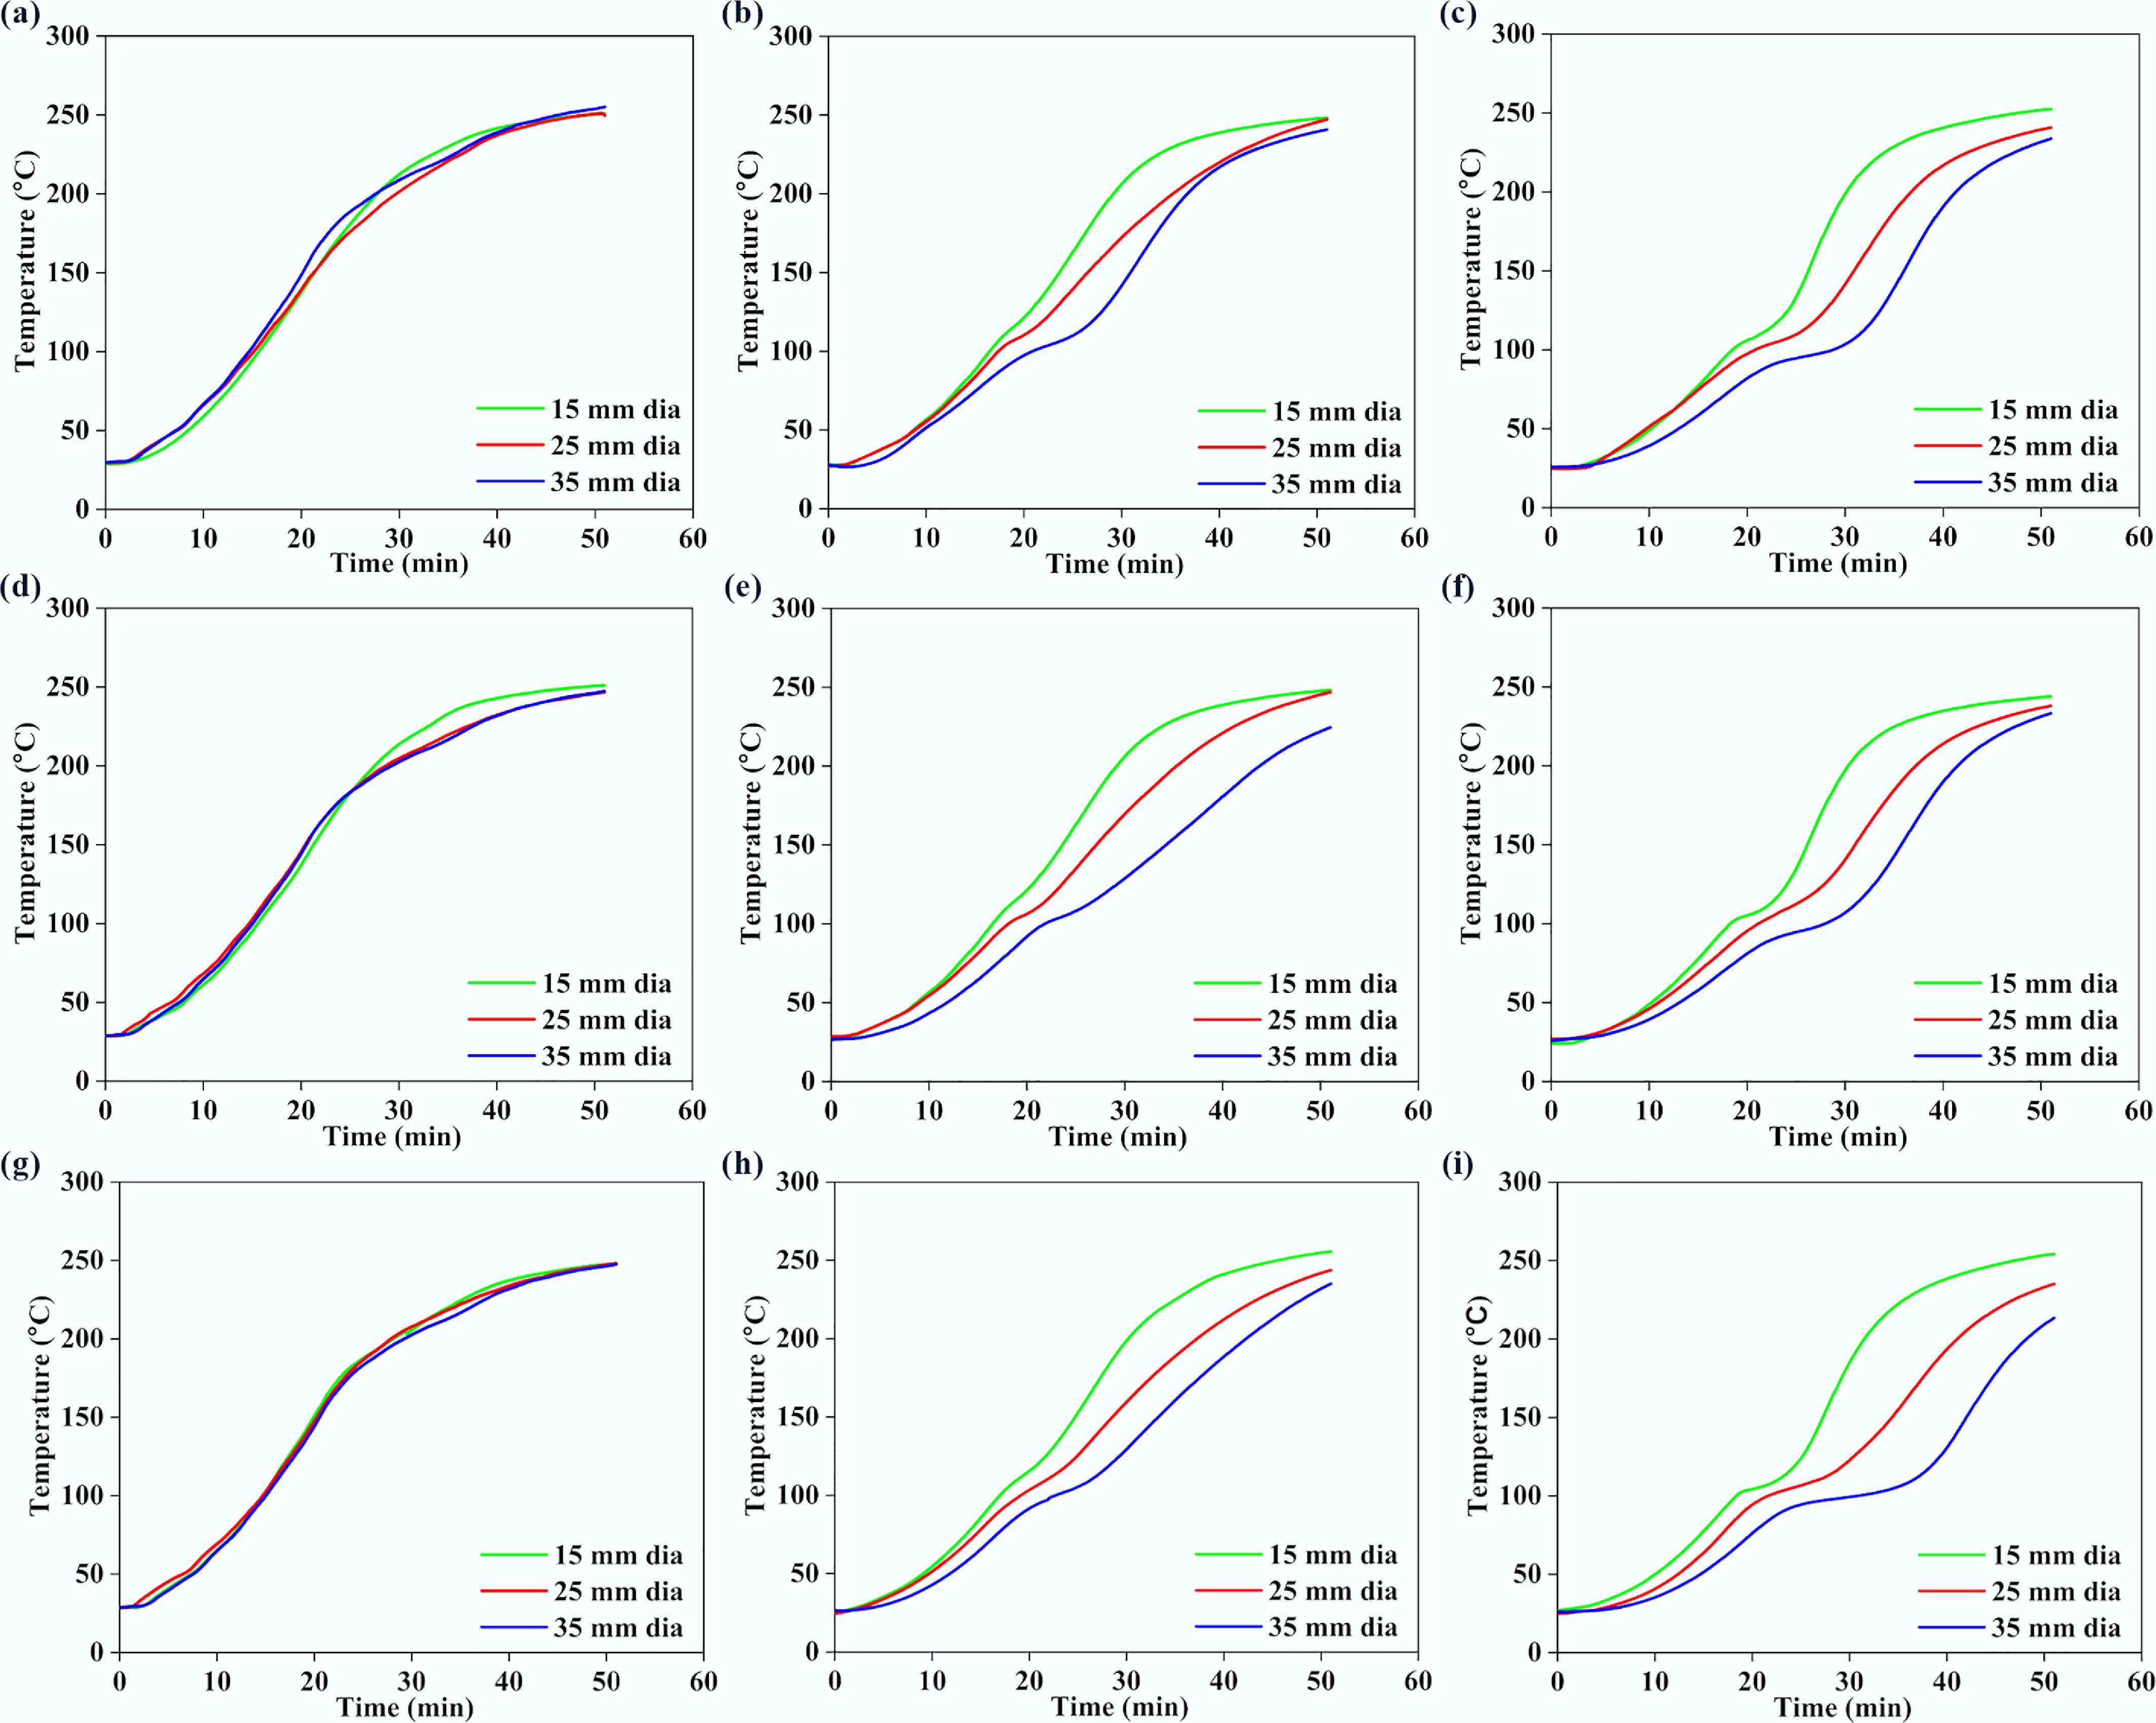
Figure 4.
Variations in (a), (d), (g) surface, (b), (e), (h) middle, and (c), (f), (i) core temperatures with time, for 250BW30 particles with different lengths. Panels (a)–(c), (d)–(f), and (g)–(i), correspond to particle lengths of 30, 40, and 50 mm, respectively.
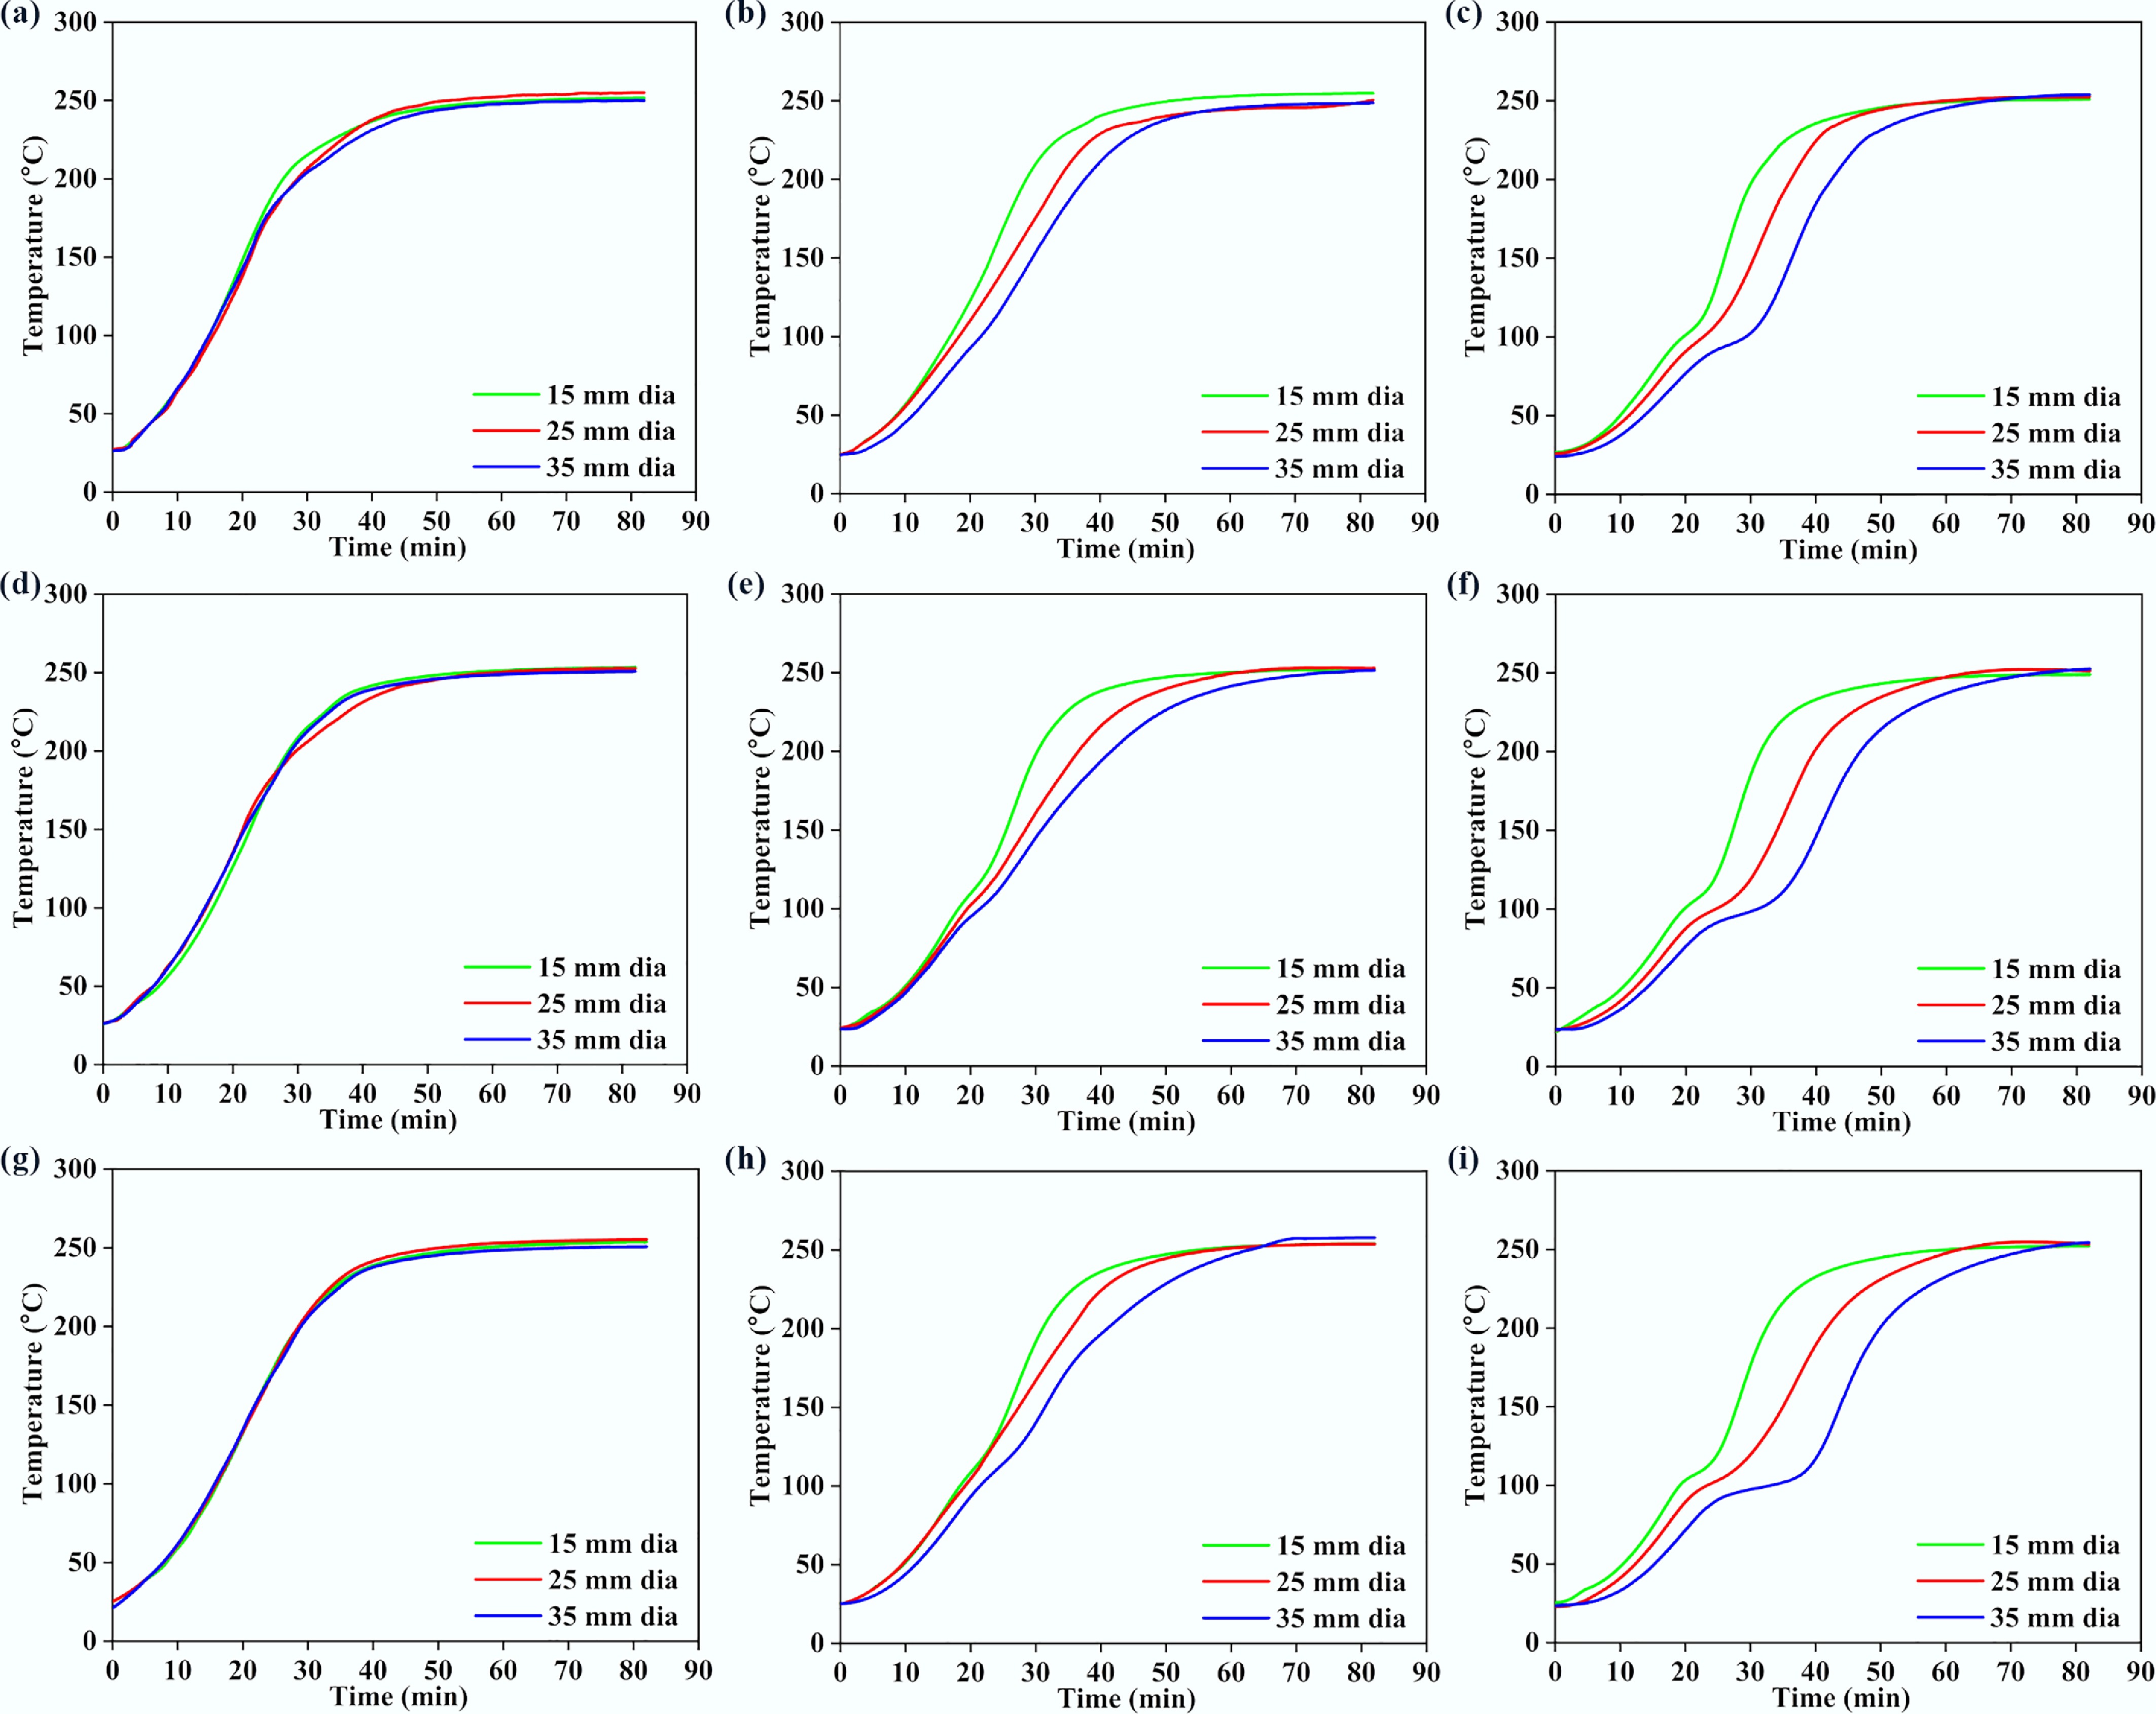
Figure 5.
Variations in (a), (d), (g) surface, (b), (e), (h) middle, and (c), (f), (i) core temperatures with time, for 250BW60 particles with different lengths and diameters. Panels (a)–(c), (d)–(f), and (g)–(i) correspond to particle lengths of 30, 40, and 50 mm, respectively.
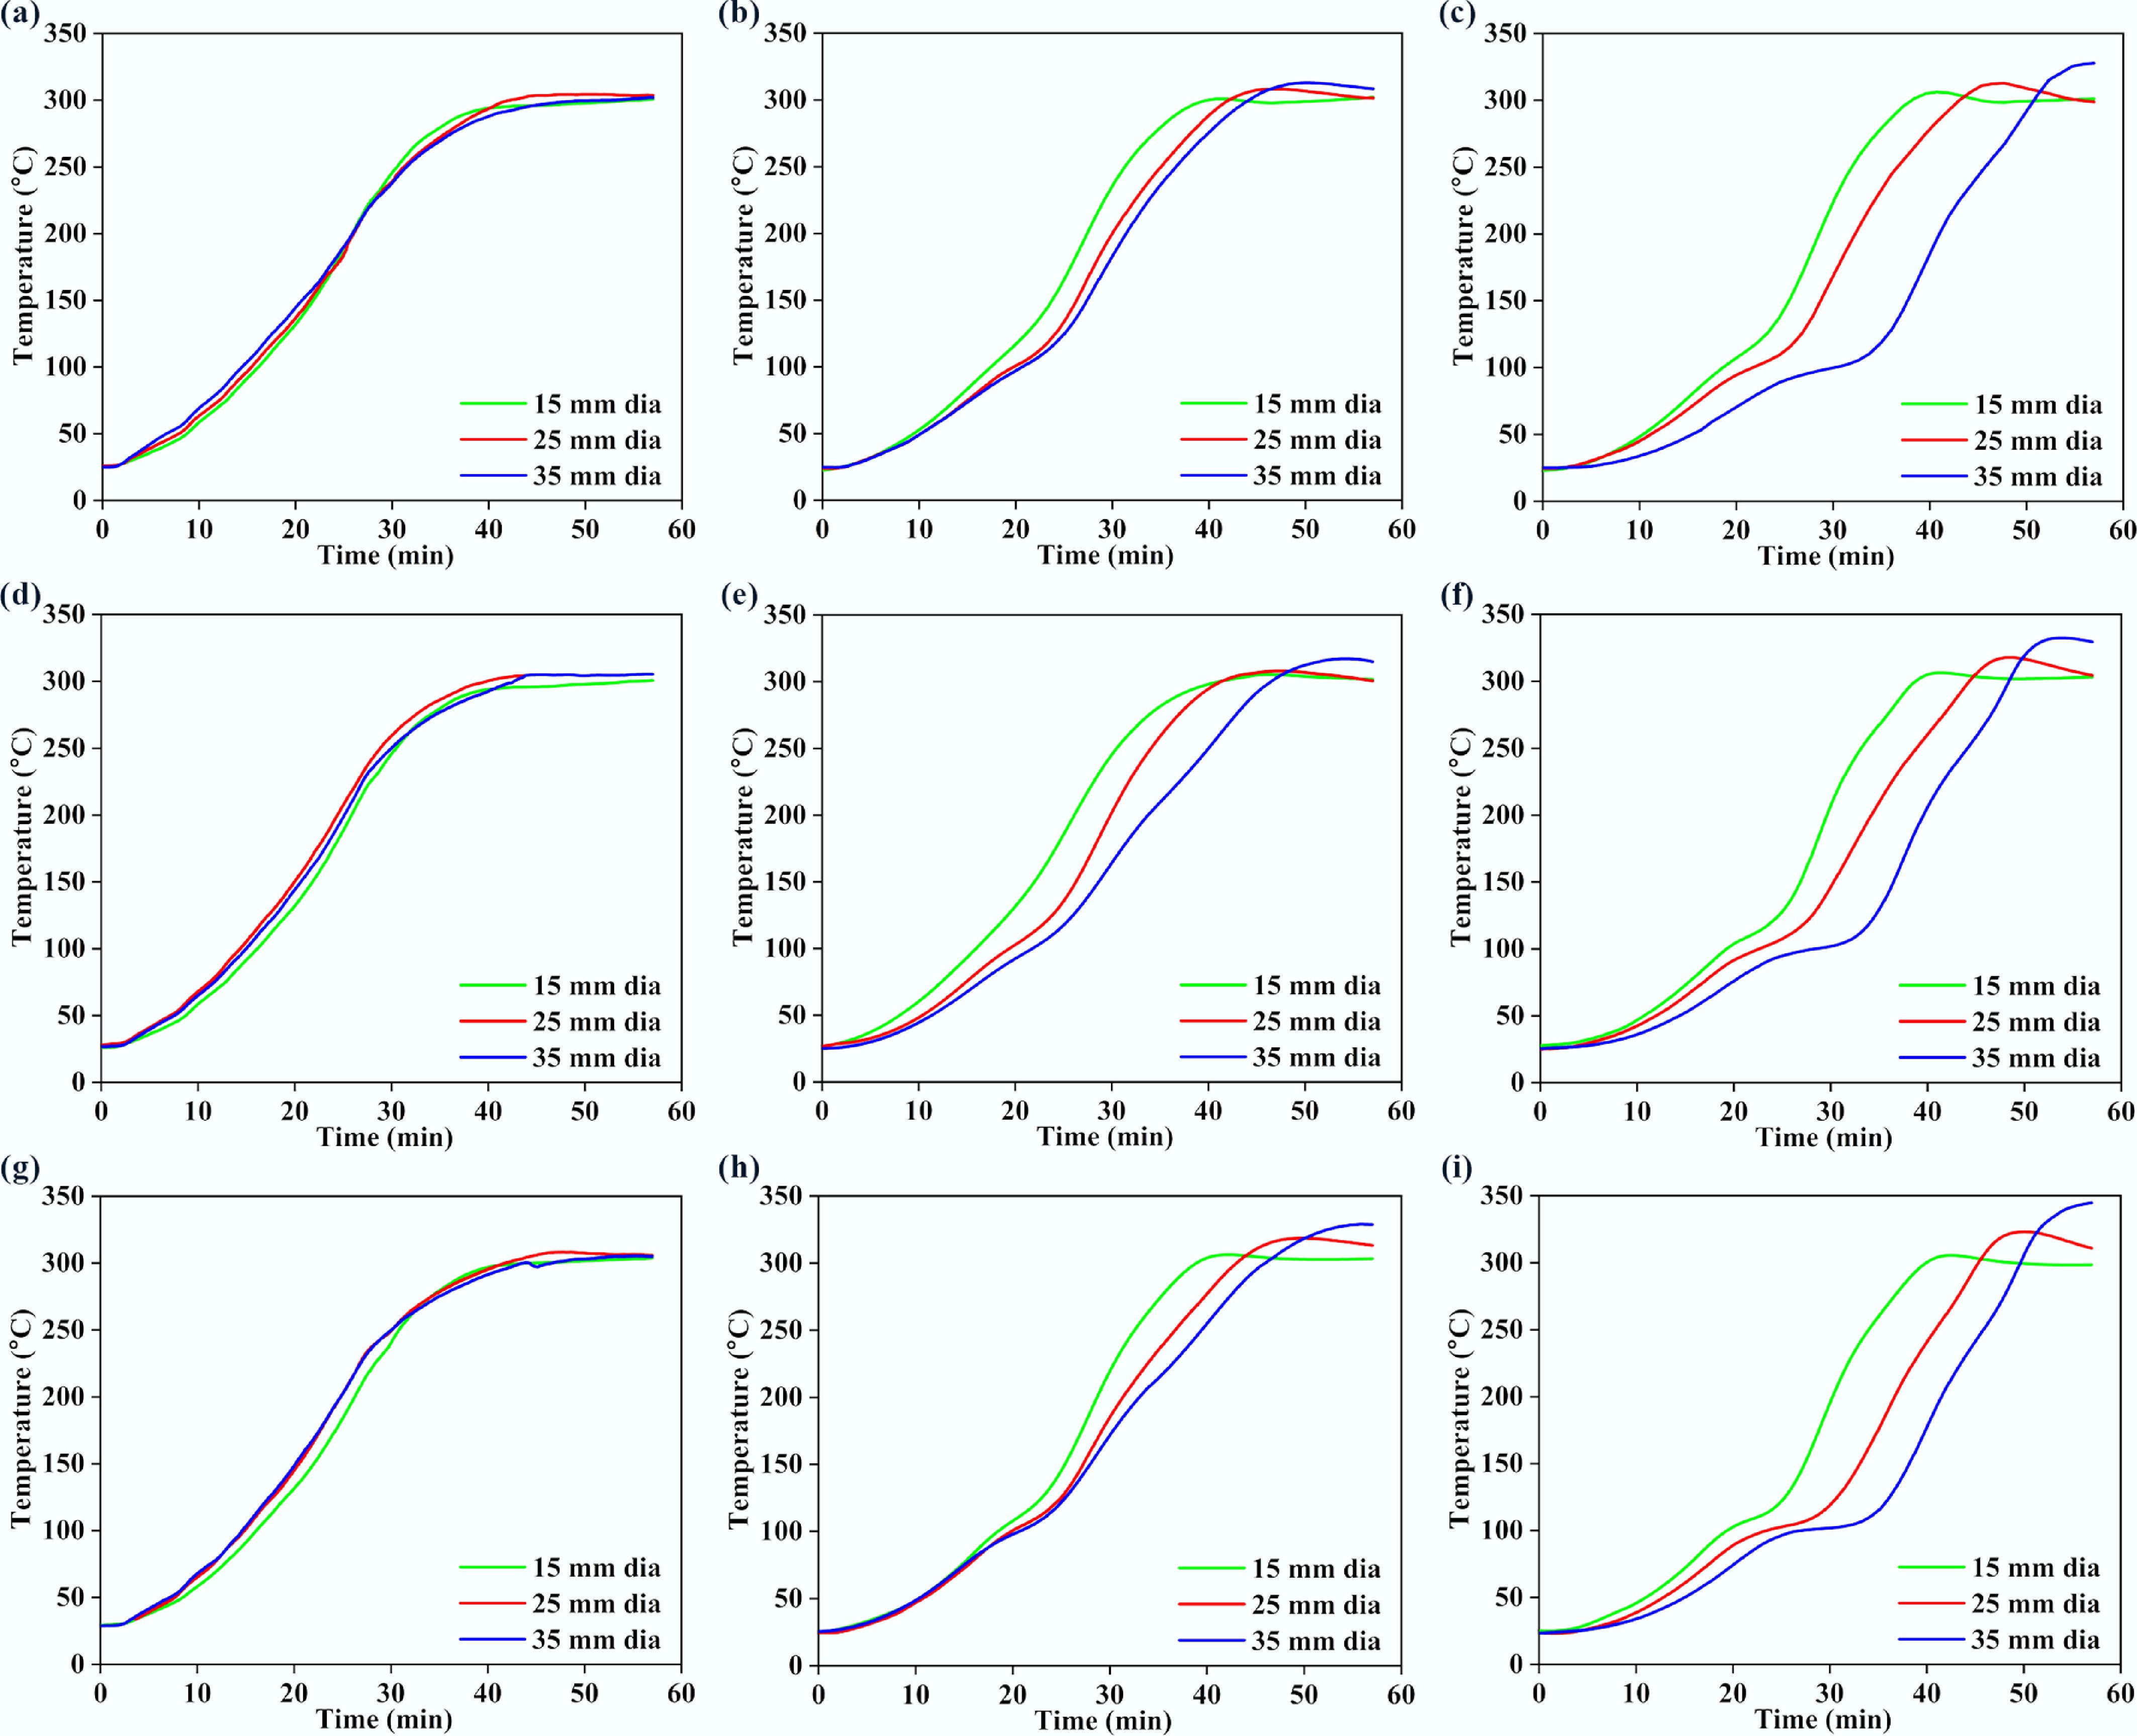
Figure 6.
Variations in (a), (d), (g) surface, (b), (e), (h) middle, and (c), (f), (i) core temperatures with time, for 300BW30 particles with different lengths and diameters. Panels (a)–(c), (d)–(f), and (g)–(i) correspond to particle lengths of 30, 40, and 50 mm, respectively.
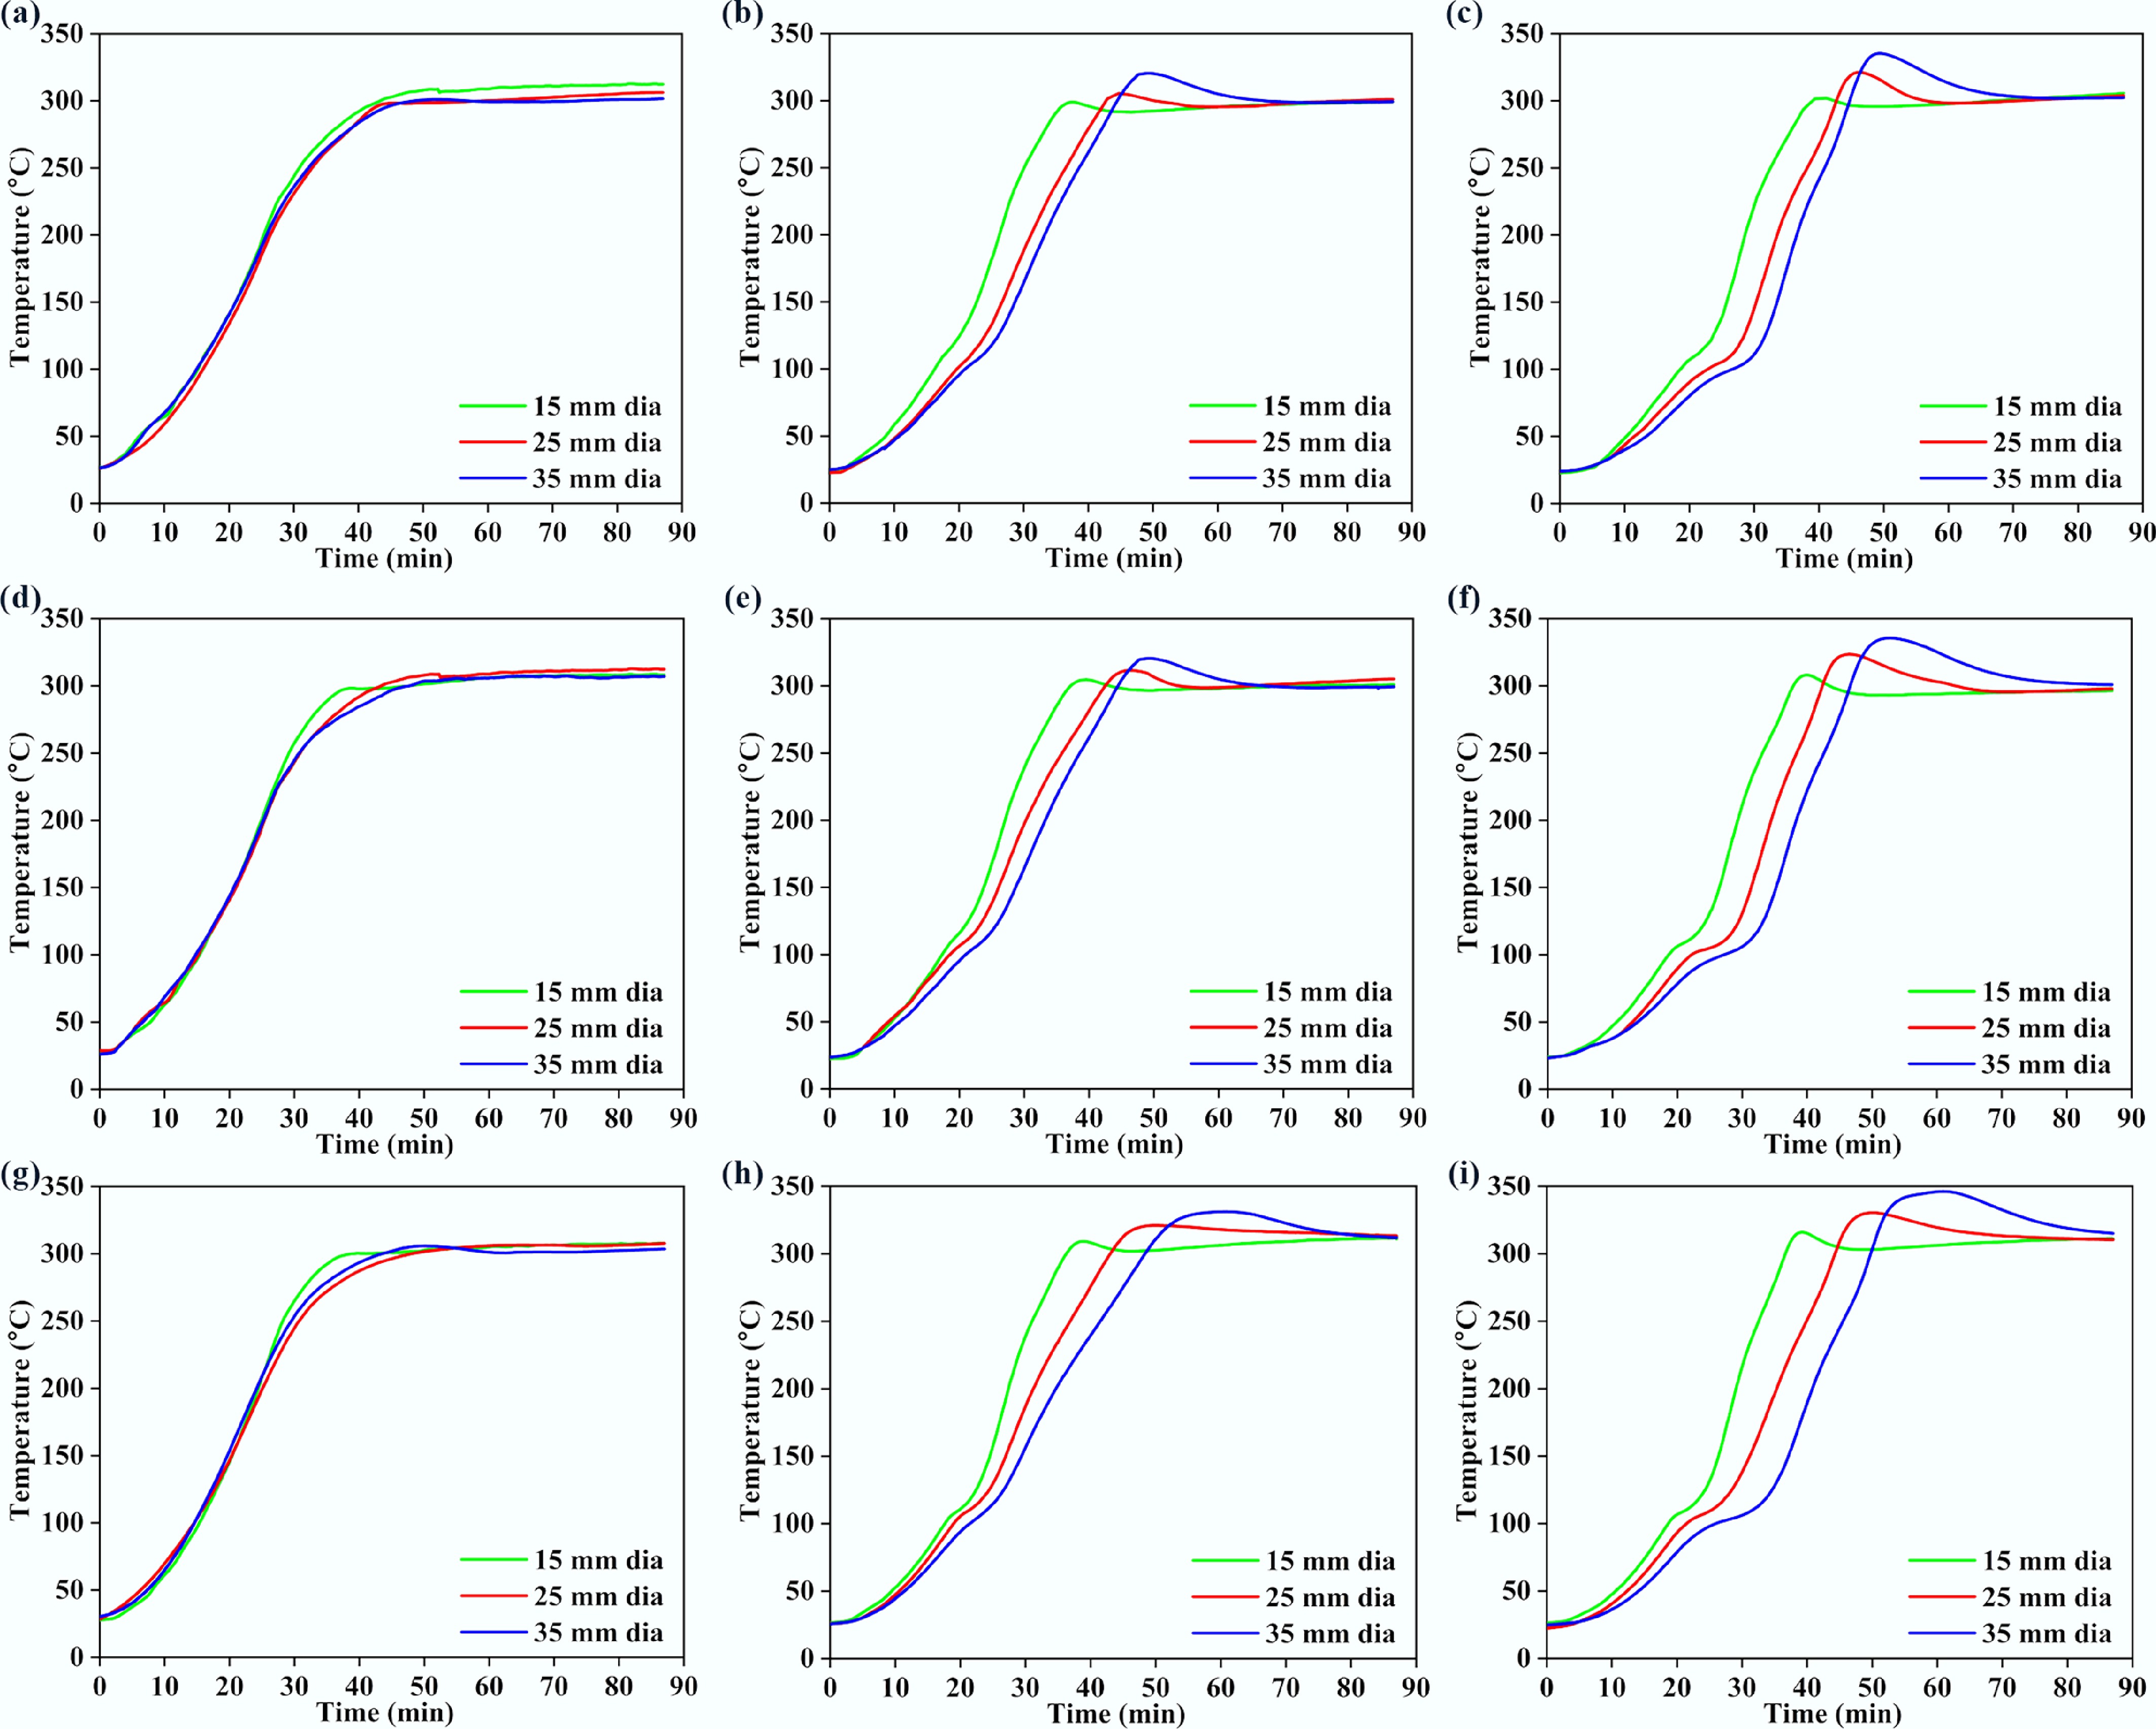
Figure 7.
Variations in (a), (d), (g) surface, (b), (e), (h) middle, and (c), (f), (i) core temperatures with time for 300BW60 particles with different lengths and diameters. Panels (a)–(c), (d)–(f), and (g)–(i) correspond to particle lengths of 30, 40, and 50 mm, respectively.
Effect of torrefaction temperature on temperature progression
-
Figure 8 displays the variations of surface, middle, and core temperatures with time for the samples torrefied at 250 and 300 °C with a residence time of 60 min. The effect of the torrefaction temperature became obvious after approximately 20 min, and increasing the torrefaction temperature enhanced the temperature progression rate inside the particle. Interestingly, for the 300BW60 sample, a temperature overshoot was observed for all three locations, and such a phenomenon was most pronounced at the core position[28]. The transient core temperature overshoot observed at 250–300 °C is consistent with the onset of hemicellulose-dominated devolatilization and associated heat release within the porous matrix, which can locally raise the solid temperature when internal heat generation temporarily exceeds radial heat dissipation. The overshoot becomes more pronounced at larger diameters because the characteristic radial conduction length increases, reducing the rate at which the core can reject heat to the cylinder surface and the surrounding hot gas. It could be due to the exothermic reactions during torrefaction, which released heat energy and resulted in the particle temperature exceeding the operating temperature[29]. Additionally, the formation of char could also restrict heat dissipation, leading to a raised local temperature[30].
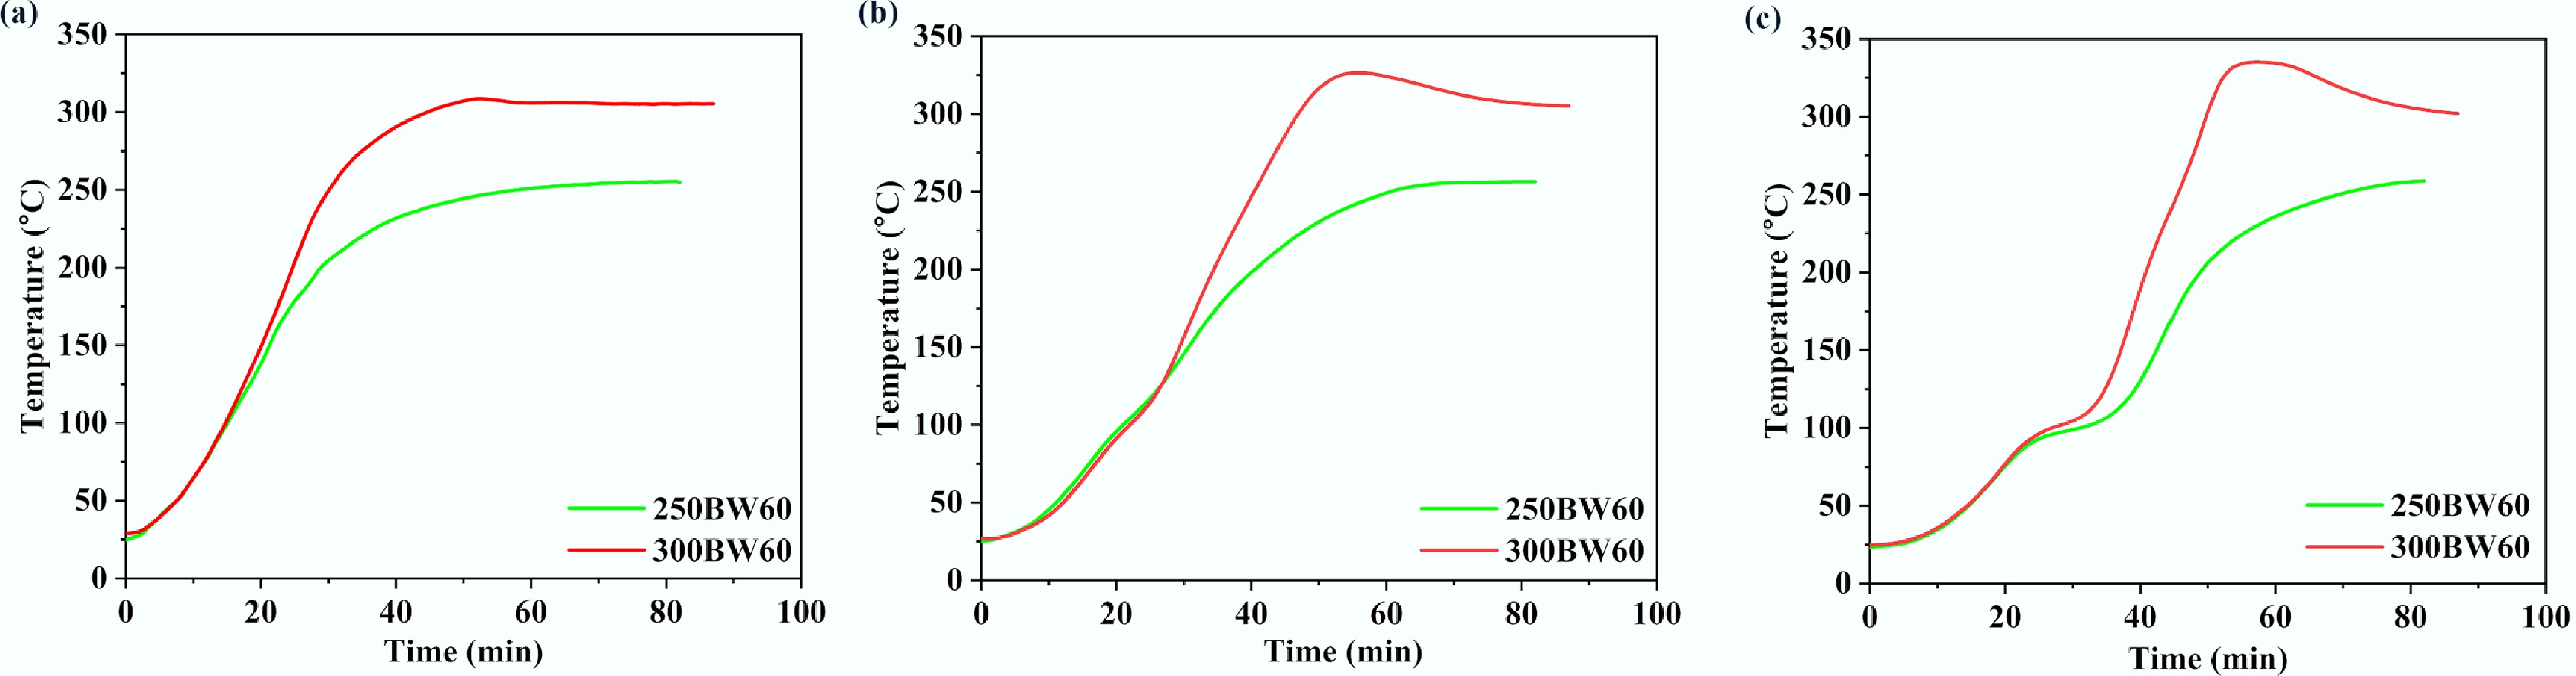
Figure 8.
Variations of (a) surface, (b) middle, and (c) core temperatures with time for 250BW60 and 300BW60 samples. The particle has a diameter of 35 mm and a length of 50 mm.
Effect of residence time on temperature progression
-
Figure 9 shows the variation of surface, middle, and core temperatures with time for the samples torrefied at 250 °C with residence times of 30 and 60 min. For the 250BW30 sample, the final temperatures at the middle and core positions were below the torrefaction temperature (i.e., 250 °C), indicating that a 30 min residence time was not long enough. For the 250BW60 sample, the residence time was 60 min, which was sufficient, and the final temperatures at the middle and core locations reached the operating temperature, thus resulting in a more uniform temperature distribution inside the particle. In this study, sufficient residence time refers to achieving a quasi-steady thermal state inside the cylinder, operationally defined as the convergence of the surface, middle, and core temperatures to within the thermocouple uncertainty and maintaining this convergence over time. Because chemical conversion was not monitored in situ (e.g., via off-gas analysis), we use this thermal-convergence criterion rather than claiming full reaction completion. Therefore, increasing the residence time could enable the particle to achieve a similar degree of torrefaction throughout the particle.
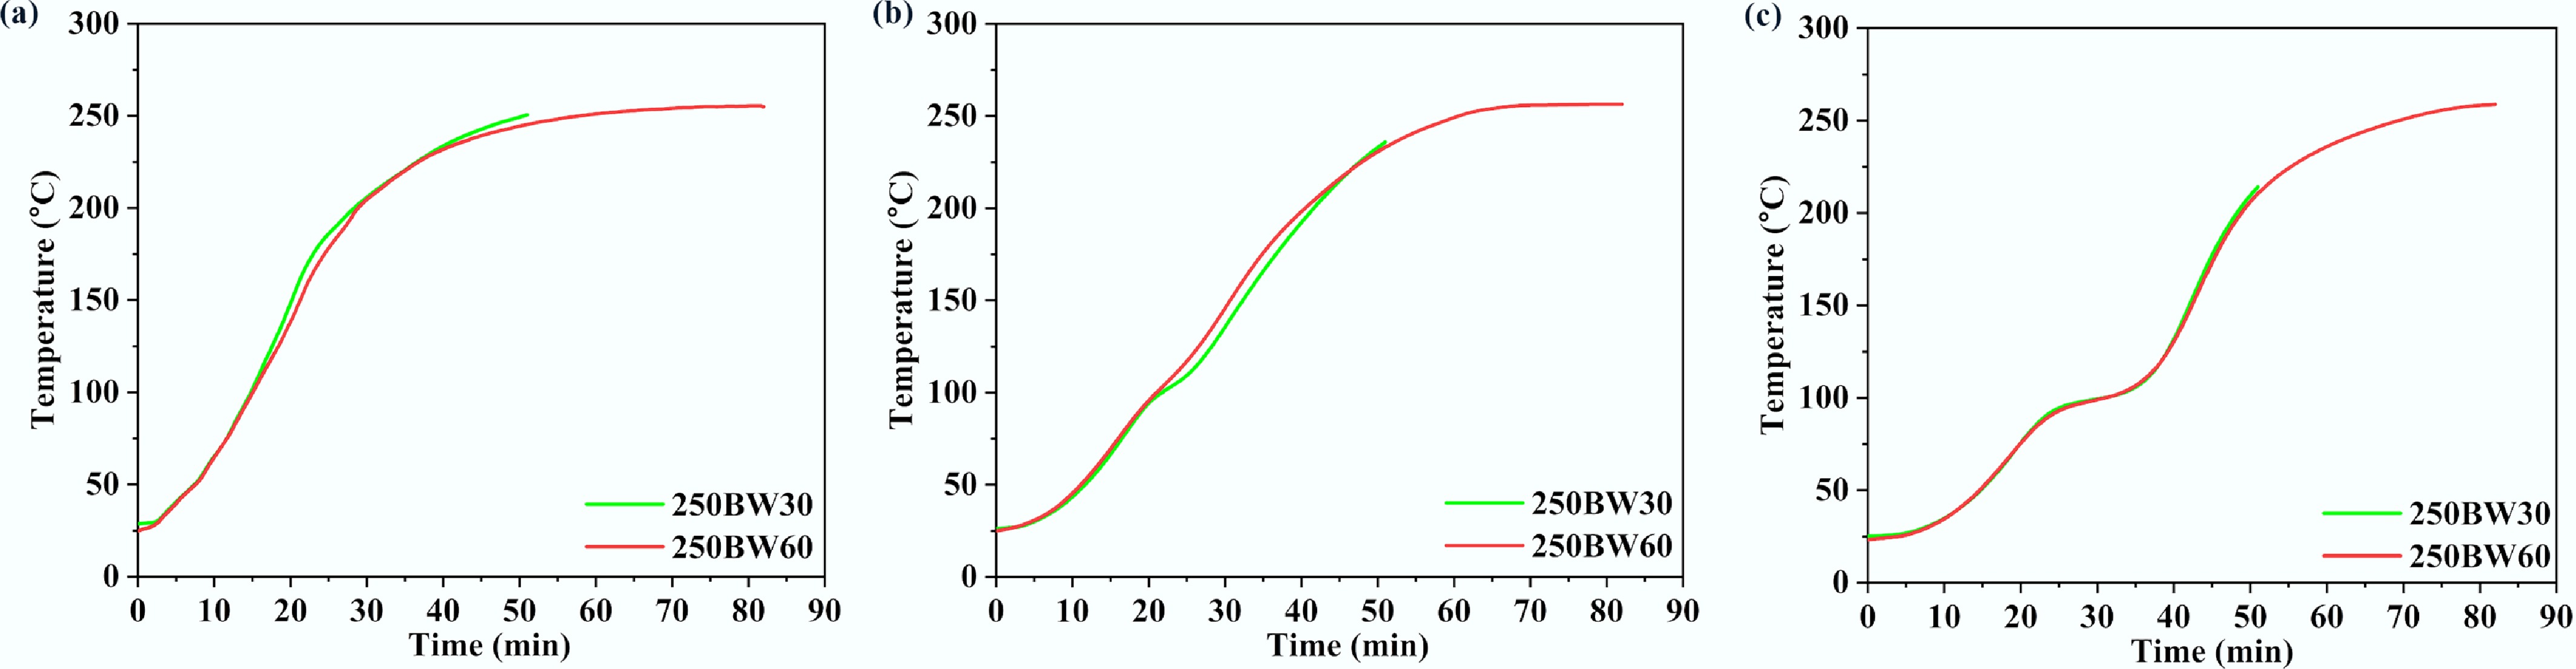
Figure 9.
Temperatures at the (a) surface, (b) middle, and (c) core locations for 250BW30 and 250BW60 samples. The particle has a diameter of 35 mm and a length of 50 mm.
Water absorption analysis
-
Figure 10 highlights the variation in the amount of water absorbed by samples subjected to various torrefaction severities over durations of 24, 48, and 72 h. The significantly large gap between the lines representing initial weight and weight after 24 h of water immersion showed that the samples absorbed the highest quantity of water during the first 24 h. Also, the quantity of water absorbed by the samples gradually decreased after 48- and 72-h duration. In particular, for the raw BW sample, the amount of water absorbed after 48 and 72 h was similar. The amount of water absorbed decreased for all diameters when the torrefaction temperature was raised from 250 to 300 °C. During torrefaction, the formation of tar within particle pores can reduce water absorption due to lowered water mobility. Additionally, torrefaction transforms hydrophilic groups into hydrophobic ones, making the samples water repellent[31,32]. The lower water uptake with increasing torrefaction severity is consistent with reduced hydrophilicity (depletion of hydroxyl-containing hemicellulose/cellulose moieties) and with the redistribution/condensation of released volatiles that can partially block pore throats. In large cylinders, spatial temperature gradients may further amplify this effect by creating more severely treated regions (typically nearer the hottest locations), which would exhibit stronger hydrophobization and potential pore sealing.
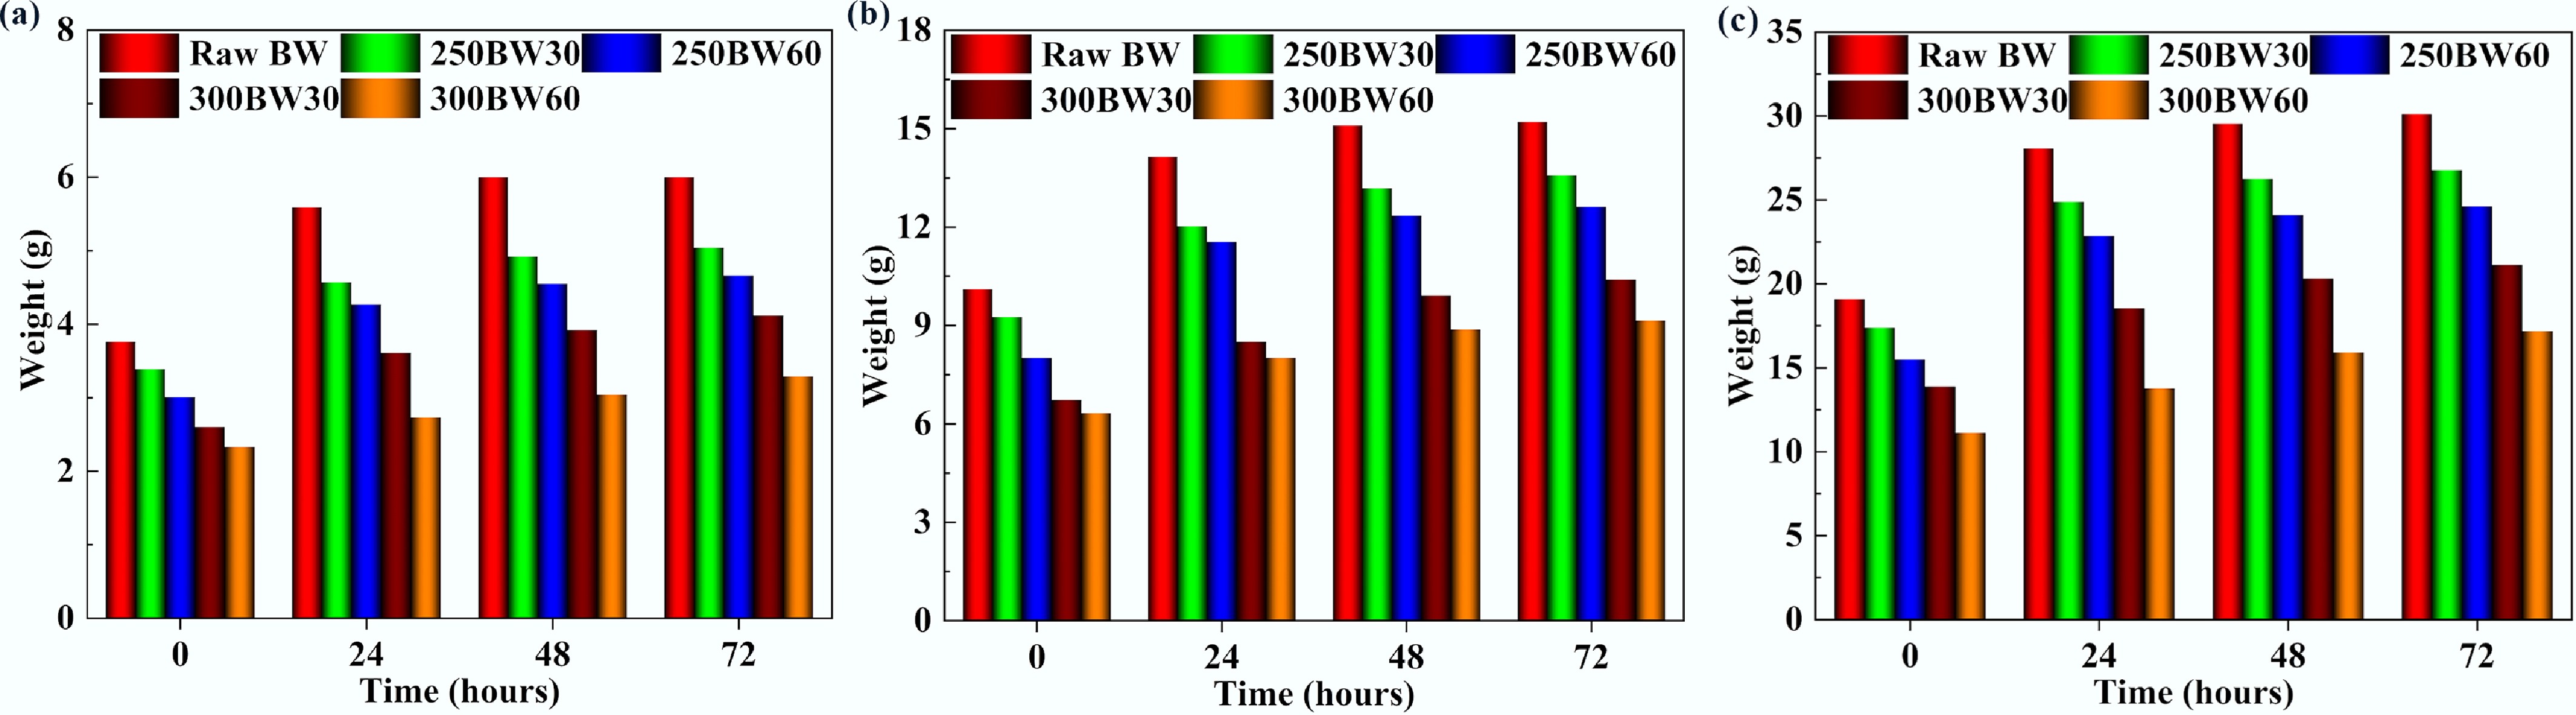
Figure 10.
Variation in the amount of water absorbed by samples with (a) 15 mm, (b) 25 mm, and (c) 35 mm diameters, torrefied at different severities.
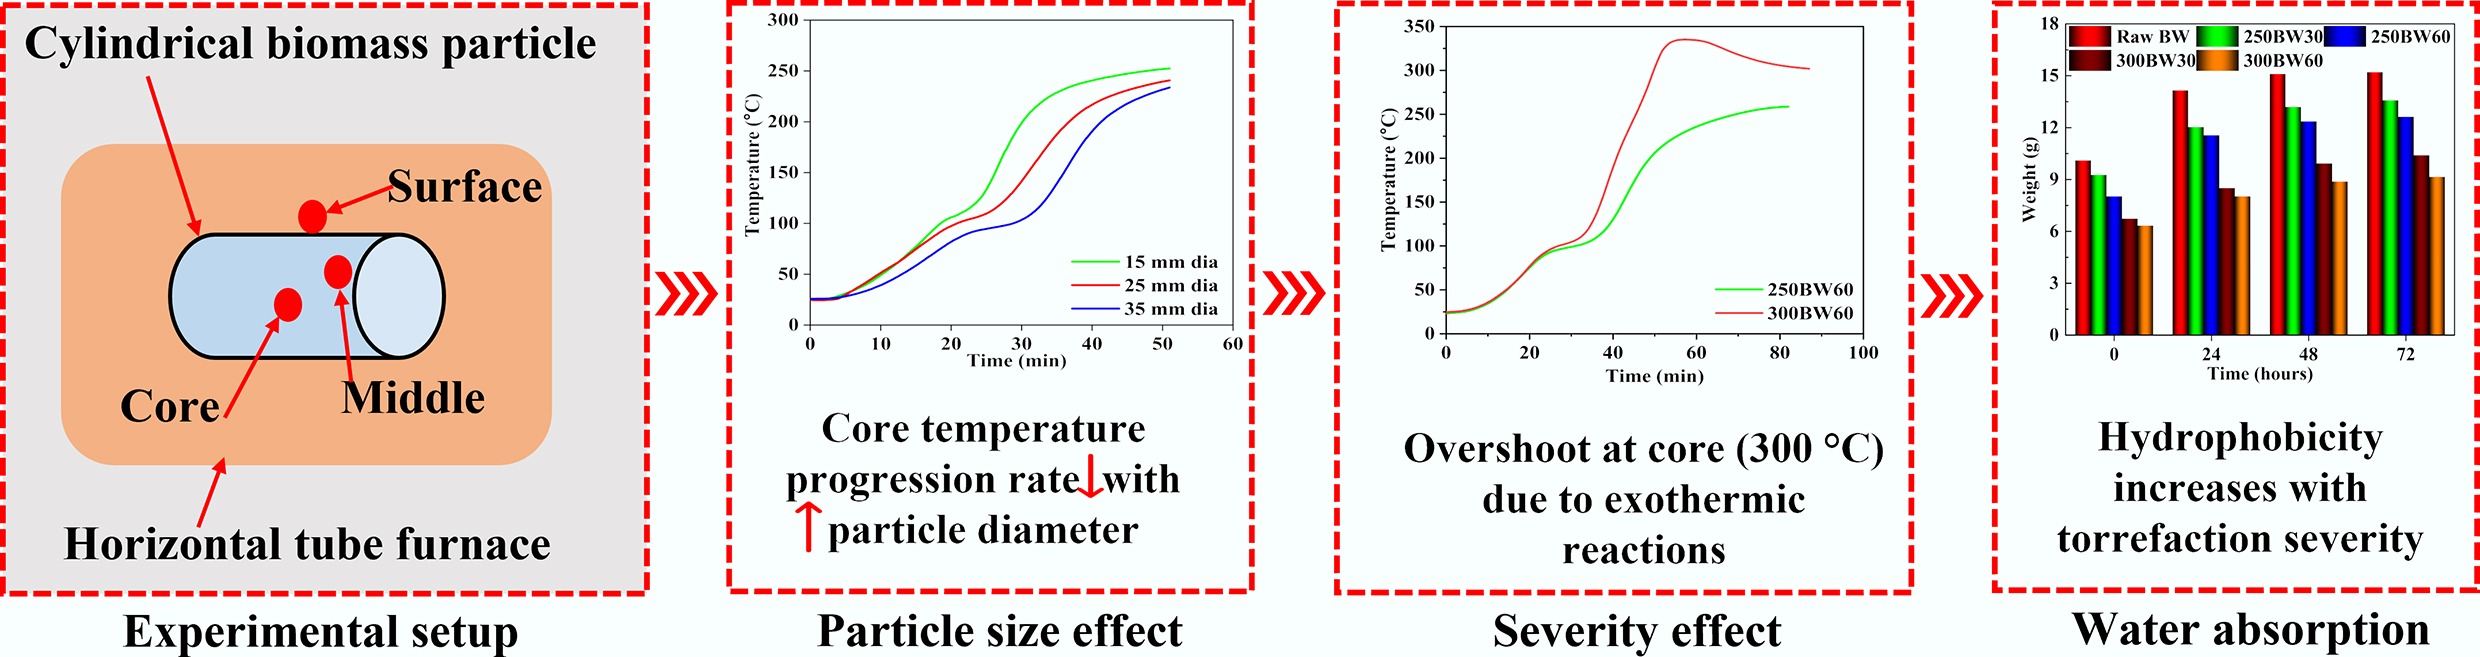
Meanwhile, Fig. 11 clearly illustrates the mechanistic overview of different process conditions and their impact on the temperature progression and water retention characteristics. It can be stated from this mechanistic overview that the torrefaction severity (residence time and temperature) results in enhanced char layer formation with higher temperatures, demonstrating pronounced exothermal reactions in the core of large biomass samples. This study used birchwood as the model feedstock. Therefore, quantitative temperature gradients and overshoot magnitudes may differ for biomasses with substantially different density, permeability, or hemicellulose content. However, the heat- and mass-transfer scaling arguments developed here (e.g., characteristic diffusion times with cylinder radius/length) are general and can be applied to other woody and herbaceous biomasses to anticipate when internal thermal non-uniformity will be significant.
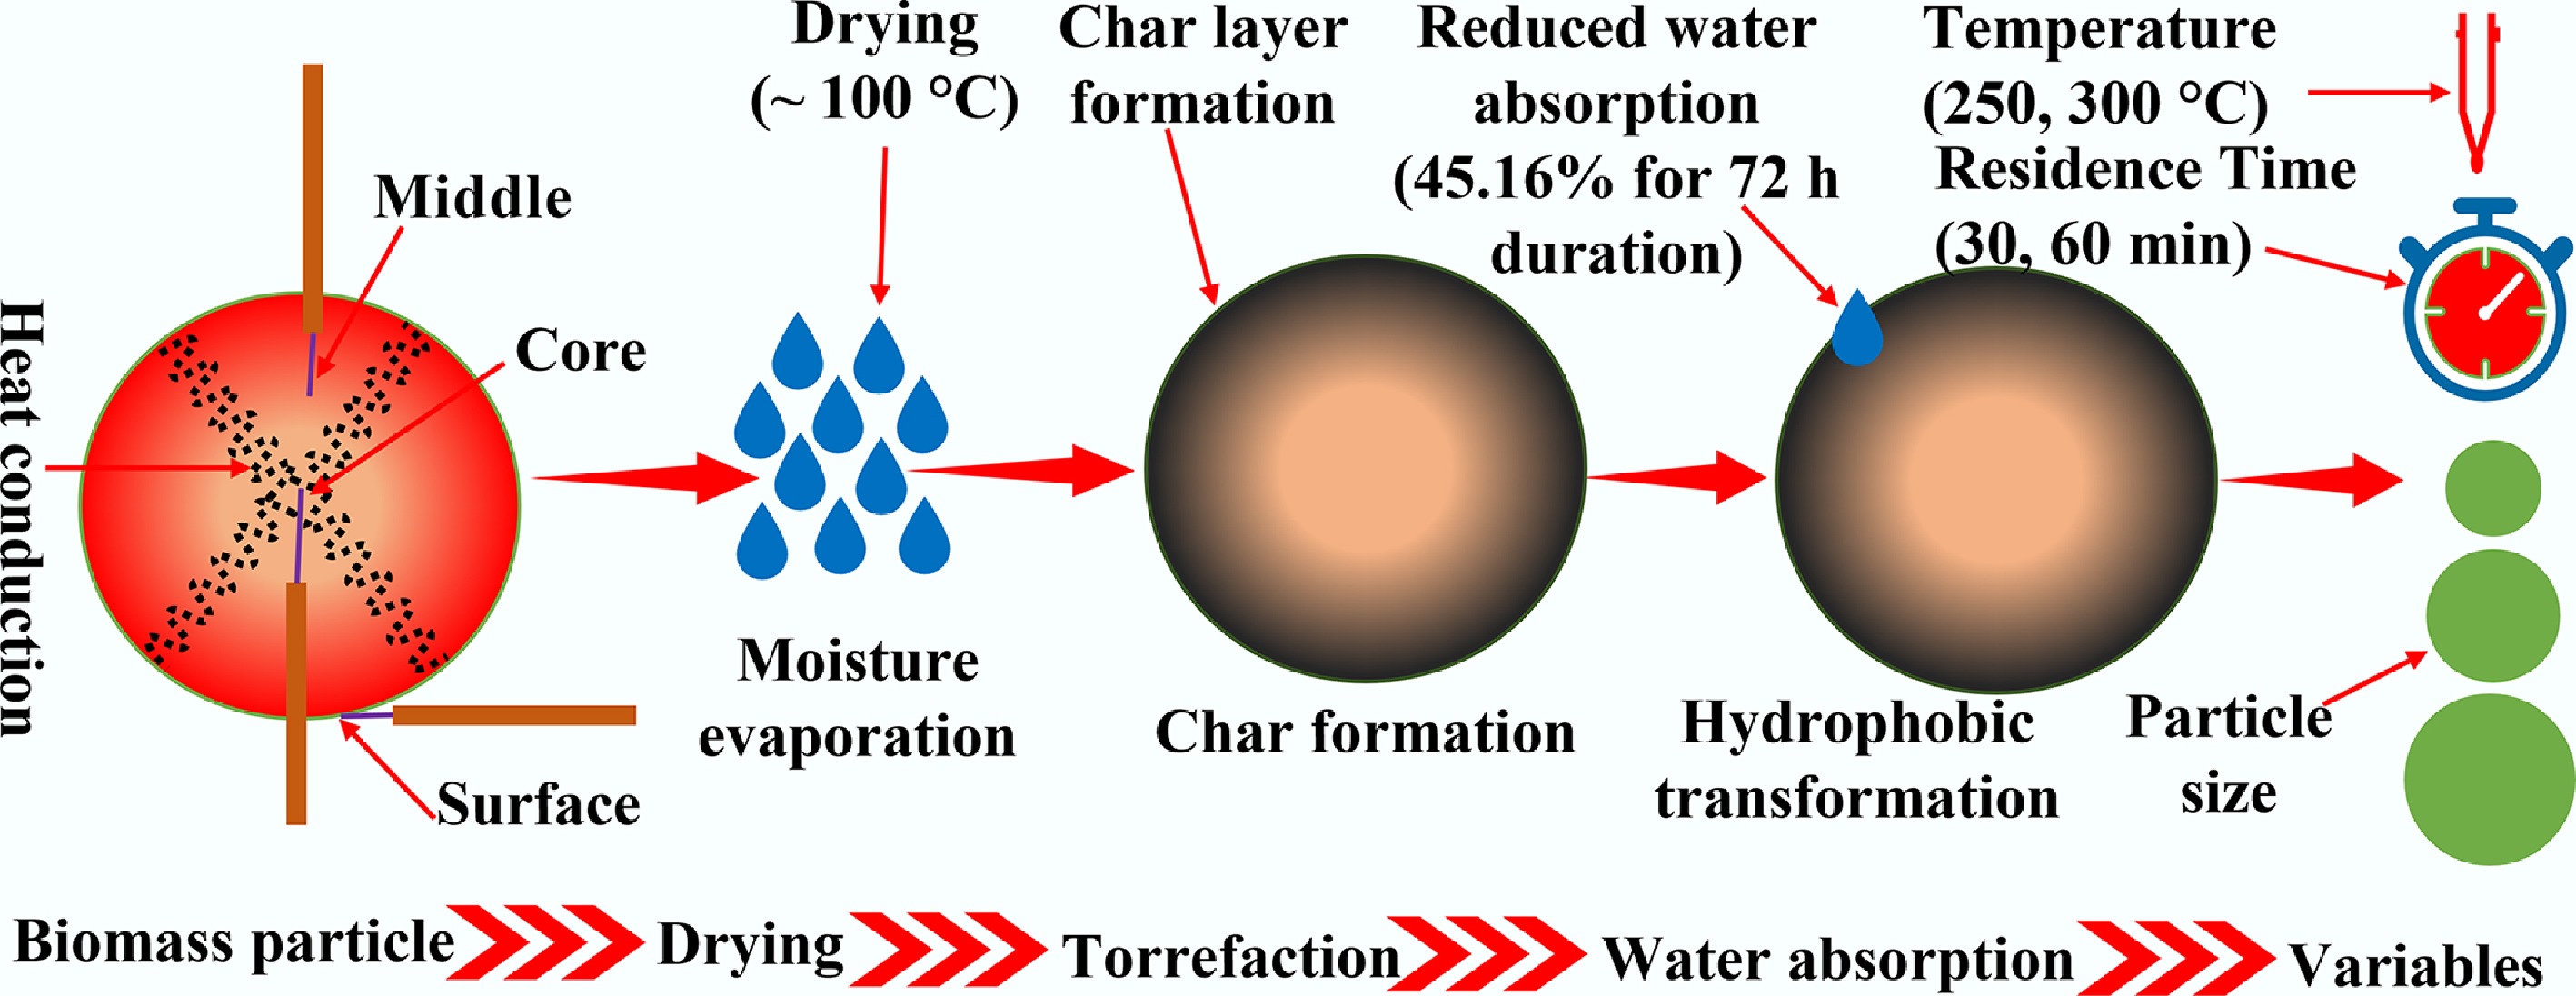
Figure 11.
Schematic of temperature progression in large biomass samples during torrefaction.
-
This work investigated the temperature progression in large birchwood samples during torrefaction experiments conducted at 250 and 300 °C with residence times of 30 and 60 min. To investigate the temperature progression inside the particle, three K-type thermocouples were placed at the surface, middle, and core regions of the samples. Further, to understand the influence of torrefaction severity on the water absorption capacity, the samples were immersed in water and weighed after 24, 48, and 72 h. The results showed that mass yield decreased as torrefaction severity increased and was more influenced by torrefaction temperature than by residence time. Raising the torrefaction temperature increased the rate of temperature rise in all regions. On the other hand, a higher residence time led to improved temperature distribution throughout the samples. Torrefaction temperature showed a more noticeable impact on reducing water retention capacity compared to residence time. Future work should focus on extending the study to a wider range of particle sizes and biomass species, developing a predictive heat transfer model, and evaluating the direct link between intra-particle heat transfer and the quality of downstream products like pellets or fuels.
-
The authors confirm their contributions to the paper as follows: Yogesh Patil: conceptualization, data curation, investigation, formal analysis, visualization, writing − original draft, review and editing, resources; Shri Ram: investigation, writing − review and editing; Vikul Vasudev: conceptualization, visualization, formal analysis, writing − review and editing, supervision. All authors reviewed the results and approved the final version of the manuscript.
-
The data that support the observations of this work would be made available by the corresponding author upon reasonable request.
-
No funds, grants, or other support were received during the preparation of this manuscript.
-
The authors declare that they have no conflict of interest.
-
Full list of author information is available at the end of the article.
- Copyright: © 2026 by the author(s). Published by Maximum Academic Press, Fayetteville, GA. This article is an open access article distributed under Creative Commons Attribution License (CC BY 4.0), visit https://creativecommons.org/licenses/by/4.0/.
-
About this article
Cite this article
Patil Y, Ram S, Vasudev V. 2026. Temperature progressions in cylindrical biomass particles with varying torrefaction severity and geometry. Sustainable Carbon Materials 2: e017 doi: 10.48130/scm-0026-0012 

Temperature progressions in cylindrical biomass particles with varying torrefaction severity and geometry
- Received: 13 December 2025
- Revised: 16 January 2026
- Accepted: 26 January 2026
- Published online: 16 March 2026
Abstract: Torrefaction is a promising thermochemical pretreatment process to enhance the fuel properties of raw biomass. This study systematically investigated the impact of cylindrical sample size and torrefaction severity on the temperature progression at three different locations; namely, the core, middle, and surface, inside large cylindrical birchwood biomass cylinders. Birchwood samples with three different diameters (i.e., 15, 25, and 35 mm) and lengths (30, 40, and 50 mm) were used. The torrefaction experiments were performed at 250 and 300 °C with residence times of 30 and 60 min. Results showed that the temperature progression was more affected by the cylinder diameter than by the length. Increasing the diameter from 15 to 35 mm substantially reduced the core temperature progression rate. Notably, a temperature overshoot of approximately 20–30 °C above the set point was observed at the sample core during 300 °C torrefaction, attributed to exothermic reactions. Furthermore, extending the residence time from 30 to 60 min at 250 °C was necessary for the core to reach the target temperature, promoting a more uniform thermal distribution. In addition, water absorption tests revealed that torrefaction significantly enhances hydrophobicity, with water uptake decreasing marginally as torrefaction severity increases. These findings provide critical insights for optimizing the torrefaction processing of large biomass samples by elucidating the coupled effects of geometry and process parameters on intra-cylinder heat transfer.
-
Key words:
- Biomass /
- Torrefaction /
- Temperature progression /
- Large particles