-
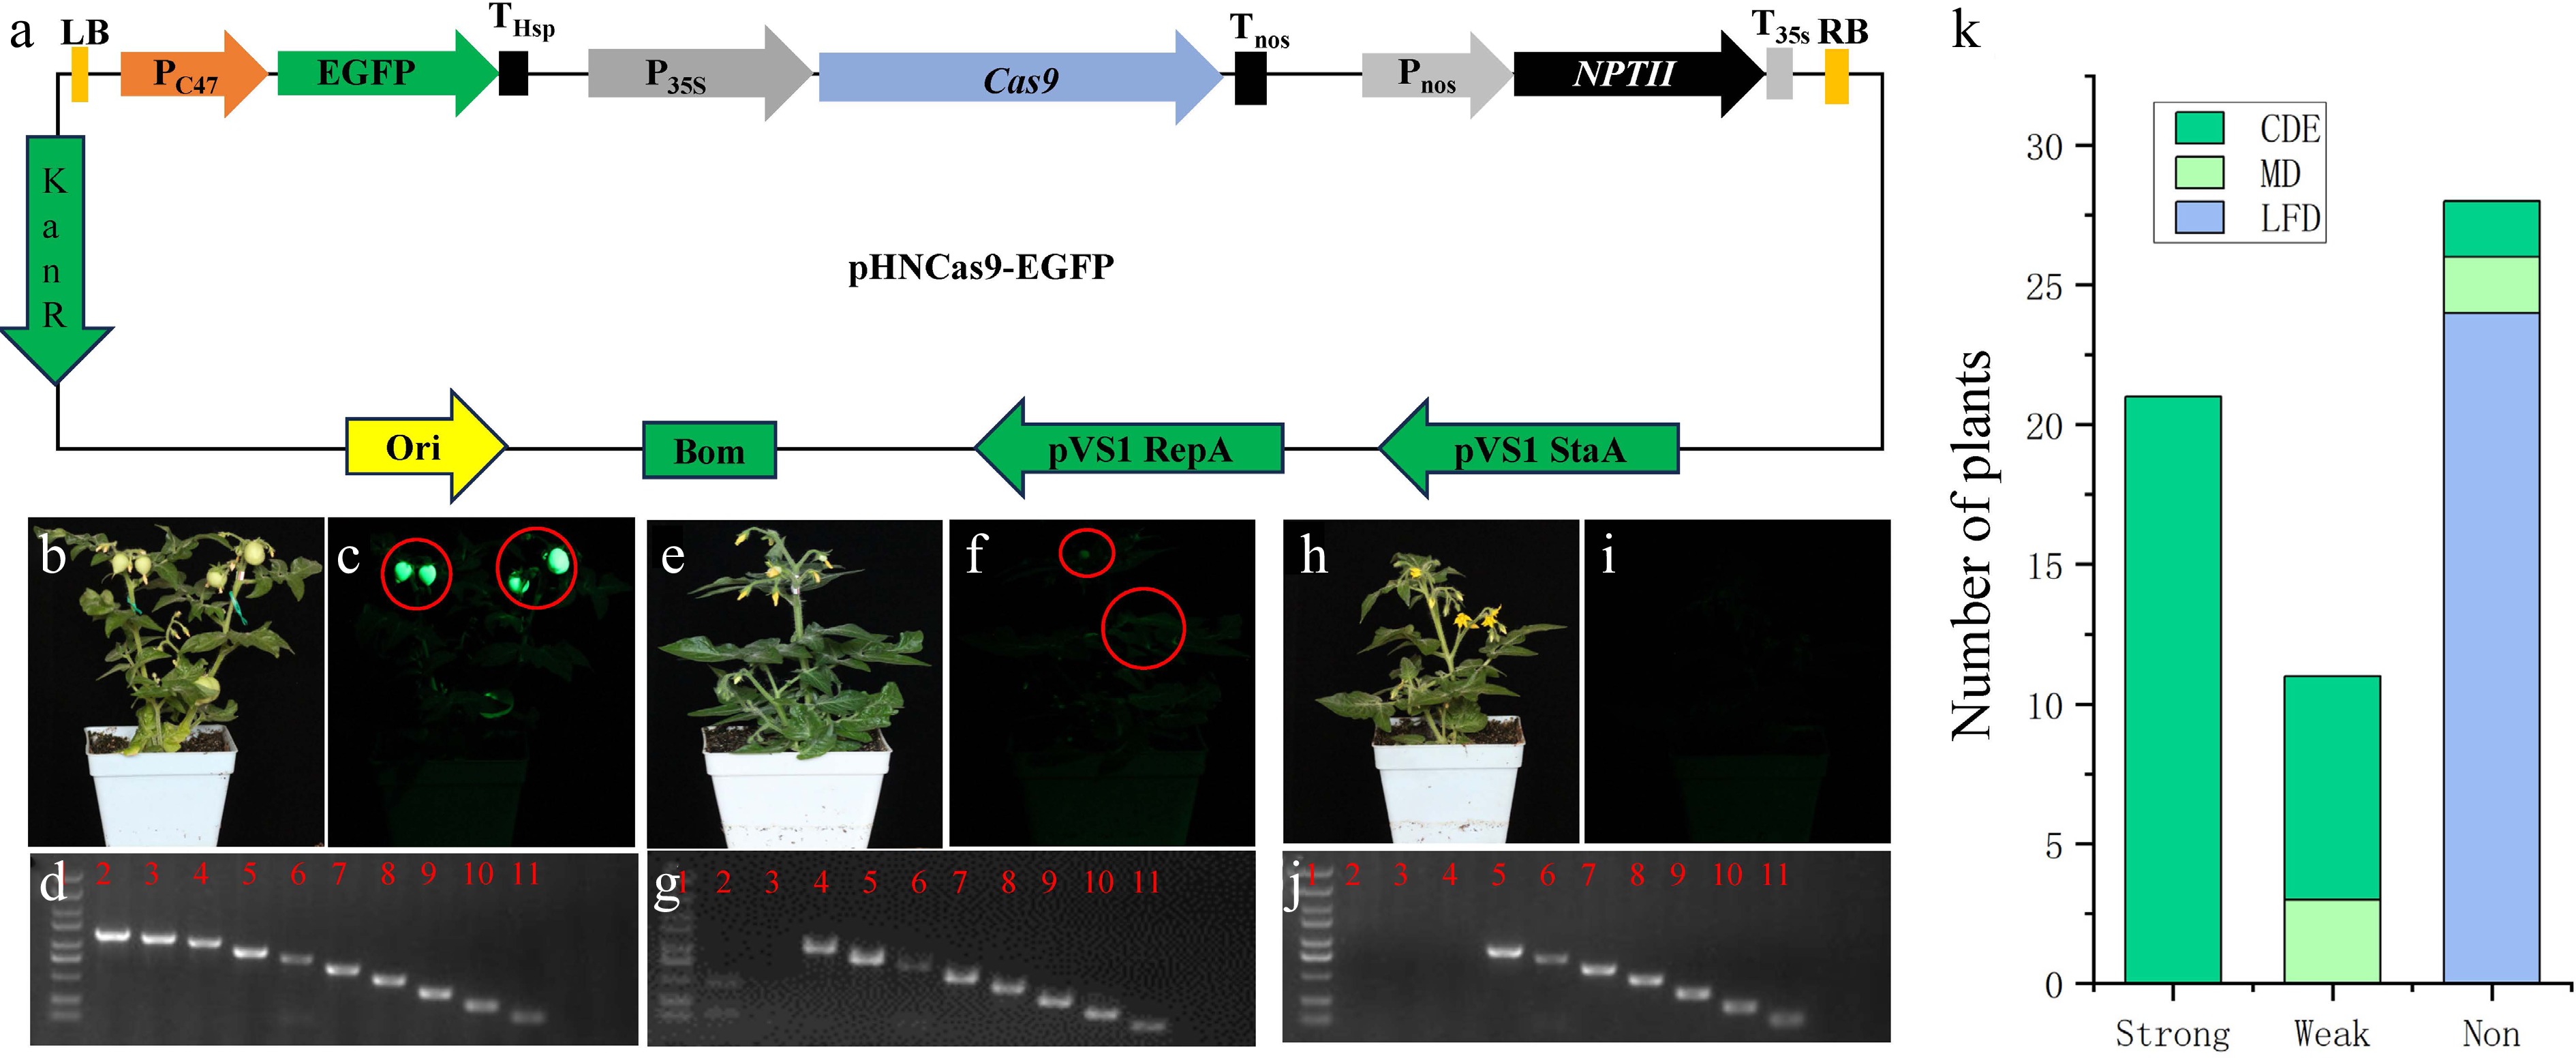
Figure 1.
Detection tools and strategies for T-DNA LB terminal deletion. (a) Schematic diagram of the pHNCas9-EGFP vector's structure. (b) Photograph of a strong fluorescent transgenic tomato plant under white light. (c) Photograph of a strongly fluorescent transgenic tomato plant under excitation with 485-nm blue light. (d) Example of a PCR electrophoresis image of a plant with an intact EGFP expression cassette. Lane 1 is the DNA marker, and Lanes 2 to 11 are the electrophoresis bands of the PCR products from the 10 pairs of primers used to assess the integrity of the EGFP expression cassette. (e) Photograph of a weakly fluorescent transgenic tomato plant under white light. (f) Photograph of a weakly fluorescent transgenic tomato plant under excitation with 485 nm blue light. (g) Example of a PCR electrophoresis image of a plant with a slightly damaged EGFP expression cassette. Lane 1 is the DNA marker, and Lanes 2 to 11 are the electrophoresis bands of the PCR products from the 10 pairs of primers used to assess the integrity of the EGFP expression cassette. (h) Photograph of a nonfluorescent transgenic tomato plant under white light. (i) Photograph of a nonfluorescent transgenic tomato plant under excitation with 485 nm blue light. (j) Example of a PCR electrophoresis image of a plant with a severely damaged EGFP expression cassette. Lane 1 is the DNA marker, and Lanes 2 to 11 are the electrophoresis bands of the PCR products from the 10 pairs of primers used to assess the integrity of the EGFP expression cassette. (k) Statistics of various types of transgenic tomato plants. The photos in (b), (e), and (h) were taken under white light; those in (c), (f), and (i) were taken under EGFP fluorescence. The shutter speed for white light was 1/80 s, and that for fluorescence was 1/10 s. The ISO was set at 3,200, and the aperture value was f/6.3 for both conditions. The EGFP fluorescence photos were taken using an EGFP fluorescent flashlight and a LUV-520 filter (LUYOR). Strong, strong fluorescence; weak, weak fluorescence; non, nonfluorescent; CDE, complete DNA ends; MD, minorly damaged DNA end; LFD, large-fragment DNA damage at the end.
-
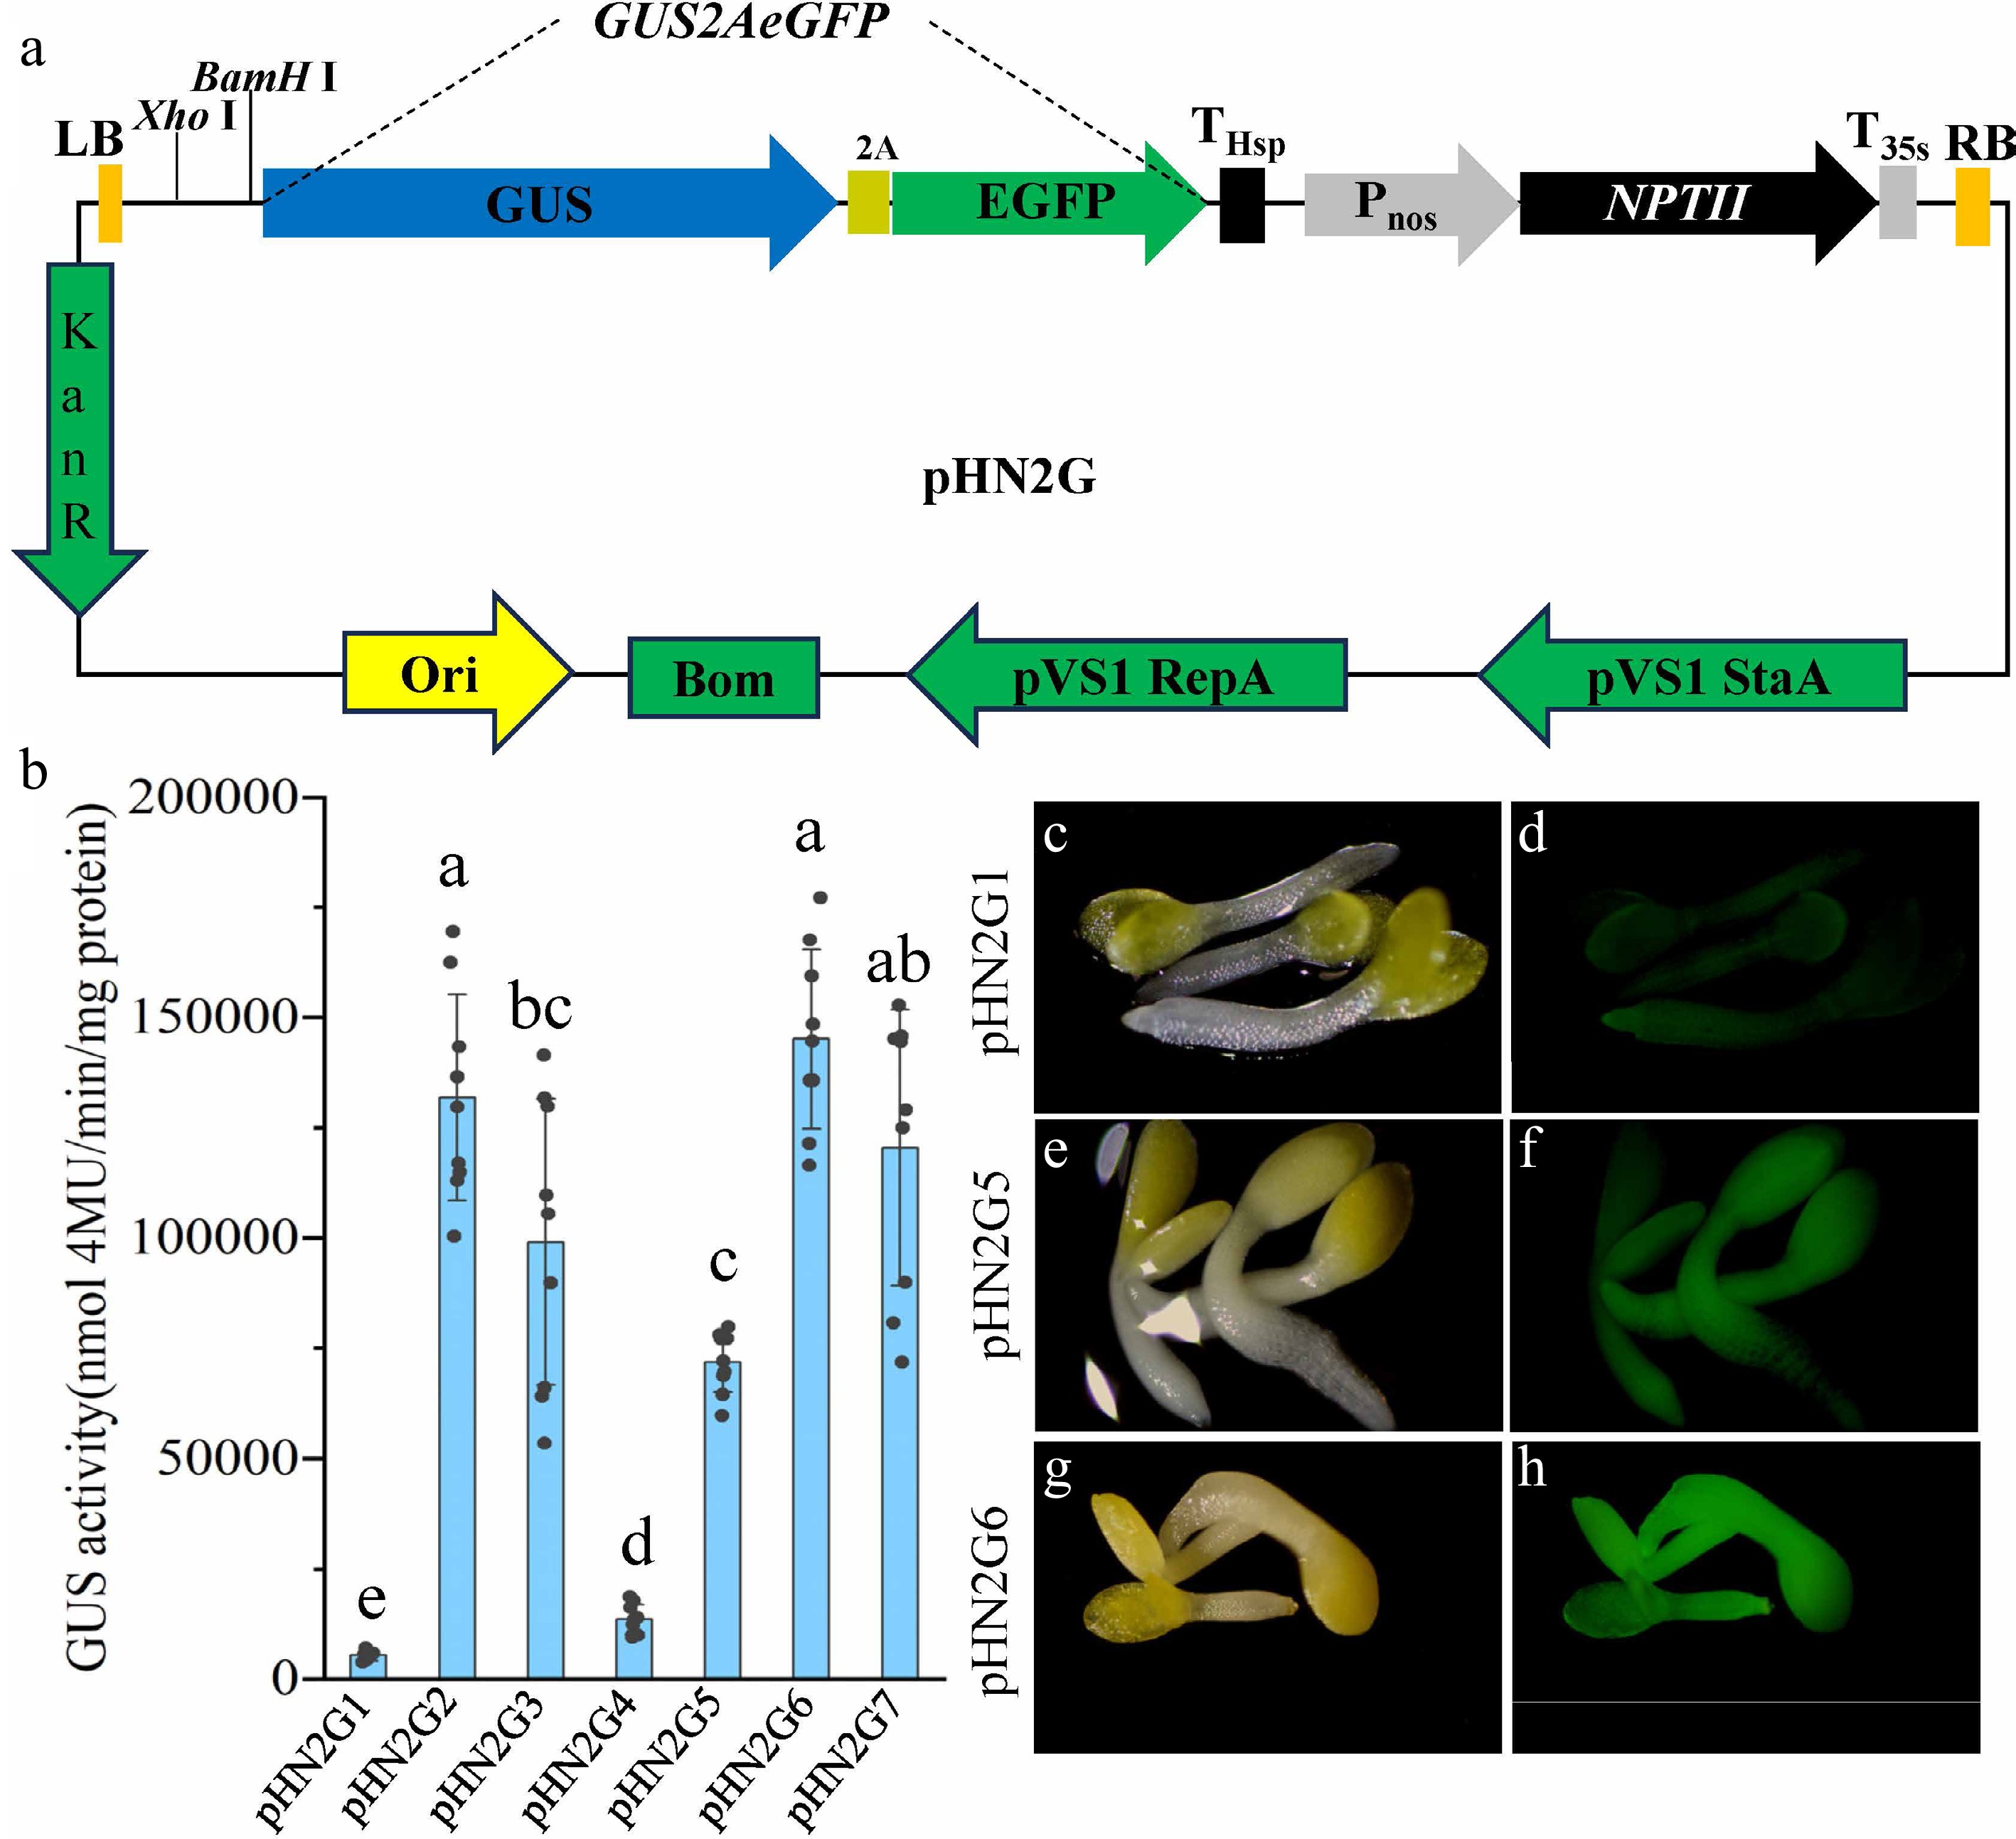
Figure 2.
Tools and strategies for efficient promoter screening. (a) Schematic diagram of the pHN2G vector's structure. (b) Quantitative analysis of GUS enzyme activity resulting from transient expression in tobacco (Nicotiana benthamiana) leaves using pHN2G1 to pHN2G7. Data are the mean ± standard deviation (SD). Different lowercase letters indicate significant differences between groups. (c) Photograph of T2 seedlings of Arabidopsis transformed with pHN2G1 under white light. (d) Photograph of T2 seedlings of Arabidopsis transformed with pHN2G1 under excitation with 485 nm blue light. (e) Photograph of T2 seedlings of Arabidopsis transformed with pHN2G5 under white light. (f) Photograph of T2 seedlings of Arabidopsis transformed with pHN2G5 under excitation with 485 nm blue light. (g) Photograph of T2 seedlings of Arabidopsis transformed with pHN2G6 under white light. (h) Photograph of T2 seedlings of Arabidopsis transformed with pHN2G6 under excitation with 485 nm blue light. The photos in (c), (e), and (g) were taken under white light (exposure 30 ms); those in (d), (f), and (h) were taken under EGFP fluorescence (exposure 80 ms) using a fluorescence microscope, respectively.
-
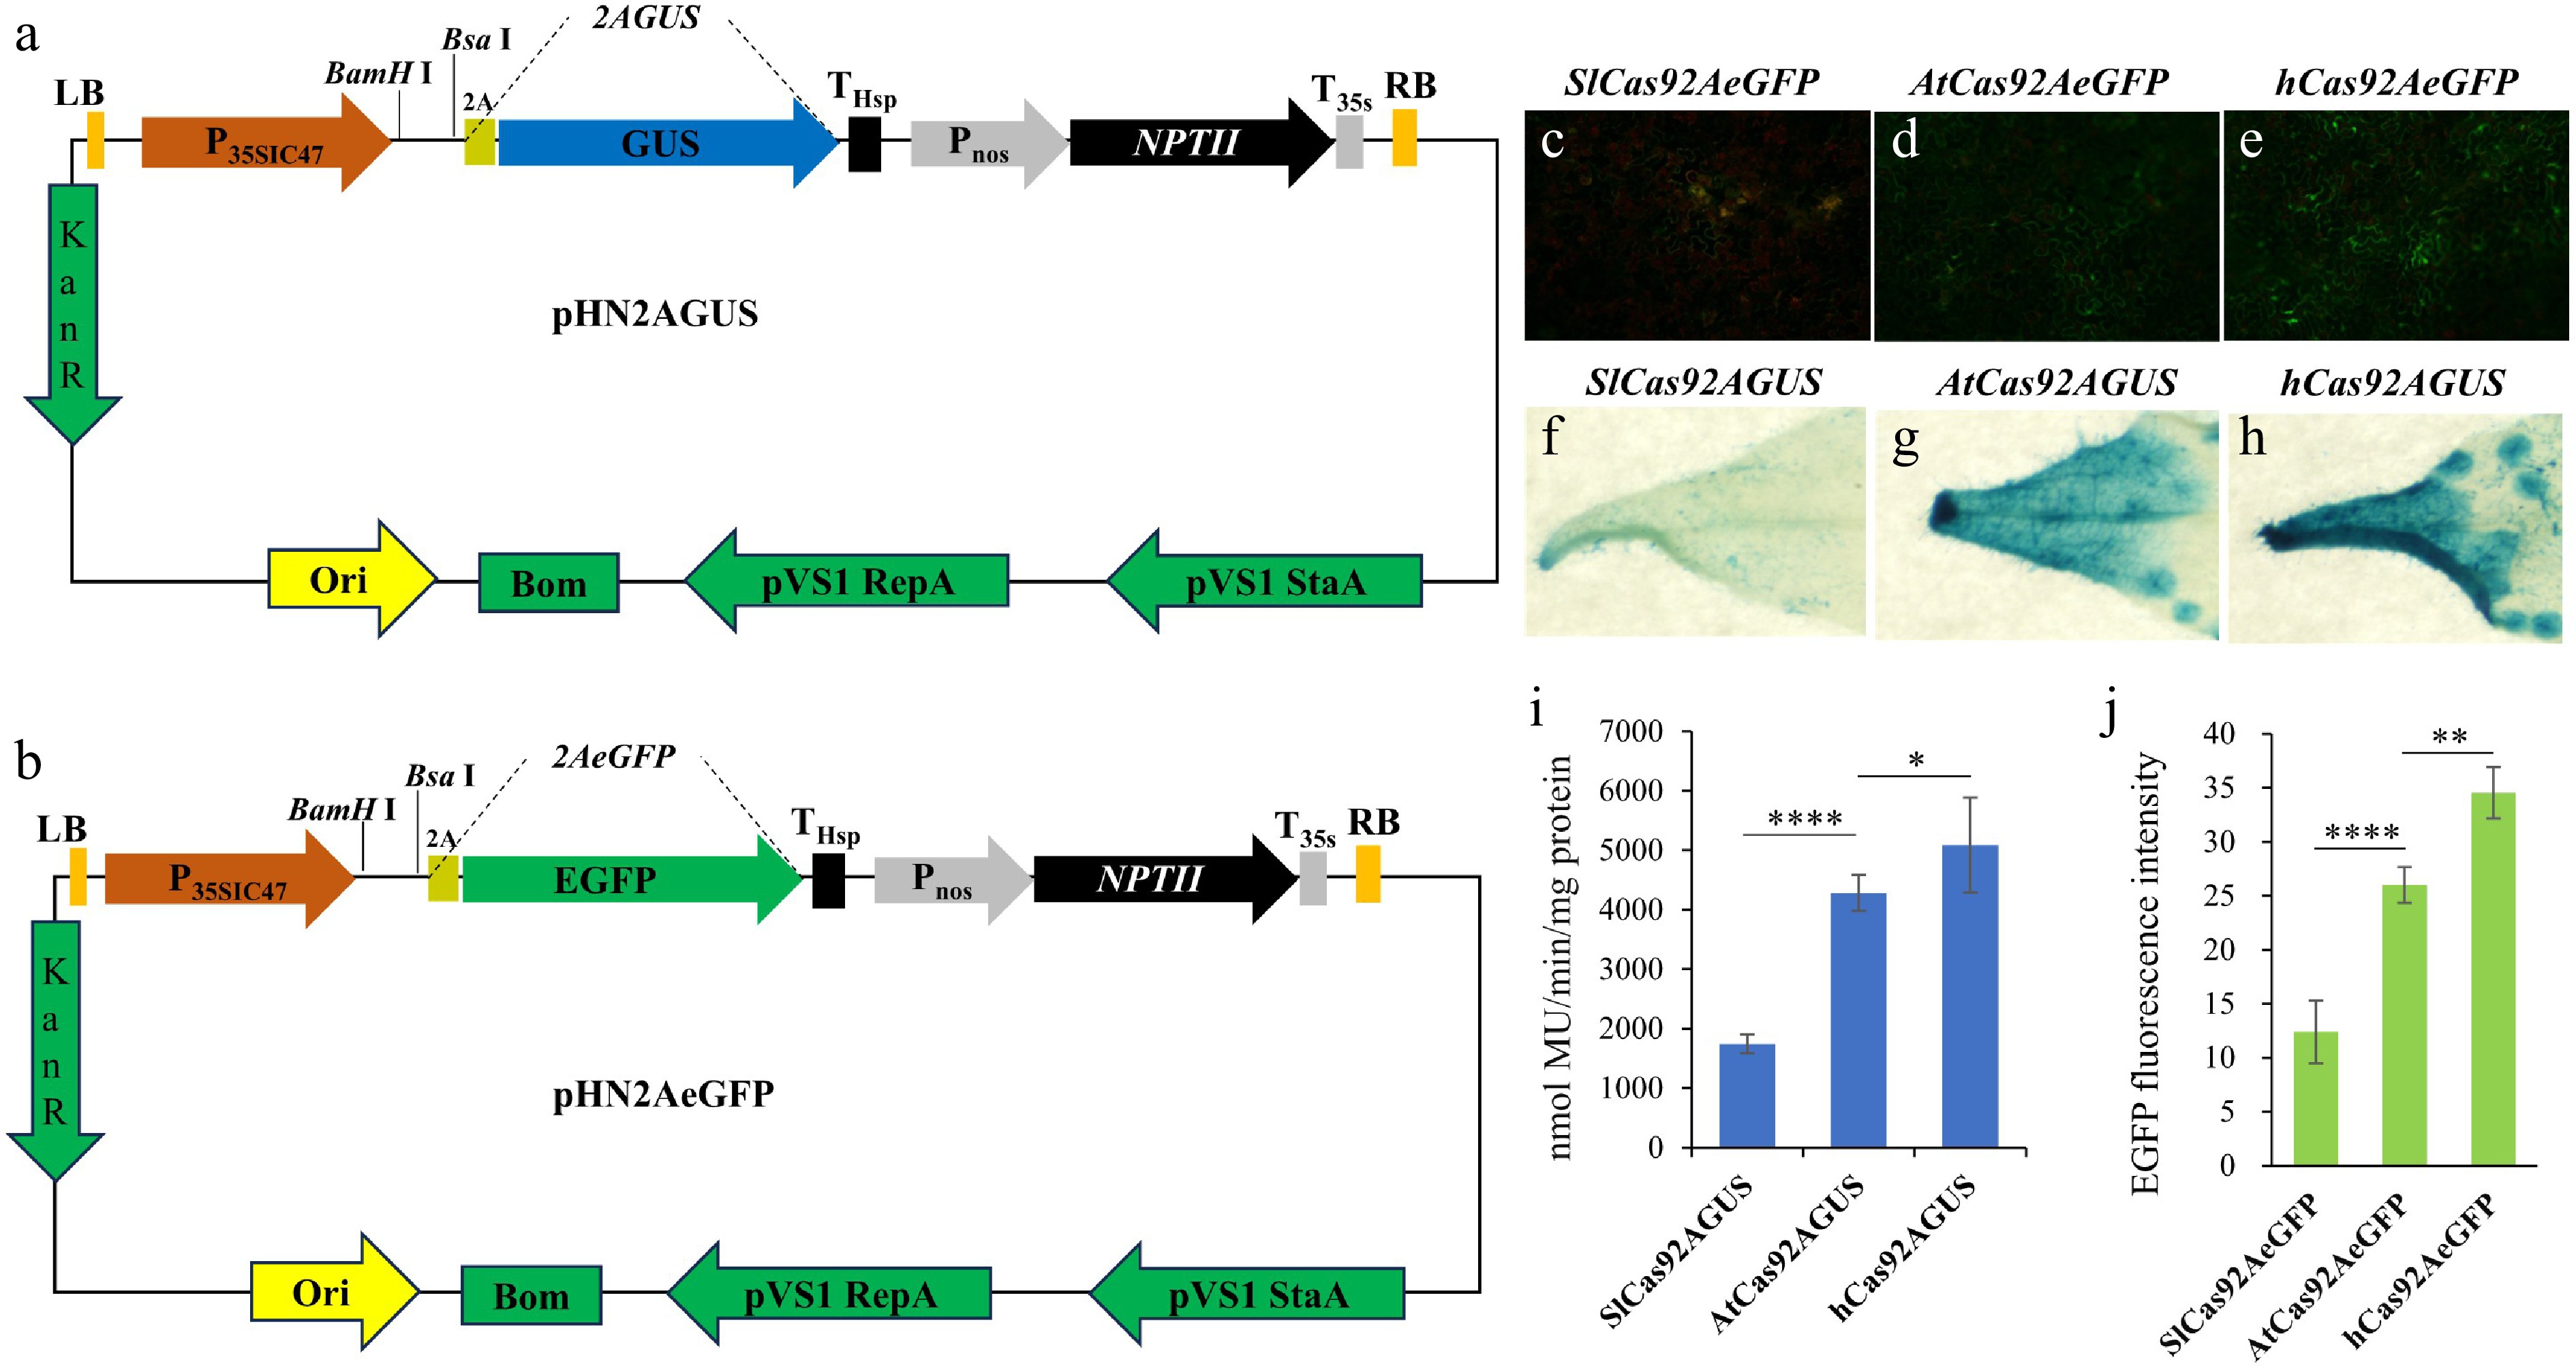
Figure 3.
Tools and strategies for detecting the capacity for protein expression. (a) Schematic diagram of the pHN2AGUS vector structure. (b) Schematic diagram of the pHN2AeGFP vector's structure. (c) Photograph of tobacco leaves transiently expressing the pHN-SlCas92AeGFP vector under excitation with 485 nm blue light. (d) Photograph of tobacco leaves transiently expressing the pHNAtCas92AeGFP vector under excitation with 485 nm blue light. (e) Photograph of tobacco leaves transiently expressing the pHN-hCas92AeGFP vector under excitation with 485 nm blue light. (f) GUS staining image of tobacco leaves transiently expressing the pHN-SlCas92AGUS vector. (g) GUS staining image of tobacco leaves transiently expressing the pHN-AtCas92AGUS vector. (h) GUS staining image of tobacco leaves transiently expressing the pHN-hCas92AGUS vector. (i) Quantitative analysis of GUS enzyme activity in tobacco leaves transiently expressing the pHN-SlCas92AGUS, pHN-AtCas92AGUS, and pHN-hCas92AGUS vectors. (j) Quantitative analysis of EGFP fluorescence intensity in tobacco leaves transiently expressing the pHN-SlCas92eGFP, pHN-AtCas92AeGFP, and pHN-hCas92eGFP vectors. Photos in (c), (d), and (e) were taken under EGFP fluorescence with a fluorescence microscope. The exposure time for SlCas92AEGFP was 1/3s. The exposure time for AtCas92AEGFP and hCas92AEGFP was 1/5s. Note: Data are the mean ± SD. *, p < 0.05; **, p < 0.01; ****, p < 0.0001.
-
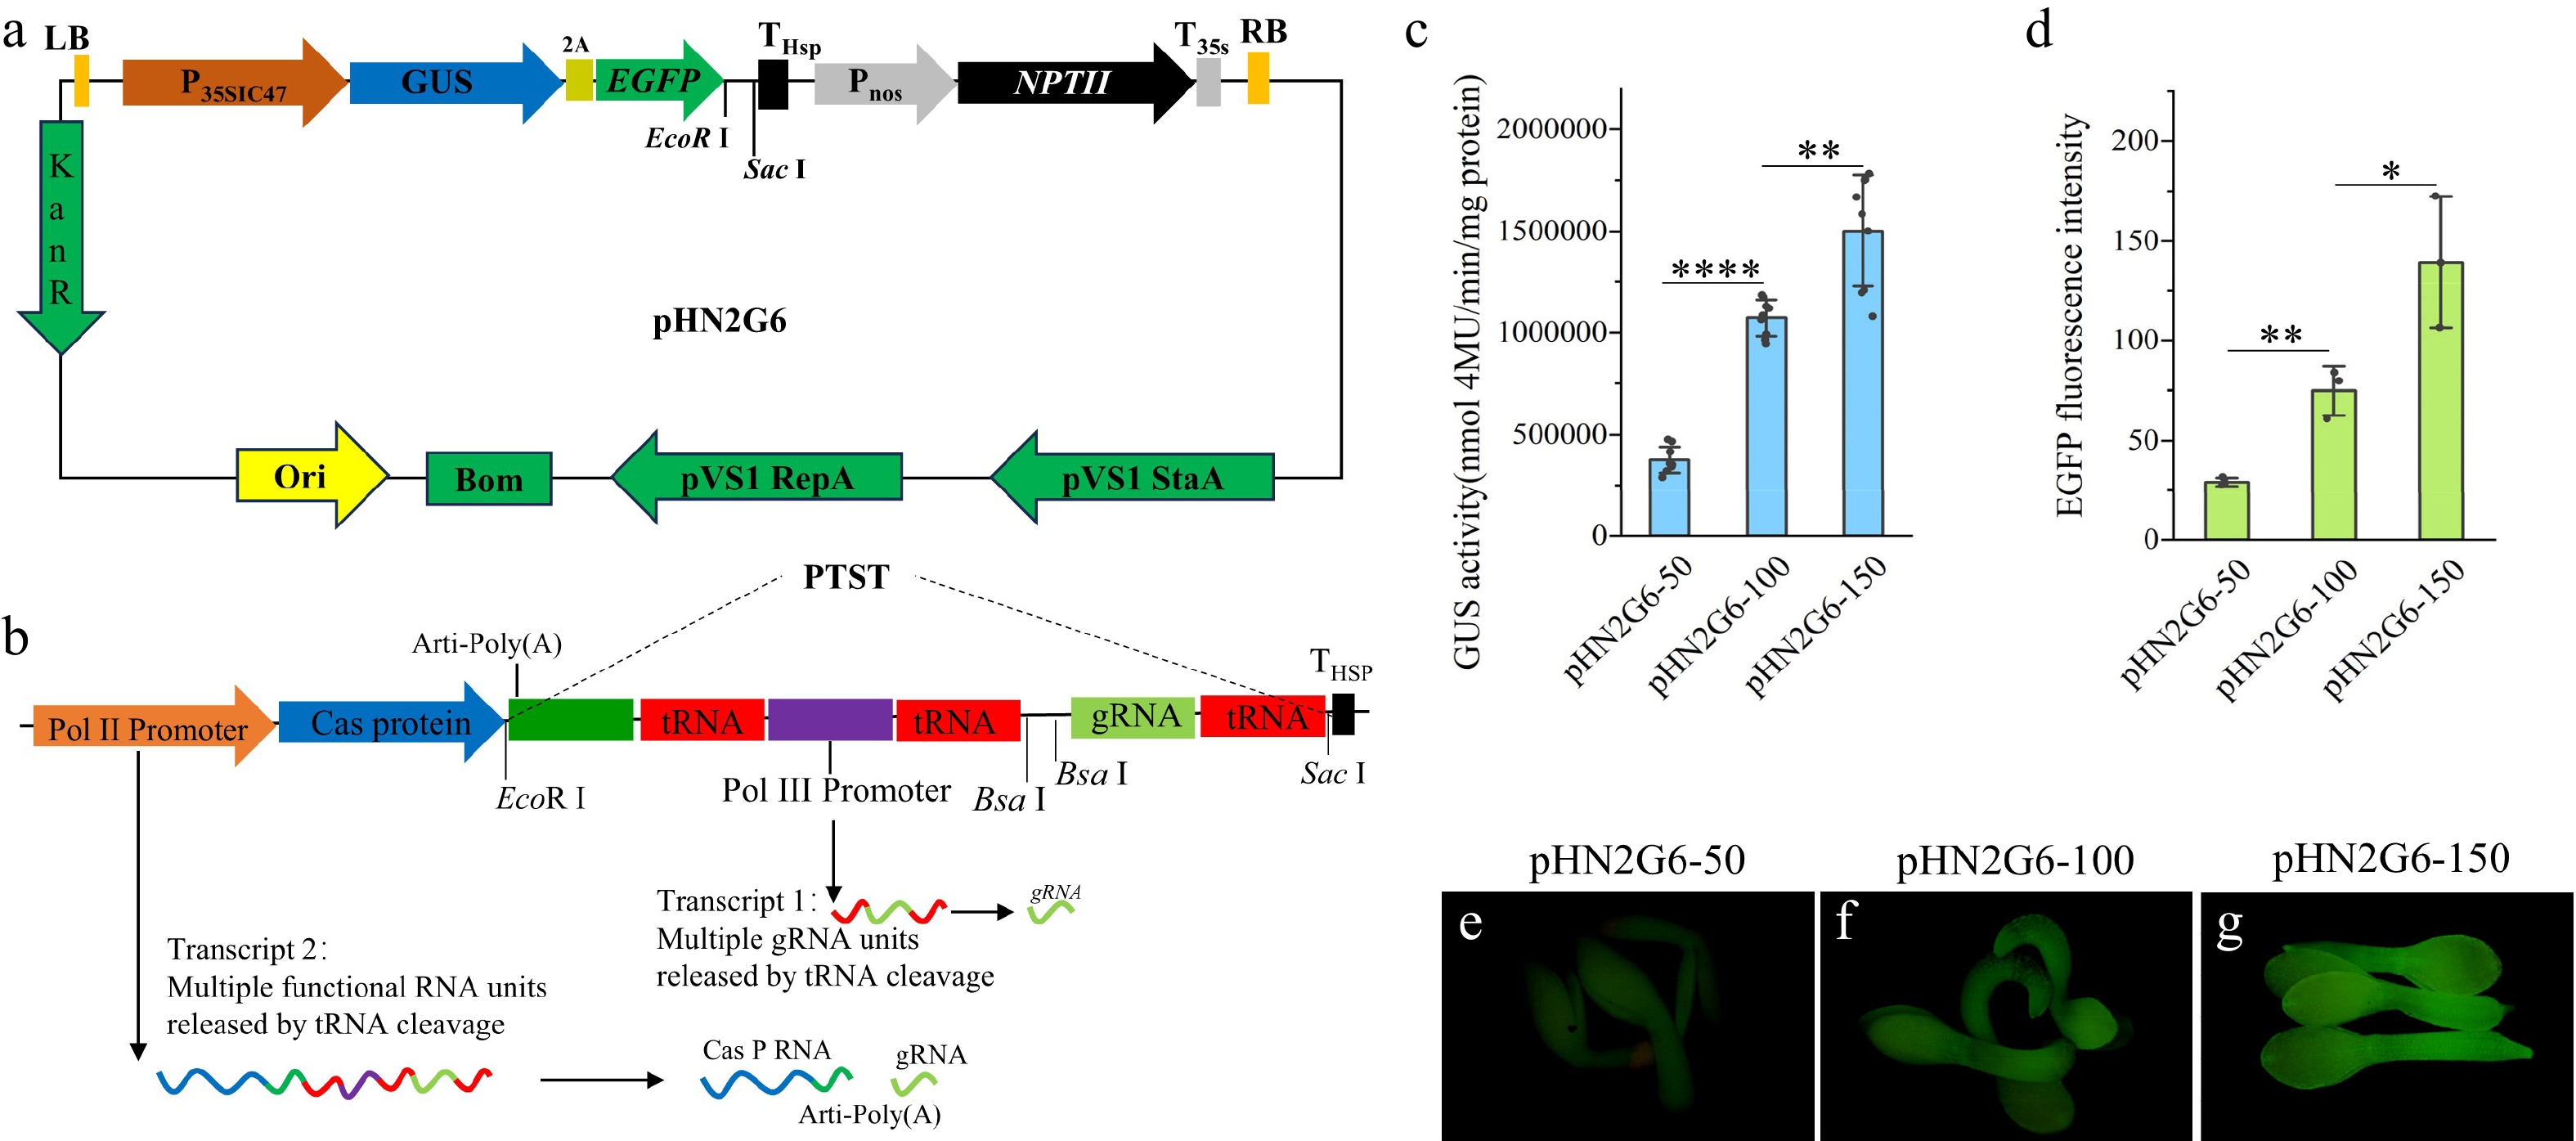
Figure 4.
Tools and strategies for optimizing the structure of a CRISPR/Cas9-based gene editing system (a) Schematic diagram of the pHN2G6 vector's structure. (b) Schematic diagram of the PTST sequence's structure. (c) Quantitative analysis of GUS enzyme activity in tobacco leaves transiently expressing the pHN2G6-50, pHN2G6-100, and pHN2G6-150 vectors. (d) Analysis of the optical density of EGFP fluorescence in T2 seedlings of Arabidopsis transformed with the pHN2G6-50, pHN2G6-100, and pHN2G6-150 vectors. (e) Photograph of T2 seedlings of Arabidopsis transformed with pHN2G6-50 under excitation with 485 nm blue light. (f) Photograph of T2 seedlings of Arabidopsis transformed with pHN2G6-100 under excitation with 485 nm blue light. (g) Photograph of T2 seedlings of Arabidopsis transformed with pHN2G6-150 under excitation with 485 nm blue light. The photos in (e), (f), and (g) were taken under EGFP fluorescence with a fluorescence microscope. The exposure time was 100 ms. Note: Data are the mean ± SD. * p < 0.05; ** p < 0.01; **** p < 0.0001.
Figures
(4)
Tables
(0)